

Abstract
Genes involved in distinct diabetes types suggest shared disease mechanisms. Here, we show that ONECUT1 mutations cause monogenic recessive syndromic diabetes in two unrelated patients, characterized by intrauterine growth retardation, pancreas hypoplasia and gallbladder agenesis/hypoplasia, and early-onset diabetes in heterozygous relatives. Heterozygous carriers of rare coding variants define a distinctive subgroup of diabetic patients with early-onset, non-autoimmune diabetes, who respond well to diabetes treatment. In addition, common regulatory ONECUT1 variants are associated with multifactorial T2D. Directed differentiation of human pluripotent stem cells revealed that loss of ONECUT1 impairs pancreatic progenitor formation and a subsequent endocrine program. Its loss altered transcription factor binding, enhancer activity and NKX2.2/NKX6.1 expression in progenitors. Collectively, ONECUT1 controls a transcriptional and epigenetic machinery regulating endocrine development, involved in a spectrum of diabetes, monogenic recessive/dominant, and multifactorial. Our findings highlight the broad implication of ONECUT1 in diabetes pathogenesis, marking an important step toward precision diabetes medicine.
Introduction
Diabetes affects over 350 million people worldwide1, and type 2 diabetes (T2D) is the most common form, with a mainly multifactorial etiology. Monogenic diabetes accounts for 1–5% of cases, with a higher prevalence in early-onset patients2,3. The discovery and study of genes responsible for monogenic entities provide important insights for understanding disease mechanisms, allowing cost-effective care and improved quality of life due to gene adjusted treatment4. While major progress has been achieved to identify these genes, the rarity and clinical heterogeneity of monogenic cases makes the identification of novel causative genes increasingly difficult. This is particularly challenging for cases who are not clinically atypical and are thus generally diagnosed as T2D. In the last decade, large-scale genome-wide association studies (GWAS) have identified many common variants associated with T2D5. The identification of monogenic contribution to T2D using whole exome (WES) and whole genome sequencing (WGS) has been rather limited so far, despite increasingly large scale of these studies5,6. This highlights the need for complementary strategies to increase the power of these studies. Several genes are shared between monogenic diabetes and multifactorial T2D, suggesting shared disease mechanisms. Remarkably, many of these genes encode key proteins for pancreas development (e.g. HNF1A, HNF1B, HNF4A and GLIS3). Human pluripotent stem cells (PSCs) represent a powerful tool to simulate pancreatic development and facilitate disease modeling7–9.
Here, starting with the study of a consanguineous family presenting cases of neonatal syndromic diabetes and T2D, we used a staged approach combining genetic and in-depth functional studies and identified ONECUT1/HNF6 as a novel gene involved in monogenic recessive and dominant as well as multifactorial diabetes. Using genome-edited human embryonic stem cells (ESCs) and patient-specific induced pluripotent stem cells (iPSCs), we dissected the functional consequences of defective ONECUT1 protein in pancreatic development.
Results
A patient with severe neonatal syndromic diabetes
We studied a French boy (Patient-1) born to consanguineous parents, affected by severe neonatal syndromic diabetes following intrauterine growth retardation (IUGR), with pancreatic, hepatic, neurologic and hematologic manifestations (Table 1; Extended Data Fig. 1a-d10). IUGR was diagnosed at 33 weeks of pregnancy, with hydramnios and fetal abnormalities. Delivery was achieved by cesarean section at 37 weeks of gestation. Weight and height at birth were <1st percentile. Diabetes was noted at the first day of life (day 1), with blood glucose at 17 mmol/l, then above 25 mmol/l with glycosuria from day 15. Plasma insulin and C-peptide measured at day 18 were undetectable. Insulin treatment was started at day 21, with high doses increased up to 2.3 units/kg per day. Conversely, serum glucagon was elevated. Exocrine pancreatic insufficiency (EPI) was documented by very low fecal chymotrypsin and elastase levels. Imaging showed severe pancreatic hypotrophy and lack of gallbladder. The patient also suffered from poorly regenerative anemia, requiring blood transfusions from day 1. Signs of cholestasis were also noted, with elevated total plasma bilirubin, and hepatocellular insufficiency with low levels of various plasma components produced by the liver. He also presented with facial dysmorphism with microretrognathia and morphological abnormalities of the extremities. Ultrasound imaging of the heart, kidneys, and brain showed no anomaly. The clinical course was poor, with no weight gain despite tube feeding. He also showed diffuse hypotonia, limited mobility and reactivity, edema of lower limbs, moderate jaundice with hepatomegaly, as well as neuromuscular respiratory distress most likely related to central nervous system impairment. Because of the very severe neurological condition, brain magnetic resonance imaging was performed at day 59, showing no abnormalities. The patient died at 60 days postpartum.
Table 1.
Clinical, metabolic, biochemical and radiological features of Patient-1 (Family-1) and Patient-2 (Family-2)
| Characteristics | Patient-1 (Family-1) | Patient-2 (Family-2) | Reference values |
|---|---|---|---|
| Gender | Male | Male | |
| Ethnicity | French* | Turkish | |
| Consanguinity | Yes | Yes | |
| Age at diabetes onset | 1 day | 14 months | |
| Anthropometric measurements at birth | |||
| Gestational age (weeks) | 37 | 38 | |
| Weight - g (percentile) | 1540 (<1) | 2660 (10) | |
| Length - cm (percentile) | 42 (<1) | 52 (93) | |
| Head circumference - cm (percentile) | 31 (2.6) | 32 (5) | |
| Growth | IUGR during pregnancy, 33rd week, with hydramnios and fetal abnormalities (dilated bowel loops, closed fists); small for gestational age without catch-up growth by 60 days (death) | IUGR during pregnancy, 33rd week; neonatal hypotrophy; postnatal failure to thrive | |
| Glucose metabolism and diabetes | |||
| Autoantibodies | ND | Negative (ICA, GAD, IA2) | |
| Fasting glucose - mmol/l | 13.3a | ND | <5.6 |
| Fasting insulin - mIU/l | Undetectable | Undetectable | 2–20 |
| Plasma C-peptide, fasting - pmol/l | Undetectable | Undetectable | 0.25–1.70 |
| Plasma glucagon, fasting - ng/l | 638 | ND | 50–250 |
| Random glucose - mmol/l | 17.5–28a | 15.9a | <11.1 |
| Diabetes treatment | Insulin; very unstable | Insulin; very unstable | |
| Exocrine pancreas | |||
| Fecal chymotrypsin (stools) - U/g | 0.1 | ND | >8 |
| Fecal elastase (stools) - mg/g | 23 | ND | >100 |
| Treatment | Tube feeding | Initially untreated, then oral pancreatic enzymes | |
| Hematology | |||
| Hemoglobin - g/l | 64** | 106 | 120–160 |
| Hepatology | |||
| Plasma bilirubin - μmol/l | 275 | ND | <200 |
| HDL cholesterol - mmol/l | 0.52 | ND | 1.05–1.80 |
| Esterified cholesterol - mmol/l | 0.19 | ND | 2.8–4.5 |
| Apolipoprotein A1 - g/l | 0.22 | ND | 1.20–1.80 |
| Total proteins - g/l | 35 | ND | 51–73 |
| Albumin - g/l | 24 | ND | 27–41 |
| Coagulation factor II - % | 20 | ND | 45–105 |
| Coagulation factor VII - % | 18 | ND | 48–132 |
| Fibrinogen - g/l | 0.5 | ND | 1.5–3.8 |
| Additional clinical and morphological abnormalities | |||
| Morphological | Microretrognathism; contracture of the fingers and toes, lack of extension of the elbows; prominent heel bone and a convexly rounded sole | NR | |
| Neurological | Flexion contracture of fingers, toes, and elbows; axial hypotonia; limited spontaneous mobility and reactivity; respiratory distress | NR | |
| Abdominal imaging | Very hypoplastic pancreas (head measuring 2 x 6mm2, body and tail not visualized); hepatomegaly; absence of gallbladder | Very hypoplastic pancreas, gallbladder present but small | |
| Other manifestations | Edema of lower limbs; hydrocoele; moderate jaundice | NR | |
Notes: Biochemical explorations were performed between birth and age 45 days (Patient-1) and at diabetes onset (14 months, Patient-2).
Family-1 is from a French traveler community, a minority group with a strong tradition of consanguineous marriages. Ancestry analysis confirmed their mainly French European origin (Extended Data Fig. 1a,b; Methods).
Hemoglobin value at day 1; Patient-1 was treated by blood transfusions from day 1, then by recombinant human erythropoietin from day 7. Following this treatment, hemoglobin increased to levels between 100 and 110 g/l.
Diabetes range
ND: not done; NR: not reported.
Patient-1’s mother (subject 2) had a total of seven pregnancies, two of which were terminated by spontaneous miscarriages and one complicated by hydatidiform mole. During pregnancy, she suffered from gestational diabetes, requiring insulin therapy from the 29th week of gestation. Additional metabolic explorations, including oral glucose tolerance test (OGTT), were performed in the parents of Patient-1 (subjects 1 and 2, Supplementary Table 1). Clinical examination of the mother (at age 40) was unremarkable apart from overweight (body mass index (BMI)=28.1). She did not follow any special treatment. She had impaired fasting glucose (IFG) and high HbA1c level, and OGTT demonstrated abnormal glucose tolerance and overt diabetes, while her plasma insulin level remained low. Her 30 min incremental insulin to glucose levels during OGTT (insulinogenic index) was very low, suggesting impaired β-cell function (Supplementary Table 1). Diet and exercise resulted in significant weight loss (BMI=26 at age 41) and almost normal fasting glucose level (5.8 mmol/l). However, diabetes persisted (HbA1c=6.2%) and Metformin treatment was initiated. In contrast, the father was not diabetic at 38 years, albeit his fasting insulin level was just below normal. In both parents, GAD, IA2 and human insulin autoantibodies were negative. Based on normal levels for serum lipase, vitamins A, D, E and K, IGF1, bilirubin, lipids, and total proteins, there was no evidence for exocrine pancreas or liver dysfunction. Accordingly, ultrasonography of the pancreas, liver, gallbladder and biliary ducts was normal. Overall, these observations suggest impaired glucose metabolism in Patient-1’s parents.
Homozygous ONECUT1 mutations cause neonatal syndromic diabetes
The familial context suggested a rare autosomal recessive inheritance. To identify the disease-causing gene, we performed linkage analysis combined with candidate genes selection (Fig. 1a). Nine homozygous regions (3.90% autosomes length) were linkage-compatible under a fully penetrant recessive model. Based on the extreme clinical presentation of the patient, affecting exocrine and endocrine pancreas as well as gallbladder development, we selected genes specifically involved in early endoderm development as candidates (8 genes)11–13. The intersection of linkage regions and these candidates identified a single gene, One Cut Homeobox 1 (ONECUT1)/Hepatocyte Nuclear Factor 6 (HNF6) (Fig. 1a), whose knockout mice recapitulate the patient’s phenotype14–16. We sequenced ONECUT1 exons in all family members and identified a protein-truncating variant (PTV), ONECUT1-p.E231X (chr15.hg19:g.53081391C>A) homozygous in the patient, heterozygous in the parents and heterozygous or homozygous wildtype in healthy siblings (Fig. 1b; Extended Data Fig. 1d). The resulting protein lacks the CUT and HOMEOBOX domains responsible for DNA binding to target genes17. Subsequent WES of this patient confirmed ONECUT1 as the only gene compatible with his rare recessive syndrome (data not shown). Independently, in a second patient (Patient-2, Turkish), born to consanguineous parents, diagnosed at 14 months with insulin-requiring diabetes, EPI and growth retardation, we identified a homozygous missense variant ONECUT1-p.E231D (chr15.hg19:g.53081389C>G) through targeted candidate genes sequencing (Fig. 1b; Extended Data Fig. 1e). The patient had IUGR associated with neonatal hypotrophy and postnatal failure to thrive, as well as mild anemia. Imaging revealed hypotrophic pancreas and gallbladder, supporting a similar but less severe phenotype than Patient-1 (Table 1). Both ONECUT1 variants were absent in available public databases (Supplementary Table 4a). Hence, biallelic ONECUT1 mutations cause a novel syndrome characterized by neonatal/very early-onset insulin-requiring diabetes with exocrine pancreas insufficiency and other manifestations. Remarkably, Patient-1 and Patient-2’s mothers, and another ONECUT1-p.E231X heterozygous diabetic woman married to a relative (Family-1, subject 18), had repeated miscarriages and/or neonatal child mortality, suggesting that homozygous ONECUT1 mutations are generally lethal or result in early mortality (Fig. 1c,d).
Figure 1: ONECUT1 mutations cause severe neonatal syndromic diabetes and early-onset diabetes.
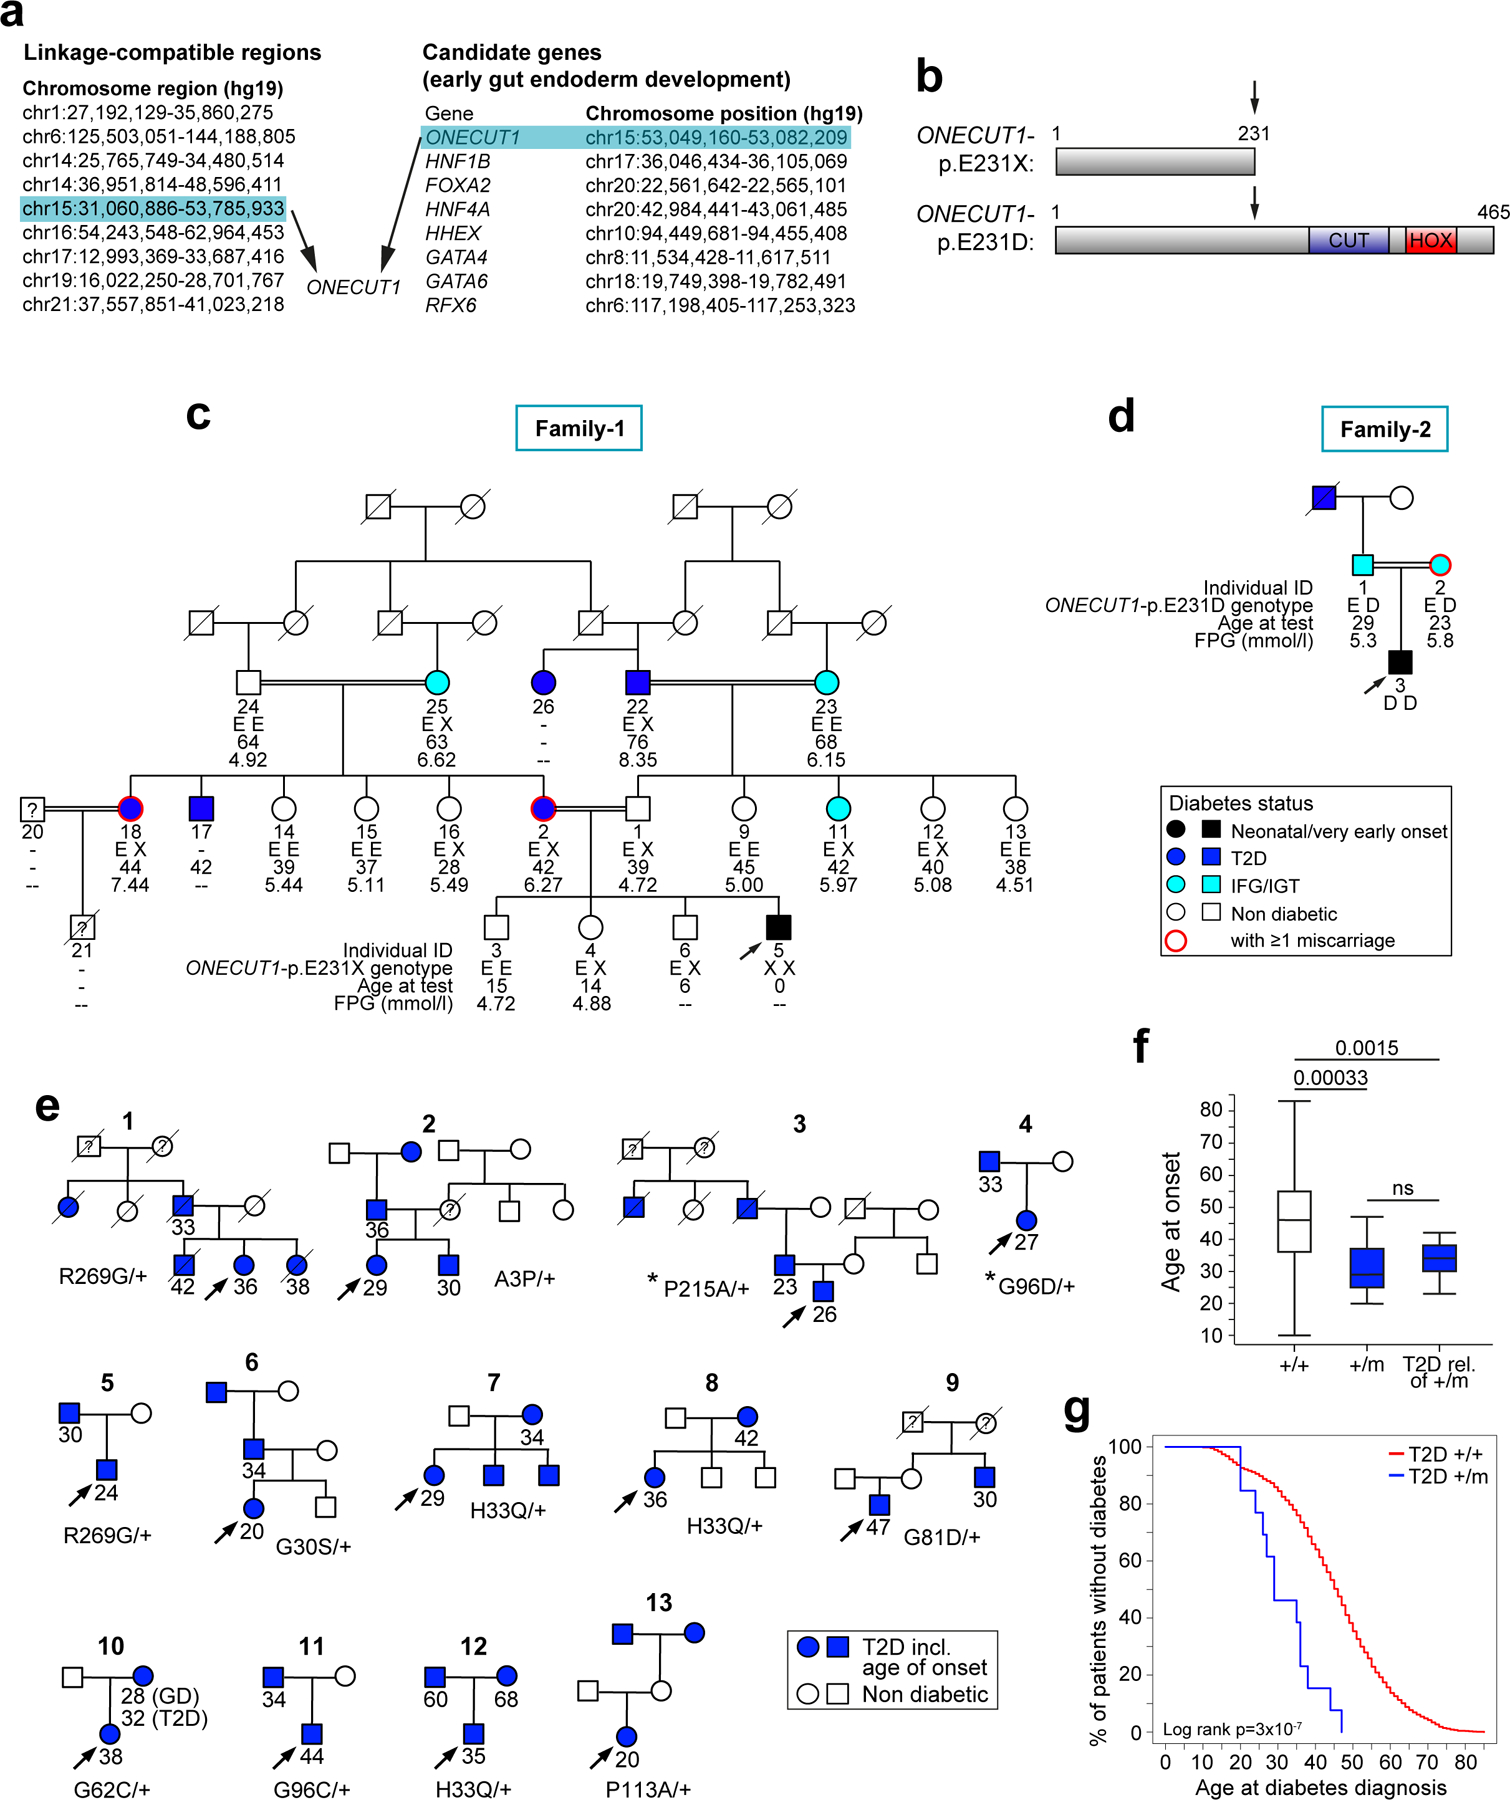
(a) Gene identification in Patient-1 using a combined linkage study and selection of candidate genes associated with early gut endoderm development. (b) Schematic protein representation of ONECUT1 mutations: truncated ONECUT1 protein lacking the CUT and homeobox (HOX) DNA binding domains and homozygous missense mutation p.E231D. (c) Extended family tree of Patient-1 (Family-1) showed a high prevalence of T2D or impaired fasting glucose (IFG, light blue) in heterozygous carriers of the ONECUT1-p.E231X variant. Subject 6, sibling of Patient-1 (subject 5), was recruited during the course of the study and did not have neonatal diabetes. Subject 21 died at the age of 1 day from unknown causes. Her diabetic mother (subject 18) also had gestational diabetes and repeated miscarriages. FPG: Fasting plasma glucose. (d) Family tree of Patient-2 (Family-2) showed a high prevalence of T2D and IFG/IGT in parents and grandparents. The father had impaired glucose tolerance (IGT). (e) Family trees of the 13 diabetic patients (UDC-T2D cohort) identified with rare missense ONECUT1 variants suggesting dominant inheritance. Genotypes of these patients at rare ONECUT1 variants and age at diabetes diagnosis are shown. Two of the 13 index cases, indicated by stars (*), were also heterozygous for the low-frequency ONECUT1-p.P75A variant. The mother of patient 11 also suffered from gestational diabetes (GD) at the age of 28 years. Arrows within the family trees indicate the genotyped index patients. (f) Age at diagnosis of UCD-T2D diabetic patients carrying rare missense ONECUT1 variants (+/m) and relatives of patients with rare missense ONECUT1 variants (T2D rel. of +/m) compared to T2D non-carriers (+/+). Boxplots show the median, interquartile range and extreme values. P-values were calculated using non-parametric Wilcoxon rank test. not significant (ns). (g) Kaplan-Meier survival curve analysis of age at onset of diabetes depending on the presence (+/m) or absence (+/+) of rare missense variants in the 2165 UDC-T2D cases.
Heterozygous carriers of ONECUT1-p.E231X and ONECUT1-p.E231D have increased risk of adult-onset diabetes
Family history of T2D reported in both families suggested that heterozygous carriers for these mutations may be predisposed to adult-onset diabetes. To investigate this hypothesis, we extended the clinical and genetic study of Family-1 (Patient-1, Fig. 1c). Five of the seven ONECUT1-p.E231X carriers aged 30 to 76 had diabetes or impaired fasting glucose (IFG). We modelled the transmission of diabetes (neonatal diabetes and diabetes/IFG) with respect to ONECUT1-p.E231X in this family, confirming complete penetrance in homozygotes (neonatal diabetes) and incomplete penetrance estimated to 0.63 in heterozygotes (diabetes/IFG) (P=0.003), and showing cosegregation of diabetes with ONECUT1-p.E231X under this model (LOD score=2.35, P=0.0005). There was evidence of increased risk of diabetes/IFG in ONECUT1-p.E231X carriers compared to non-carriers when adjusting for the age at examination (logistic regression, 1-sided P=6×10⁻⁵). Accordingly, the prevalence of diabetes/IFG in ONECUT1-p.E231X carriers was increased compared to the French general population18 (P=0.0049). Similarly, Patient-2’s parents, heterozygous for ONECUT1-p.E231D, had IFG or impaired glucose tolerance (IGT), while the non-genotyped grandfather was diabetic (Fig. 1d). Similar to Patient-1’s mother and subject 18 (Family-1), Patient-2’s mother had gestational diabetes, with an unusually early start at week 14 of pregnancy, requiring insulin therapy from week 21. More detailed explorations of six heterozygous ONECUT1-p.E231X and ONECUT1-pE231D subjects including OGTT in the parents support that they have altered glucose metabolism, resulting in IFG, IGT or diabetes (Supplementary Table 1).
Rare ONECUT1 missense variants are associated with diabetes at the population level
In order to investigate the contribution of ONECUT1 coding variants to diabetes, we sequenced the coding region of ONECUT1 in a Ulm (Germany) Diabetes Cohort (UDC; Methods), including 2165 diabetic patients with non-autoimmune diabetes (UDC-T2D thereafter, with T2D considered in a broad sense), including a large proportion of patients with early-onset diabetes (age at diagnosis: 10–85 years, 25% diagnosed before age 35, GAD negative, Supplementary Table 2), 397 non-diabetic controls and 162 T1D/latent autoimmune diabetes in adult (LADA) patients. Patients carrying known maturity-onset diabetes of the young (MODY) gene mutations have been previously excluded from this cohort (Methods). We identified 13 T2D patients heterozygous for rare ONECUT1 missense variants (minor allele frequency [MAF]<0.005 in the representative gnomAD North-West Europe (NWE) population) and none in the non-diabetic controls and in T1D/LADA (Fig. 1e; Supplementary Tables 3a,4b; 1-sided Fisher exact test P=0.05 comparing T2D patients to non-T2D subjects). In contrast, rare synonymous variants were equally frequent in T2D and non-T2D, as expected (Supplementary Tables 3a,4c). We also observed one low-frequency missense variant, ONECUT1-p.P75A (rs74805019, MAF=0.03 in gnomAD-NWE), which was neither associated with T2D risk in the UDC (Supplementary Table 3b) nor in other cohorts including DIAMANTE5, and in previous studies19,20. For replication purpose, we performed burden testing for ONECUT1 coding variants in the AMP-T2D-GENES cohort (19852 T2D cases, 23273 controls). This showed an overall trend for increased T2D risk (collapsing burden test, odds ratio (OR)=1.14,P=0.08), reaching significance in the European population in line with our findings (OR=1.31,P=0.002; Supplementary Table 5). Strongest T2D association was obtained in analyses allowing variable risks or frequency thresholds [P(SKAT)=0.00026; P(variable threshold test)=0.005)], suggesting heterogeneity in risks between variants. Indeed, association trends were observed for the less rare variant p.H33Q (MAF(cases)=0.002,OR=5.0,P=0.079), as well as several very rare variants: p.G30S (18/5 cases/controls), p.G62C (3/0 cases/control, absent from gnomAD), and p.V242A, an Asian-specific variant (MAF[gnomAD-East-Asian]=0.014, OR=1.42,P=0.023). In contrast, p.G96D shows a protective trend or neutral effect (AMP-T2D-GENES: MAF(cases)=0.0006,OR=0.34,P=0.011; DIAMANTE5: OR=0.81,P=0.40; Supplementary Table 6). Noteworthy, UDC-T2D Subject-4, a p.G96D carrier, was also heterozygous for the low-frequency p.P75A (compound heterozygous p.G96D-rare/p.P75A-low-frequency variants), suggesting an additive risk effect of these variants or a modifier effect of p.P75A on diabetes risk. These findings support that rare ONECUT1 missense variants are overall associated with increased risk of T2D at the population level, although some of these variants may be neutral or even protective. Furthermore, they strongly suggest that a subset of missense variants, predicted to be the most deleterious, may be associated with higher risk of diabetes, similar to PTVs.
Heterozygous carriers for rare ONECUT1 coding variants define a distinctive subgroup of patients with early-onset diabetes
The 13 ONECUT1-heterozygous UDC-T2D patients had an earlier age at diagnosis than non-carriers (median[IQR]=29[25–37] vs. 46[36–55]; P=0.00033; Fig. 1f), responded well to the initial diabetes treatment and had family histories compatible with dominant transmission (Table 2; Fig. 1e). The age at diagnosis of T2D relatives was similar to the probands (median[IQR]=34[30–38] vs. 46[36–55]; P=0.37), and different from non-carriers (P=0.0015; Fig.1f). Kaplan-Meier analysis showed that heterozygous carriers had younger age at diagnosis compared to non-carriers (P=3.0×10⁻⁷; Fig. 1g), with a hazard ratio for the median age at diagnosis of 3.75[2.17–6.48] (P=2.3×10⁻⁶). WES performed in these 13 patients confirmed the absence of known MODY gene mutations (11 MODY genes: HNF1A, HNF1B, HNF4A, GCK, ABCC8, PDX1, INS, PAX4, KCNJ11, NEUROD1 and RFX6; all variants predicted to be benign, likely benign or of unknown significance; data not shown). We also determined HLA-DR risk and the T1D-genetic risk score (T1D-GRS) in these patients, confirming that these patients were overall similar to T2D/control subjects and different from T1D, and we excluded the presence of the mitochondrial m.3243A>G mutation (Table 2). Independently, we identified a heterozygous missense variant, ONECUT1-p.P215R, by WES in a Lebanese boy suffering from insulin-treated juvenile-onset non-autoimmune diabetes (onset at 12 years) (Supplementary Table 4d). This variant was absent in the parents and in all public databases, while high-density SNP genotyping confirmed family relationships, supporting that it is a diabetes-causing de novo mutation.
Table 2.
Clinical characteristics of diabetic subjects from the UDC-T2D cohort heterozygous for rare missense ONECUT1 variants
| Patient code | ONECUT1 variant | Gender | Age at onset | Age at recruitment | BMI at onset | BMI at recruitment | GAD at recruitment | C-peptide at onset (mg/ml) | Treatment at onset | Response to treatment (initial 18 months) | HbA1c at initial follow-up | Age at onset of T2D relatives | PPV for MODY | HLA-DR genotype | 10-SNPs T1D-GRS (centile of a reference T1D population) |
|---|---|---|---|---|---|---|---|---|---|---|---|---|---|---|---|
| 1 | R269G | Female | 36 | 67 | 30.1 | 30.1 | ND | Positive*** | Sulfonylurea + metformin | Good; average fasting glucose: 7.8 mmol/l | NA | NA, 33, 42, 38 | NA | DR3/X | 0.606 (<25) |
| 2 | A3P | Female | 29 | 30 | 20.5 | 20.5 | 0 | ND | OAD | Excellent | 6.4% after 3 years | NA, 36, 30 | 62.4% | DRB1*15/X | 0.383 (<25) |
| 3 | P215A* | Male | 26 | 26 | 30.1 | 30.1 | 0 | ND | Diet + exercise | Good; no postprandial glucose levels above 7.8 mmol/l, fasting 4.4–5.6 mmol/l | 5.6% after 2 years | NA, NA, 23 | 62.4% | DR3/DRB1*15 | 0.4511 (<25) |
| 4 | G96D** | Female | 27 | 27 | 23.3 | 23.3 | 0 | ND | Diet + exercise | Excellent | 6.2% after 4 years | 33 | 75.5% | DR3/X | 0.666 (25–50) |
| 5 | R269G | Male | 24 | 34 | ND | 23.1 | 0 | ND | Diet + exercise, low dose insulin at bedtime | Excellent | 6.0% after 5 years | 30 | 49.4% | DR3/DR3 | 0.741 (>50) |
| 6 | G30S | Female | 20 | 20 | 29.9 | 29.9 | 0 | Positive | Sulfonylurea | Excellent | 6.1% after 18 months | NA, 34 | 75.5% | X/X | 0.533 (<25) |
| 7 | H33Q | Female | 29 | 57 | ND | 37.3 | ND | ND | Metformin | Good; average blood glucose: 6.7 mmol/l | NA | 34, NA, NA | NA | X/X | 0.486 (<25) |
| 8 | H33Q | Female | 36 | 52 | ND | 24.1 | 0 | ND | Diet + sulfonylurea | Good; no postprandial glucose levels above 10.0 mmol/l, fasting 4.4–6.7 mmol/l | NA | 42 | NA | X/X | 0.532 (<25) |
| 9 | G81D | Male | 47 | 47 | 28 | 28 | 0 | 1.66 | Sulfonylurea | Excellent | 6.5% after 2 years | 30 | NA | DR3/X | 0.603 (<25) |
| 10 | G62C | Female | 38 | 38 | 25.6 | 25.6 | 0 | ND | Sulfonylurea | Excellent | 6.2% after 2 years | 28 | NA | X/X | 0.475 (<25) |
| 11 | G96C | Male | 44 | 44 | 25.6 | 25.6 | 0 | ND | Metformin + insulin at bed time | Good; no postprandial glucose levels above 10.0 mmol/l, fasting 4.4–6.7 mmol/l | NA | 34 | NA | X/X | 0.486 (<25) |
| 12 | H33Q | Male | 35 | 41 | ND | ND | 0 | ND | Metformin (5 years) | Good; no postprandial glucose levels above 10.0 mmol/l, fasting 5.0–5.6 mmol/l | NA | 60, 68 | NA | DR4-DQ8/X | 0.664 (25–50) |
| 13 | P113A | Female | 20 | 20 | 25 | 25 | 0 | 1.44 | Insulin | Good; no postprandial glucose levels above 8.9 mmol/l, fasting 4.4–6.1 mmol/l | 6.3% after 16 years | NA, NA | 4% | X/X | 0.513 (<25) |
This patient was also heterozygous for the low frequency ONECUT1-P75A variant (rare/low-frequency variants in cis: P215A[rare]-P75A[low-frequency])
This patient was also heterozygous for the low frequency ONECUT1-P75A variant (rare/low frequency variants in trans: compound heterozygous G96D[rare]/P75A[low-frequency]).
C-peptide for this patient was still positive when tested 20 years after diabetes onset.
HLA-DR genotypes for DR3, DR4 and DR15 were determined using tag SNPs rs2187668 and rs7454108 to tag DR3 (DRB1*0301-DQA1*0501-DQB1*0201) and DR4-DQ8 (DRB1*04-DQA1*0301-DQB1*0302) alleles respectively and SNP rs3129889 to tag HLA DRB1*1555.”X” denotes non-DR3, non-DR4-DQ8, non-DRB1*15. The type 1 diabetes genetic risk score (T1D-GRS) was determined using the genotypes of the top 10 risk alleles for T1D, according to Oram et al.56 (see Methods). Values shown in parentheses indicate the distribution of these scores compared to a European T1D control population studied by Johnson et al.57: <25: below the 25th centile, >50: above the 50th centile, 25–50: between the 25th and 50th centile. All patients were negative for the mitochondrial m.3243A>G mutation.
ND: not done, NA: not available, OAD: oral antidiabetic drug. Positive Predictive Value (PPV) for MODY was performed using the MODY Probability Calculator (https://www.diabetesgenes.org/mody-probability-calculator/).
Variants identified in our diabetic patients screening are shown in Extended Data Fig. 1f. Besides early age at diabetes diagnosis (median[IQR]=29[23.5–37], range:12–47; Supplementary Table 7a), most ONECUT1-heterozygous patients were normal/non-obese at diagnosis (median[IQR]=26.5[24.6–29.5], range:20.2–30.1) and normal/low-risk obese at recruitment (Supplementary Table 7b) and had low fasting insulin (6 heterozygous subjects, Families-1 and -2; Supplementary Table 1), further refining the characteristic features of these subjects.
For replication, we performed burden testing for rare ONECUT1 coding variants in subgroups of patients from the AMP-T2D-GENES cohort selected to best reproduce the distinctive characteristics of our ONECUT1 heterozygous diabetic subjects based on available phenotypic data: age at recruitment (as a surrogate for age at diagnosis, not available), BMI and fasting insulin. This analysis showed evidence for T2D association with increasing ORs under the most selective criteria (Supplementary Table 8), thus replicating our findings. For example, T2D patients selected for age (12–35 years) and BMI (20–35) showed increased frequency of rare ONECUT1 variants compared to unselected controls (3.85% vs 0.81%,OR=22.3,P=0.00015).
Altogether, these results suggest that heterozygous ONECUT1 mutations, including loss of function (LOF) variants and a subset of rare coding variants, are responsible for a new monogenic diabetes entity characterized by early-onset diabetes (juvenile to adult-onset). In addition, these heterozygous patients were normal/non-obese at diabetes onset and had impaired insulin secretion.
T2D and other metabolic traits associated with ONECUT1 variants
In the recent DIAMANTE GWAS, common variants located upstream of ONECUT1 show association with T2D (99% genetic credible set: chr15:53070141–53165681)5. We further explored this region for T2D and other metabolic traits, focusing on the 4 most strongly T2D-associated variants (credible SNPs, Supplementary Table 9, Extended Data Fig. 1g21). The strongest T2D association is observed at rs2456530 (OR=1.09,P=4.7×10⁻⁹), which is also associated with BMI and childhood obesity in the same orientation (minor allele associated with increased T2D, increased BMI and childhood obesity). T2D association at this SNP remains highly significant after adjusting for BMI (P=1.1×10⁻⁶). Strong T2D association is also found at rs75332279, which is mainly independent on BMI (P=5.8×10⁻⁹ with T2D, P=0.0036 with BMI). In addition, other SNPs in the region are strongly associated with BMI, e.g. rs1899730 (P=5.6×10⁻¹⁰) and the low-frequency variant rs16965225 (Effect allele frequency=0.060, P=1.7×10⁻¹⁰). Interestingly, some of these BMI-associated SNPs are little or not associated with T2D; for example, rs10851523 (P=1.8×10⁻⁹ with BMI, P=0.034 with T2D adjusted for BMI), which is located distally to ONECUT1 and is not in linkage disequilibrium with T2D-associated SNPs in this region (Extended Data Fig. 1g). Overall, these observations support the contribution of partly distinct mechanisms involved in T2D and in BMI (Extended Data Fig. 1g), with a T2D-associated region located upstream of ONECUT1. T2D-associated SNPs in this region also show suggestive association with decreased fasting insulin adjusted for BMI, increased 2-hour insulin and decreased insulin secretion rate, suggesting impaired insulin secretion (Supplementary Table 9). These SNPs also show locus-wide significant association with lipid disorders, and suggestive association with liver impairment traits (Supplementary Table 9). In addition, BMI-associated SNPs in this region show locus-wide significant association with sleep and circadian traits (Supplementary Table 9), which are known to be altered in several metabolic disorders including T2D and obesity22.
Overall, the distinctive clinical features of ONECUT1 homozygous and heterozygous patients suggest a pancreatic/endocrine developmental defect, while common T2D-associated variants may also affect these traits by modulating the same mechanisms.
Defective pancreas progenitor formation and endocrine priming in ONECUT1 null PSCs
Next, we used genome engineering to either remove the entire ONECUT1 gene (KO) or to truncate (trunc) the two functional domains in several PSC lines. Moreover, we reprogrammed fibroblasts from ONECUT1-p.E231X homozygous Patient-1 (Fig. 2a; Extended Data Fig. 2a-c). Nonsense-mediated mRNA-decay was excluded (not shown). Stage-specific pancreatic differentiation accompanied by stage-specific large-scale sequencing analysis (Fig. 2b) revealed normal definitive endoderm (DE) and pancreatic endoderm (PE) formation (Fig. 2c; Extended Data Fig. 2d-f). In contrast, pancreas progenitor (PP) formation was reduced in all ONECUT1 null genotypes (Fig. 2d; Extended Data Fig. 2g).
Figure 2: ONECUT1-depleted PSCs are defective in PP formation.
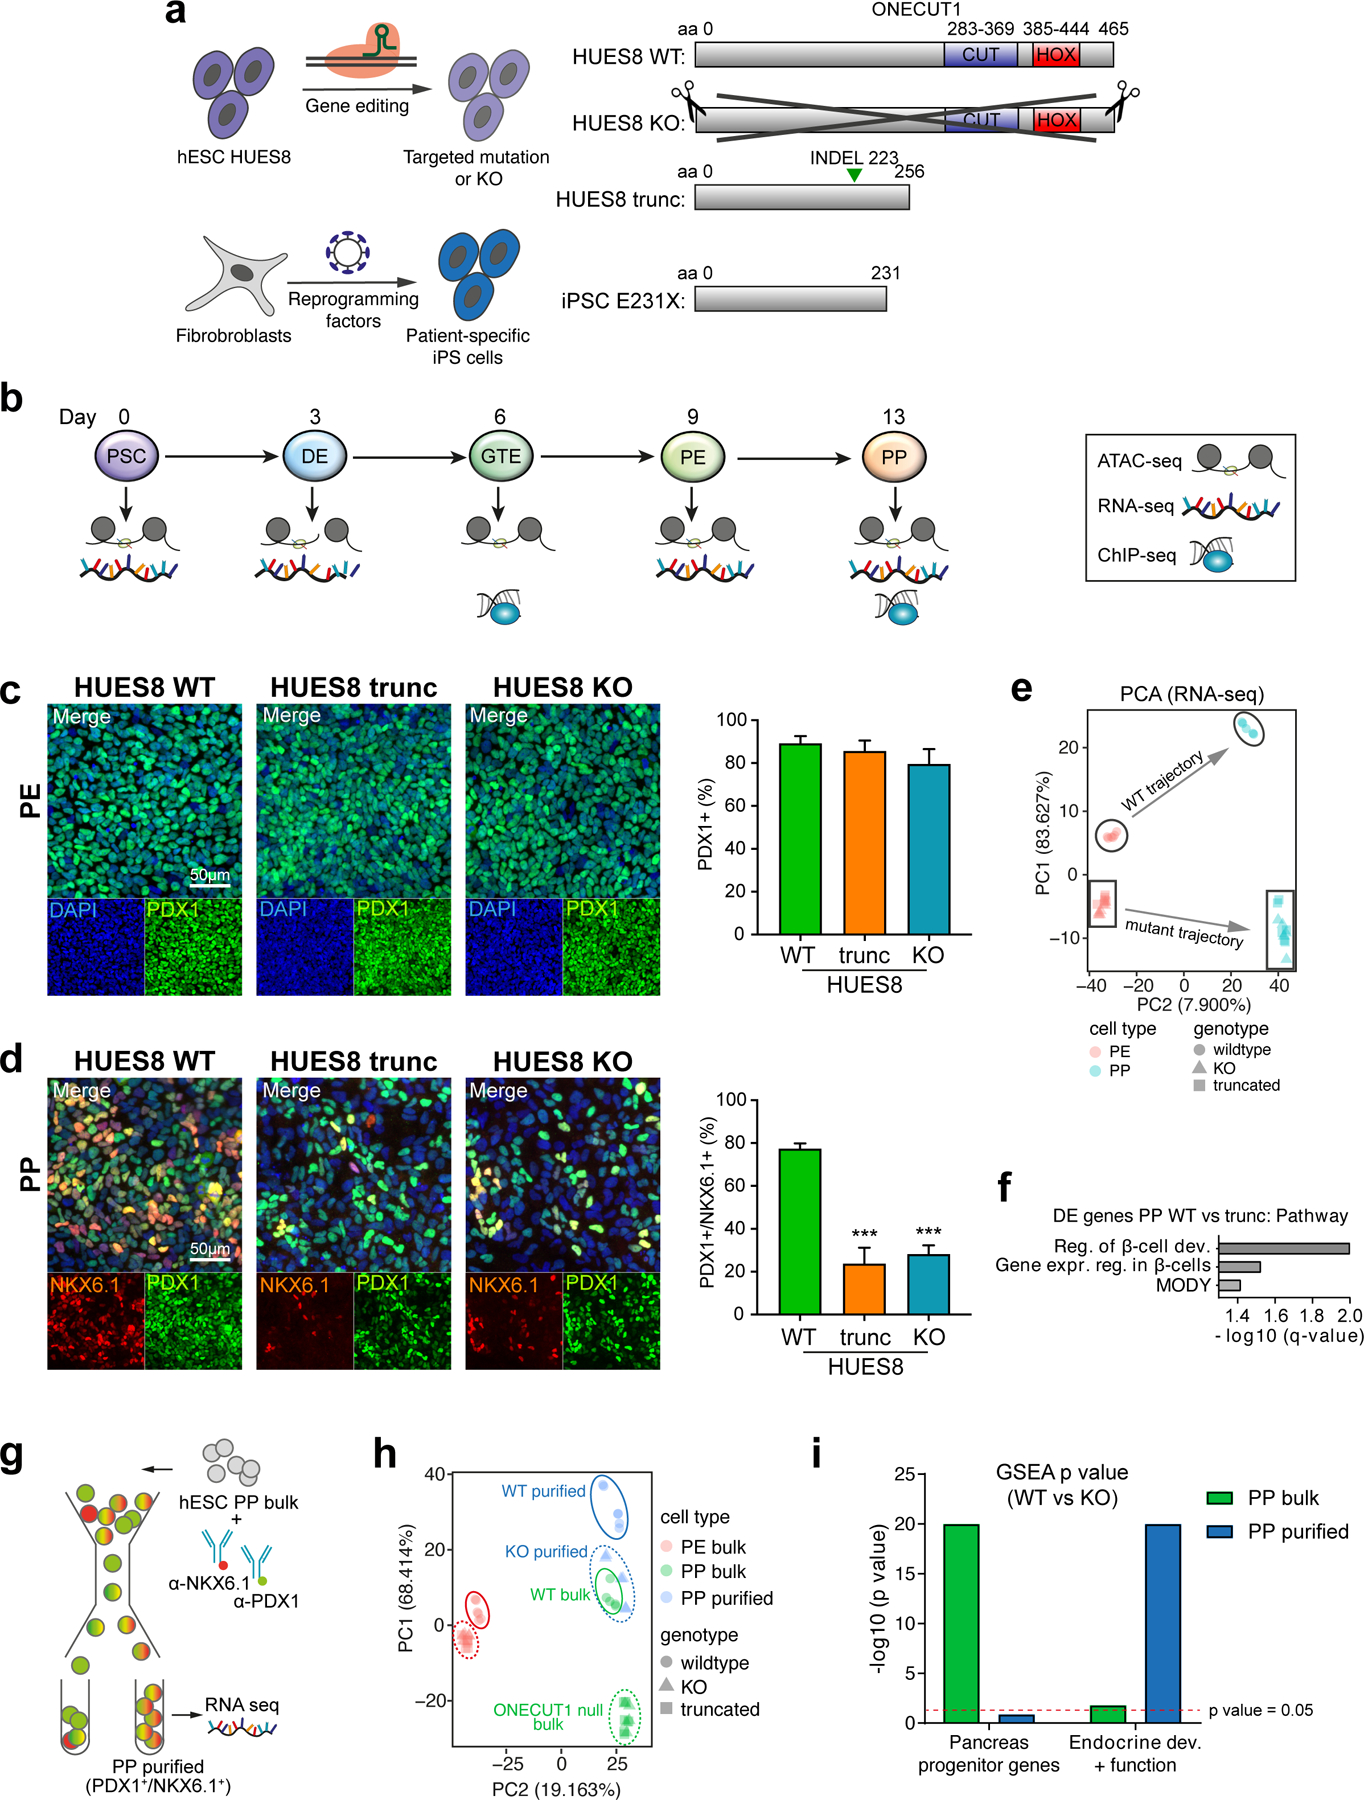
(a) Overview of ONECUT1 variants derived from gene-edited HUES8 hESCs and fibroblasts reprogrammed toward iPSCs. (b) Schematic outline of the applied pancreatic differentiation strategy of human pluripotent stem cells and subsequent stage-specific large-scale sequencing analysis or correspondingly employed data set52,53. Stages abbreviate as follows: PSC: human pluripotent stem cells; DE: definitive endoderm; GTE: gut tube endoderm; PE: pancreatic endoderm; PP: pancreatic progenitors. (c,d) Differentiation efficiency at the PE and PP stages in ONECUT1 null HUES8 cells. Representative images show immunofluorescence staining of PDX1 and PDX1/NKX6.1 at the PE and PP stage, respectively. Quantification of positive cells was performed by flow cytometry in HUES8 cells and showed at PP stage 69% and 64% reduction of efficiency in HUES8 ONECUT1 trunc and HUES8 KO, respectively (n=4, one-way ANOVA with Tukey’s test). (e) Principal component analysis from RNA-seq of HUES8 ONECUT1 null and WT PE and PP cells. Different subpopulations and developmental trajectories are indicated as borders and arrows, respectively. (f) Pathway enrichment analysis54 of differentially expressed genes with decreased expression in HUES8 ONECUT1 truncated compared to ONECUT1 WT cells at the PP stage. (g) Schematic representation of fluorescence-activated cell sorting (FACS) to purify PP cells. (h) Principal component analysis of RNA-seq comprising HUES8 ONECUT1 null and WT PE and PP cells (bulk) as well as purified PP (PDX1+/NKX6.1+) cells. Dashed circles indicate ONECUT1 null, while continuous circles label WT cells. (i) Gene set enrichment analysis (GSEA)23 of contrasting HUES8 WT vs. KO of purified PP (PDX1+/NKX6.1+) and bulk PP cells on a specific gene set for pancreatic progenitors24 as well as for endocrine development and β-cell function25.
Transcriptome-based principal component analysis (PCA) revealed distinct differentiation trajectories in ONECUT1 null and WT cultures. ONECUT1 null PP cells showed high similarity to the WT PE cell-stage (Fig. 2e) and gene set enrichment analysis (GSEA23) with PP signatures24 confirmed downregulation of PP programs (Fig. 2i; Extended Data Fig. 3a). Similarly, ONECUT1 null PP cultures lost programs associated with endocrine cell identity25 (Fig. 2f,i; Extended Data Fig. 3b,c). Supportingly, quantitative proteomics confirmed concordance of protein and RNA levels (Extended Data Fig. 3d,e). These data indicate a specific requirement of ONECUT1 for transition from pancreatic endoderm to progenitor stage.
Intrinsic defects in ONECUT1 null PPs to launch the β-cell program
To further characterize the cells successfully activating NKX6.1 in the absence of ONECUT1, we performed FACS purification followed by RNA-seq (Fig. 2g). Purified ONECUT1 null PPs clustered close to unpurified WT PPs (bulk), while the purified WT PPs clustered further away from all other PPs (Fig. 2h). Interestingly, GSEA indicates that genes downregulated in unsorted ONECUT1 null PPs are primarily associated with a PP program (Fig. 2i; Extended Data Fig. 3a), while the genes downregulated in purified ONECUT1 null PPs are more endocrine specific25 (Fig. 2i; Extended Data Fig. 3b). This suggests an intrinsically different transcriptional endocrine program of the purified ONECUT1 KO PPs. Conversely, downregulated genes were enriched for ONECUT1-bound genes as measured by ChIP-seq (Fig. 3a,b). Open chromatin sequencing (ATAC-seq) also revealed that ONECUT1 ChIP-seq peaks were enriched in open chromatin (OC) regions lost upon ONECUT1 loss at PE and PP stage (Fig. 3c). PCA of OC in WT cells indicated a developmental trajectory culminating and separating genotypes at the PP stage (Extended Data Fig. 4a). Peaks with loss of OC upon ONECUT1 loss were more abundant at distal regulatory regions (Extended Data Fig. 4b). At PE/PP stage, most regions with loss of OC in ONECUT1 null cells were bound by ONECUT1 together with other pancreatic TFs (Fig. 3d; Extended Data Fig. 4c) and were proximal to genes instructive of endocrine/alpha/β-cell specification26 (Extended Data Fig. 4d,e). A TF-binding activity analysis27 indicated changes only at PE and PP stages with ONECUT1 having highest activity loss (Extended Data Fig. 4f,g). Other pancreatic TFs displayed similar OC loss suggesting cooperative binding with ONECUT1 (Extended Data Fig. 4f,g). Overall, these data indicate that (i) ONECUT1 shapes chromatin accessibility at the PE to transit to PP stage and (ii) regulates transcriptional activity of downstream factors relevant to employ for β-cell differentiation. Accordingly, ONECUT1 null PSCs were diminished in forming stage (ST) 5 endocrine progenitors (EP) and ST6 immature β-like cells, while many of the C-peptide+ cells lacking ONECUT1 were also negative for the islet-critical TF NKX6.1, indicating an altered transcriptional machinery28 as confirmed by qPCR (Fig. 3e-h). Induced insulin secretion was reduced in ST6 ONECUT1 null cultures (Fig. 3i). These alterations are consistent with undetectable insulin in ONECUT1-mutated homozygous patients and the low fasting insulin in heterozygous patients (Fig. 1c,d; Table 1; Supplementary Table 1).
Figure 3: Intrinsic defects in ONECUT1-depleted PP cells disturb the β-cell program.
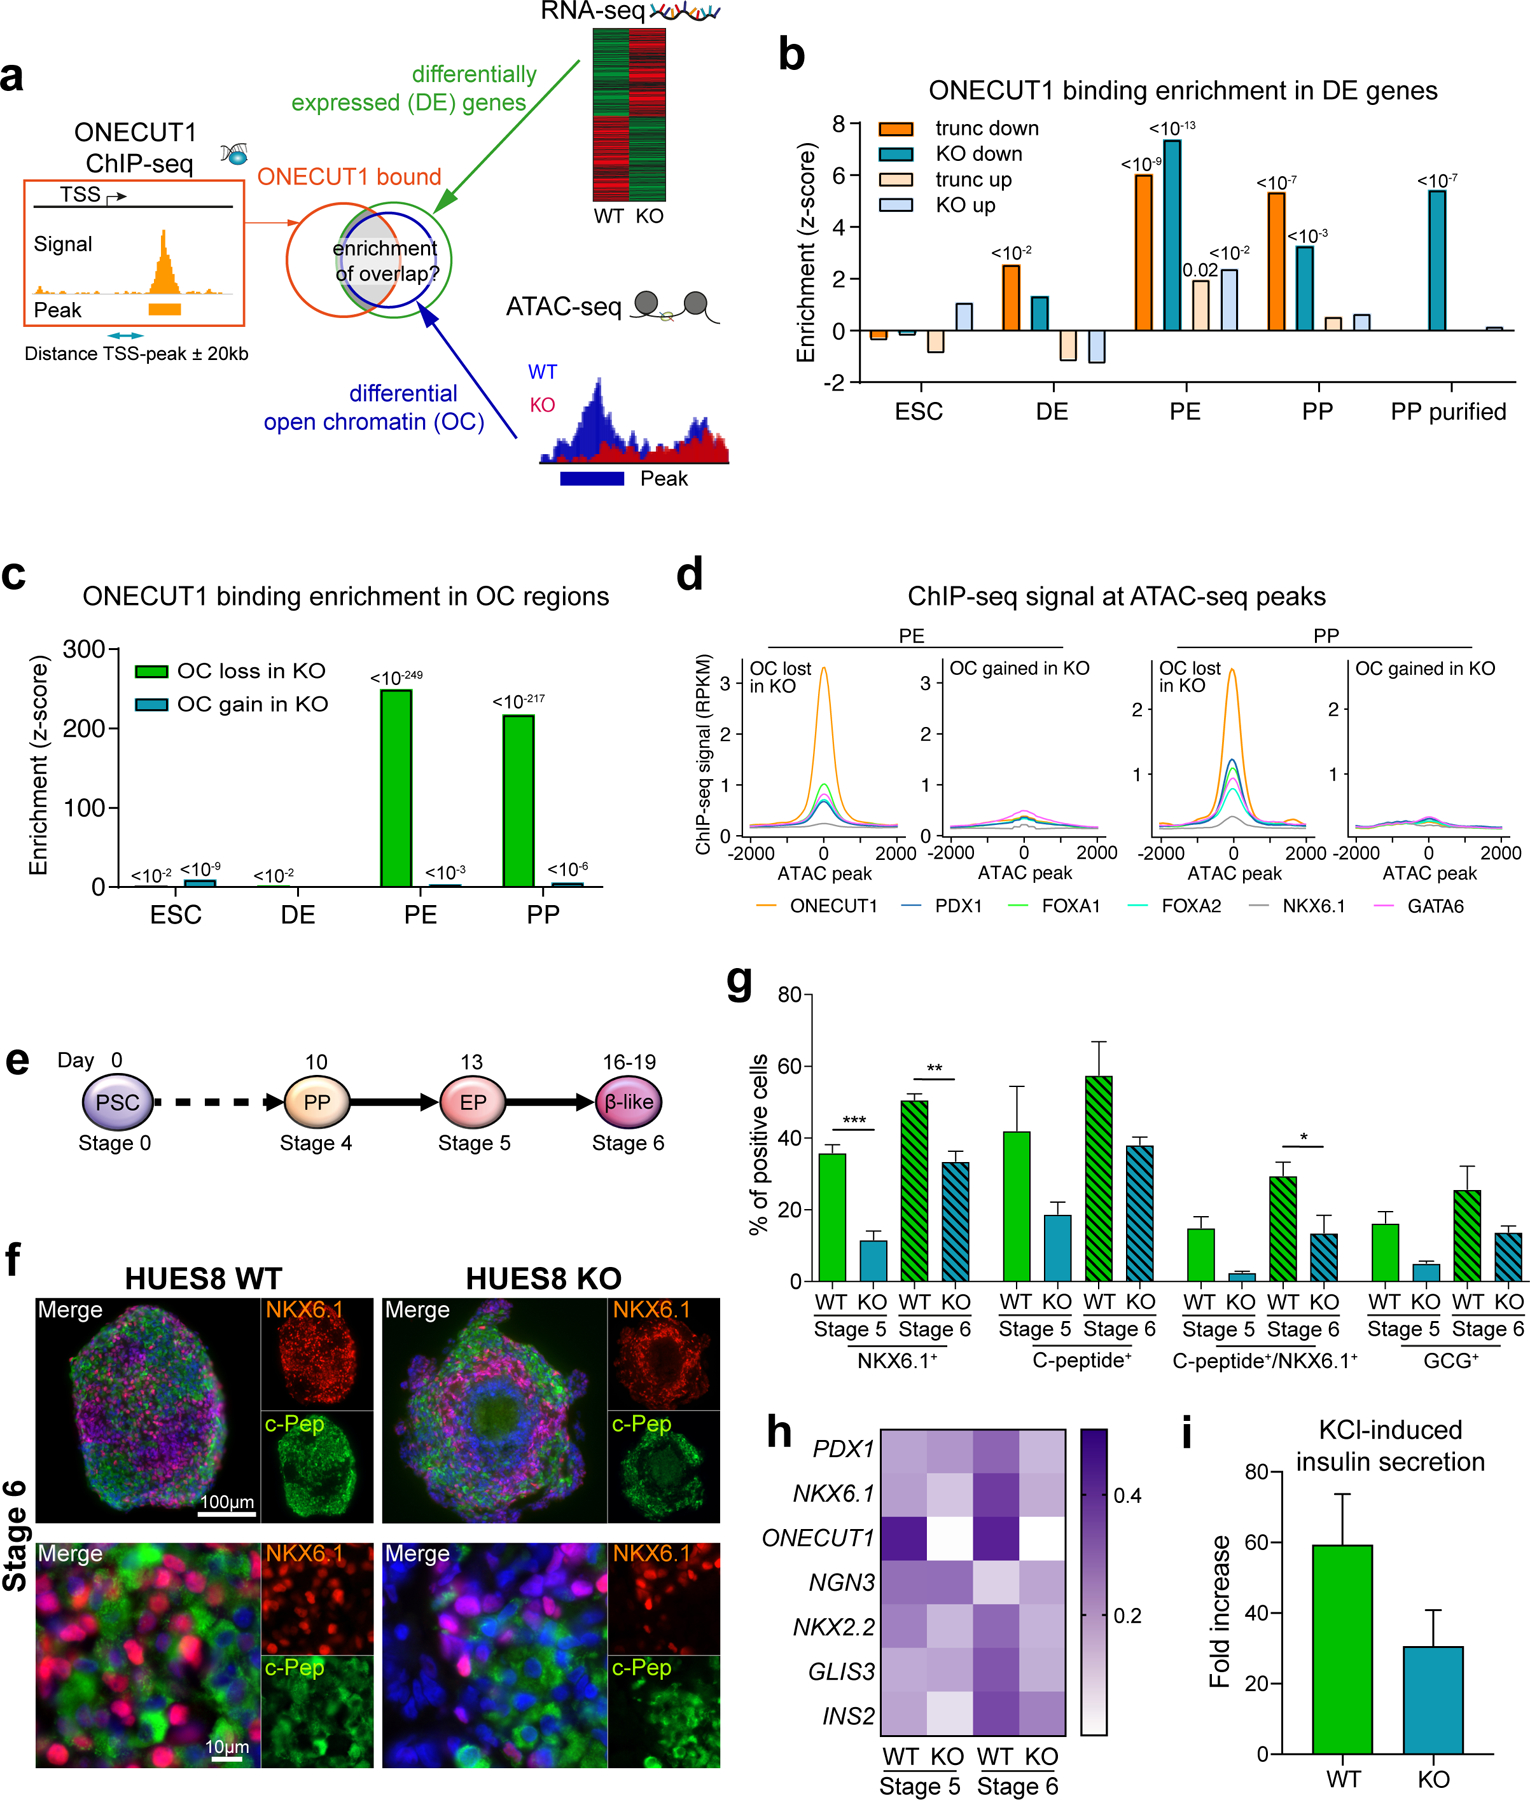
(a) Schematic enrichment analysis of ONECUT1-bound genes with either differentially expressed genes or differential open chromatin peaks (HUES8 WT vs. KO). (b) Binding enrichment (z-score) test of ONECUT1 (ChIP-seq, PP stage) in up- and downregulated genes (RNA-seq) at the depicted differentiation stages of ONECUT1 null and WT HUES8 cells. (c) Binding enrichment (z-score) test of ONECUT1 (ChIP-seq, PP stage) in differential open chromatin regions (HUES8 WT vs. KO, ATAC-seq) of the depicted stages. Notably, bars show enrichment in open chromatin (OC) regions lost or gained in ONECUT1-depleted cells. (d) ChIP-seq signals of key TFs at OC peaks lost or gained at the PE and PP stage in HUES8 ONECUT1 KO cells. (e) Differentiation scheme of HUES8 cells toward β-like cells. (f,g) Representative images show immunofluorescence staining of NKX6.1 and C-peptide at stage 6 (f) and quantification of markers was performed by flow cytometry at stage 5 and 6 of ONECUT1 KO and WT HUES8 cells (g, n=3; one-way ANOVA with Tukey’s test). (h) Heatmap depicting relative marker expression in ONECUT1 KO HUES8 cells at stage 5 and 6. Expression values are normalized to HUES8 ONECUT1 WT and scaled by the sum of each row (n=2). (i) Induced insulin secretion of ONECUT1 KO and WT HUES8 cells at stage 6 depicted as fold increase comparing low glucose stimulated insulin secretion with subsequent KCl-stimulated insulin secretion (n=3 with 3 replicates).
An endocrine TF network involving ONECUT1
To further characterize how distinct ONECUT1 coding variants cause or affect diabetes risk in humans, a set of variants identified in diabetic patients (diabetes-causing variants thereafter; Extended Data Fig. 5a) were generated. All variants, except ONECUT1-p.E231X, showed strong nuclear localization and unchanged DNA binding (Fig. 4a-c; Extended Data Fig. 5b-e). However, transactivation capacities were altered in all diabetes-causing ONECUT1 variants (Fig. 4d). Except for ONECUT1-p.E231X lacking the DNA-binding domains, VP16-fusion constructs restored the ability to activate transcription, indicating that these variants don’t cause major structural protein impairments (Extended Data Fig. 6a). Previous work defined a network of islet critical TFs indicative of auto- and cross-regulatory interactions29. Similarly, we found that ChIP-seq peaks for some of these TFs overlapped with ONECUT1 binding (Extended Data Fig. 6b,c). Notably, binding is also observed in regions later bound by NKX6.1 and NKX2.2 in human islets (Extended Data Fig. 6c). Physical protein-protein interaction can enhance transcription during isletogenesis30,31. Indeed, ONECUT1 interacted with GATA4, PDX1, GLIS3, NGN3, NKX6.1, and NKX2.2 (Fig. 4e,f; Extended Data Fig. 6d,e). Additionally, ONECUT1 formed homo- and heterodimers involving its C-terminus, as ONECUT1-p.E231X shows disrupted interaction with wildtype ONECUT1 (Extended Data Fig. 7a-c).
Figure 4: ONECUT1 mutations disturb the endocrine TF network.
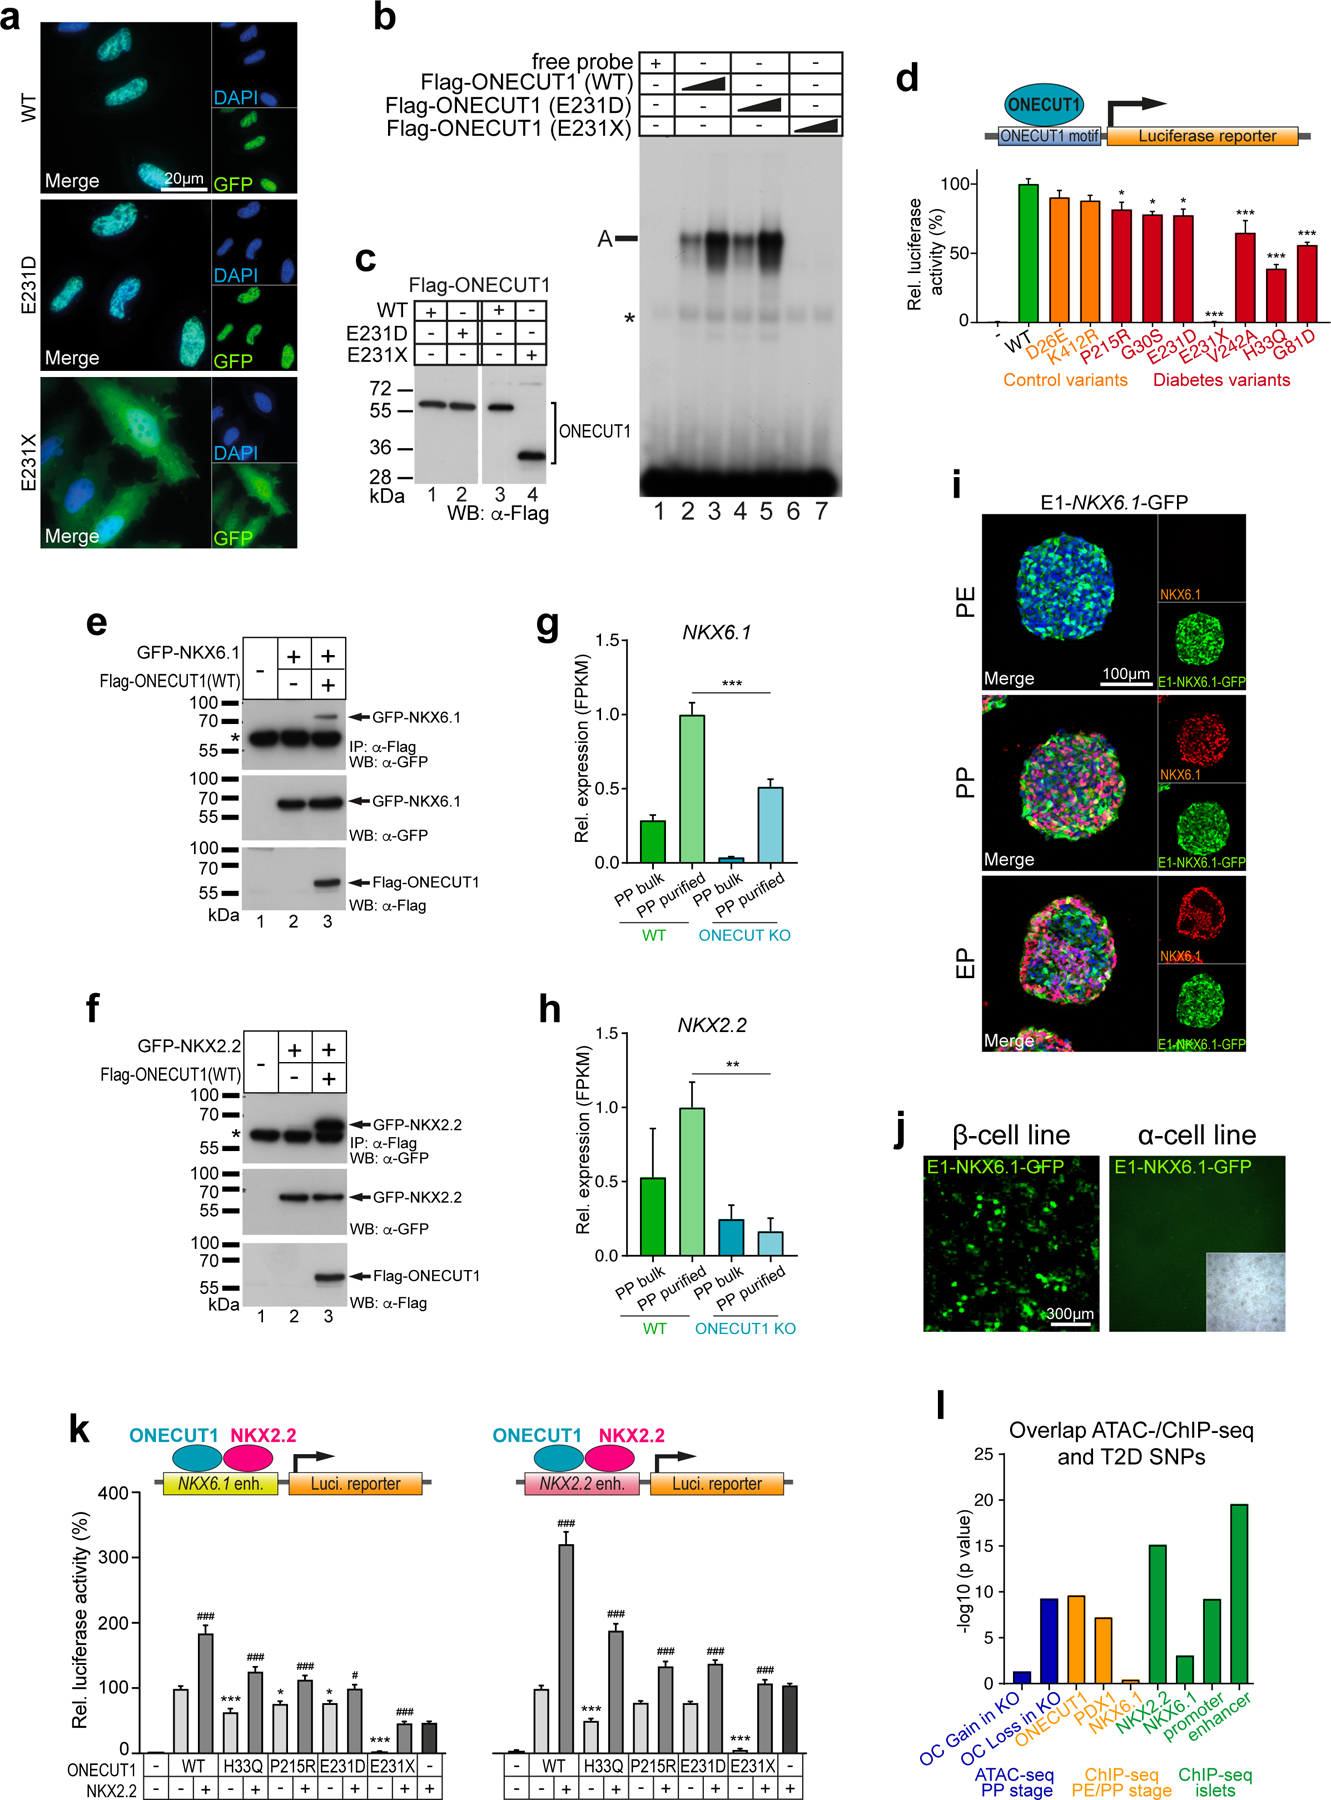
(a) Subcellular localization of WT and mutated ONECUT1 proteins fused to GFP (HeLa cells). (b) Electromobility shift assay (EMSA) of WT and ONECUT1 variants using a ONECUT1 binding motif (TRANSFAC T03257) as probe. (c) TNT-ONECUT1 proteins as WB control for (b). (d) Luciferase reporter assay with WT and indicated diabetes-associated (G30S, E231D, E231X, H33Q, G81D, P215R, V242A) and control (D26E, K412R) variants of ONECUT1 (n=6 for G30S, E231D, E231X, H33Q, G81D; n=10 for D26E, K412R, P215R, V242A; one-way ANOVA with Dunnett’s test). (e,f) Co-immunoprecipitation (top) of FLAG-tagged ONECUT1 and interacting factors NKX6.1 (e) and NKX2.2 (f) confirming physical interaction after FLAG immunoprecipitation. Control western blots (bottom) show successful overexpression of respective factors in HEK293 cells. (g,h) Relative expression of NKX6.1 and NKX2.2 in HUES8 WT and ONECUT1 KO at the PP stage and in purified PP (PDX1+/NKX6.1+) cells from RNA-seq (n=6; two-tailed, unpaired t-test). (i) Activity of the E1-NKX6.1 enhancer during pancreatic differentiation using a GFP reporter construct. Images show a GFP reporter signal as well as staining for PP stage marker NKX6.1 in CyT49 cells. (j) Activity of the E1-NKX6.1 enhancer in a GFP reporter construct using a β-cell line (MIN6) and α-cell line (αTC). (k) Luciferase reporter assay with selected NKX6.1 and NKX2.2 enhancer regions overexpressing WT or ONECUT1 variants alone or together with NKX2.2 in HeLa cells (n=6; one-way ANOVA with Tukey’s test). (l) Significance of overlap of variants associated with T2D acquired from DIAMANTE GWAS dataset (P < 10−20) and ATAC-seq (regions with loss or gain of OC upon ONECUT1 KO) as well as ChIP-seq peaks.
ONECUT1 diabetes-causing variants fail to transactivate NKX6.1 and NKX2.2 specific enhancers
NKX6.1, NKX6.2 and NKX2.2 expression is specifically reduced in ONECUT1 null PPs (Fig. 4g,h; Extended Data Fig. 8a). As NKX6.1 and NKX2.2 are essential to isletogenesis28,32, the defective PP and endocrine program in ONECUT1 null cells could be due to a cooperative interaction. Indeed, physical interaction of the ONECUT1 C-terminus with NKX6.1/NKX2.2 was disrupted in the ONECUT1-p.E231X variant (Extended Data Fig. 7b,c). Furthermore, analysis of ATAC-seq and ChIP-seq data revealed putative NKX6.1, NKX6.2 and NKX2.2 enhancers occupied by ONECUT1 (Extended Data Fig. 8b,c) and GFP-reporter constructs (E1-E3) confirmed activation of the ONECUT1-bound regions E1 and E2 (Fig. 4i,j; Extended Data Fig. 8b; region E2 data not shown). Diabetes-causing ONECUT1 variants showed reduced activation of the E1-NKX6.1 as well as the NKX6.2 and NKX2.2 enhancers (Fig. 4k; Extended Data Fig. 8d). Co-expressing ONECUT1 with NKX2.2 further increased enhancer activity, attenuated by ONECUT1 diabetes-causing variants (Fig. 4k; Extended Data Fig. 8d).
The ONECUT1-p.E231D variant phenocopies Patient-2 in pancreatic differentiation assays
To further substantiate this, the ONECUT1-p.E231D variant was engineered by CRISPR-editing to specifically resemble Patient-2 (Fig. 1b,d; Extended Data Fig. 9a,b). Pancreatic differentiation confirmed the transition defect from PE to PP stage in modified culture conditions33 (Extended Data Fig. 9c-e). We finally probed the cooperative action of the ONECUT1-p.E231D variant with NKX2.2 and found reduced protein-protein binding. (Fig. 4e,f; Extended Data Fig. 6d-e, 7, 9f-g and 10g).
Finally, integrating genetic and functional evidence for rare ONECUT1 coding variants identified as heterozygous in diabetic subjects according to the American College of Medical Genetics and Genomics (ACMG) guidelines predicted them to be pathogenic or likely pathogenic, while the two control variants are not (Supplementary Table 10), further supporting their role in monogenic dominant diabetes.
Common T2D-associated variants near ONECUT1 affect endocrine regulatory elements
We mapped sequencing data onto the ONECUT1 T2D association region, focusing on the afore mentioned 4 credible SNPs5 (Extended Data Fig. 1g;10a). Three of these SNPs (rs2456530, rs2440374 and rs75332279) map to regulatory regions only active in pancreatic islets and liver cells (GTEx34, Extended Data Fig. 10b), while rs7178476 maps to an enhancer in PP cells. Interestingly, these SNPs are in regions containing relevant functional elements: (i) ONECUT1 binding sites or (ii) loss of OC upon ONECUT1 KO, and (iii) enhancer histone marks in PPs (Extended Data Fig. 10a). The T2D association region also includes a large regulatory element containing a long non-coding RNA RP11–209K10.2 (lncRNA-RP11) with similar tissue-specific expression as ONECUT1 (Extended Data Fig. 10b,c). Interestingly, rs2440374 overlaps with an ONECUT1 ChIP-seq peak and with an OC region loss upon ONECUT1 KO (Extended Data Fig. 10a). Moreover, this variant disrupts an NKX2.2 binding motif (Extended Data Fig. 10d) and is an eQTL for lncRNA-RP11 in pancreas, as are rs2456530 and rs75332279 (Extended Data Fig. 10e). rs2440374 is also an eQTL for lncRNA-RP11 in the liver (P=1.2×10⁻⁷) and for ONECUT1 in the cerebellum (P=4.0×10⁻¹¹), suggesting that these variants may also affect additional organs and traits, consistent with the extent of associated traits (Supplementary Table 9). lncRNA-RP11 gets concurrently downregulated in ONECUT1 KO PPs (Extended Data Fig. 10f). Collectively, these data suggest that T2D-associated SNPs located upstream of ONECUT1 may affect the regulation of lncRNA-RP11 expression. Finally, we correlated T2D-associated SNPs at the genome-wide level with TF-binding patterns and dynamically regulated open chromatin upon ONECUT1 loss. This shows that T2D-associated SNPs cluster to ONECUT1-binding peaks in a similar range as for PDX1, but less prominent than the overlap with islet enhancers or NKX2.2-bound regions (Fig. 4l). Accordingly, genome-wide regions with loss of OC upon ONECUT1 KO were also enriched for T2D-associated SNPs (Fig. 4l).
Discussion
This is the first study reporting a role of both rare coding and common regulatory ONECUT1 variants in human diabetes, similarly to several other diabetes genes, including GCK, KCNJ11, HNF1A and PPARG35. Our findings add ONECUT1 to a small list of genes (e.g. GCK)36–38 simultaneously involved in monogenic recessive (severe neonatal syndromic diabetes), monogenic dominant (adult- and juvenile-onset diabetes) as well as in multifactorial diabetes (T2D, common disease-associated variants). While our human stem cell differentiation assay revealed impaired pancreatic progenitor (PP) and β-like cell formation, PP numbers indeed determine pancreas size39, consistent with pancreatic hypoplasia in homozygous mutated patients. A core action of ONECUT1 is the activation of NKX6.1, NKX6.2 and NKX2.2 via binding to cis-regulatory elements, impaired in diabetes-causing variants. ONECUT1 operates in a feed-forward loop to regulate its own transcription and chromatin dynamics, consistent with promoter variants’ association with multifactorial T2D. NKX2.2, another critical factor regulated and bound by ONECUT1 at regulatory sites, is also essential for specifying pancreatic islet cell fates40. Notably, diabetes-causing ONECUT1 variants had reduced capacity to activate these three NKX genes that comprise a previously reported islet-specific transcription factor network29,41. Physical interactions with other pancreatic TFs occur at the C-terminus of ONECUT1, while missense diabetes-causing variants fail to transactivate but allow for DNA binding, supporting the relevance of protein-protein interaction in the endocrine program. We may speculate that these variants affect the binding to specific, yet unknown cofactor interactions involved in ONECUT1 function. Additionally, our chromatin- and cis-regulatory binding maps indicate that ONECUT1-induced gene transcription globally resides in OC clusters co-bound by physically interacting islet-enriched TFs28,29,40–42. This is in line with results demonstrating that ONECUT1-bound regions are overall associated with T2D in a similar range as NKX-bound regions in human islets54.
Studies in knockout mouse models pioneered by Lemaigre and colleagues revealed a role of Onecut1 for both endocrine specification and proper duct morphology14,30,31,43,44. Onecut1 and Pdx1 cooperate to ensure normal endocrine development and functional maturation of β-cells at later stages, in line with our observations44,45. While in Onecut1 knockout mice Ngn3 expression is completely lost, this is not the case in our human data, albeit ONECUT1-p.E231X homozygous patient phenocopies the null allele mouse, at least partially14–16,46. Our family observations also suggest that homozygous ONECUT1 loss-of-function mutations lead to early death or miscarriage, while in mice the complete loss of Onecut1 is tolerated in approximately a quarter of the animals14, underpinning crucial differences between mice and men. Alongside, homozygous ONECUT1 and RFX6 human mutations also show remarkable clinical similarities, including neonatal diabetes with gallbladder agenesis and hypoplastic pancreas, while heterozygous RFX6 mutations are similarly associated with MODY12,47. Our findings highlight the power of our staged strategy combining clinical, genetic and in-depth functional approaches, enabling the identification of a monogenic component within a common, mainly multifactorial disease. Here, increased power was achieved by different means: (i) reducing genome-wide scale to single-gene level, (ii) suggesting the early age at onset of heterozygous patients, hence screening appropriately designed diabetes cohorts, and (iii) performing detailed functional investigations of disease-causing variants. In contrast, genome-wide WES studies in large unselected T2D cohorts failed to detect a monogenic contribution of ONECUT1 to T2D5,6,48,49. Hence, our staged strategy provides a powerful complement to these large-scale studies.
Some monogenic forms of diabetes (e.g. MODY) appear to respond differently, albeit generally better, to treatment compared to common multifactorial T2D50. Notably, most ONECUT1-heterozygous patients had an HbA1c value close to normal upon treatment. Our data suggest that monogenetic profiles may underlie part of the clinical heterogeneity of T2D4. Hence, diagnosis of diabetes-causing ONECUT1 variants may be imperative for treatment response4,51. In addition, in view of its extended contribution to diabetes, precision medicine targeted towards ONECUT1 will likely benefit a much broader population.
In summary, our study provides a detailed and comprehensive analysis of ONECUT1 as a novel diabetes gene. Our findings support the concept that ONECUT1 variants may contribute to a broad spectrum of diabetes depending on both the risk genotype (homozygous, heterozygous), and the nature of the risk variant (LOF, missense, regulatory), similarly to other pancreatic development genes (e.g. HNF1A, PDX1 and RFX6). Hence diabetes may range from severe neonatal syndromic diabetes (e.g. homozygosity for ONECUT1 LOF variant) to multifactorial T2D (association with regulatory variants), while heterozygous coding variants likely contribute to diabetes with variable risks depending on the pathogenicity of the variants. Additional large-scale studies are needed to dissect the precise genotype-phenotype correlation of ONECUT1 variants in diabetes. Moreover, we studied a selection of these diabetes-causing variants to shed light on the underlying mechanisms and generated a coherent roadmap of ONECUT1 for human pancreatic and β-cell development. Overall, our study endorses an approach combining clinical studies, human genetics and time-resolved, high-resolution transcriptome and epigenome maps of differentiating human PSCs to provide a unique resource for personalizing diabetes therapy based on molecular knowledge.
Online Methods
Patients and study populations
Neonatal and very-early juvenile onset diabetes patients and their families (family-1 and -2)
The index patients 1 and 2 as well as their families are described in the Results section, in Table 1 (Patients 1 and 2), and in Supplementary Table 1 (heterozygous relatives). The study was explained to the parents of the patients, their other children, and relatives (for family 1). After obtaining written consent, blood samples were collected from family members and DNA extraction was performed using standard procedures. The parents agreed to participate in the subsequent metabolic study. The study was approved by the Hospices Civils de Lyon (family-1) and the Institutional Review Board of Ulm University (family-2). Family 1 belongs to the French Traveller community, a minority group with a strong tradition of consanguineous marriages, who in the case of this family was known to be of French descent. Principal component analysis (PCA) confirmed their French ancestry, with possibly a minor level of admixture (Extended Data Fig. 1a,b). Local ancestry analysis at the ONECUT1 locus shows that the haplotypes from both parents at the ONECUT1 position are estimated to be of European ancestry (Extended Data Fig. 1c). Family 2 is from Turkish ancestry.
Metabolic exploration of heterozygous parents of families-1 and -2
Oral glucose tolerance test (OGTT) was performed on the parents of both index cases (subjects 1 and 2 of families 1 and 2, Supplementary Table 1). Serum insulin concentrations were measured in Patient-1’s parents by immunoradiometric assay using a commercial kit (Bi-insulin IRMA, CIS bio international, France). OGTT procedure: An unrestricted diet rich in carbohydrates was recommended for 3 days prior to the test. After an overnight fasting period of 8–14 h, baseline (zero time) blood glucose and insulin were measured. Within 5 min, subjects were required to drink 1.75 g of glucose per kg of body weight as a 18% solution (maximum 75 g). Venous plasma was collected for additional determinations at 30, 60, 90 and 120 min.
Subjects with diabetes mellitus and controls from Ulm, Germany (Ulm diabetes cohort, UDC)
All samples were obtained through the Centre of Excellence for Metabolic Disorders, Division of Endocrinology and Diabetes, Ulm University Medical Centre. Diabetes was defined as fasting plasma glucose > 125 mg/dL or 2-hour glucose > 200 mg/dL after an oral glucose tolerance test. Furthermore, individuals with a history of diabetes or undergoing treatment with oral anti-diabetic drugs or insulin were considered as cases. All subjects studied were of Northern European ancestry. In addition, all diabetes subjects and the controls were tested for the presence of serum autoantibodies, including islet-cell autoantibodies (ICA), glutamic acid decarboxylase (GAD), and islet antigen 2 antibodies (IA2), as previously described58. Positivity for islet-cell autoantibodies, insulin requirement, and evidence of ketosis at the time of diagnosis were criteria for exclusion of T2D. Exclusion criteria were also pregnancy and the presence of any other severe disease. All non-autoimmune diabetes patients (UDC-T2D thereafter) have been previously sequenced for known MODY genes, including HNF1A, HNF1B, HNF4A, GCK, ABCC8, PDX1, INS, PAX4, KCNJ11 and NEUROD1, and positive cases (carrying pathogenic or likely pathogenic variants) were excluded. Controls had normal fasting glucose (confirmed by HbA1c < 6%) and had no evidence of islet autoimmunity. Overall, 2165 T2D subjects were included and 397 controls. A group of 162 adult-onset diabetic patients positive for ICA, GAD or IA2 antibodies (T1D/LADA) were used as additional non-T2D controls.
All individuals gave informed consent for use of their DNA samples for genetic studies. The study was approved by the Institutional Review Board of Ulm University, Ulm, Germany (registration numbers 42/2004 and 189/2007) and the Chamber of Physicians, State Baden-Wuerttemberg, Germany (registration number 133–2002), and is in accordance with the ethical principles of the Declaration of Helsinki.
Lebanese patient with non-autoimmune juvenile-onset diabetes
The patient, a boy, was recruited as part of a study of juvenile-onset diabetes in Lebanon 59. The study was explained to the patient, his parents, and his three healthy siblings. After signing written consent, blood samples were collected and DNA extraction was performed using standard procedures. The study was approved by the Research and Ethics Committee of the Chronic Care Center (Lebanon). Diabetes was diagnosed at the age of 12 years, he was negative for GAD autoantibodies at diabetes onset and was treated with insulin from diabetes onset. At the time of recruitment in the study (age 18 years), the patient was obese (BMI=36, standardized BMI (BMI SDS)=4.5).
Genotyping and sequencing
We performed a 10K SNPs genome scan (Affymetrix) in a nuclear subset of family 1 composed of the index patient, his two parents, and one of the healthy siblings, for subsequent linkage analysis of neonatal diabetes. Linkage regions were intersected with genes involved in early endoderm development (a total of 8 candidate genes). An additional 300K genome scan (Affymetrix) was performed in Patient-1’s parents for ancestry analysis10. We performed mutation screening of ONECUT1 exons in the index patient of family 1 (Patient-1), his two unaffected siblings and their parents by sequencing genomic DNA using Sanger sequencing on an ABI-3730 sequencer (Applied Biosystems). We then completed the sequencing of the identified ONECUT1 PTV variant in the extended family 1. Sequencing of the German T2D patients and controls was also performed by Sanger sequencing of ONECUT1 exons on genomic DNA. Sequences of primers used for ONECUT1 sequencing are available in Supplemental Method Table 1a.
In family 2, we performed targeted gene sequencing of a panel of 12 candidate genes (PDX1, HNF1A, HNF1B, HNF4A, GCK, ABCC8, INS, GLIS3, WFS1, PAX4, KCNJ11, ONECUT1) in the index case (Patient-2) and his parents. For each gene, exon coordinates were obtained from the RefSeq database to identify the coding and untranslated regions of the target genes. Standard Illumina library preparation process was done using Illumina Library Prep kit (Illumina Inc., San Diego). Sequencing of the libraries was performed on Illumina HiSeq System (Illumina, Inc.). Coverage was greater than 200× at each base.
In Patient-1 as well as in a Lebanese patient diagnosed with juvenile-onset non-autoimmune diabetes, we performed whole exome sequencing on the sequencing platform of the Centre National de Recherche en Génomique Humaine (CNRGH, Evry, France). Exomes were captured using the Agilent Sureselect All Exons Human V5+UTR (Agilent technologies, Santa Clara, CA, USA). Final libraries were then sequenced on a HiSeq2000 with paired ends, 100-bp reads. Reads were mapped to the reference GRCh37 using BWA-mem 0.7.5a. Variant discovery was done using GATK 3.3 (UnifiedGenotyper) according to GATK Best Practices recommendations. The sequencing coverage over the whole exome was 99.7% and 99.1% for a 10x depth of coverage resulting in a mean sequencing depth of 290x and 121X for Patient-1 and the Lebanese patient, respectively. We also performed WES in the 13 UDC-T2D patients heterozygous for ONECUT1 missense variants on the same platform. Sequencing coverage was on average 99.2% for a 10x depth, resulting in a mean sequencing depth of 117x on average (ranging from 86x to 139x). The joint variant calling file (VCF) was annotated with RefGene gene regions using ANNOVAR (2018–04–16). Exome variant analysis was then performed using an in-house python pipeline on genetic variation annotation results. Variants were filtered consecutively based on their quality (variant quality [Phred Q score] >20, genotype quality >20 and depth >5X), the predicted consequence on coding capacity (missense, nonsense, splice-site, and coding insertion/deletion-frameshift or in frame), and their rare status based on information available in public databases. All the variants identified by WES were confirmed by Sanger sequencing in the corresponding subjects and genotyped in available family members on PCR-amplified DNA.
In the two diabetic subjects (UDC-T2D Patients-3 and -4) heterozygous for two coding ONECUT1 variants (one rare coding variant together with the low frequency P75A variant), we determined the phase of the variants by two distinct methods. For Patient-4, double heterozygous for G96D and P75A, two variants distant from only 64 bp, we determined the phase from the WES data, considering the reads that covered both variants. On a total of 19 reads, the G96D-(D) was associated with the P75A-(P) (11 reads) or the G96D-(G) associated with P75A-(A) (8 reads), establishing that the rare G96D variant is in phase with P75A higher-frequency variant (rare and low-frequency variants in trans). For Patient-3, double heterozygous for P215A and P75A, that are distant from 420 bp, we performed allele-specific amplification of each allele followed by sequencing of the amplified fragments using the same primers; primers are shown in Supplemental Method Table 1b. This showed that the rare variant of P215A (A) coamplifies with the lower-frequency variant at P75A (A) (rare and low-frequency variants in cis).
Determination of HLA-DR risk alleles and of the T1D-GRS
HLA-DR genotypes for DR3, DR4 and DR15 were determined using tag SNPs rs2187668 and rs7454108 to tag DR3 (DRB1*0301-DQA1*0501-DQB1*0201) and DR4-DQ8 (DRB1*04-DQA1*0301-DQB1*0302) alleles respectively and SNP rs3129889 to tag HLA DRB1*1555. The type 1 diabetes genetic risk score (T1D-GRS) was determined using the genotypes of the top 10 risk alleles for T1D including the two HNS-DR tag SNPs above, according to Oram et al.56. The 10 SNPs T1D-GRS obtained was compared to the T1D-GRS distribution obtained with the same SNPs in a European T1D control population studied by Johnson et al.57: <25: below the 25th centile, >50: above the 50th centile, 25–50: between the 25th and 50th centile.
Genotyping of the m.3243A> G mitochondrial mutation
Genotyping of the m.3243A> G mutation was performed by PCR-RFLP method as described by Rong et al.60.
Characteristics of ONECUT1 variants: allele frequencies and predicted deleterious consequences
Allele and genotype frequencies of the variants were estimated in our study populations (German T2D patients and controls) and in publicly available reference populations: the Genome Aggregation Database (gnomAD; https://gnomad.broadinstitute.org), 141,456 subjects and the Exome Variant Server [EVS, NHLBI GO Exome Sequencing Project (ESP), Seattle, WA, release ESP6500SI-V2], 6503 subjects. The damaging consequences of ONECUT1 missense variants identified by sequencing were predicted using several prediction programs, available through the ANNOVAR web site (http://www.openbioinformatics.org/annovar/; date 15/10/2020).
Statistical analyses
Linkage study was performed by multipoint genetic analysis using Merlin software in a subset of family 1 (subjects 1,2,3,5) under a rare disease recessive model (allele frequency: 0.000001) with complete penetrance and no phenocopy. The parameters of the genetic model (allele frequencies, phenocopy rate and penetrance) for transmission of diabetes with respect to the ONECUT1-p.E231X variant in the extended family 1 were estimated by likelihood maximization using ILINK software (package fastlink.4.1P). The recombination rate between disease locus and variant was fixed to 0 (causative variant) and allele frequency of the variant was fixed to 0.000001 (absent in public databases). The affection status considered for modeling was diabetes in a broad sense, including neonatal diabetes and T2D/IFG.
Prevalence of T2D or IFG was compared within the extended family 1 between mutation carriers and normal homozygotes by logistic regression, with IFG defined based on fasting blood glucose ≥ 5.6 mmol/l (American Diabetes Association (ADA) criteria; https://www.diabetes.org), taking age and sex as covariates. Subjects 3 and 4, aged 14 and 15 years, were excluded from this analysis.
Prevalence of T2D or IFG was compared between mutation carriers from the extended family 1 and the general French population, surveyed for fasting blood glucose, using the same criteria18. Individuals were stratified in 4 risk groups based on age (30–54 and 55–74) and sex, and the prevalence in these defined risk groups was obtained from C. Bonaldi (pers. communication). The statistical analysis was performed by binomial convolution in these 4 risk groups. Individuals with ages <30 (subjects 3, 4 and 16) were excluded from the analysis. Statistical analyses of the German T2D populations were performed using JMP package (SAS Institute Inc.) or using R package (library survival). For survival analysis, log rank test was used to compare survival functions and Cox model was used to estimate the effect of rare variants risk factors on age of onset of diabetes.
To determine population ancestry, principal component analysis (PCA) was performed using EIGENSTRAT and SmartPCA (POPGEN) software from the EIGENSOFT package on the genotype data from the parents (300K SNP, Illumina) and from the child (Patient-1, WES). Genotype data were merged using PLINK v1.90. Control populations used for the analysis were those from the 1000 Genome project (WGS) as well as various European groups studied at the CNRGH (a total of more than 3000 individual).
Pluripotent Stem Cell assays and bioinformatics
Stem cell culture
Permission to culture and differentiate HUES8 cells into the pancreatic lineage was obtained from the Robert Koch Institute within the “79. Genehmigung nach dem Stammzellgesetz, AZ 3.04.02/0084”. Human ESCs and iPSCs were cultured at 5% CO2, 5% O2, and 37°C on hESC Matrigel coated plates in mTESR1 (STEMCELL Technologies) medium with daily change of medium. Cells were split twice a week with TrypLE Express (Invitrogen) to enable feeder-free single cell cultures. For splitting, cells were washed with PBS and dissociated with TrypLE for 3 – 5 minutes at 37°C. Enzymatic reaction was stopped by diluting with blank medium and cell suspension was centrifuged at 800 rpm for 5 min, supernatant was discarded, and cells were carefully resuspended in mTESR1 medium supplemented with 10 µM ROCK inhibitor (Abcam) for improved cell survival.
Reprogramming of fibroblasts
Reprogramming of human fibroblasts was approved by the Ulm University ethics committee (#232/17) and performed according to 61. Briefly, fibroblasts were cultured on gelatin-coated cell culture dishes in Dulbecco’s modified eagle medium (DMEM, Gibco) supplemented with 2 mM Glutamine, 1x non-essential amino acids, 1 mM sodium pyruvate, 10% fetal calf serum (FCS) and Penicillin/Streptomycin. After reaching 50% confluency, fibroblasts were infected with hOKSM-dTomato lentivirus on two consecutive days followed by transfer on irradiated rat embryonic fibroblast (REF) feeder cells on day 3. Growing colonies of human induced pluripotent stem cells (iPSCs) were mechanically picked, expanded on REF feeder cells and later adapted to feeder-free culture conditions. Reprogramming of patient fibroblasts (Patient-1, ONECUT1-p.E231X) yielded one viable iPSC clone. In addition, one clone of iPSCs derived from a healthy proband served as control.
Genome editing in PSCs
For ONECUT1 knock-out in HUES8 cells, CRISPR RNA (crRNA) were designed using “http://crispor.tefor.net/” designing tool. Cloning guide oligonucleotides (guide RNA, gRNA) in a gRNA cloning plasmid (a gift from George Church; Addgene plasmid #41824) was based on a previously published strategy62. PSCs were transfected with XtremeGene 9 DNA transfection reagent (SIGMA) according to manufacturer’s protocol, introducing two gRNA plasmids and pCas9_GFP vector (a gift from Kiran Musunuru; Addgene plasmid #4471963) into the cells. Briefly, 200,000 cells were seeded on a 6-well one day prior to transfection and 2 µg of each plasmid were transfected with 18 µl of XtremeGene 9 reagent (3:1 ratio). GFP+ cells were sorted 24 h after transfection and plated for single-cell seeding in media containing 10 µM ROCK inhibitor and 0.5 µM Thiazovivin (Calbiochem). Single colonies were mechanically isolated, replated and analyzed for ONECUT1 gene knock-out. The applied paired guide approach to delete a large DNA fragment by two simultaneous double-strand breaks allowed efficient PCR screening by one external PCR flanking the site of deletion and one internal PCR within the deleted sequence. Homozygous ONECUT1 knock-out clones were positive for the external PCR, but negative for the internal PCR. Gene editing yielded one HUES8 clone with homozygous ONECUT1 KO.
HUES8 cells with truncated ONECUT1 were generated using a zinc finger nuclease approach. Zinc fingers were designed to target position E231 of ONECUT1 and respective plasmids were introduced by nucleofection using the Amaxa Nucleofector Kit (Lonza). Following nucleofection, cells were seeded in media containing 10 µM ROCK inhibitor and cultured for 4 days. Finally, cells were seeded in low density to achieve single-cell clones, which were mechanically isolated for genotyping and further expansion. This editing approach led to two homozygous HUES8 clones, where one clone was characterized in more detail.
For editing of HUES8 ONECUT1 E231D, synthetic single guide RNAs (sgRNAs, Synthego) as well as a ssDNA repair template were introduced with Lipofectamin Stem Reagent according to manufacturer. Single cell clones were screened for indels or targeted mutation within ONECUT1. Sequences of crRNAs, ZFN arms, sgRNAs and primers used for screening after gene editing are available in Supplemental Method Table 2 and 3.
DNA isolation and PCR reaction
After clonal expansion, half of a colony was used for DNA isolation, while the other half of the colony was further cultivated for expansion of successfully edited clones. DNA was isolated using either DNeasy Blood and TissueKit (Quiagen) or Tissue Genomic DNA Purification Mini Prep Kit (Genaxxon) according to manufacturer’s instructions. For the initial PCR screening, 30–150 ng DNA was used as template with GoTaq Flexi DNA Polymerase (Promega), for low DNA input (0–30 ng) the RedMastermix (2x) Taq PCR Mastermix (Genaxxon). Clonal genotype was validated by Sanger sequencing (Eurofins Genomics). Results were confirmed on DNA isolated after expansion of clones, and KO was validated on transcriptomic and proteomic level.
Differentiation of PSCs into pancreatic progenitor cells
Pancreatic differentiation for HUES8 and iPSCs was reported previously8,9. Basal media for differentiation culture were (i) BE1: MCDB131 (Invitrogen) with 0.8 g/l cell culture tested glucose (Sigma), 1.174 g/l sodium bicarbonate (Sigma), 0.5% fatty acid free BSA (Proliant), 2 mM L-Glutamine. For iPSC differentiation, BSA concentration was reduced to 0.1% in BE1 for the first three days. (ii) BE3: MCDB131 with 3.32 g/l glucose, 1.754 g/l sodium bicarbonate, 2% FAF-BSA, 2 mM L-Glutamine, 44 mg/l L-Ascorbic acid, 0.5% ITS-X.
For differentiation, PSCs were seeded on culture plates coated with growth factor reduced Matrigel (BD, 354230) using 300,000 cells per 24-well in mTesR1 containing 10 µM ROCK. The next day, when cells reached 80% confluence, differentiation was initiated after washing with PBS (Sigma) in BE1 medium with 2 µM CHIR99021 (Axon MedChem) and 100 ng/mL Activin A (R&D) (day0-medium). After 24 h, the medium was replaced by BE1 supplemented with 100 ng/ml Activin A and 5 ng/ml bFGF (R&D). Two days later, cells at DE stage were treated with 50 ng/ml FGF10 (R&D), 0.75 µM Dorsomorphin (Sigma) and 3 ng/ml Wnt3a (Peprotech) in BE1 for three days. Next, media was changed to BE3 containing 0.25 µM SANT-1 (Sigma), 200 nM LDN-193189 (Sigma), 2 µM Retinoic acid (Sigma), and 50 ng/ml FGF10. After 3 days, (at PE stage, from day 9 to 13) the cells received BE3 supplemented with 100 ng/ml EGF (R&D), 200 nM LDN, 330 nM Indolactam V (Stem Cell Technologies) and 10 mM Nicotinamide (Sigma) for another 4 days. Of note, differentiation of HUES8 E231D was performed without Indolactam V (ILV), a potent activator of protein kinase C (PKC) at PE stage to produce high yields of PDX1+/NKX6.1+ pancreatic progenitors. During differentiation, cells were cultured at 37°C in a 5% CO2 incubator with daily media change.
Differentiation of PSCs into β-like cells
ONECUT1 null and WT PSCs were differentiated across several stages toward β-like cells according to Rezania, et al. 64 and Mahaddalkar, et al. 65. Briefly, cells were differentiated to definitive endoderm seeded on culture plates coated with growth factor reduced Matrigel. Subsequently, cells were harvested with gentle cell dissociation reagent (GCDR, Stemcell Technologies) and 30,000 cells were seeded in round bottom ultra-low attachment plates (96-well, Corning) in mTesR containing 10 µM ROCK for aggregation. Cells were cultured at 37°C in a 5% CO2 incubator and switched to differentiation media with daily media change the following day. Cells were harvested on day 13 (stage 5) and day 16 (stage 6) for marker expression analysis.
Cell culture and preparation of cell extracts
Cell lines HEK293 (ATCC CRL 1573) and HeLa (ATCC CCL 2) were cultivated in DMEM supplemented with 10% FCS, and Penicillin/Streptomycin. For Western blotting and immunoprecipitation experiments whole-cell lysates were prepared essentially as previously described66. Protein concentrations were determined using the Bradford assay method (BioRad).
Quantification of insulin secretion
For insulin secretion, from three independent differentiations two to three spheres were collected on day 19 (stage 6) and transferred to one 96-well (n=3, biological replicates). Spheres in three 96-wells (n=3, technical replicates) were washed twice in wash buffer (KRBH buffer containing 0.1% BSA) and incubated for 1h at 37°C in 150 µl KRBH buffer containing 0.1% BSA and 0.1 mM Glucose. Spheres were washed, supernatant replaced with fresh KRBH buffer containing 0.1% BSA and 0.1 mM Glucose and collected after 1h at 37°C. Subsequently, spheres were washed and incubated in KRBH buffer containing 0.1% BSA and 30 mM KCl for 15 min at 37°C. Supernatant was collected and secreted insulin was quantified using an insulin ELISA KIT (ALPCO) normalized to total cell number per well.
NKX6.1 reporter constructs
Coordinates for the candidate NKX6.1 enhancers E1-E3 are: E1: chr4:85354431–85356380, E2: chr4:85356591–85358458, E3: chr4:85358376–85359476 based on hg19. Candidate enhancers were amplified from human genomic DNA by PCR and cloned into the GFP reporter vector pSinTK (PMID: 21160473) using the polymerase incomplete primer extension (PIPE) cloning method (PMID: 18004753). Lentiviruses were constructed by cotransfecting the pSinTK with pCMV R8.74 and pMD.G helper plasmids into HEK293T cells. Viral supernatant was collected and concentrated by ultracentrifugation for 2 hours at 19,400 rpm using an Optima L-80 XP Ultracentrifuge (Beckman Coulter). Undifferentiated CyT49 hES cells were transduced with the reporter virus on two consecutive days and maintained with the addition of 300 μg/ml Geneticin (G418 antibiotic) for selection of transduced cells. After one to two weeks of antibiotic selection, the cells were differentiated as described 67. At the appropriate stages of differentiation, aggregates were collected for imaging. For cell imaging, 40 μl of cell aggregates were washed in PBS, placed in an optically clear glass bottom dish (MatTek) and imaged at 20x magnification. Images from each time point were acquired using the identical exposure time with a Zeiss Axio-Observer-Z1 microscope and a Zeiss AxioCam digital camera. Cell aggregates were also fixed, embedded in Optimal Cutting Temperature Compound (Tissue-Tek), sectioned, and analyzed by immunocytochemical analysis as described.
Flow cytometry
Differentiation efficiency was determined by flow cytometry. For definitive endoderm (DE) stage, surface markers c-Kit (CD117) and CXCR4 (CD184) were quantified, for pancreatic endoderm (PE) and pancreatic progenitor (PP) stage transcription factors PDX1 and NKX6.1 and for endocrine cells C-peptide, glucagon and NKX6.1 were analyzed.
Surface marker staining:
After harvesting cells from a 24-well with TrypLE Express (Invitrogen), cells were washed with FACS buffer (2% FCS in PBS) followed by blocking (10% FCS in FACS buffer) for 20 min on ice. After washing in FACS buffer, cell pellets were resuspended in FACS buffer containing PE-conjugated CXCR4 antibody (Life Technologies). First, cells were incubated on ice for 30 min. Second, APC-conjugated c-Kit antibody (Life Technologies) was added for additional 15 min. Cells were washed and resuspended in FACS buffer supplemented with 100 ng/ml DAPI to assess cell viability. Before analysis on a BD LSC II flow cytometer, samples were filtered through a 50-μm mesh.
Intracellular marker staining:
For intracellular marker staining, HUES8 cells from a 24-well were harvested as described above, washed with PBS, and fixed in PFA solution (PBS with 4% PFA and 10% Sucrose) for 25 min on ice. After fixation, cells were washed twice with PBS and blocked (5% donkey serum and 0.1% Triton-X-100 in PBS) for 30 min on ice. Following blocking, cells were washed twice with Wash Solution (2% donkey serum and 0.1% Triton-X-100 in PBS) and incubated overnight at 4°C with primary antibodies PDX1 (R&D) and NKX6.1 (DSHB) or C-peptide (Cell signaling), glucagon (Sigma) in Blocking Solution. The next day, cells were washed three times and incubated on ice with donkey Alexa Fluor secondary antibodies (Invitrogen) in Blocking Solution for 90 min on ice. For endocrine cells, an additional staining step using NKX6.1-APC (BD Biosciences) was included. Finally, cells were washed three times with Wash Solution, filtered through a 50-μm mesh into FACS tubes, and analyzed on a BD LSR II flow cytometer.
Immunofluorescence staining
For In-Well immunofluorescence staining, cells were seeded and differentiated on µ-Plate 24-wells (Ibidi). After washing with PBS, cells were fixated in 4% PFA solution for 20 min at RT and washed three times with PBS. Quenching with 50 mM NH4Cl for 10 min was followed by washing with PBS. Subsequently, cells were incubated in Blocking Solution (5% donkey serum and 0.1% Triton-X-100 in PBS) for 45 min at room temperature followed by staining with primary antibodies overnight at 4°C. The next day, cells were washed twice with Wash Solution (2% donkey serum and 0.1% Triton-X-100 in PBS) and incubated with respective secondary antibodies for 1.5 h at room temperature. Finally, after PBS washing nuclei were counterstained with 500 ng/ml DAPI and images were acquired on a Keyence Biozero BZ-9000 microscope. The following antibodies were used: OCT3/4 (Santa Cruz), NANOG (Cell Signaling), SOX17 (R&D), PDX1 (R&D), NKX6.1 (DSHB) together with Alexa-conjugated secondary antibodies from Invitrogen.
Pancreatic spheres were fixed in PFA solution (PBS with 4% PFA and 10% Sucrose) overnight and subsequently kept in 1 M sucrose in PBS overnight on a rotating platform. Spheres were embedded in O.C.T. freezing compound (Tissue-Tek) and cryoblocks were sectioned at 7 µm. Immunofluorescent stainings were performed similarly to In-Well staining with NKX6.1 (DSHB) and C-peptide (Cell signaling) primary antibody. Slides were mounted with Fluoromount-G (Southern Biotech). Images were acquired using a Zeiss ApoTome.
Western Blot for ONECUT1 and Actin
Proteins of pancreatic cells generated from ESCs were extracted with radioimmunoprecipitation assay (RIPA) buffer supplemented with protease inhibitor cocktail. Proteins (30–40 µg protein lysate) were separated on 10% SDS page and transferred on an Immobilon-P PVDF membrane (Millipore) using the Transblot semidry transfer system (Bio-Rad). Membranes blocked in TBS+0.1% Triton-X (TBS-T) with 3% BSA for 1 h at RT were incubated over night (ON) at 4°C with primary antibody in blocking solution, washed in TBS-T and subsequently incubated with secondary antibody for 1 h (Supplemental Method Table 4 and 5). Detection of horseradish peroxidase (HRP) was performed with SuperSignal West Dura Kit (Thermo Scientific) and Chemiluminescence Imaging - Fusion SL system (VILBER).
The following primary and secondary antibodies were used: anti-ONECUT1 (SantaCruz), anti-β-Actin (Sigma), anti-mouse-HRP and anti-rabbit-HRP (ECL anti-rabbit or mouse IgG, GE Healthcare).
RNA isolation of fixed and permeabilized cells after cell sorting
Differentiated cells were harvested, washed in PBS and filtered through a 40-µm mesh followed by fixation for 30 min on ice in 4% PFA containing 0.1% saponin and RNasin Plus Ribonuclease Inhibitors (Promega). Cells washed in PBS supplemented with 0.2% BSA, 0.1% saponin and RNasin were stained with anti-PDX1-PE and anti-NKX6.1-Alexa647 (BD Biosciences) in PBS with 1% BSA, 0.1% saponin and RNasin for 60–90 min at 4°C on a rotating shaker and after two washing steps were sorted for PDX1+/NKX6.1+ cells. Subsequently, sorted cells were lysed for 3 h at 50°C in digestion buffer containing protease, then incubated for 15 min at 80°C. Further purification steps were performed according to the RecoverAll Total Nucleic Acid Isolation Kit (Life technologies).
RNA isolation, reverse transcription and qPCR
Total RNA from ESC-derived pancreatic cells was isolated using GeneJET RNA Purification Kit (Thermo Fisher Scientific) according to manufacturer’s instructions. For quantitative PCR (qPCR), 500 ng - 1 µg of total RNA was reverse transcribed with the iScript cDNA Synthesis Kit (Bio-Rad) and 40 ng of cDNA were utilized for PCR reactions with the SensiMix SYBR Kit (Bioline) and QuantStudio 3 Real-Time PCR System (Thermo Fisher Scientific). QuantiTect primers (Qiagen) were used with hydroxymethylbilane synthase (HMBS) as endogenous control gene.
RNA sequencing
After quality check with samples reaching RNA integrity values RIN > 8, up to 1 µg of total RNA was used for poly-A enrichment and subsequent library preparation with the TrueSeq stranded mRNA Kit from Illumina (HUES8 n=6). Subsequent RNA-seq was performed on a HiSeq 3000 system (Illumina, single read, 1×50bp) at the Biomedical Sequencing Facility (BSF) of the CeMM in Vienna, Austria.
Reads were aligned with STAR aligner (Version 2.5.2b) on human genome hg38 and using Ensembl Transcriptome Annotation e87 as transcriptome reference. STAR parameters followed options suggested by the ENCODE project. Next, DESeq2 (version 1.22.1) was used for normalization and differential expression analysis. Only genes with at least 10 reads, an adjusted p-value < 0.05 and abs(FC) > 1.5 were considered. Clustering of gene expression is based on a fuzzy c-means algorithm (R package e1071). This pipeline was performed to cluster data from HUES8 (ESC, DE, PE and PP stages on WT, ONECUT1 KO and truncated ONECUT1 cells).
Gene Set Enrichment Analysis (GSEA, Broad Institute)
Lists of differentially regulated genes and corresponding log2-fold change (FC) from RNA-seq were analyzed with GSEA 3.0 using GSEAPreranked with 1000 permutations in default settings. For analysis, we used the following gene sets: Pancreatic progenitor genes were retrieved from Cebola et al.24 with 500 pancreatic multipotent progenitor cell (MPC)-specific genes. For endocrine development, we used 152 endocrine lineage genes from Hrvatin et al.25 for GSEA analysis. We also used gene signatures of pancreas cells from the single cell RNA-seq study for deriving signatures of Alpha, Acinar, Beta, Delta, Ductal and Mesenchymal cells obtained from GEO GSE81547.
ATAC-sequencing
For ATAC-sequencing, 50,000 cells of ESC-derived pancreatic cells were harvested, washed with PBS and directly lysed in tagmentation buffer containing TDE1 Tagment DNA enzyme, Digitonin and protease inhibitor cocktail (Nextera DNA Library Preparation Kit, Illumina). After 30 min incubation at 37°C, samples were purified with MicroElute Kit (Qiagen) and subsequently processed and analyzed at BSF in Vienna (n=3).
ChIP-sequencing
For ChIP-seq, the ChIP-IT High-Sensitivity kit (Active Motif) was used according to the manufacturer’s instructions. Briefly, aggregates containing approximately 107 cells were fixed for 15 min in an 11.1% formaldehyde solution, chromatin was extracted by lysing cells in a Dounce homogenizer followed by shearing via sonication in a Bioruptor®Plus (Diagenode), on high for 3 × 5 min (30 sec on, 30 sec off). For immunoprecipitation, 10–30 μg of the sheared chromatin was incubated with 4 μg primary antibody ON at 4°C on an end-to-end rotator, followed by incubation with Protein G agarose beads for 3 h at 4°C on the rotator. Reversal of crosslinks and DNA purification were performed according to the ChIP-IT High-Sensitivity instructions with an incubation at 65°C for 2 h. DNA libraries were constructed using KAPA DNA Library Preparation Kits for Illumina® (Kapa Biosystems) and library sequencing was performed using a HiSeq 4000 System (Illumina®) with single-end reads of 50 bp in the Institute for Genomic Medicine (IGM) core research facility at the University of California at San Diego (UCSD). Additional details on the employed data sets are reported also in 52,53
Analysis of ATAC-seq and ChIP-seq
Reads were trimmed with skewer (Version 0.2.1) and aligned with Bowtie2 to the human hg19 genome (Version 2.3.4.2). For ATAC-seq, only properly mapped pairs were further considered, and duplicates were removed. We used MACS2 (2.1.2) with FDR of 5% to find condition-specific peaks using corresponding input DNA and replicates. For ONECUT1 ChIP-seq, we have performed de-novo analysis with MEME-ChIP (Version 4.12). The same pipeline was also used to re-analyze public TF ChIP-seq data (FOXA1, FOXA2, PDX1, NKX6.1) and activating histone ChIP-seq (H3K4me1, H3K27ac) deposited at GEO GSE54471 and promoter associated ChIP-seq histone marks (H3K4me3) deposited at ArrayExpress E-MTAB-1086 for pancreas progenitors and E-MTAB-1919 for Islets.
Concerning ATAC-seq, we used THOR (Version 0.11.6; 68) to detect regions with differential peaks between consecutive differentiation steps in wild type (WT) cells (ESC vs. DE, DE vs. GTE, GTE vs. PE and PE vs. PP) and to compare WT and ONECUT1 KO condition for each day (p-value < 10−5). We combined all differential peaks in WT condition and quantified the number of reads per peak, which were first normalized by library size and then by removing the mean and scaling to unit variance and performed clustering with fuzzy c-medoids using Pearson correlation as similarity metric. Next, we used HINT-ATAC (Version 0.11.8) to find footprints at each condition analyzed after combining replicate libraries (ESC WT, ESC KO, DE WT, and so on). We then performed motif matching of footprint sequences using JASPAR 2018 and MotifMatching from the Regulatory Genomics Toolbox (RGT; www.regulatory-genomics.org/rgt). Finally, differential footprint analysis was performed by comparing WT and ONECUT1 KO conditions using HINT-ATAC. We only considered TFs with a high change in TF activity (p-value < 0.05).
For both ATAC-seq and ChIP-seq, genomic algebra operations were performed with bedtools and peak enrichment analysis was performed with GREAT. Deeptools was used to create histone and ATAC-seq signal heatmaps. Finally, T2D and BMI variants (p-value < 10−8) were obtained from the DIAMANTE meta-analysis study. We also obtained open chromatin regions from distinct pancreas cells (alpha, beta, acinar, ductal) and liver from diabetes epigenome atlas (https://www.diabetesepigenome.org/). Binding enrichment test (Fig. 3b) comparing gene sets with peaks was based on a z-score test, which estimates if the number of genes close to a peak (tss +/− 20kb) is higher than in random generated peaks (1000 randomizations). Enrichment test between two peak sets (Fig. 3c) are based on an intersection test. Both tests are implemented at RGT. P-values are adjusted for multiple test correction using the Bonferroni method.
Functional enrichment analysis
Gene Ontology enrichment analysis of differentially downregulated genes (RNA-seq) or differentially closed chromatin (ATAC-seq) in ONECUT1 depleted cells was performed with ToppFun (FDR correction, p-value cut off at 0.5) of ToppGene Suite. Adjusted p-values for terms related to GO: biological function, mouse phenotype or pathway are shown.
Mass spectrometry
In-solution digest:
Triplicates from PP stage HUES8 WT, KO, and trunc were lysed in urea lysis buffer (8 M urea, 40 mM Tris (pH 7.6), 1x EDTA-free protease inhibitor (cOmplete™, Sigma Aldrich) and 1x phosphatase inhibitor mixture). After lysing, cells were centrifuged for 20 min at 20,000 x g and 4°C. For each sample, 50 µg protein was further processed for digestion. Therefore, samples were reduced with 10 mM DTT for 45 min at 37°C on a Thermoshaker (700 rpm) and alkylated with 55 mM CAA for 30 min at RT in the dark. After diluting the samples with 40 mM Tris (pH 7.6) to a urea concentration <1.6 M, trypsin (Trypsin Sequencing Grade, Roche) was added 1:100 (enzyme:protein) and incubated for 3 h at 37°C and 700 rpm. After pre-incubation, trypsin was added again 1:100 (enzyme:protein) and incubated overnight at 37°C and 700 rpm.
StageTip Desalting:
After digestion, samples were acidified to ~1% formic acid (FA) and desalted via StageTips as described earlier69. Briefly, five C18 discs (3M Empore™) were packed into a 200 µl pipette tip and put through the lid of a 1.5-ml Eppendorf tube. After wetting the column with 0.1% FA in 60% acetonitrile (ACN) and equilibration with 0.1% FA, acidified samples (pH 2) were loaded onto the StageTip. After washing off unspecific binders by two rounds of washing with 0.1% FA, peptides were eluted using two times 40 µl of 0.1% FA in 60% ACN. Samples were further frozen at −80°C and dried using a Speed-Vac.
TMT labeling:
TMT labeling was performed as previously described 70. Briefly, digests were reconstituted in 20 µl of 50 mM HEPES (pH 8.5) and 5 µl of 11.6 mM TMT 10-plex (Thermo Fisher) in 100% anhydrous ACN was added to each sample. After incubating the samples for 1 h at 25°C and 400 rpm, the reaction was stopped using 2 µl of 5% hydroxylamine. All nine TMT labeled samples were pooled and the reaction vessels were rinsed with 20 ⌠l of 10% FA in 10% ACN for 5 min and 400 rpm, and also added to the pooled samples. The samples were frozen at −80°C and dried.
Sep-Pak desalting:
Pooled samples were further desalted using 50 mg Sep-Pak columns (Waters Corp.). The columns were first wetted with 100% ACN, followed by 0.1% FA in 50% ACN and further equilibrated with three washes of 0.1% FA. The dried pooled samples were reconstituted in 1 ml of 0.1% FA and loaded twice onto the column. After washing off unspecific binders with three times 0.1% FA, peptides were eluted using 200 µl of 0.1% FA in 50% ACN. Samples were frozen at −80°C and dried.
hPH reversed phase fractionation (48 fractions):
For high pH reversed phase fractionation, dried samples were reconstituted in MS-grade water with 10% fractionation buffer A (25 mM ammonium bicarbonate, pH 8) and centrifuged for 5 min at 20,000x g and 4°C. The supernatant was then loaded on a C18 column (XBridge BEH130, 3.5µm, 2.1×150mm, Waters Corp), which was connected to a Dionex Ultimate 3000 HPLC system (Thermo Fisher). After injecting 200 µg protein digest of the sample at a flow rate of 200 µg/min, the system was equilibrated for 5 min with 85% fractionation buffer B (MS-grade water), 10% fractionation buffer A and 5% fractionation buffer C (ACN). Peptides were eluted in a three-step linear gradient from 5% to 9% buffer C in 2 min with a constant amount of 10% buffer A. Then, a linear gradient from 9% to 47% buffer C in 91 min and from 47% to 55% buffer C in 3 min (with buffer A being constant at 10%) was used.
Starting from minute 3, 96 fractions (1 fraction/min) were collected in a 96-well plate and pooled to 48 fractions. For that, column 7 was pooled to column 1, column 8 was pooled to column 2 and so forth. All fractions were frozen at −80°C and dried using a Speed-Vac.
LC-MS/MS data acquisition:
Fractionated samples were measured in data-dependent acquisition mode using a nanoflow LC-MS/MS by coupling a Dionex Ultimate 3000 UHPLC+ system to a Fusion Lumos Tribrid mass spectrometer (Thermo Fisher Scientific). Dried samples were reconstituted in 0.1% FA and approximately 1 µg peptides were injected. The sample was loaded to a trap column (75µm x 2cm, packed in-house with 5µm C18 resin; Reprosil PUR AQ, Dr. Maisch) with a flow rate of 5 µl/min and washed for 10 min with 0.1% FA. Subsequently, peptides were separated on an analytical column (75µm x 40cm, packed in-house with 3µm C18 resin; Reprosil PUR AQ) with a flow rate of 300 nl/min and a linear 50 min gradient from 8% to 34% LC buffer B (0.1% FA, 5% DMSO in ACN) in LC buffer A (0.1% FA, 5% DMSO in MS-grade water). The eluate was sprayed via a stainless-steel emitter into the mass spectrometer, which was run in positive ion mode. Fullscan MS1 spectra were acquired in the Orbitrap with 60,000 resolution and a scan range from 360–1300m/z (automatic gain control target of 4e5 charges, maximum injection time of 50 ms). A cycle time of 2 sec and a dynamic exclusion of 90 sec was used. MS2 spectra were recorded in the Ion Trap in rapid mode via sequential isolation of up to 10 precursors and the following settings: an automatic gain control target of 2e4, maximum injection time of 60 ms, isolation window of 0.7m/z, and fragmentation via CID (NCE of 35%). For the following MS3 scan, the 10 most intense precursors were further fragmented via HCD (NCE of 55%) and acquired in the Orbitrap with 50,000 resolution, scan range of 100–1,000m/z, automatic gain control target of 1.2e5 charges, maximum injection time of 120 sec and a charge-dependent isolation window from 1.3 (2+) to 0.7 (5–6+).
Data analysis:
Acquired raw files were searched with Maxquant v.1.5.7.4 against the UniProtKB human reference list (downloaded 22.07.2013). For the search settings, up to two missed cleavages were allowed, carbamidomethylation was defined as a fixed modification and oxidation of methionine, phosphorylation (STY) as well as N-terminal protein acetylation were set as variable modifications. Reporter ion MS3 was set as quantification type and TMT10plex as isobaric labels. The first search peptide tolerance was set to 20 ppm and the main search peptide tolerance was set to 4.5 ppm. Results were filtered by setting the protein and peptide false discovery rate to 1% using a classical target-decoy approach. Data analysis was mostly done with Perseus (v.1.6.1.1, 71). First, all reverse database hits, non-human contaminants, and peptides that were only identified by site were excluded from the results. Then, peptides with less than 2 valid values in each triplicate were removed and significant changes between WT, KO, and trunc were determined. For that, the S0 value was calculated like previously described72 and used to perform a two-sample Student’s t-test with an FDR of 0.05 in Perseus.
Plasmids and Cell Transfection
Generated expression constructs are listed in Supplemental Method Table 6.
HEK293 and HeLa cells were transfected using Lipofectamine 2000 transfection reagent (Invitrogen) according to the manufacturer’s instructions.
Fluorescence Microscopy
HeLa cells were plated (1×10⁵ cells/cm2) on chamber coverslips (Nunc). After 18 h, cells were transfected with 150 ng of expression plasmids for the specific GFP-fusion proteins. After 24 h, cells were rinsed with PBS, fixed with 4% paraformaldehyde and permeabilized with 0.1% Triton X-100. Specimens were embedded in ProLong© Gold antifade reagent (Invitrogen) supplemented with DAPI and stored at 4°C overnight. Cells were imaged using a fluorescence microscope (IX71, Olympus).
In vitro protein translation
The in vitro protein translation was performed as previously described66. Quality of in vitro translations was analyzed by western blotting.
Electro Mobility Shift Assay (EMSA)
In vitro translated Flag-tagged ONECUT1 proteins (TnT® Quick Coupled Transcription/Translation System, Promega) were used for electromobility gel shift assays in a binding buffer consisting of 10 mM Tris-HCl (pH 7.5), 100 mM NaCl, 0.1 mM EDTA, 0.5 mM DTT, and 4% glycerol. For binding reaction, 2 µg poly(dI-dC) (GE healthcare) and approximately 0.5 ng of 32P-labelled oligonucleotides were added. The sequence of the double-stranded oligonucleotide (ONECUT1_E_UP; 5´-CCT GGT TTT GAA ATC AAT ATG GAA TCG-3´; ONECUT1_E_DO; 5´-CTC GCG ATT CCA TAT TGA TTT CAA AAC-3´) corresponds to a high affinity ONECUT1 binding site73. Super shifting of complexes was achieved by adding 1 µg of anti-Flag (M5, Sigma) antibody. The reaction products were separated using 5% polyacrylamide gels with 1x Tris-glycine-EDTA at RT. Gels were dried and exposed to X-ray films (Kodak).
Co-Immunoprecipitation experiments
Co-immunoprecipitation experiments were carried out essentially as described previously74. Briefly, 24 h after transfection HEK293 (ATCC #CRL 1573) cells were lysed with 600 µl CHAPS lysis buffer (10 mM 3-[(3-Cholamidopropyl)dimethylammonio]-1-propanesulfonate hydrate (CHAPS, Merck), 50 mM Tris-HCl (pH 7.8), 150 mM NaCl, 5mM NaF, 1 mM Dithiothreitol (DTT, Merck), 0.5 mM Phenylmethanesulfonyl fluoride (PMSF, Merck) and 40 µl/ml “Complete Mix” protease inhibitor cocktail (Roche)). The extracts were incubated with 40 µl agarose-conjugated anti-Flag antibody (M2, Sigma) at 4°C ON, precipitates were washed 6 to 8 times with CHAPS lysis buffer and finally resuspended in SDS-polyacrylamide gel loading buffer. For Western blotting the proteins were separated in SDS-polyacrylamide gels and transferred electrophoretically to PVDF membranes (Millipore) for 1 h at RT and 50 mA using a Tris-glycine buffer system. After blotting, the membranes were pre-blocked for 1 h in a solution of 3% milk powder in PBS-T (0.1% Tween20 in PBS) before adding antibodies. The following antibodies were used: anti-GFP (Sigma), anti-Flag (M5, Sigma), and HRP-linked secondary antibody (GE Healthcare).
Luciferase assay
HeLa (ATCC #CCL2) cells were seeded in 48-well plates at a density of 2 × 10⁵ cells. After 16 h, transfection was performed with Lipofectamine 2000 (see above) using 250 ng of reporter plasmid alone or together with various amounts of expression plasmid (given in the corresponding figure). After 24 h cells were lysed, and luciferase activity was determined from at least six independent experiments with 10 µl of cleared lysate in a Centro LB960 luminometer (Berthold technology) by using the luciferase assay system from Promega.
Cell line summary.
Details on the employed cell lines are shown in Supplemental Method Table 7.
Statistical Analysis
Bar graphs are depicted as mean ± SEM. If not stated otherwise, statistical analysis for comparison of two groups was performed by unpaired t-test (two-tailed) and for more than two groups by ordinary one-way ANOVA (Tukey’s post test) with *p<0.05, ***p<0.01 and ***p<0.001 using GraphPad Prism software.
Extended Data
Extended Data Figure 1: Population ancestry studies of Family-1 and genetic analysis of ONECUT1 variants and T2D-associated SNPs.
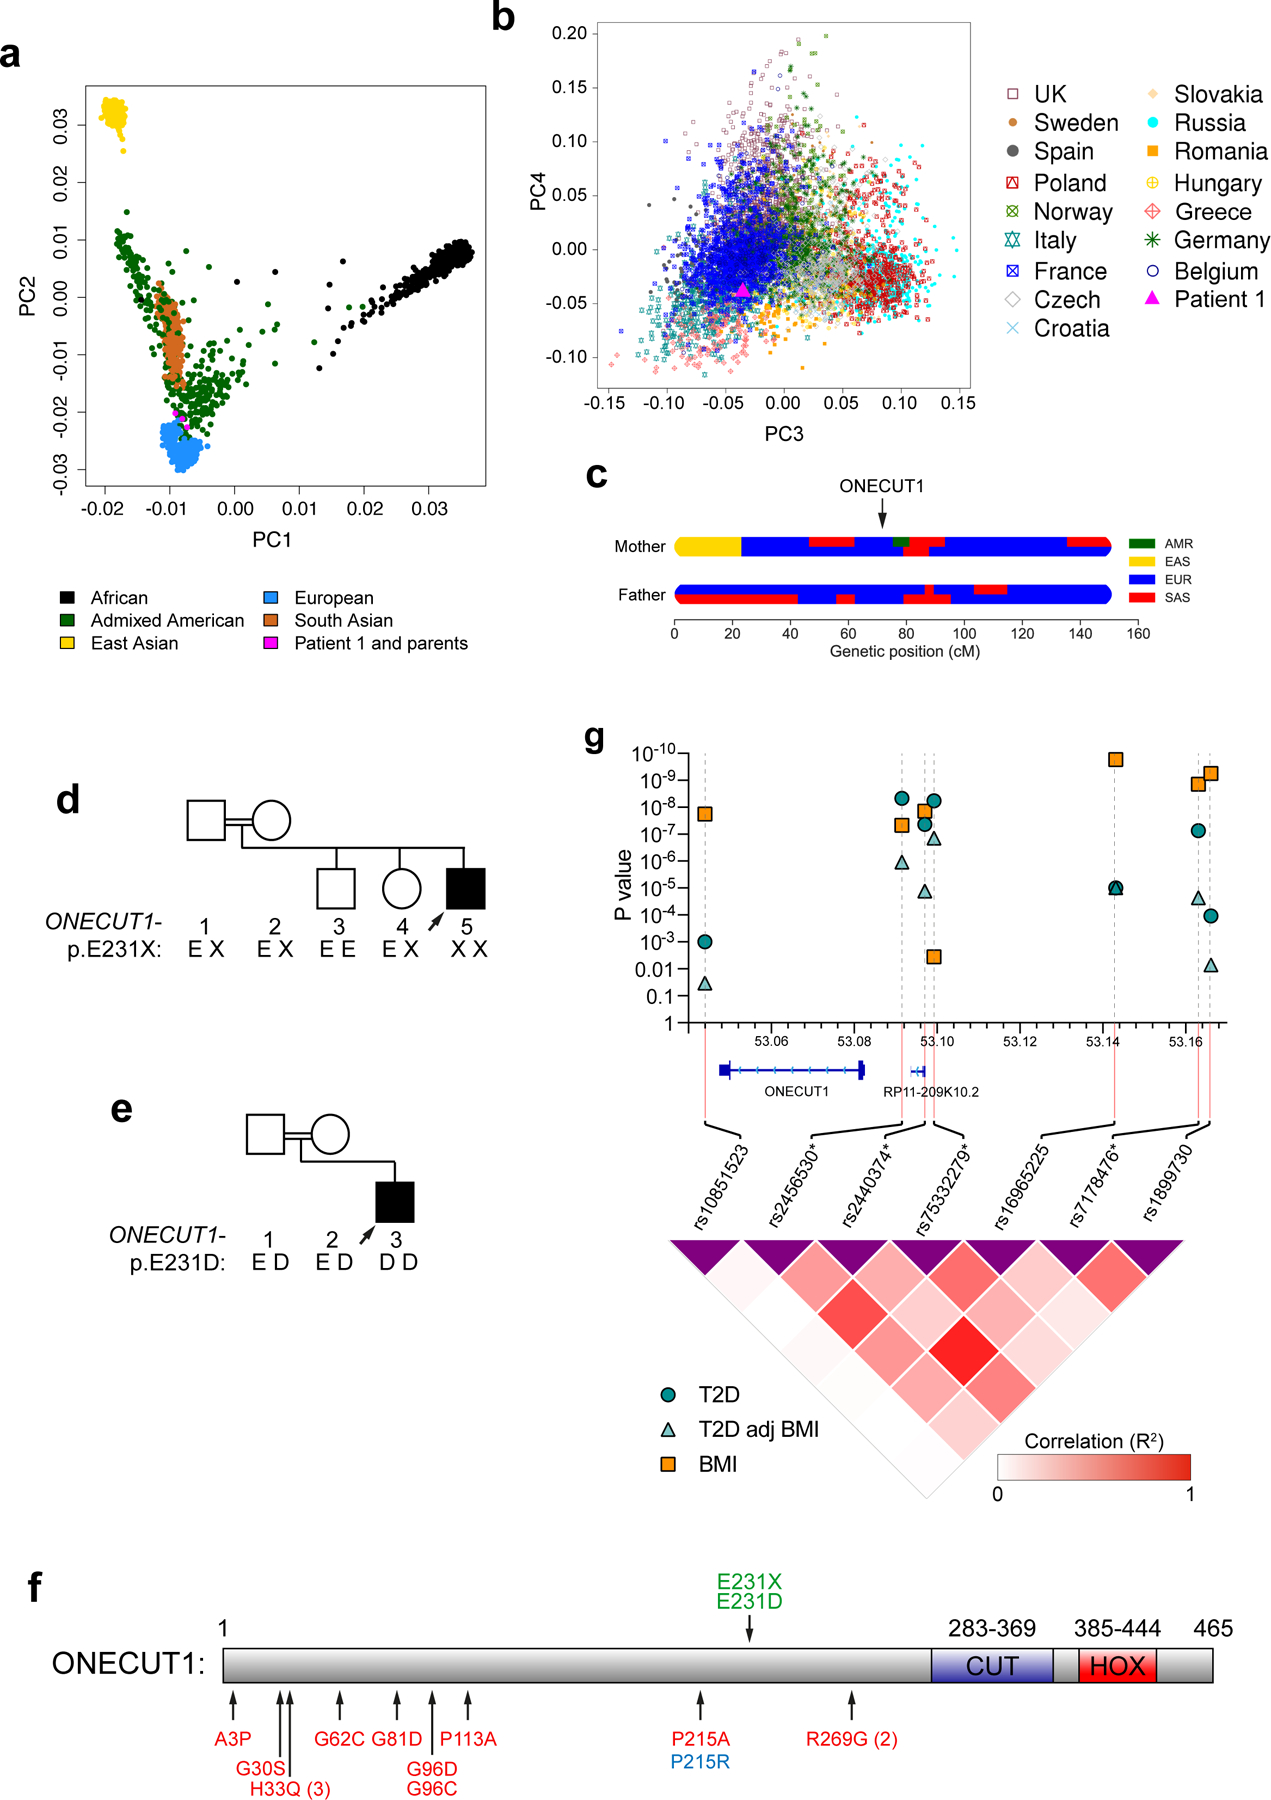
(a) Principal component analysis of Patient-1 and his parents compared to reference populations from the 1000 Genomes project10. (b) Principal component analysis of Patient-1 compared to European subpopulations, showing that he clusters within the French subpopulation. (c) Local ancestry analysis of parents from Patient-1 showing chromosome 15. The arrow shows the position of ONECUT1 locus on chromosome 15, estimated to be of European ancestry. Admixed American (AMR), East Asian (EAS), European (EUR), South Asian (SAS). (d) ONECUT1 sequencing in Patient-1 and his nuclear family (Family-1) identified a nonsense variant resulting in a truncated protein homozygous in this patient, heterozygous in both parents and one unaffected sibling and absent in the other unaffected sibling. (e) Targeted sequencing of Patient-2 and his nuclear family (Family-2) identified a homozygous missense variant p.E231D in this patient, heterozygous in both parents. (f) Schematic ONECUT1 protein representing rare coding variants identified in neonatal (homozygous) and young-onset (heterozygous) diabetic patients. Green: index patients with neonatal/very-early-onset diabetes (families 1 and 2), red: UDC-T2D population screening, blue: de novo, identified by WES in one patient. (g) T2D and BMI association in ONECUT1 region. P-values for association are based on DIAMANTE GWAS for T2D and T2D adjusted for BMI (T2DadjBMI), and on GIANT-UK Biobank GWAS for BMI, all of which were available on the AMP-T2D site (www.type2diabetesgenetics.org; date 10/2020). Statistics are shown for the 4 credible SNPs for T2D (*) and for three representative SNPs for BMI association. Pairwise linkage disequilibrium between SNPs was estimated using LDLINK in the European population (https://ldlink.nci.nih.gov) 21
Extended Data Figure 2: ONECUT1-depleted PSCs are defective in PP formation.
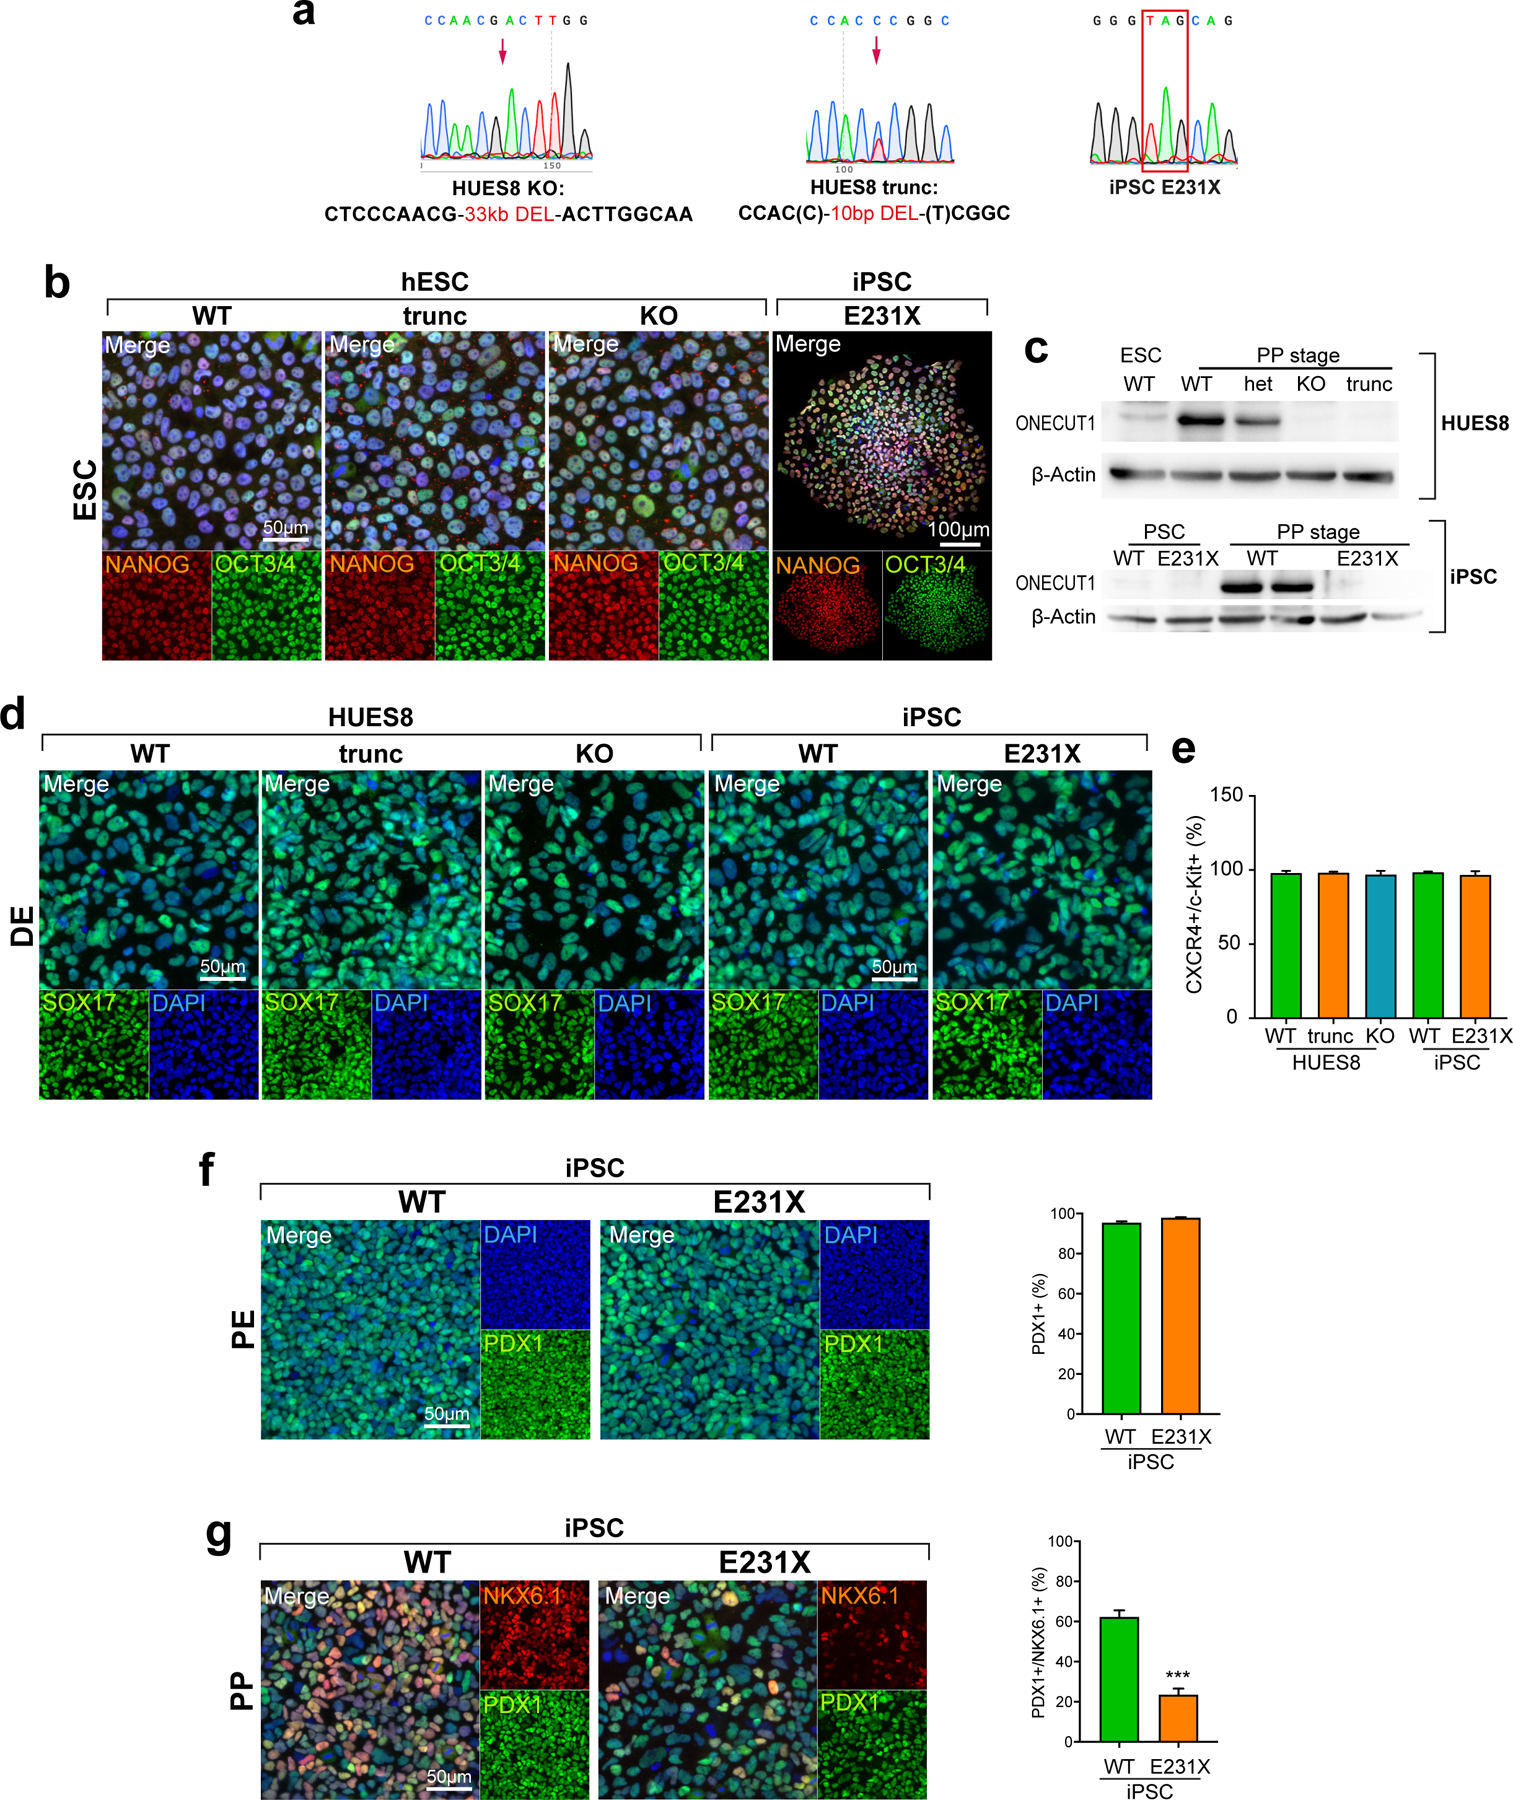
(a) ONECUT1 sequence analysis of respective ONECUT1 mutated HUES8 and iPSC cells. (b) Representative immunofluorescence stainings of pluripotency markers NANOG and OCT3/4 in ONECUT1 null and WT HUES8 ESCs as well as ONECUT1-p.E231X iPSCs. (c) Western Blot analysis for ONECUT1 and β-Actin in ONECUT1 null and WT HUES8 as well as iPSC differentiated to pancreatic progenitor (PP) cells. Of note, HUES8 heterozygous ONECUT1 KO (het) was included and undifferentiated stem cells serve as control (ESC, PSC). (d,e) Differentiation efficiency of HUES8 and iPSC ONECUT1 null and WT cells to definitive endoderm (DE) was analyzed by markers SOX17 or CXCR4 and c-Kit as shown by representative immunofluorescence images (d) and flow cytometry (e; HUES8: n=4; iPSC: n=3). (f,g) Differentiation efficiency of ONECUT1 null iPSC cells and respective WT cells to pancreatic endoderm (PE) and pancreatic progenitors (PP) was analyzed by markers PDX1 and NKX6.1 as shown by representative immunofluorescence images and flow cytometry with 62% reduction of PP cells in iPSC ONECUT1 E231X (PE: n=2, PP: n=3; with 2 replicates; two-tailed, unpaired t-test).
Extended Data Figure 3: Intrinsic defects in ONECUT1-depleted PP cells disturb launching of the β-cell program.
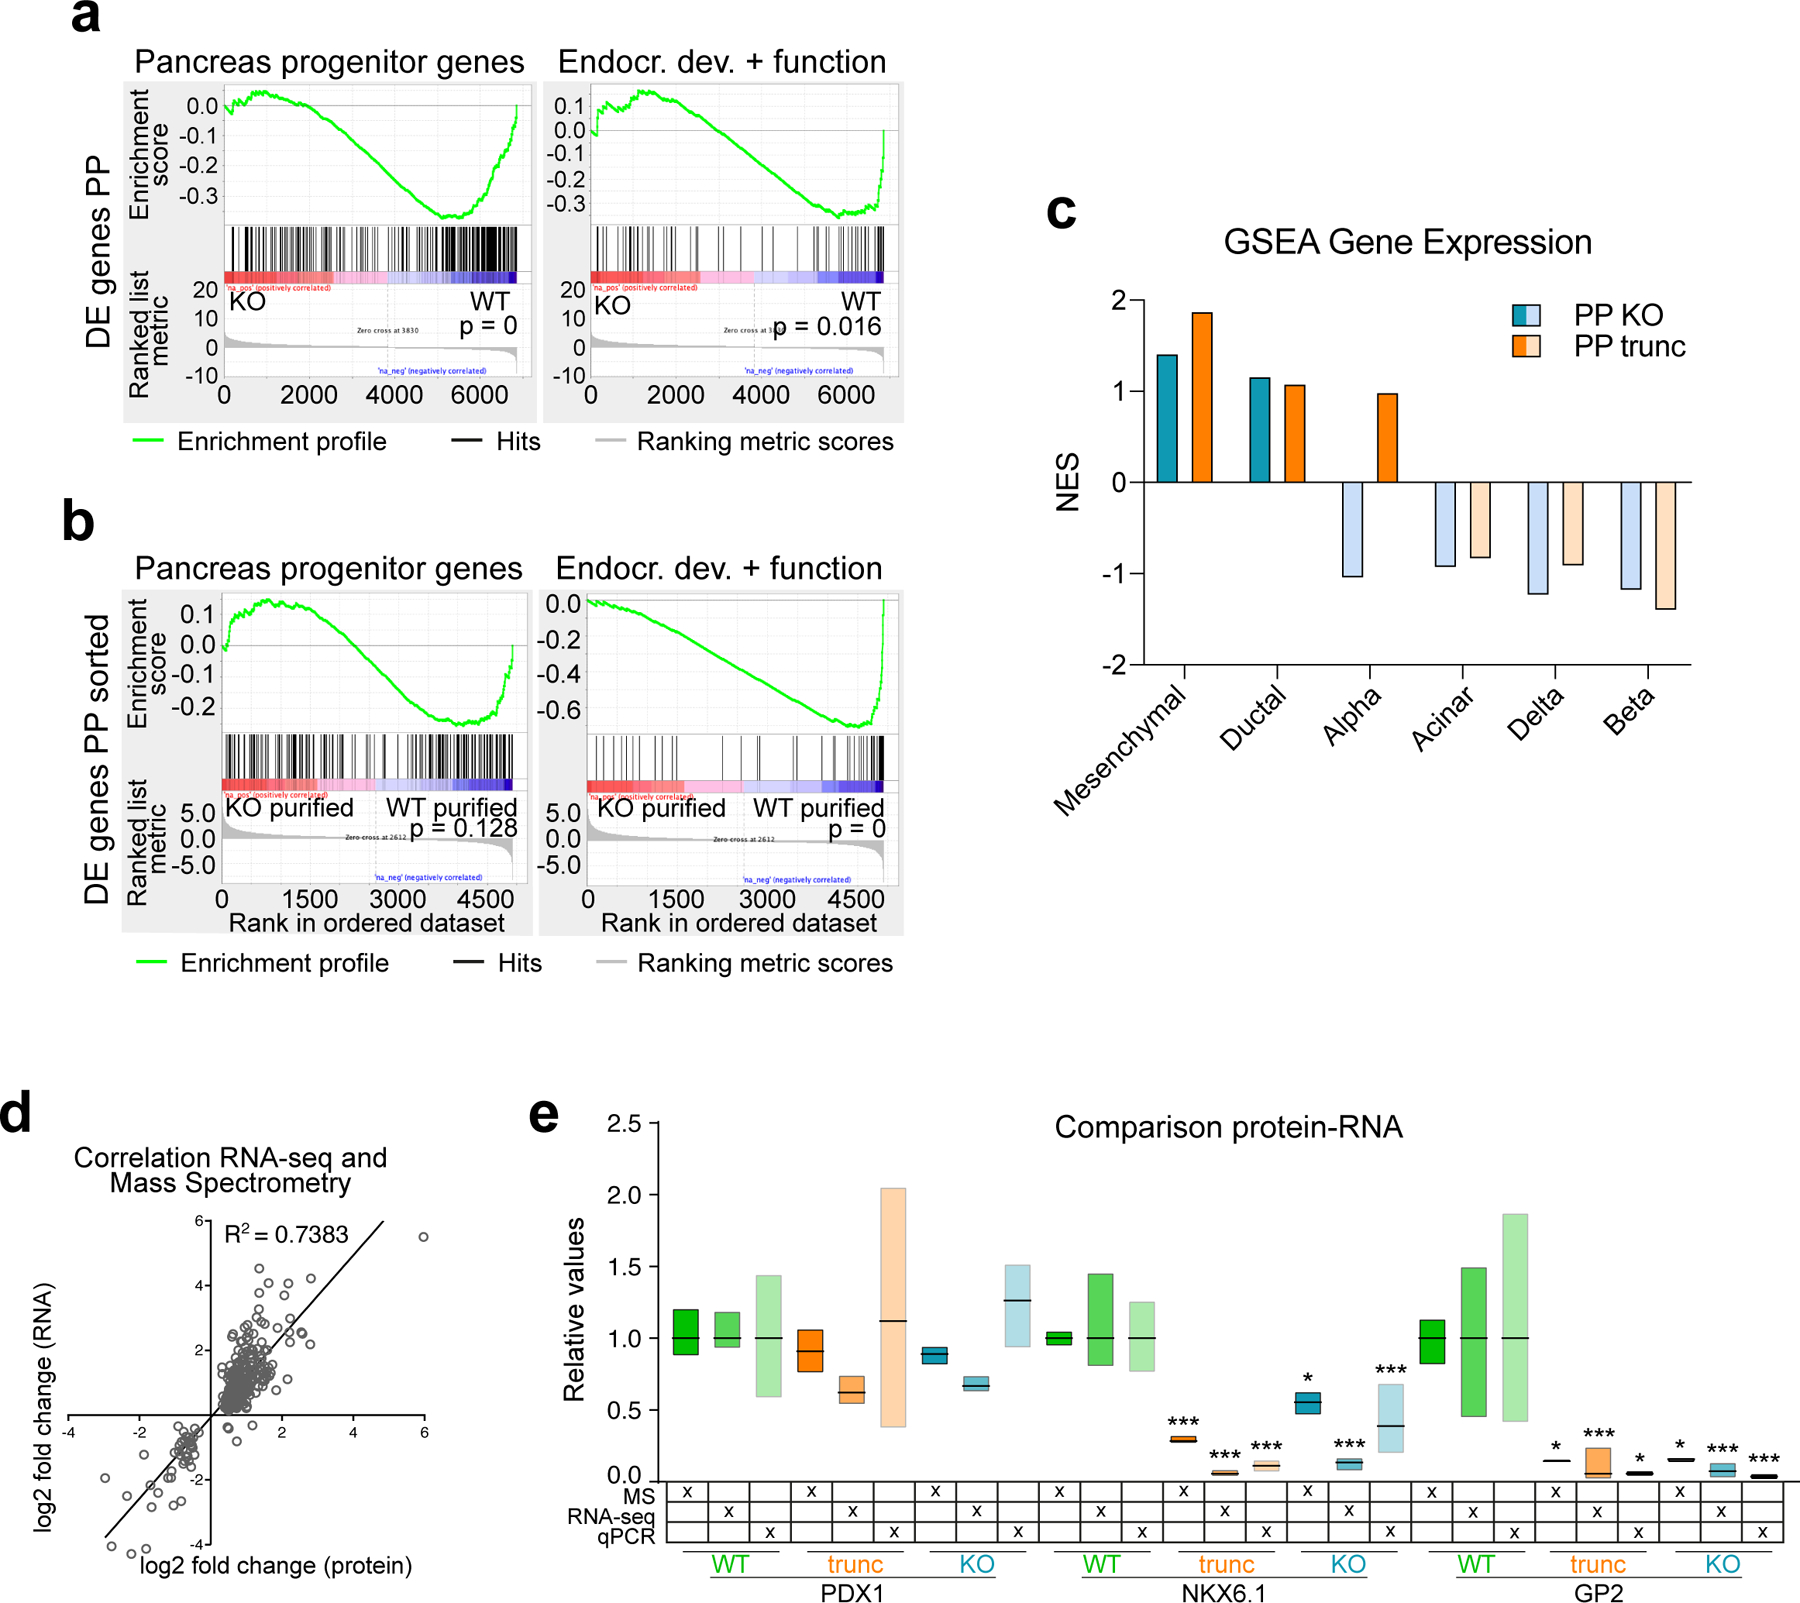
(a,b) GSEA23 analysis of differentially expressed (DE) genes in HUES8 WT and ONECUT1 KO PP cells (a) as well as PDX1+/NKX6.1+ purified PP cells from HUES8 ONECUT1 KO and WT (b) using a specific gene set for pancreatic progenitors24 as well as genes important for endocrine development and β-cell function25. (c) GSEA enrichment scores contrasting HUES8 WT and KO (or trunc) at PP stage on gene expression signatures of pancreas cells obtained from a single cell RNA-seq study (GSE81547). (d) Correlation of all significant differentially expressed genes (RNA-seq) and proteins (mass spectrometry, MS) in HUES8 ONECUT1 truncated (trunc) cells at the PP stage. (e) Comparison of expression values for depicted genes in HUES8 edited (ONECUT1 truncated and KO) and WT PP cells. Bar graphs represent min and max values with indicated mean normalized to ONECUT1 WT cells (RNA-seq: n=6; qPCR: WT n=4, KO/trunc n=4; MS: n=3; one-way ANOVA with Tukey’s test).
Extended Data Figure 4: ONECUT1 shapes chromatin accessibility during PE-PP transition.
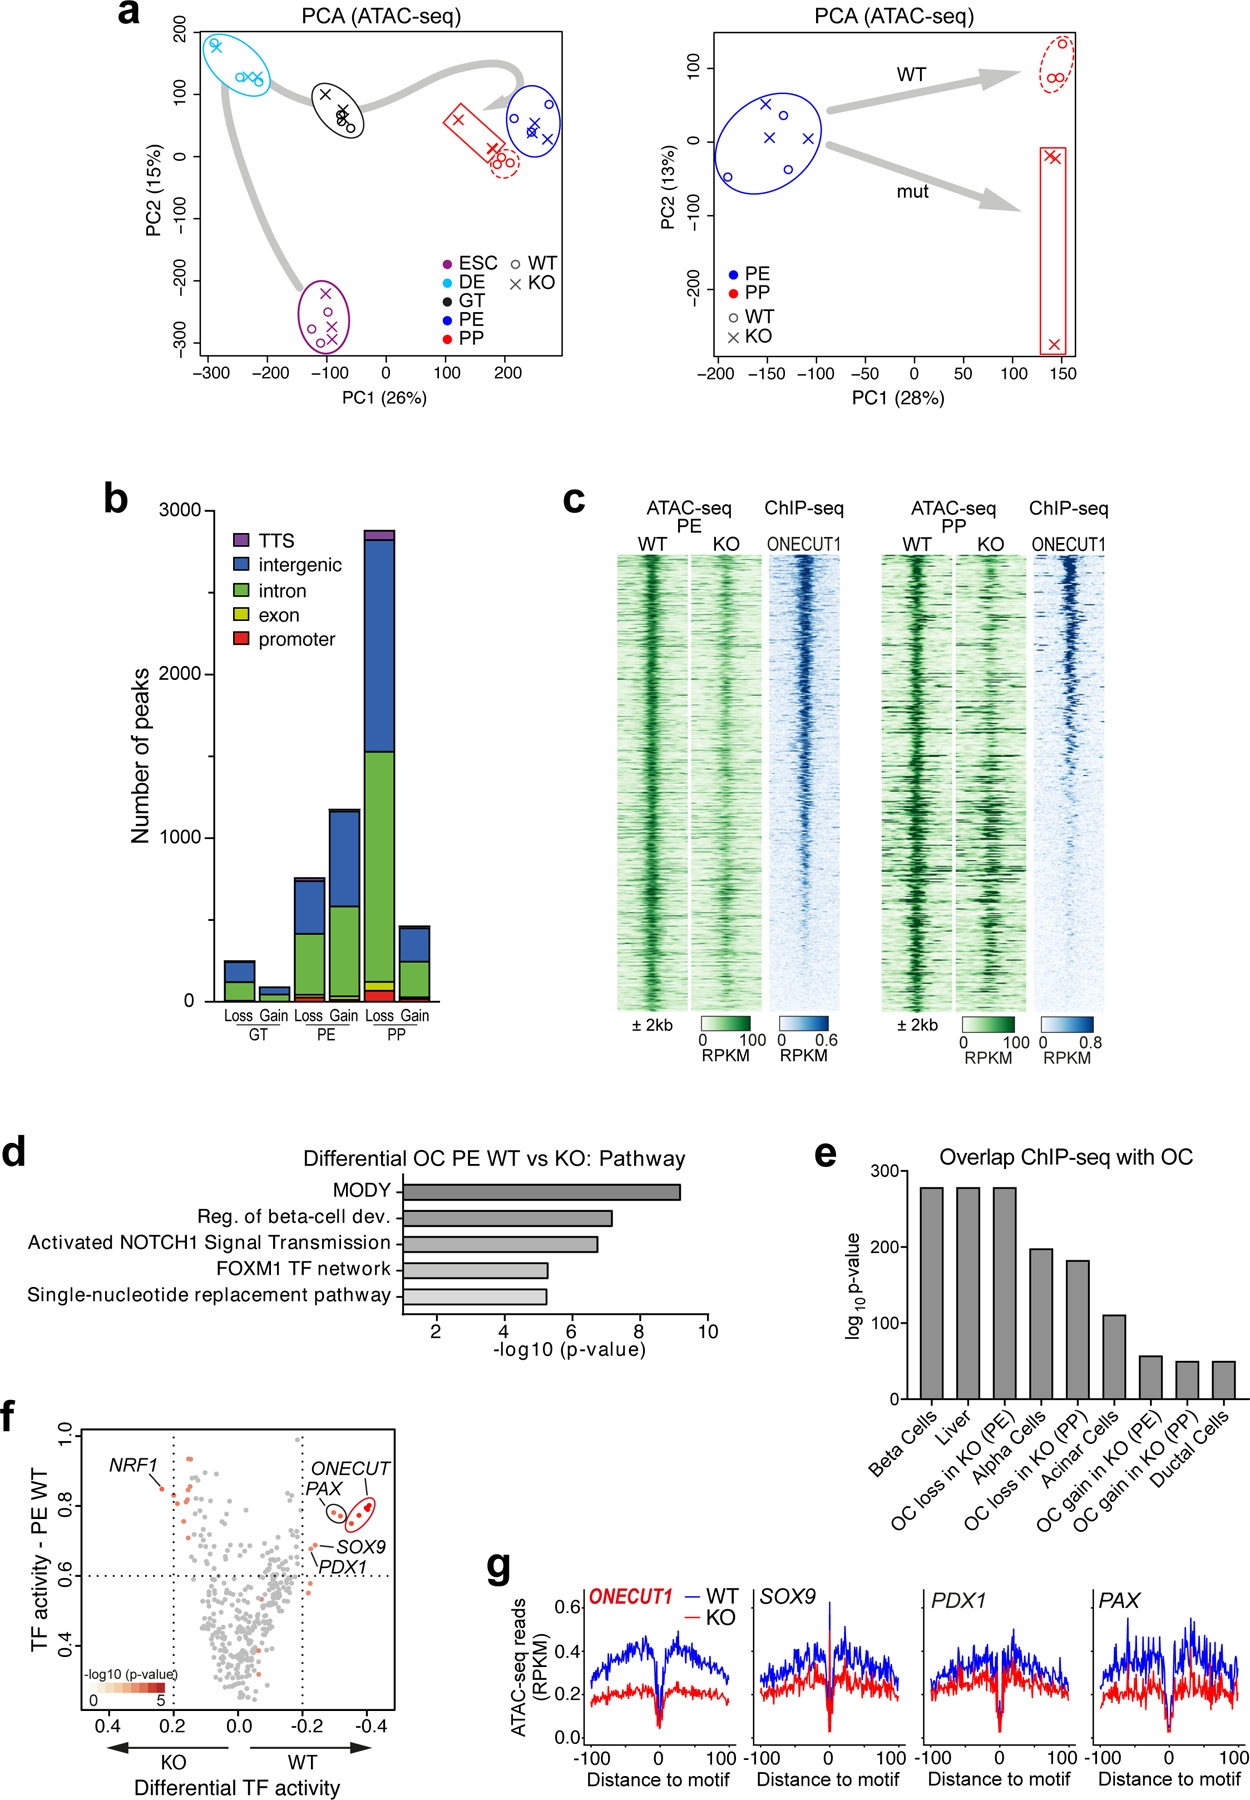
(a) PCA analysis of stage-specific ATAC-seq for differentiation of ONECUT1 null and WT HUES8 lines (left) as well as restricted to PE and PP stages (right). (b) Genomic location of stage-specific ATAC peaks lost or gained in ONECUT1 null (KO) HUES8 line. TTS: transcriptional termination site. (c) Heatmap depicting chromatin accessibility signals (+/− 2kb of peak center) of OC peaks lost upon ONECUT1 KO in HUES8 and ordered by ONECUT1 ChIP-seq peak strength at the PE and PP stage. (d) Enrichment analysis (GREAT26) of OC peaks lost upon ONECUT1 KO at the PE stage. (e) Significance of overlap (log10 p-value) of open chromatin (OC) for different tissues as well as OC lost in HUES8 KO at PE or PP stage and ONECUT1 ChIP-seq peaks. (f) Scatter plot depicting the footprint-based activity score (strength of binding) of TFs in PE state (y-axis) versus the difference of the activity score upon ONECUT1 KO at the PE state (ATAC-seq, HUES8). (g) HNF family factors have the highest loss in activity followed by PAX family, SOX9 and PDX1 factors upon ONECUT1 KO. Representative examples of footprints.
Extended Data Figure 5: DNA binding capacity of distinct ONECUT1 variants with clinical relevance.
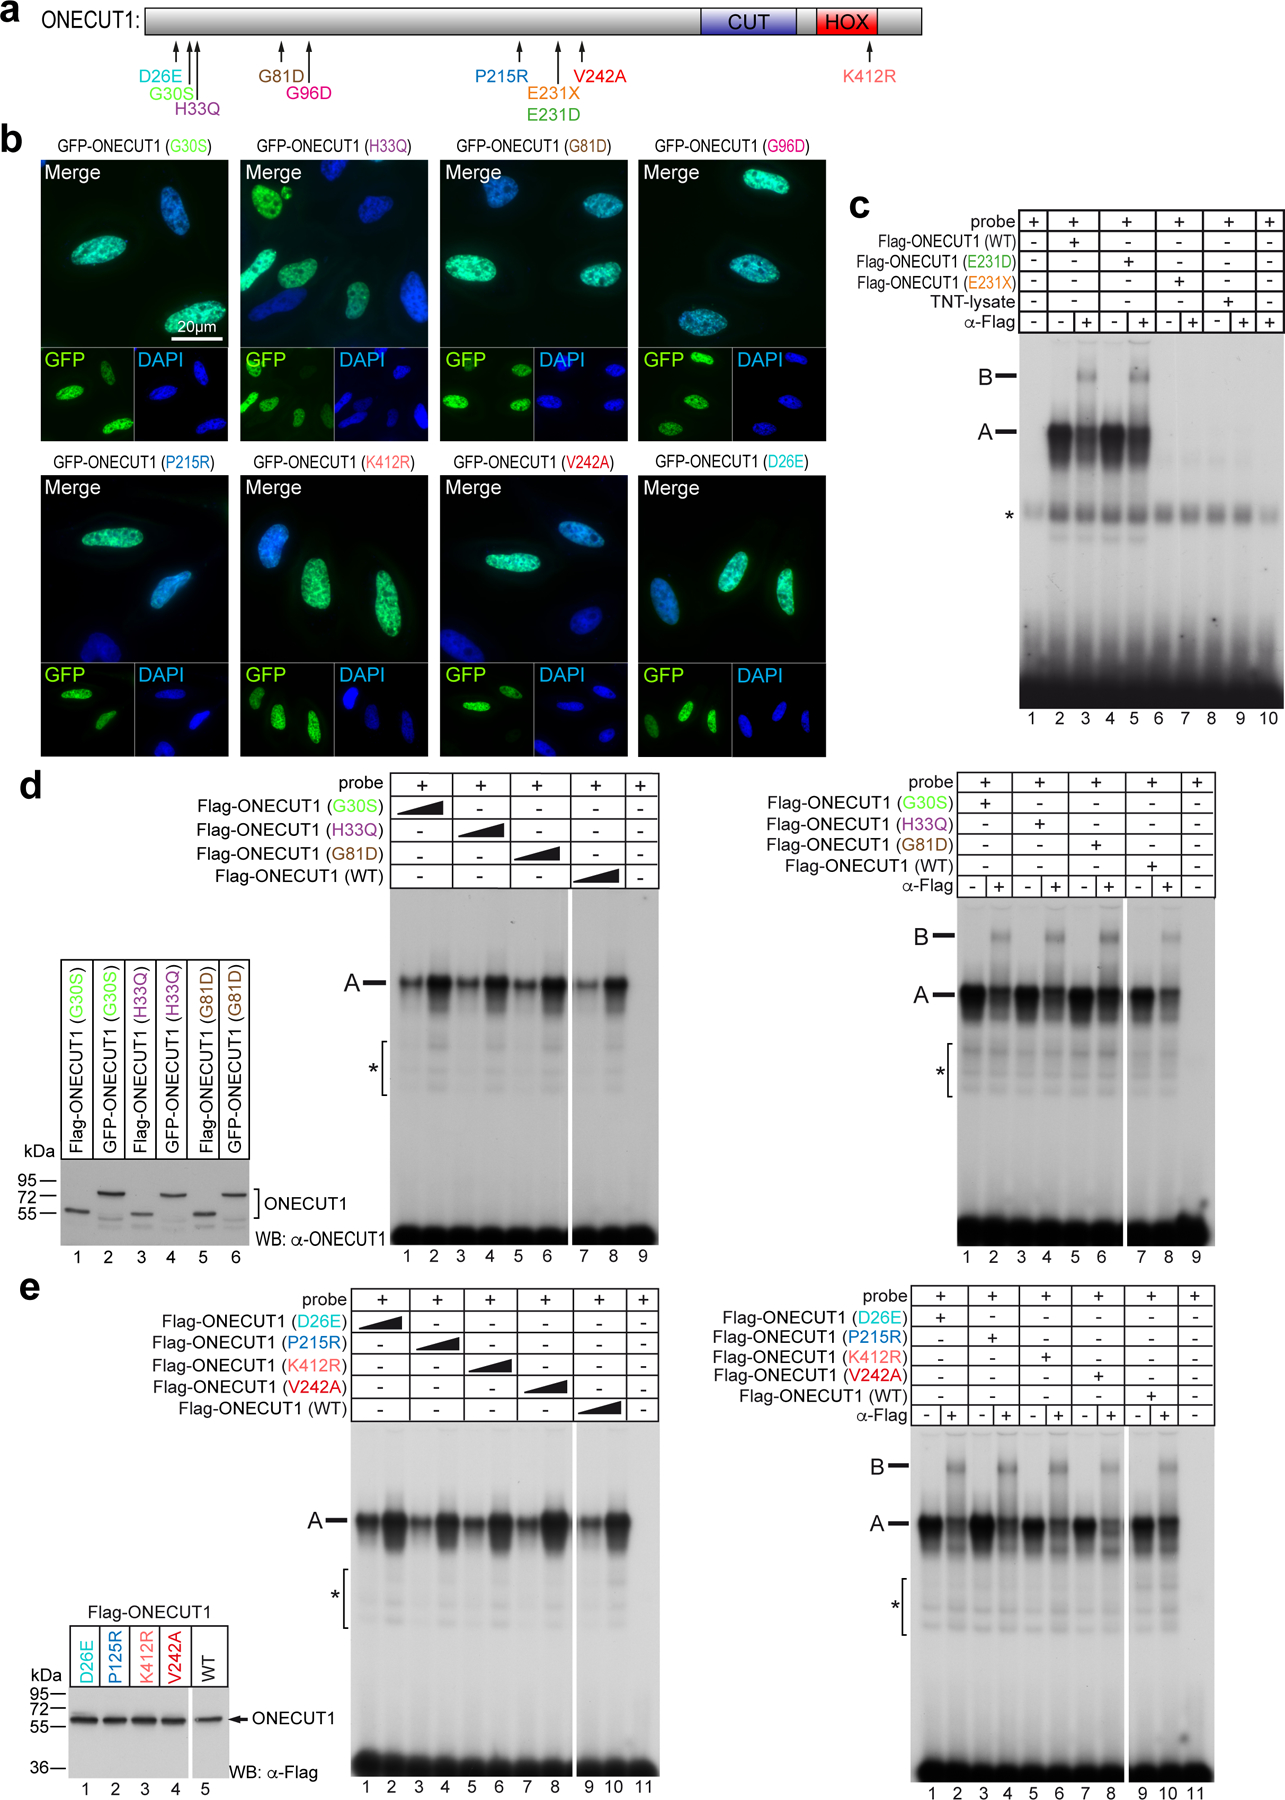
(a) Overview of ONECUT1 WT and mutated protein variants used in overexpression experiments. (b) Representative images of mutated ONECUT1 fused to GFP, overexpressed in HeLa cells. (c-e) Electromobility shift assay (EMSA) and super shift assay of selected WT and mutated ONECUT1 proteins fused to a Flag-tag using a probe consisting of a ONECUT1 binding motif (label A). Additional Flag antibody binding the complex leads to a further shift (label B). Unspecific binding complexes are indicated with an asterisk. In addition, in vitro translated ONECUT1 proteins (TnT Transcription/Translation System) are detected by ONECUT1 or Flag antibody (WB: α-ONECUT1 control).
Extended Data Figure 6: Physical interaction between ONECUT1 and pancreatic transcription factors.
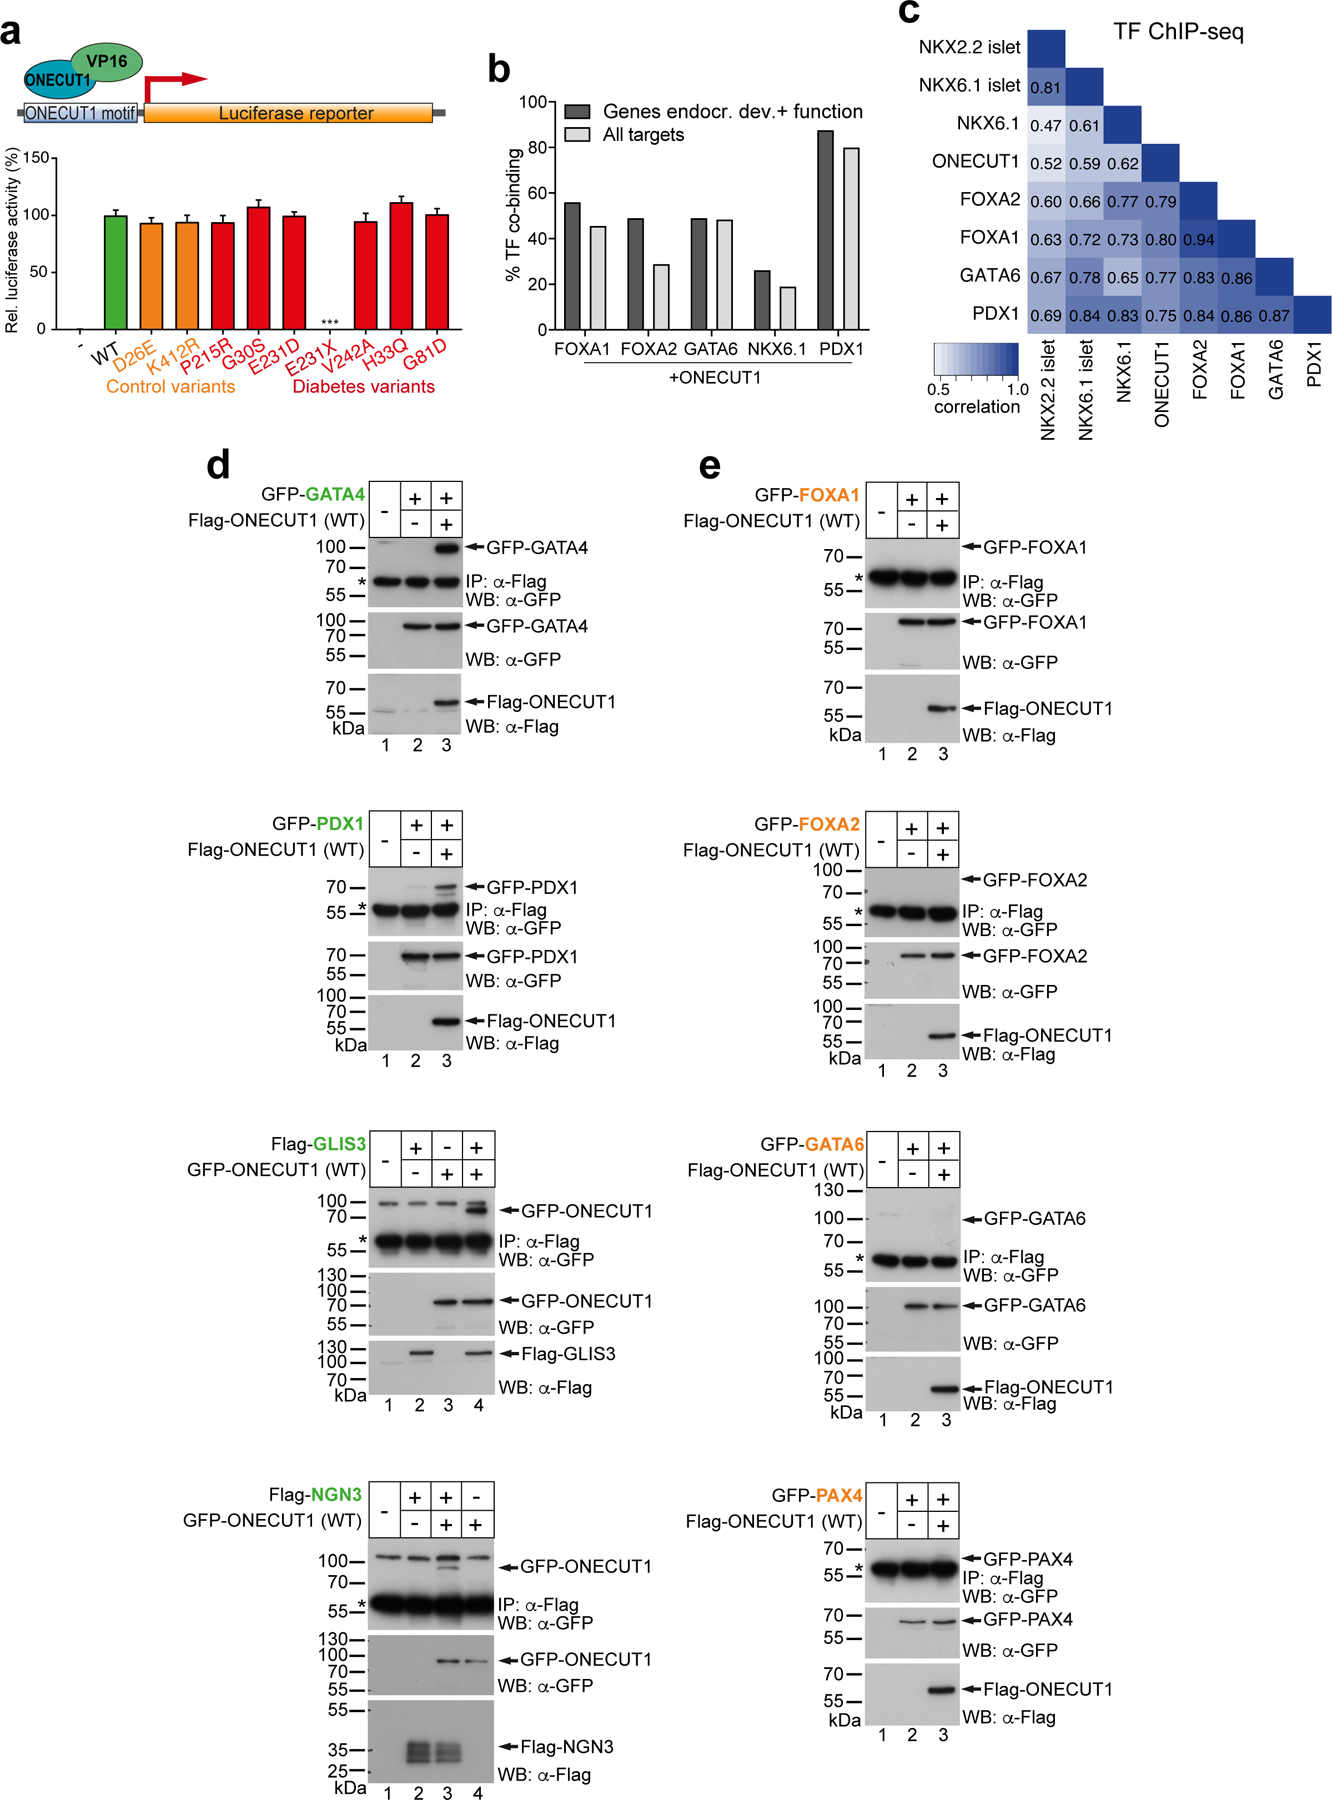
(a) Luciferase reporter assay (HeLa cells, n=8) with WT and ONECUT1 coding variants fused to the transcriptional activator (transactivator) VP16 using a reporter construct consisting of six ONECUT1 binding motifs found in the human FOXA2 promoter region. After binding of ONECUT1 to its binding motif, VP16 is activating transcription independent of the transactivation activity of ONECUT1 variants. Statistical analysis was performed by one-way ANOVA with Dunnett’s test. (b) Proportion of genes with or without restriction to endocrine lineage genes with overlapping binding by ONECUT1 (ChIP-seq, PP) with depicted TFs (ChIP-seq). (c) Pearson correlation between genome-wide binding signals of depicted TFs. (d,e) Co-immunoprecipitation of Flag- or GFP-tagged WT ONECUT1 protein and GFP- or Flag-tagged target proteins. Proteins co-immunoprecipitating with ONECUT1 are highlighted in green, others in orange. WBs on the bottom show successful overexpression of putative interaction partners in HEK293, while WBs on the top were performed after Flag immunoprecipitation. The heavy chain of the Flag-antibody is indicated with an asterisk.
Extended Data Figure 7: ONECUT1 protein-protein interaction requires its N-terminal end.
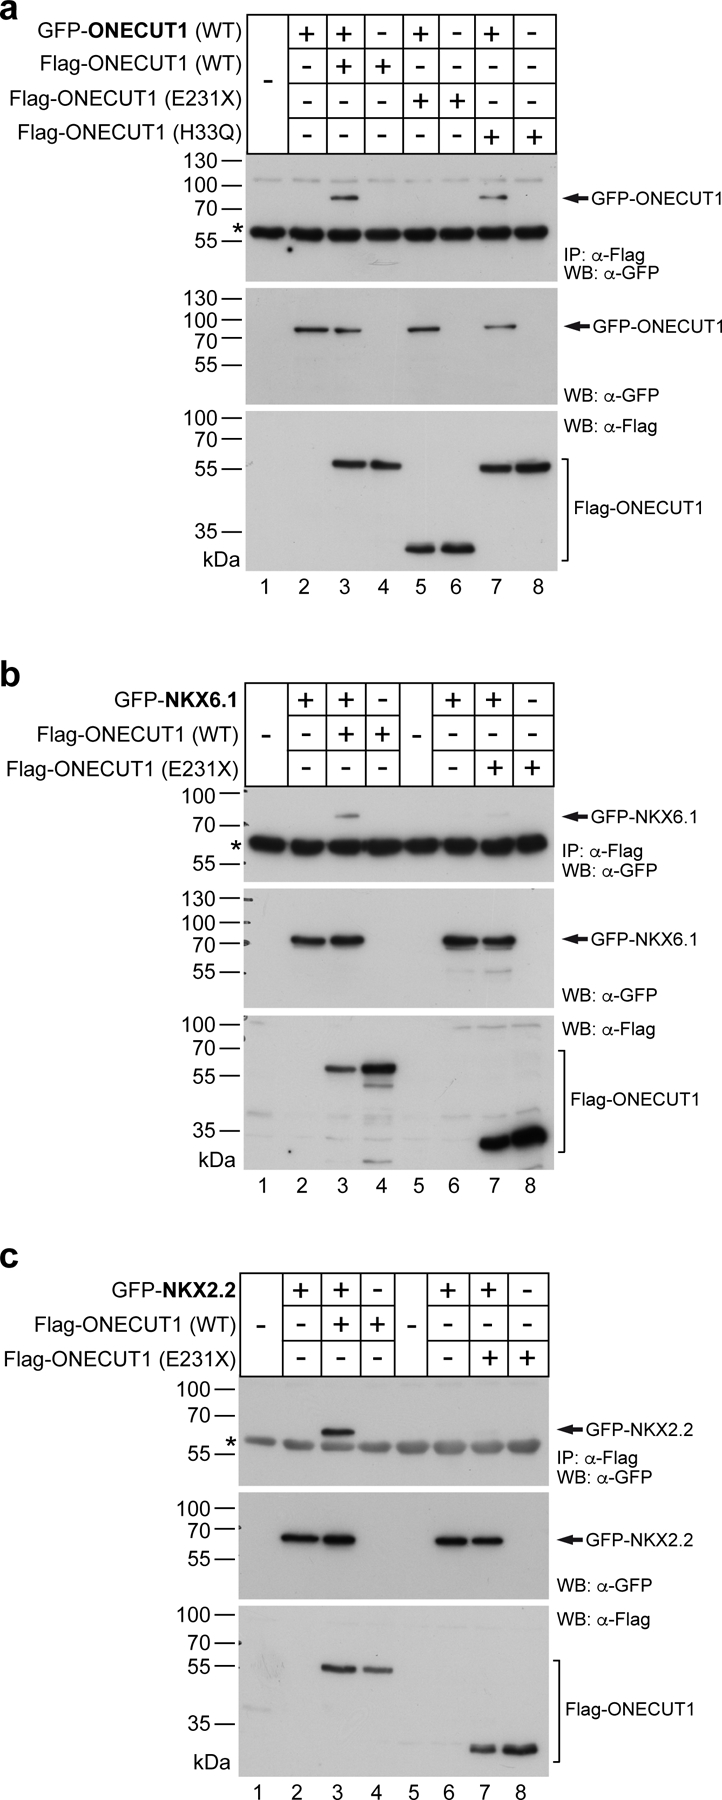
(a) Homo- and heterodimerization of ONECUT1 proteins was analyzed by co-immunoprecipitation of GFP-tagged ONECUT1 and Flag-tagged ONECUT1 WT or variant in HEK293. The heavy chain of the Flag-antibody is indicated with an asterisk. Note that the ONECUT1 PTV (p.E231X) did not bind to WT ONECUT1 protein. (b,c) Co-immunoprecipitation (top) of NKX6.1 (b) and NKX2.2 (c) with ONECUT1 WT and E231X. Heterodimerization only in ONECUT1 WT and NKX6.1/NKX2.2. The asterisk on the blot shows the heavy chain of the Flag antibody. Bottom control western blots show successful overexpression of TFs in HEK293.
Extended Data Figure 8: Cooperative ONECUT1 interaction at putative enhancers.
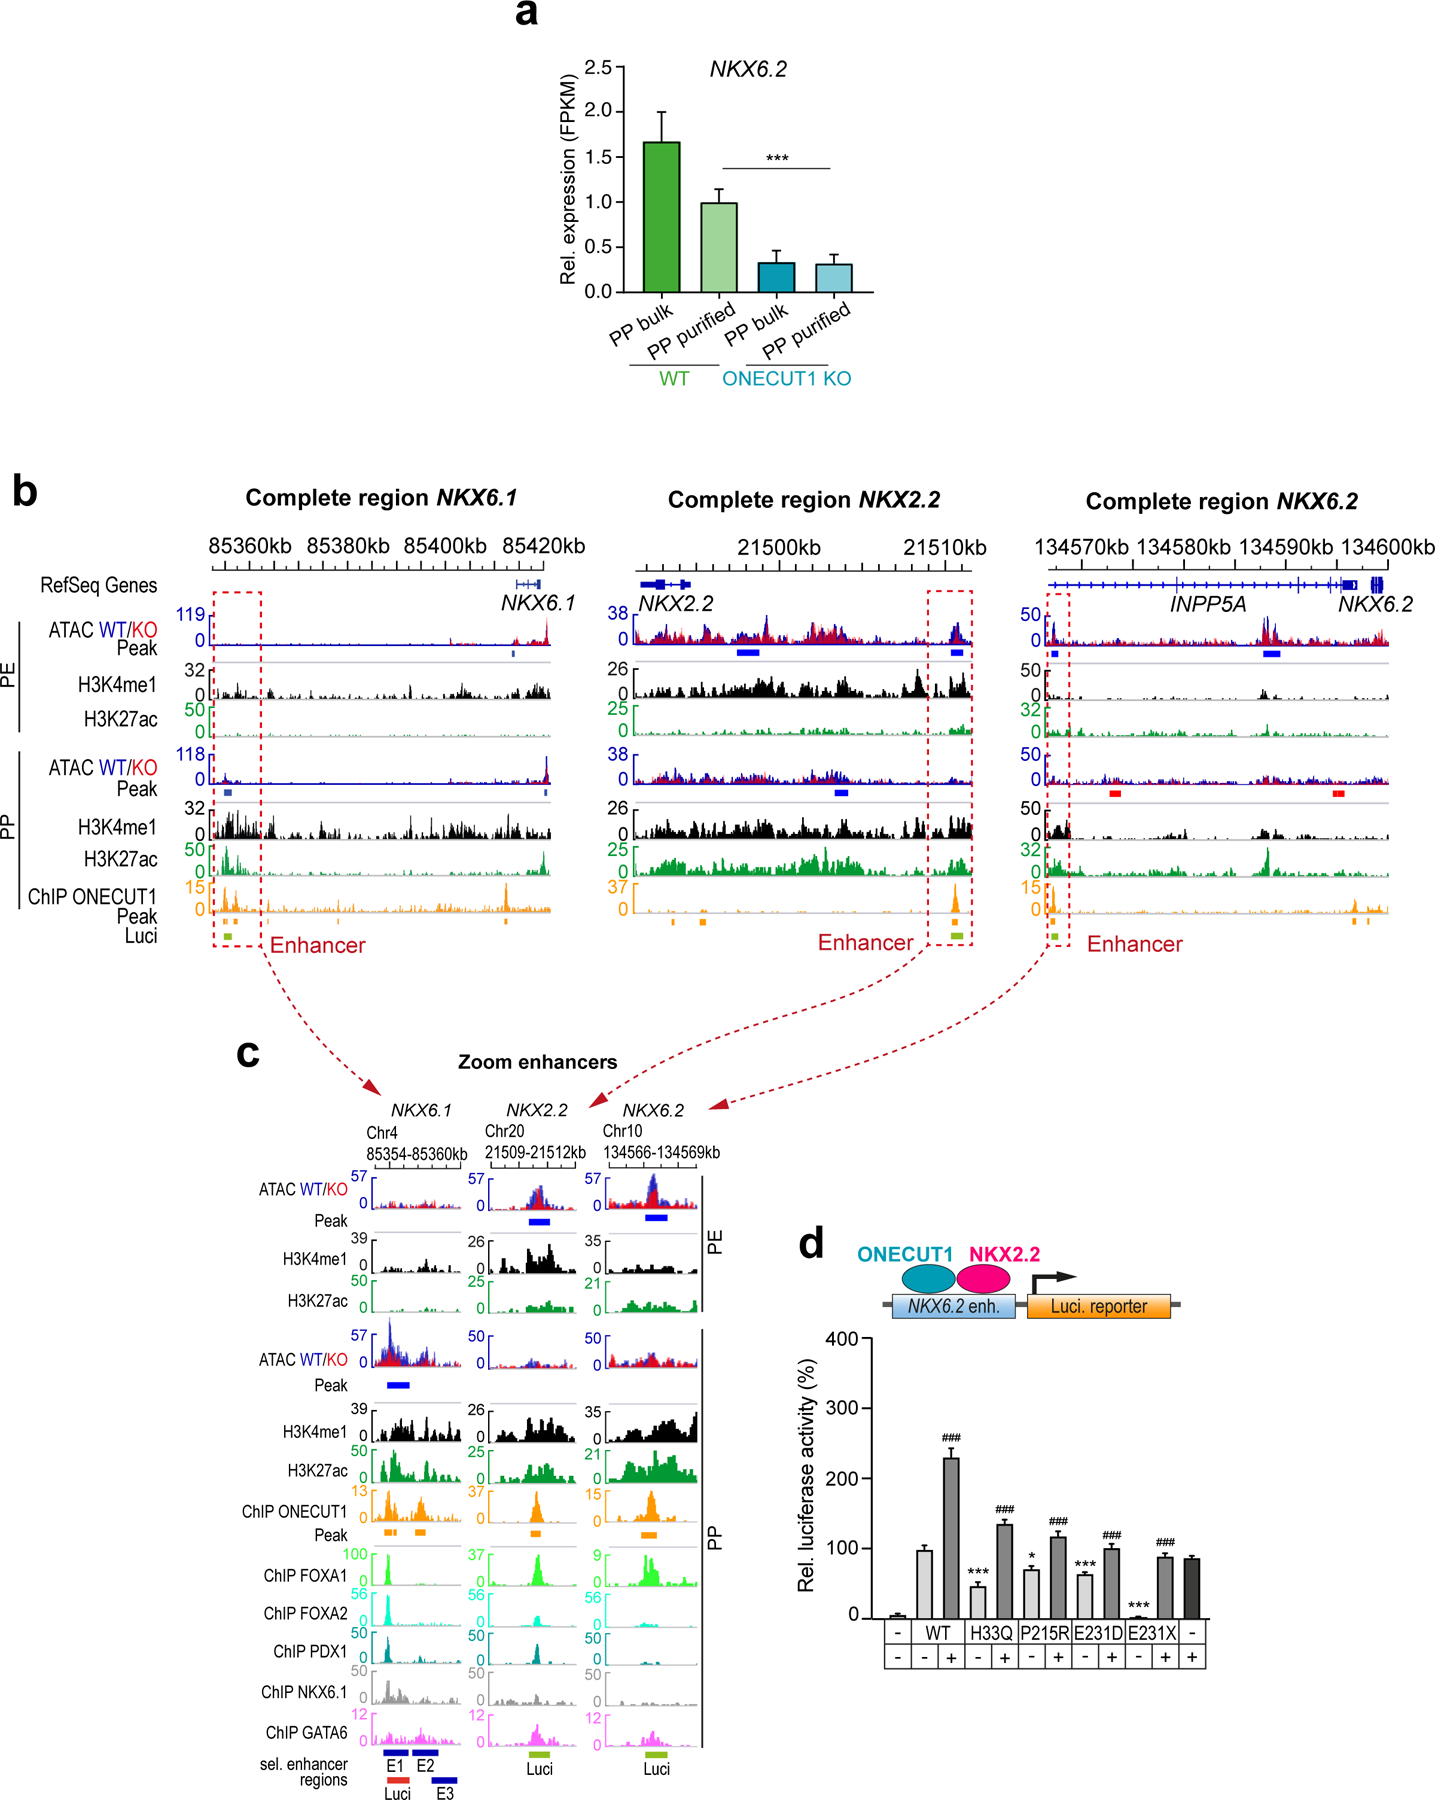
(a) NKX6.2 expression in HUES8 WT and ONECUT1 KO PP bulk and PDX1+/NKX6.1+ purified cells (RNA-seq, n=6; two-tailed, unpaired t-test). (b,c) ATAC-seq, histone modifications and ONECUT1 ChIP-seq signals around NKX6.1, NKX6.2, and NKX2.2 locus. Red traced squares indicate enhancer regions expanded in (c). Below, the region selected for luciferase assay and reporter assay are shown. (d) Luciferase reporter assay with selected NKX6.2 enhancer region overexpressing WT or ONECUT1 variants alone or together with NKX2.2 in HeLa cells (n=6; one-way ANOVA with Tukey’s test).
Extended Data Figure 9: Patient variant ONECUT1-p.E231D impairs pancreatic differentiation in gene-edited HUES8 hESC.
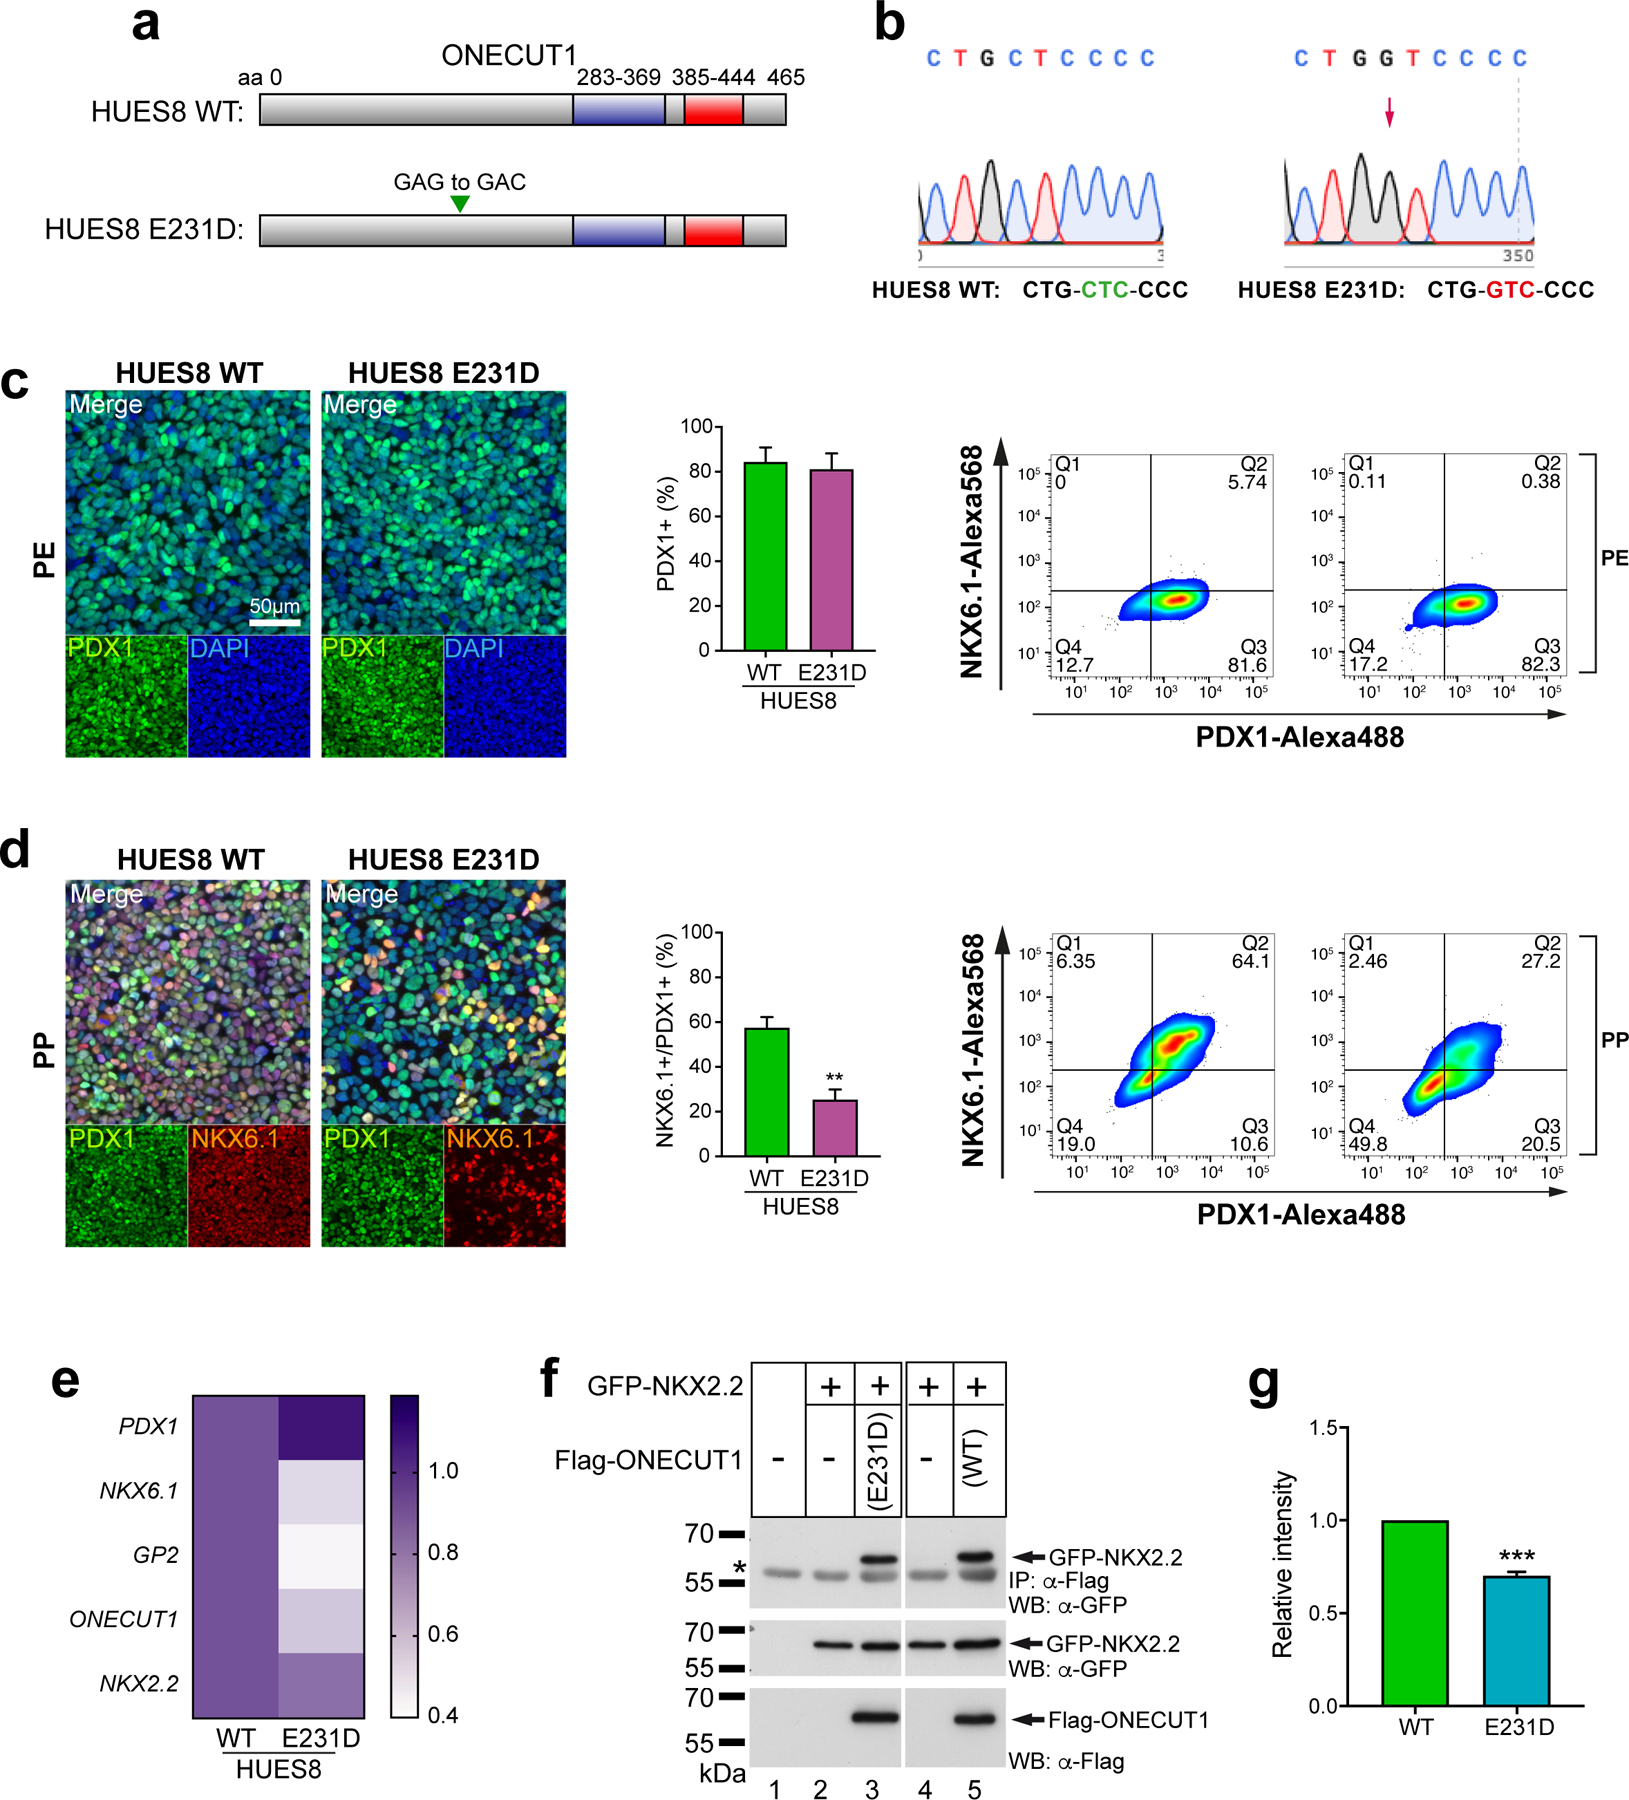
(a) Scheme of ONECUT1 variant E231D generated by targeted gene-editing in HUES8 hESCs. (b) Sequence verification of ONECUT1-p.E231D edited HUES8 cells. Of note, sequencing was performed on reverse strand. (c,d) Differentiation efficiency at the PE and PP stages in ONECUT1-p.E231D HUES8 cells. Of note, ILV was omitted after PE stage to better demonstrate small effects in differentiation efficiency of ONECUT1 variants. Representative images show immunofluorescence staining of PDX1 and PDX1/NKX6.1 at the PE and PP stage, respectively. Quantification of positive cells was performed by flow cytometry (PE: n=4; PP: n=3; two-tailed, unpaired t-test). (e) Heatmap depicting relative marker expression in ONECUT1-p.E231D edited HUES8 cells at PP stage. Of note, ILV was omitted after PE stage compared to regular differentiation protocol. Expression values are normalized to HUES8 ONECUT1 WT (n=4, 2 technical replicates) and scaled by the sum of each row. (f) Co-immunoprecipitation of NKX2.2 with ONECUT1 E231D and WT. The asterisk on the blot shows the heavy chain of the Flag antibody. Bottom control western blots show successful overexpression of TFs in HEK293. (g) Quantification relative to NKX2.2 input (n=4; two-tailed, unpaired t-test) shows reduced heterodimerization for ONECUT1 E231D.
Extended Data Figure 10: Fine-mapped T2D-associated variants reside at ONECUT1 locus.
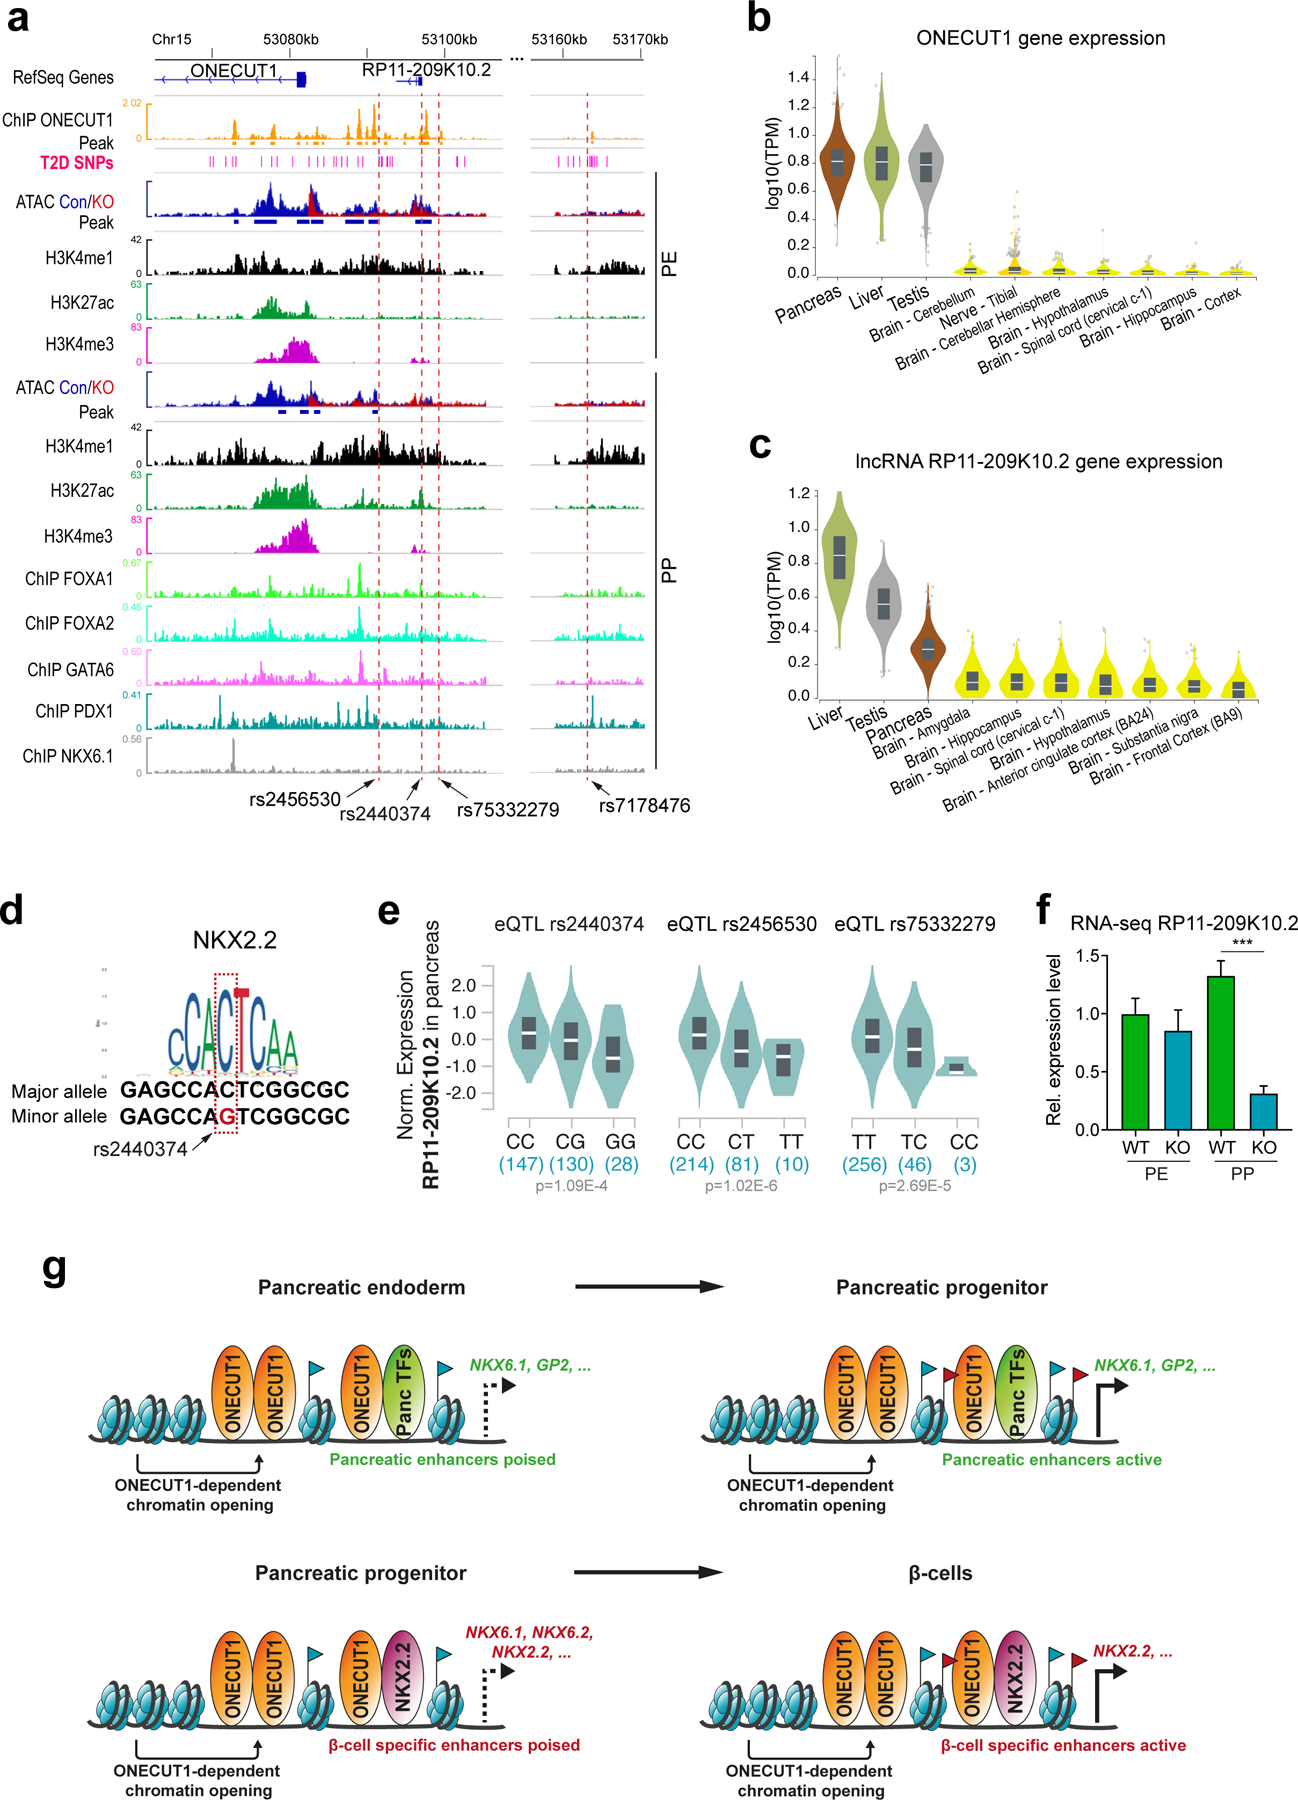
(a) Fine mapping of type II diabetes traits from DIAMANTE GWAS dataset. This region (chr15:53070141–53165681) corresponds to the 99% genetic credible set from Mahajan et al.5 and includes the first exon of ONECUT1 and the non-coding RNA RP11–209K10.2. IGV plot depicts ONECUT1, FOXA1/2, GATA6, PDX1, and NKX6.1 ChIP-seq peaks (PP), ATAC-seq signals and histone modifications. T2D-associated SNPs (“T2D SNPs”) with a p-value < 10−5 are shown in pink, p-value <10−8 in blue. Of those, rs2440374 overlaps with both a ONECUT1 peak and a differential ATAC-seq peak in PE stage. This SNP is localized at the promoter region of the non-coding gene RP11–209K10.2 (ENSEMBL ID ENSG00000259203). (b,c) Tissue-specific expression of ONECUT1 and RP11–209K10.2 obtained from GTEx database showing gene expression in top 10 tissues sorted by median expression. Both genes have high expression specific to pancreas, liver and testis. (d) Motif analysis with RSAT-Var-tools indicates that the SNP disrupts a putative binding sequence of NKX2.2. (e) eQTL analysis with GTEx indicates an association of rs2440374, rs2456530 and rs75332279 with the expression of lncRNA RP11–209K10.2 in pancreas. (f) Expression of lncRNA RP11–209K10.2 in HUES8 WT and ONECUT1 KO PE and PP cells (RNA-seq, n=6; two-tailed, unpaired t-test). (g) Graphical illustration of the proposed mechanism how ONECUT1 loss impairs pancreatic development to cause diabetes.
Supplementary Material
Acknowledgements
The authors would like to thank Rashmi Gowdru Bijegatte, Katrin Köhn, Ralf Köhntop, Sabine Schirmer, Roswitha Rittelmann and Jana Krüger from the Department of Internal Medicine I, Ulm University, Germany for their technical support. We want to thank Dr. Sarah Warth at the Core Facility Cytometry, Ulm University Medical Faculty, Germany for FACS-mediated cell sorting and Dr. Marco Groth at Leibnitz Institute of Aging in Jena, Germany for performing RNA sequencing of our samples. We are also grateful to Kuhn Elektro-Technik GmbH for supporting our work. We thank S. Hays from the Neonatal Unit, Lyon, France for clinical management of the newborn patient and Dr I. Plotton from the Biochemistry laboratory, Lyon, France for her contribution to the hormonal evaluations. We thank C. Bonaldi and the Institut de Veille Sanitaire for providing data on IFG and T2D prevalence in the French population and the Centre National de Recherche en Génomique Humaine for providing access to their genomic platform. We are very grateful to the patients and their families for participating to this study.
This project was funded by the Boehringer Ingelheim Ulm University BioCenter (BIU) as well as by the ANR-DFG collaborative research project (grant no. ANR-18-CE92-0031, DFG KL 2544/5-1) to C.J. and A.K. and via additional funding by the Deutsche Forschungsgemeinschaft (DFG) grant nos. KL 2544/6-1, KL 2544/7-1, ‘Fokus-Förderung COVID-19’ KL 2544/8-1 and KL 2544/1-2 to A.K.; by the Agence Nationale pour la Recherche (grant no. ANR-09-GENO-021), the European Foundation for the Study of Diabetes/JDRF/Novo Nordisk, the Assistance Publique-Hôpitaux de Paris Programme Hospitalier de Recherche Clinique (project DIAGENE) and France Génomique (project DIAPED) to C.J.; by a grant from the E: MED Consortia Fibromap funded by the German Ministry of Education and Science (BMBF) and by the DFG grant no. GE 2811/3-1 to I.G.C.; as well as grant no. SFB1074/A3, OS287/4-1 to F.O., NIH grants no. DK068471 and no. DK105541 as well as NIH T32 grant no. GM008666 to M. Sander and grant no. DFG-GrK1041, Centre of Excellence Metabolic Disorders Baden-Wuerttemberg, Germany as well as Ministry of Education, Singapore, MOE2018-T2-1-085 to B.O.B. Work in M. Hebrok’s laboratory was supported by a grant from the NIH (grant no. DK105831). This work was also supported by the France Génomique National infrastructure, funded as part of the Investissements d’Avenir program managed by the Agence Nationale pour la Recherche (grant no. ANR-10-INBS-09).
Footnotes
Competing interests Statement
The authors have no conflicts of interest to declare.
Code availability Statement
For raw data processing off the instruments, code for two custom programs based on Picard tools (2.19.2) is available at https://github.com/DanieleBarreca/picard/ and https://broadinstitute.github.io/picard/. Further programs used for transcriptome analysis are described in methods section.
Reporting summary
Further information on research design is available in the Nature Research Reporting Summary linked to this paper.
Data Availability Statement
Sequencing data (RNA-seq, ATAC-seq and ChIP-seq) generated for this work has been deposited at Gene Expression Omnibus (https://www.ncbi.nlm.nih.gov/geo/query/acc.cgi?acc=GSE131817). The mass spectrometry proteomics data have been deposited to the ProteomeXchange Consortium (http://proteomecentral.proteomexchange.org) via the PRIDE partner repository75 with the dataset identifier PXD018887. Additional data that support the findings of this study are available from the corresponding authors upon request. Furthermore, source data are provided with this paper.
References (for main text only):
- 1.Risk N Factor collaboration (NCD-RisC). Worldwide trends in diabetes since 1980: a pooled analysis of 751 population-based studies with 4.4 million participants. Lancet 387, 1513–1530 (2016). [DOI] [PMC free article] [PubMed] [Google Scholar]
- 2.Bansal V, et al. Spectrum of mutations in monogenic diabetes genes identified from high-throughput DNA sequencing of 6888 individuals. BMC medicine 15, 213 (2017). [DOI] [PMC free article] [PubMed] [Google Scholar]
- 3.Shields BM, et al. Population-Based Assessment of a Biomarker-Based Screening Pathway to Aid Diagnosis of Monogenic Diabetes in Young-Onset Patients. Diabetes Care 40, 1017–1025 (2017). [DOI] [PMC free article] [PubMed] [Google Scholar]
- 4.Hattersley AT & Patel KA Precision diabetes: learning from monogenic diabetes. Diabetologia 60, 769–777 (2017). [DOI] [PMC free article] [PubMed] [Google Scholar]
- 5.Mahajan A, et al. Fine-mapping type 2 diabetes loci to single-variant resolution using high-density imputation and islet-specific epigenome maps. Nature genetics 50, 1505 (2018). [DOI] [PMC free article] [PubMed] [Google Scholar]
- 6.Flannick J, et al. Exome sequencing of 20,791 cases of type 2 diabetes and 24,440 controls. Nature 570(2019). [DOI] [PMC free article] [PubMed] [Google Scholar]
- 7.Heller S, Melzer MK, Azoitei N, Julier C & Kleger A Human Pluripotent Stem Cells Go Diabetic: A Glimpse on Monogenic Variants. Front Endocrinol (Lausanne) 12, 648284 (2021). [DOI] [PMC free article] [PubMed] [Google Scholar]
- 8.Breunig M, et al. Modeling plasticity and dysplasia of pancreatic ductal organoids derived from human pluripotent stem cells. Cell Stem Cell 28, 1105–1124 e1119 (2021). [DOI] [PMC free article] [PubMed] [Google Scholar]
- 9.Wiedenmann S, et al. Single-cell-resolved differentiation of human induced pluripotent stem cells into pancreatic duct-like organoids on a microwell chip. Nat Biomed Eng (2021). [DOI] [PMC free article] [PubMed]
- 10.1000 Genome Project Consortium. A global reference for human genetic variation. Nature 526, 68–74 (2015). [DOI] [PMC free article] [PubMed] [Google Scholar]
- 11.Oliver-Krasinski JM & Stoffers DA On the origin of the beta cell. Genes Dev 22, 1998–2021 (2008). [DOI] [PMC free article] [PubMed] [Google Scholar]
- 12.Smith SB, et al. Rfx6 directs islet formation and insulin production in mice and humans. Nature 463, 775–780 (2010). [DOI] [PMC free article] [PubMed] [Google Scholar]
- 13.Zorn AM & Wells JM Vertebrate endoderm development and organ formation. Annu Rev Cell Dev Biol 25, 221–251 (2009). [DOI] [PMC free article] [PubMed] [Google Scholar]
- 14.Jacquemin P, et al. Transcription factor hepatocyte nuclear factor 6 regulates pancreatic endocrine cell differentiation and controls expression of the proendocrine gene ngn3. Mol Cell Biol 20, 4445–4454 (2000). [DOI] [PMC free article] [PubMed] [Google Scholar]
- 15.Clotman F, et al. The onecut transcription factor HNF6 is required for normal development of the biliary tract. Development 129, 1819–1828 (2002). [DOI] [PubMed] [Google Scholar]
- 16.Jacquemin P, Lemaigre FP & Rousseau GG The Onecut transcription factor HNF-6 (OC-1) is required for timely specification of the pancreas and acts upstream of Pdx-1 in the specification cascade. Dev Biol 258, 105–116 (2003). [DOI] [PubMed] [Google Scholar]
- 17.Lannoy VJ, Bürglin TR, Rousseau GG & Lemaigre FP Isoforms of hepatocyte nuclear factor-6 differ in DNA-binding properties, contain a bifunctional homeodomain, and define the new ONECUT class of homeodomain proteins. J Biol Chem 273, 13552–13562 (1998). [DOI] [PubMed] [Google Scholar]
- 18.Bonaldi C, et al. A first national prevalence estimate of diagnosed and undiagnosed diabetes in France in 18- to 74-year-old individuals: the French Nutrition and Health Survey 2006/2007. Diabetic medicine : a journal of the British Diabetic Association (2011). [DOI] [PubMed]
- 19.Møller A, et al. Hepatocyte nuclear factor-6: associations between genetic variability and type II diabetes and between genetic variability and estimates of insulin secretion. Diabetologia 42, 1011–1016 (1999). [DOI] [PubMed] [Google Scholar]
- 20.Zhu Q, et al. Mutation screening of the hepatocyte nuclear factor (HNF)-6 gene in Japanese subjects with diabetes mellitus. Diabetes research and clinical practice 52, 171–174 (2001). [DOI] [PubMed] [Google Scholar]
- 21.Machiela MJ & Chanock SJ LDlink: a web-based application for exploring population-specific haplotype structure and linking correlated alleles of possible functional variants. Bioinformatics 31, 3555–3557 (2015). [DOI] [PMC free article] [PubMed] [Google Scholar]
- 22.Allada R & Bass J Circadian Mechanisms in Medicine. N Engl J Med 384, 550–561 (2021). [DOI] [PMC free article] [PubMed] [Google Scholar]
- 23.Subramanian A, et al. Gene set enrichment analysis: a knowledge-based approach for interpreting genome-wide expression profiles. Proceedings of the National Academy of Sciences 102, 15545–15550 (2005). [DOI] [PMC free article] [PubMed] [Google Scholar]
- 24.Cebola I, et al. TEAD and YAP regulate the enhancer network of human embryonic pancreatic progenitors. Nature cell biology 17, 615–626 (2015). [DOI] [PMC free article] [PubMed] [Google Scholar]
- 25.Hrvatin S, et al. Differentiated human stem cells resemble fetal, not adult, β cells. Proceedings of the National Academy of Sciences 111, 3038–3043 (2014). [DOI] [PMC free article] [PubMed] [Google Scholar]
- 26.McLean CY, et al. GREAT improves functional interpretation of cis-regulatory regions. Nature biotechnology 28, 495 (2010). [DOI] [PMC free article] [PubMed] [Google Scholar]
- 27.Li Z, et al. Identification of transcription factor binding sites using ATAC-seq. Genome biology 20, 45 (2019). [DOI] [PMC free article] [PubMed] [Google Scholar]
- 28.Schaffer AE, et al. Nkx6.1 controls a gene regulatory network required for establishing and maintaining pancreatic Beta cell identity. PLoS Genet 9, e1003274 (2013). [DOI] [PMC free article] [PubMed] [Google Scholar]
- 29.Pasquali L, et al. Pancreatic islet enhancer clusters enriched in type 2 diabetes risk-associated variants. Nat Genet 46, 136–143 (2014). [DOI] [PMC free article] [PubMed] [Google Scholar]
- 30.Oliver-Krasinski JM, et al. The diabetes gene Pdx1 regulates the transcriptional network of pancreatic endocrine progenitor cells in mice. J Clin Invest 119, 1888–1898 (2009). [DOI] [PMC free article] [PubMed] [Google Scholar]
- 31.Kim YS, et al. Glis3 regulates neurogenin 3 expression in pancreatic beta-cells and interacts with its activator, Hnf6. Mol Cells 34, 193–200 (2012). [DOI] [PMC free article] [PubMed] [Google Scholar]
- 32.Jennings RE, et al. Development of the human pancreas from foregut to endocrine commitment. Diabetes, DB_121479 (2013). [DOI] [PMC free article] [PubMed]
- 33.Thatava T, et al. Indolactam V/GLP-1-mediated differentiation of human iPS cells into glucose-responsive insulin-secreting progeny. Gene Ther 18, 283–293 (2011). [DOI] [PMC free article] [PubMed] [Google Scholar]
- 34.Consortium GT, et al. Genetic effects on gene expression across human tissues. Nature 550, 204–213 (2017). [DOI] [PMC free article] [PubMed] [Google Scholar]
- 35.Yang Y & Chan L Monogenic Diabetes: What It Teaches Us on the Common Forms of Type 1 and Type 2 Diabetes. Endocr Rev 37, 190–222 (2016). [DOI] [PMC free article] [PubMed] [Google Scholar]
- 36.Fu D, et al. Genetic polymorphism of glucokinase on the risk of type 2 diabetes and impaired glucose regulation: evidence based on 298, 468 subjects. PloS one 8, e55727 (2013). [DOI] [PMC free article] [PubMed] [Google Scholar] [Retracted]
- 37.Njølstad PR, et al. Neonatal diabetes mellitus due to complete glucokinase deficiency. New England Journal of Medicine 344, 1588–1592 (2001). [DOI] [PubMed] [Google Scholar]
- 38.Vionnet N, et al. Nonsense mutation in the glucokinase gene causes early-onset non-insulin-dependent diabetes mellitus. Nature 356, 721–722 (1992). [DOI] [PubMed] [Google Scholar]
- 39.Stanger BZ, Tanaka AJ & Melton DA Organ size is limited by the number of embryonic progenitor cells in the pancreas but not the liver. Nature 445, 886–891 (2007). [DOI] [PubMed] [Google Scholar]
- 40.Churchill AJ, et al. Genetic evidence that Nkx2.2 acts primarily downstream of Neurog3 in pancreatic endocrine lineage development. Elife 6(2017). [DOI] [PMC free article] [PubMed] [Google Scholar]
- 41.Miguel-Escalada I, et al. Human pancreatic islet three-dimensional chromatin architecture provides insights into the genetics of type 2 diabetes. Nat Genet 51, 1137–1148 (2019). [DOI] [PMC free article] [PubMed] [Google Scholar]
- 42.Schaffer AE, Freude KK, Nelson SB & Sander M Nkx6 transcription factors and Ptf1a function as antagonistic lineage determinants in multipotent pancreatic progenitors. Developmental cell 18, 1022–1029 (2010). [DOI] [PMC free article] [PubMed] [Google Scholar]
- 43.Tweedie E, et al. Maintenance of hepatic nuclear factor 6 in postnatal islets impairs terminal differentiation and function of beta-cells. Diabetes 55, 3264–3270 (2006). [DOI] [PubMed] [Google Scholar]
- 44.Zhang H, et al. Multiple, temporal-specific roles for HNF6 in pancreatic endocrine and ductal differentiation. Mech Dev 126, 958–973 (2009). [DOI] [PMC free article] [PubMed] [Google Scholar]
- 45.Henley KD, et al. Threshold-Dependent Cooperativity of Pdx1 and Oc1 in Pancreatic Progenitors Establishes Competency for Endocrine Differentiation and beta-Cell Function. Cell Rep 15, 2637–2650 (2016). [DOI] [PMC free article] [PubMed] [Google Scholar]
- 46.Zhang Y, et al. HNF6 and Rev-erbalpha integrate hepatic lipid metabolism by overlapping and distinct transcriptional mechanisms. Genes Dev 30, 1636–1644 (2016). [DOI] [PMC free article] [PubMed] [Google Scholar]
- 47.Patel KA, et al. Heterozygous RFX6 protein truncating variants are associated with MODY with reduced penetrance. Nat Commun 8, 888 (2017). [DOI] [PMC free article] [PubMed] [Google Scholar]
- 48.Fuchsberger C, et al. The genetic architecture of type 2 diabetes. Nature 536, 41–47 (2016). [DOI] [PMC free article] [PubMed] [Google Scholar]
- 49.Flannick J, et al. Sequence data and association statistics from 12,940 type 2 diabetes cases and controls. Scientific data 4, 170179 (2017). [DOI] [PMC free article] [PubMed] [Google Scholar]
- 50.Davies MJ, et al. Management of hyperglycaemia in type 2 diabetes, 2018. A consensus report by the American Diabetes Association (ADA) and the European Association for the Study of Diabetes (EASD). Diabetologia 61, 2461–2498 (2018). [DOI] [PubMed] [Google Scholar]
- 51.Smith RJ, et al. Individualizing therapies in type 2 diabetes mellitus based on patient characteristics: what we know and what we need to know. J Clin Endocrinol Metab 95, 1566–1574 (2010). [DOI] [PMC free article] [PubMed] [Google Scholar]
- 52.Geusz RJ, et al. Pancreatic progenitor epigenome maps prioritize type 2 diabetes risk genes with roles in development. Elife 10(2021). [DOI] [PMC free article] [PubMed] [Google Scholar]
- 53.Lee K, et al. FOXA2 is required for enhancer priming during pancreatic differentiation. Cell reports 28, 382–393. e387 (2019). [DOI] [PMC free article] [PubMed] [Google Scholar]
- 54.Chen J, Bardes EE, Aronow BJ & Jegga AG ToppGene Suite for gene list enrichment analysis and candidate gene prioritization. Nucleic acids research 37, W305–W311 (2009). [DOI] [PMC free article] [PubMed] [Google Scholar]
- 55.Barker JM, et al. Two single nucleotide polymorphisms identify the highest-risk diabetes HLA genotype: potential for rapid screening. Diabetes 57, 3152–3155 (2008). [DOI] [PMC free article] [PubMed] [Google Scholar]
- 56.Oram RA, et al. A type 1 diabetes genetic risk score can aid discrimination between type 1 and type 2 diabetes in young adults. Diabetes care 39, 337–344 (2016). [DOI] [PMC free article] [PubMed] [Google Scholar]
- 57.Johnson MB, et al. Trisomy 21 is a cause of permanent neonatal diabetes that is autoimmune but not HLA associated. Diabetes 68, 1528–1535 (2019). [DOI] [PMC free article] [PubMed] [Google Scholar]
Methods-only References
- 58.Howson JM, et al. Genetic analysis of adult-onset autoimmune diabetes. Diabetes 60, 2645–2653 (2011). [DOI] [PMC free article] [PubMed] [Google Scholar]
- 59.Zalloua PA, et al. WFS1 mutations are frequent monogenic causes of juvenile-onset diabetes mellitus in Lebanon. Human molecular genetics 17, 4012–4021 (2008). [DOI] [PubMed] [Google Scholar]
- 60.Rong E, et al. Heteroplasmy Detection of Mitochondrial DNA A3243G Mutation Using Quantitative Real-Time PCR Assay Based on TaqMan-MGB Probes. BioMed research international 2018, 1286480 (2018). [DOI] [PMC free article] [PubMed] [Google Scholar]
- 61.Hohwieler M, et al. Human pluripotent stem cell-derived acinar/ductal organoids generate human pancreas upon orthotopic transplantation and allow disease modelling. Gut 66, 473–486 (2017). [DOI] [PMC free article] [PubMed] [Google Scholar]
- 62.Mali P, et al. RNA-guided human genome engineering via Cas9. Science 339, 823–826 (2013). [DOI] [PMC free article] [PubMed] [Google Scholar]
- 63.Ding Q, et al. Enhanced efficiency of human pluripotent stem cell genome editing through replacing TALENs with CRISPRs. Cell stem cell 12, 393–394 (2013). [DOI] [PMC free article] [PubMed] [Google Scholar]
- 64.Rezania A, et al. Reversal of diabetes with insulin-producing cells derived in vitro from human pluripotent stem cells. Nat Biotechnol 32, 1121–1133 (2014). [DOI] [PubMed] [Google Scholar]
- 65.Mahaddalkar PU, et al. Generation of pancreatic β cells from CD177+ anterior definitive endoderm. Nature biotechnology, 1–12 (2020). [DOI] [PubMed]
- 66.Salat D, Liefke R, Wiedenmann J, Borggrefe T & Oswald F ETO, but not leukemogenic fusion protein AML1/ETO, augments RBP-Jκ/SHARP-mediated repression of Notch target genes. Molecular and cellular biology 28, 3502–3512 (2008). [DOI] [PMC free article] [PubMed] [Google Scholar]
- 67.Wang A, et al. Epigenetic priming of enhancers predicts developmental competence of hESC-derived endodermal lineage intermediates. Cell Stem Cell 16, 386–399 (2015). [DOI] [PMC free article] [PubMed] [Google Scholar]
- 68.Allhoff M, Seré K, Pires F, J., Zenke M & Costa G, I. Differential peak calling of ChIP-seq signals with replicates with THOR. Nucleic acids research 44, e153–e153 (2016). [DOI] [PMC free article] [PubMed] [Google Scholar]
- 69.Rappsilber J, Mann M & Ishihama Y Protocol for micro-purification, enrichment, pre-fractionation and storage of peptides for proteomics using StageTips. Nature protocols 2, 1896 (2007). [DOI] [PubMed] [Google Scholar]
- 70.Zecha J, et al. TMT labeling for the masses: A robust and cost-efficient, in-solution labeling approach. Molecular & Cellular Proteomics, mcp. TIR119. 001385 (2019). [DOI] [PMC free article] [PubMed]
- 71.Tyanova S, et al. The Perseus computational platform for comprehensive analysis of (prote) omics data. Nature methods 13, 731 (2016). [DOI] [PubMed] [Google Scholar]
- 72.Tusher VG, Tibshirani R & Chu G Significance analysis of microarrays applied to the ionizing radiation response. Proceedings of the National Academy of Sciences 98, 5116–5121 (2001). [DOI] [PMC free article] [PubMed] [Google Scholar]
- 73.Conforto TL, Steinhardt IV GF & Waxman DJ Cross talk between GH-regulated transcription factors HNF6 and CUX2 in adult mouse liver. Molecular Endocrinology 29, 1286–1302 (2015). [DOI] [PMC free article] [PubMed] [Google Scholar]
- 74.Wacker SA, et al. RITA, a novel modulator of Notch signalling, acts via nuclear export of RBP‐J. The EMBO journal 30, 43–56 (2011). [DOI] [PMC free article] [PubMed] [Google Scholar]
- 75.Vizcaíno JA, et al. The PRoteomics IDEntifications (PRIDE) database and associated tools: status in 2013. Nucleic acids research 41, D1063–D1069 (2012).<\References> [DOI] [PMC free article] [PubMed] [Google Scholar]
Associated Data
This section collects any data citations, data availability statements, or supplementary materials included in this article.
Supplementary Materials
Data Availability Statement
Sequencing data (RNA-seq, ATAC-seq and ChIP-seq) generated for this work has been deposited at Gene Expression Omnibus (https://www.ncbi.nlm.nih.gov/geo/query/acc.cgi?acc=GSE131817). The mass spectrometry proteomics data have been deposited to the ProteomeXchange Consortium (http://proteomecentral.proteomexchange.org) via the PRIDE partner repository75 with the dataset identifier PXD018887. Additional data that support the findings of this study are available from the corresponding authors upon request. Furthermore, source data are provided with this paper.