Abstract
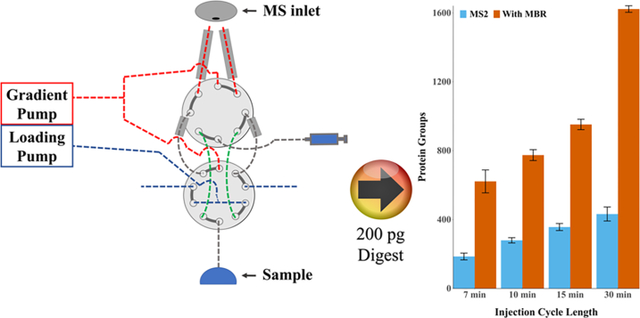
Single-cell proteomics (SCP) has great potential to advance biomedical research and personalized medicine. The sensitivity of such measurements increases with low-flow separations (<100 nL/min) due to improved ionization efficiency, but the time required for sample loading, column washing, and regeneration in these systems can lead to low measurement throughput and inefficient utilization of the mass spectrometer. Herein, we developed a two-column liquid chromatography (LC) system that dramatically increases the throughput of label-free SCP using two parallel subsystems to multiplex sample loading, online desalting, analysis, and column regeneration. The integration of MS1-based feature matching increased proteome coverage when short LC gradients were used. The high-throughput LC system was reproducible between the columns, with a 4% difference in median peptide abundance and a median CV of 18% across 100 replicate analyses of a single-cell-sized peptide standard. An average of 621, 774, 952, and 1622 protein groups were identified with total analysis times of 7, 10, 15, and 30 min, corresponding to a measurement throughput of 206, 144, 96, and 48 samples per day, respectively. When applied to single HeLa cells, we identified nearly 1000 protein groups per cell using 30 min cycles and 660 protein groups per cell for 15 min cycles. We explored the possibility of measuring cancer therapeutic targets with a pilot study comparing the K562 and Jurkat leukemia cell lines. This work demonstrates the feasibility of high-throughput label-free single-cell proteomics.
Graphical Abstract
INTRODUCTION
Profiling the expression of biomolecules in single cells is increasingly important for biomedical research as it addresses questions involving cellular heterogeneity that are intractable when analyzing populations of cells. This heterogeneity may arise from a variety of sources including cell cycle, stochastic gene expression, and perturbations from the microenvironment.1–3 Single-cell RNA sequencing (scRNA-seq) can, through multiplexing, profile the transcriptome of tens of thousands of single cells per day,4 and these measurements of gene expression are often used to infer protein expression. However, the transcriptome generally deviates significantly from the proteome, and as such, direct profiling of protein expression in single cells is essential. Single-cell proteomics (SCP) is technically challenging because it lacks an analog to polymerase chain reaction (PCR) amplification to increase sensitivity and also lacks high-order multiplexing to achieve measurement throughput on par with scRNA-seq. Antibody-based techniques including immunohistochemistry, flow cytometry, and mass cytometry achieve high throughput but require the preselection of available antibodies for protein detection. While single-molecule protein sequencing approaches are on the horizon,5 currently only mass spectrometry (MS)-based proteomics is capable of quantifying more than a thousand proteins from a single cell.6,7 At present, SCP frontiers include increasing proteome coverage and overall sensitivity to enable the study of low-abundance proteins that currently go undetected, as well as increasing throughput to measure large numbers of single cells for greater statistical power and to potentially discover rare cell populations.
To maximize proteome coverage for SCP, each step of the workflow should be optimized to increase sample recovery and transmit as many ions as possible to the mass analyzer.8,9 To this end, it is beneficial to reduce sample preparation volumes to enhance reaction kinetics and minimize adsorptive losses.10–13 In addition, narrow-bore liquid chromatography (LC) or capillary electrophoresis (CE)12,14,15 columns operate at reduced flow rates, which increases ionization efficiency at the electrospray source,16 and ion mobility separations and ultrasensitive mass spectrometers with high-transmission ion optics may be used.6,7,16–18 The specific mode employed for MS data acquisition also has a significant impact on proteome coverage. For example, for data-dependent acquisition (DDA), the long ion accumulation times required to generate high-quality MS2 spectra from trace peptides limit the overall number of MS2 spectra acquired. To increase measurement throughput, multiplexed analyses using tandem mass tag (TMT) reagents in the presence of a larger carrier sample have been demonstrated in the TMT calibrator19 and SCoPE-MS approaches.20 To mitigate the slow MS2 sampling rate for label-free analyses, data-independent acquisition may be employed12,21,22 or peptides can be identified based on their accurate precursor ion masses combined with their normalized elution times. The latter strategy forms the basis of the accurate mass and time (AMT) tag23 and match between runs (MBR) algorithms,24,25 which are commonly employed to identify peptides that were not selected or identified in MS2 spectra in a given analysis. At present, between 1000 and 2000 protein groups are optimally identified from single cells, regardless of whether a label-free or multiplexed approach is employed.6,7,11–13
While attainable proteome coverage has thus far been similar for multiplexed and label-free SCP, the ability to analyze over a dozen single cells simultaneously gives TMT multiplexing a clear throughput advantage, with >1000 single cells analyzed in ~10 days.11,26 Still, given the simplified sample preparation and experimental design and large dynamic range27 associated with label-free SCP, as well as quantification challenges resulting from, e.g., precursor coisolation, isotopic impurities, and the carrier proteome effect28 when utilizing TMT reagents, label-free approaches are likely to coexist with TMT multiplexing approaches for the foreseeable future. As such, there is a strong incentive to achieve higher measurement throughput for label-free SCP. To this end, Mann et al. utilized an overall cycle time of 35 min with a 30 min gradient,12 and Zhu and co-workers found that 30 min gradients having 60 min cycle times resulted in increased proteome coverage relative to 60 min gradients,29 likely due to sharper, more intense peaks. These studies suggest that robust proteome coverage is possible using fast separations. Much faster LC separations on the order of 1–5 min have been demonstrated for proteome profiling,30,31 but the extended time required to load samples and wash and regenerate the columns largely negated the potential throughput gains. One solution to increase throughput for bulk proteome profiling has been to develop LC systems with multiple columns.32–37 For example, Livesay et al. developed a four-column LC system33 that achieved a 100% duty cycle while sampling only the productive portion of the gradient from each column. However, the fully customized system was highly complex and costly, requiring 11 individually controlled valves, and was not demonstrated for the low-flow rates required to maximize sensitivity for SCP.
Here, we report a two-column nanoflow-LC platform that uses only two valves and a single commercial LC binary pump with an integrated loading pump. The platform operates at just 80 nL/min, providing high sensitivity, and it achieves a duty cycle of 58% for 4 min gradients and 83% for 25 min gradients. Using optimized settings and with increased reliance on accurate MS1-level feature matching, we achieved an average coverage of 660 protein groups for single cells with 11 min gradients (15 min overall cycles) and 990 protein groups for 25 min gradients (30 min cycles), thus demonstrating the feasibility of high-throughput and high-sensitivity label-free SCP. We use this system to compare the expression of cancer therapeutic targets between two leukemia cell lines.
MATERIALS AND METHODS
Sample Preparation.
Pierce HeLa Protein Digest Standard (Thermo Fisher, Waltham, MA) was diluted in LC–MS grade water (Honeywell, Charlotte, NC) to provide single-cell-sized (200 pg) aliquots for system characterization. For MBR library creation, 10 ng aliquots of the same HeLa digest and of a K562 peptide digest (Promega) were prepared. HeLa, Jurkat, and K562 cell lines were purchased from ATCC (Manassas, VA). These were cultured at 37 °C in 5% CO2, with 10% fetal bovine serum and 1% penicillin-streptomycin added to Dulbecco’s modified Eagle’s media (VWR, Radnor, PA) for HeLa cells and to Gibco RPMI 1640 media 1× (Life Technologies, NY) for Jurkat and K562 cells. Cells were passaged every 2 days or upon reaching 70% confluency. The three cell lines were harvested and washed three times with phosphate-buffered saline (PBS) and centrifuged to remove debris and supernatant at 200g for 5 min after each wash. The three cell lines were then counted and resuspended to a concentration of approximately 104 cells/mL, after which single cells were isolated into nanowells using the CellenONE X1 platform (Cellenion, Lyon, France) using gating parameters similar to those described previously.13 The cells were then prepared using the nanoPOTS workflow.10,29
LC System Construction.
LC system components were connected as shown in Figure 1. Two parallel subsystems alternately carried out the overhead steps of column washing, regeneration, and sample loading, while the other column eluted peptides. A single commercial LC pump (UltiMate NCS-3500RS, Thermo Fisher) provided both nanoflow gradient elution and microflow sample loading for both columns. A separate solid-phase extraction (SPE) column was used for each subsystem (Figure S2). The loading pump operated at 18 μL/min, and a split column consisting of a 20 cm long, 20 μm i.d. empty fused silica capillary (Molex, Lisle, IL) was employed such that the sample was driven from the sample loop to the SPE column at a flow rate of approximately 1 μL/min. A single syringe-driven sampling probe interfaced with the nanowell chips to transfer the sample from each well to a sample loop as described by Williams et al.29 Nanowell chips containing lyophilized samples, a vial containing fresh mobile phase A (MP A, 0.1% formic acid in water), and a vial containing ~90% DMSO/10% H2O (v/v) that was used to rinse the sampling probe tip were cooled to 8 °C on the moving autosampler stage using a thermoelectric cooler. The high-voltage switch used to apply electrospray potential to the active column used a high-voltage relay (Part # K43C334 TE Connectivity, Berwyn, PA), and a schematic of the switch is shown in Figure S1.
Figure 1.
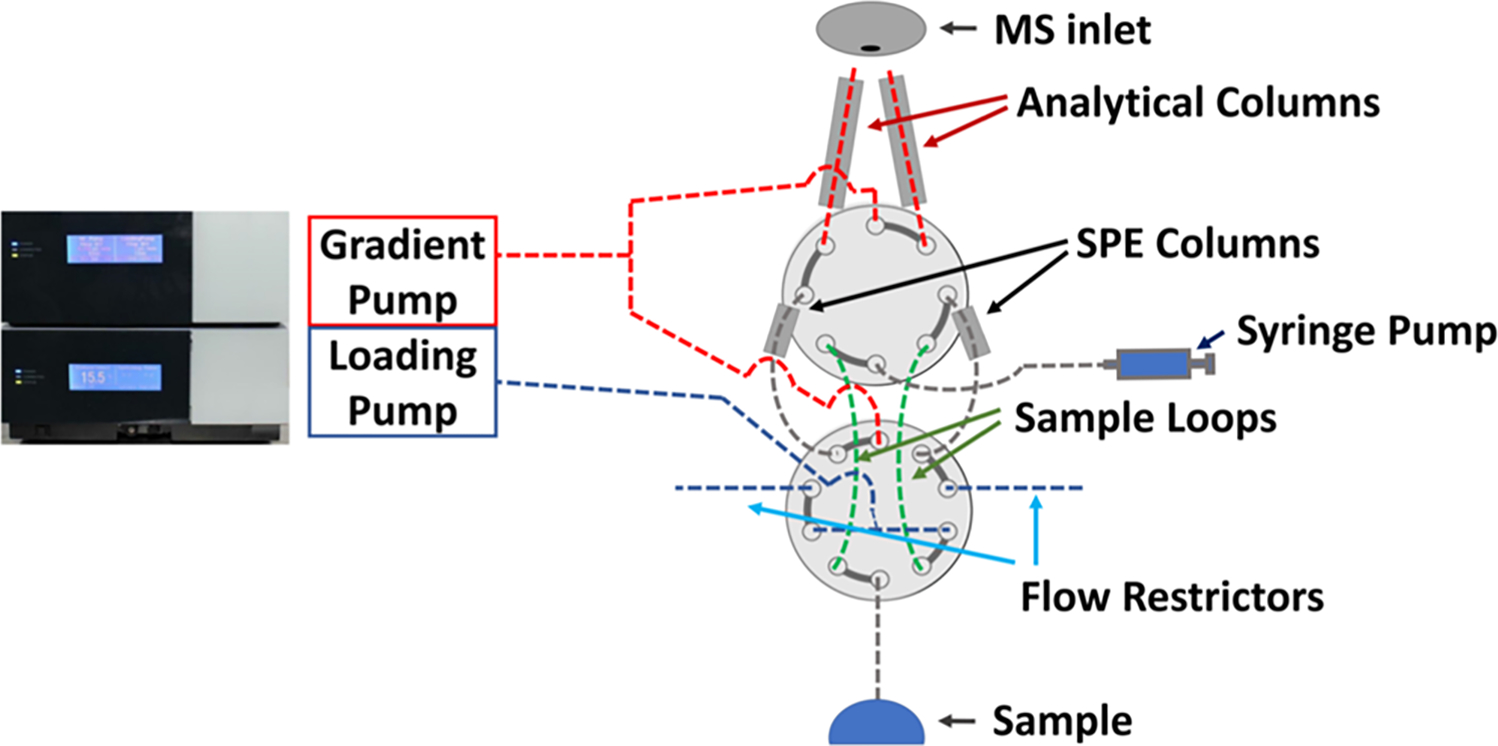
Diagram of the dual-column nanoLC system. The system interweaves two valves and employs two subsystems, each consisting of a sample loop, SPE column and analytical column. These subsystems share a sample collection tip, syringe, gradient LC pump and isocratic loading pump, allowing for SPE loading and column washing on one subsystem, while the other elutes peptides. Shown on the left is a commercial LC module containing both a gradient and a loading pump, which provides flow for all operations.
All autosampling operations were controlled with a Raspberry Pi (Rpi) computer (Raspberry Pi Foundation, Cambridge, U.K.) that was programmed in HTML, JavaScript, json, csv, and python through a graphical user interface. The click, colorzero, Flask, Flask-SocketIO, gpiozero, itsdangerous, Jinja2, MarkupSafe, numpy, opencv-python, pandas, pkgresources, protobuf, pygame, python-dateutil, python-engineio, python-socketio, pytz, Rpi.GPIO, Rx, six, Werkzeug, xlrd, zaber-motion, zaber-motion-bindings-linux, and zaber-motion-bindings-windows packages were used.
Liquid Chromatography.
SPE columns were ~5 cm long, 75 μm i.d. fused silica capillaries packed with 3 μm C18 particles as described previously.27 NanoLC columns were prepared in house using 50 μm i.d., 360 μm o.d. fused silica capillaries that were packed to a length of ~10 cm with 1.3 μm diameter, 100 Å Kinetex EVO C18 superficially porous particles (Phenomenex, Torrance, CA). A flow rate of 80 nL/min was used for all separations. Mobile phase B (MP B) was LC–MS-grade acetonitrile (Honeywell, Charlotte, North Carolina) with 0.1% formic acid. The gradient profiles used for the various cycle times are provided in Tables S1–S4. A second gradient passed through the column for additional washing, while the other column actively eluted peptides for MS analysis.
Mass Spectrometry.
For all analyses of single cells and single-cell-sized aliquots (200 pg) of bulk-prepared protein digest, an Orbitrap Exploris 480 mass spectrometer (Thermo Fisher) was set with a maximum MS1 injection time of 502 ms, MS1 scan range of 375–1575, MS2 automatic gain control (AGC) target of 150%, MS2 resolution of 60k, maximum MS2 injection time of 246 ms, and dynamic exclusion window of 30 s. Unless otherwise specified, we set the precursor intensity threshold for MS2 selection to 1E4, MS2 AGC target to 300%, and MS1 resolution to 120k. To optimize parameters for maximum proteome coverage, we evaluated a variety of mass spectrometer settings in triplicate analyses of single-cell-sized aliquots HeLa peptide tryptic digest. These parameters included precursor intensity threshold for MS2 selection (1E4 and 5E5), MS1 AGC target (200, 300, 400, 500%) and MS1 resolution (60k, 120k, 240k). For the analysis of 10 ng HeLa or K562 digests for MBR library generation (referred to as Feature Mapping in Proteome Discoverer), we used a 300% AGC target for MS1 with a maximum injection time of 118 ms, 120k MS1 resolution, a 5E3 MS2 selection threshold, 15k MS2 resolution (at m/z 200), 100% MS2 automatic gain control (AGC) target, and a maximum MS2 injection time of 118 ms. Each LC column was attached to a separate chemically etched 10 μm i.d. emitter (MicrOmics Technologies, Spanish Fork, UT), and a potential of 2200 V was applied to the union connecting the active column and emitter through a software-controlled relay. The MS settings are summarized in Table S5.
Data Analysis.
RAW files were processed with Proteome Discoverer (PD) 2.4 with default values for a two-step database search using Sequest HT and INFERYS rescoring, except for the following modifications. MS2 spectra were searched for fully tryptic peptides with N-terminal protein acetylation, methionine oxidation, and N-terminal methionine loss acetylation as variable modifications and carbamidomethylation of cysteine residues as a fixed modification. The precursor and fragment mass tolerances were set to 5 ppm and 0.02 Da, respectively, and the normalized collision energy for INFERYS was set to 30%. The precursor ion quantifier node was used to calculate protein abundances based on the top 3 distinct peptides from each protein. Protein abundances were normalized by the total peptide amount. Mass tolerance for MBR was reduced to 3 ppm for all runs; retention time tolerance was reduced to 30 s for 30 min cycles and 10 s for 15 min and faster cycles (Figure S4) unless specified.
Postprocessing was performed in R. Using the Grubb’s test with an α of 0.05, one outlier was removed from the 100 consecutive 15 min replicates, one outlier from the 250 consecutive 10 min replicates, and three outliers were removed from the 148 single-cell biological replicates. Coefficients of variation (CVs) were calculated from median-normalized intensity values for peptides identified with <33% missing values. Venn diagrams were prepared using the same criteria. For comparison between cell lines, proteins were normalized to total protein abundance for each cell line. For PCA, the missing values were replaced within each cell line with values from a normal distribution with a downshift of 1.8 and a width of 0.3. Data for the three cell lines were then combined and analyzed with the prcomp function in R. Differentially expressed proteins were analyzed in DAVID with a custom background of the proteins found with <33% missing values in both the Jurkat and K562 cells.38,39
RESULTS AND DISCUSSION
To increase measurement throughput for label-free single-cell proteome profiling, we multiplexed the four steps of sample collection, SPE loading, sample separation/MS analysis, and column regeneration (Figures S2 and S3) to enable single cells or other trace samples to be analyzed as fast as every 7 min using a single Ultimate 3000 NCS-3500RS module. The approach employs two LC subsystems, each with its own sample loop, SPE column, analytical column, and nanoESI emitter, as shown in Figure 1. The LC pump and autosampling capabilities are shared between the two subsystems.
While rapid LC–MS/MS analyses result in relatively fewer MS2 spectra, transfer of identifications based on accurate precursor mass and elution time using AMT tag23 or MBR24,25 algorithms can accommodate much faster analyses. Under such conditions, the quality and/or quantity of MS1 spectra may be increased by intentionally limiting the number of MS2 spectra acquired. We evaluated proteome coverage for single-cell-sized aliquots of HeLa digest with a 15 min cycle time as a function of MS1 resolution and AGC target, as well as the precursor intensity threshold setting to trigger MS2 fragmentation. While holding other parameters constant, we increased the intensity threshold from 1E4 to 5E5 to reduce the number of MS2 spectra. This resulted in an average increase in proteome coverage of 37% (Figure 2A). In contrast, adjusting the MS1 resolution and AGC target while holding other parameters constant each resulted in a <10% average increase in coverage from best to worst settings (Figure 2B), with no clearly superior setting across all conditions. These results indicate that increasing the number of MS1 spectra is key to improving proteome coverage when relying on transferred identifications. Reproducibility in PSM abundance across replicates is similar for the two thresholds (median coefficient of variation (CV) of 11% for 1E4 and 14% for 5E5, as shown in Figure 2C). There is a strong overlap between the identifications in low- and high-threshold analyses (Figure 2D), and the additional proteome coverage for high-threshold analysis primarily resulted from an increase in identified low-abundance proteins that were missed when numerous MS2 spectra were acquired (Figure S6). However, to be more conservative in relying on MBR identifications and because we expected a lower signal when transferring the method to single cells due to, e.g., incomplete sample recovery during preparation, we selected a 1E4 threshold, an AGC target of 300%, and a resolution of 120k (m/z 200) for subsequent studies. This ensured we would have at least a small number of MS2 identifications for retention time normalization. Peptides and protein groups identified during optimization of settings are provided in Table S9.
Figure 2.
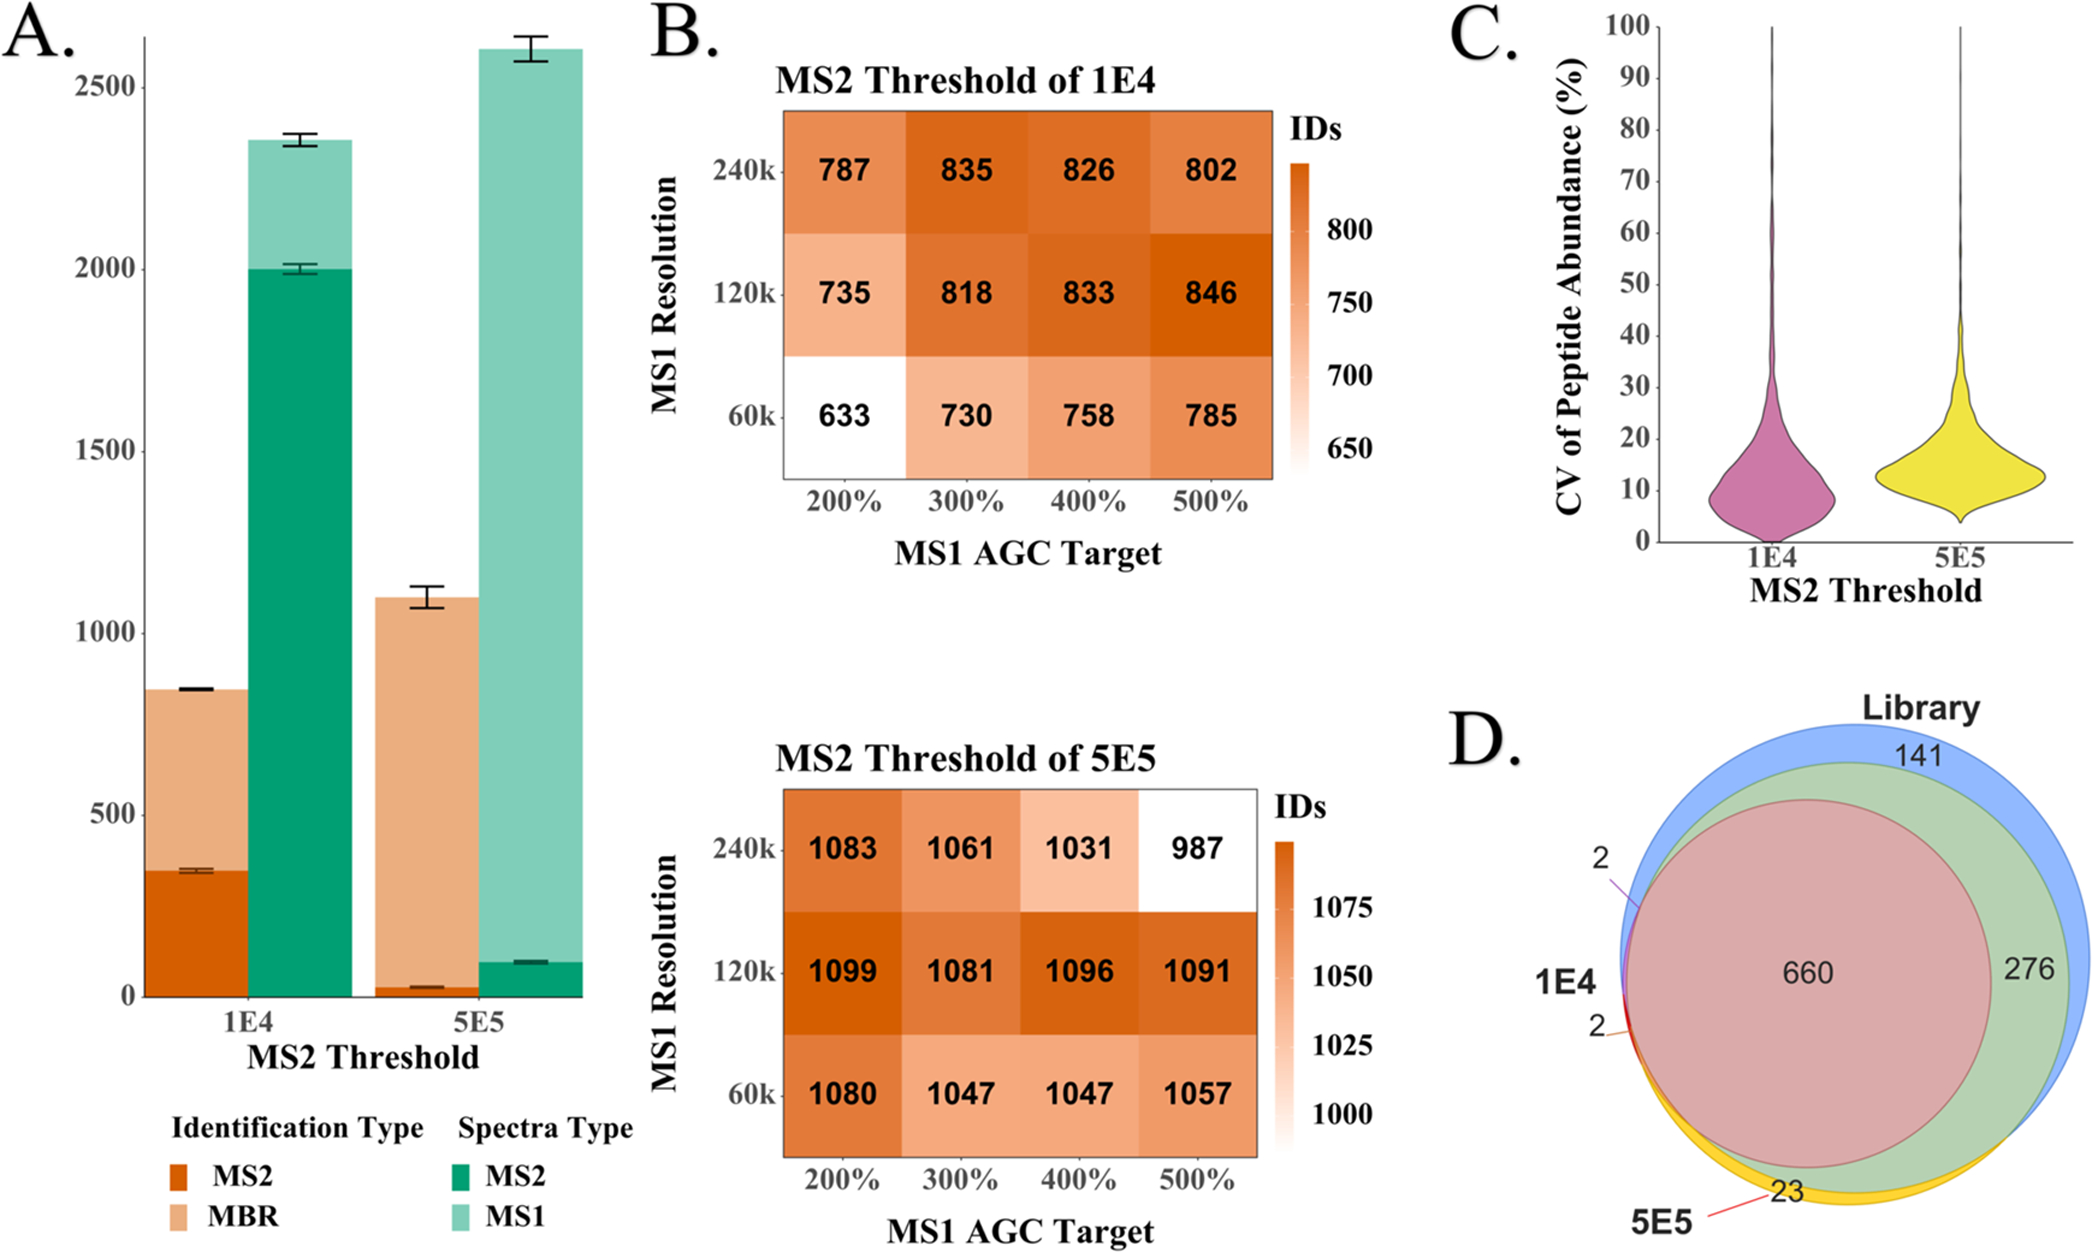
Optimization of acquisition settings using 200 pg aliquots of HeLa digest. (A) Relationship between the number of MS2 spectra acquired and the number of high-confidence protein groups identified. (B) Three-dimensional (3D) matrix of mass spectrometer settings and combined MBR and MS2 identifications. The shading indicates the number of proteins identified on average per run. The conditions with the highest number of identifications for each threshold were used to determine the (C) coefficients of variation (CVs) of the log 2-transformed peptide abundances and (D) Venn diagrams of the overlapping protein identifications.
Using our dual-column system with in-house-packed nanoLC columns, we generally observed a high degree of reproducibility between columns. Across 100 consecutive analyses of 200 pg of tryptic digest at a throughput of 4 samples/h, we identified an average of 937 protein groups with a 4% difference in median abundances (Figure 3A). The median CVs were 18% for both columns and 17.5 or 17.4% with each column considered separately (Figure 3B). As such, analyzing samples across both columns for a given study provides quantitative performance on par with typical label-free studies, and this technical variability can be further reduced by dedicating each column to a separate study while maintaining high overall measurement throughput. The identified peptides and proteins are provided in Table S10.
Figure 3.
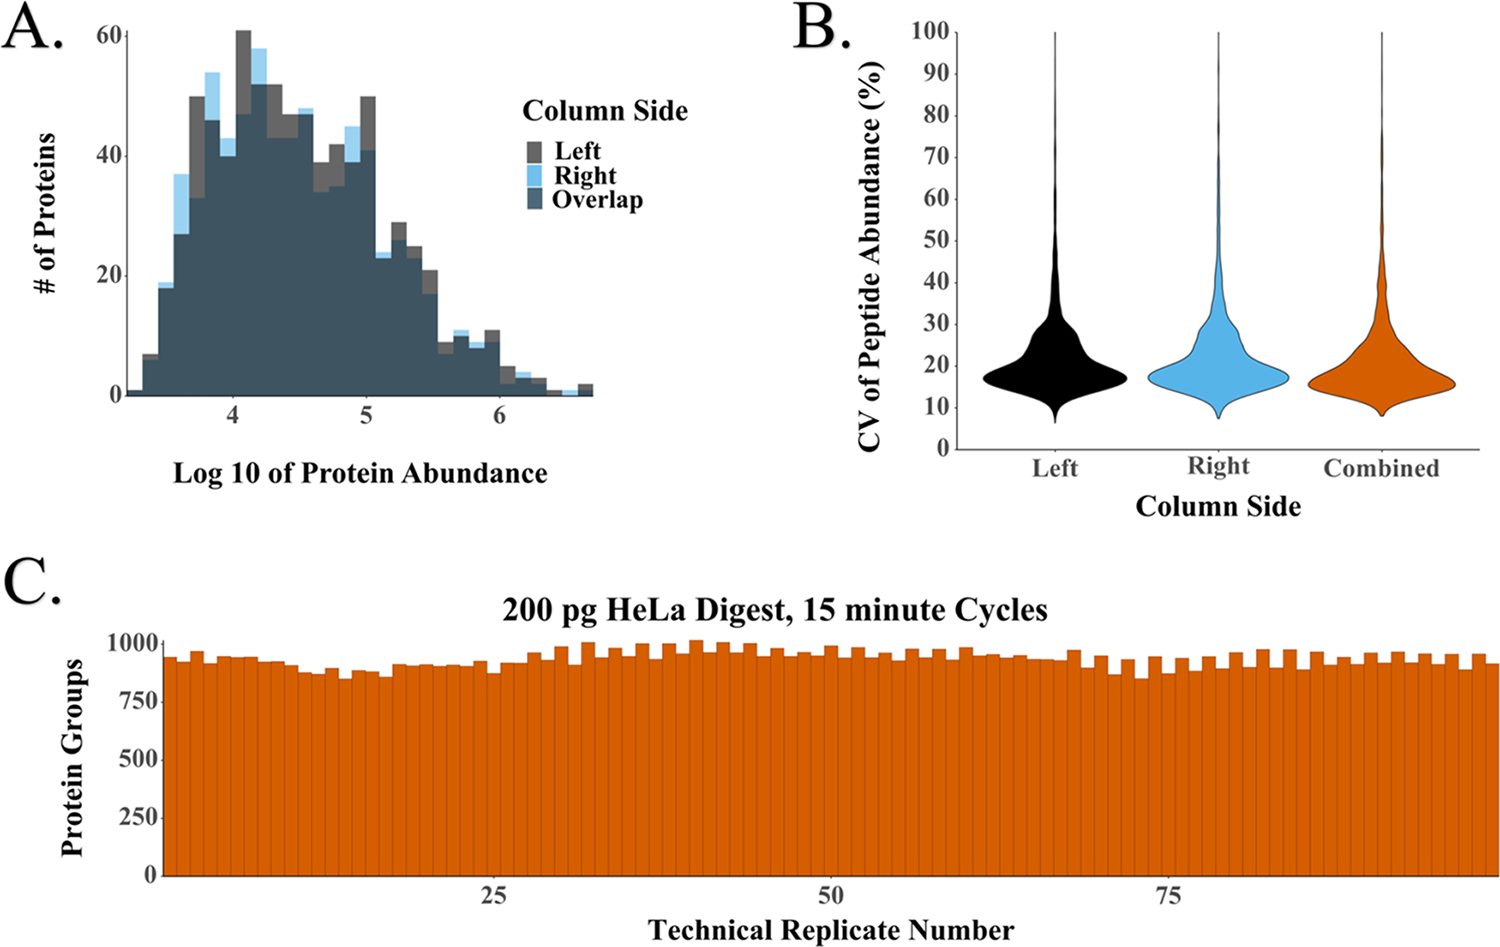
LC–MS performance for the replicate analysis of 200 pg HeLa digest with 15 min cycles. (A) Distributions of protein abundances for the two analytical columns, with a 4% difference between unnormalized median intensities. (B) CVs of peptide abundance for each column separately and both columns together. (C) Number of protein groups identified across 100 technical replicates.
We evaluated system performance for different cycle times ranging from 7 to 30 min, where cycle time comprises both active peptide elution and any inactive time between samples. We found that the average number of identifications increased with cycle length, with 620, 770, 950, and 1620 protein groups identified for 7, 10, 15, and 30 min cycles, corresponding to 206, 144, 96, and 48 samples per day, respectively (Figure 4A). Identified proteins and peptides are presented in Table S11. Some of the increase in proteome coverage observed with longer cycle times is the result of an increased duty cycle (i.e., the time during which peptides actively elute divided by total cycle time). With the current setup, the duty cycle increases from 58 to 83% when the overall cycle time increases from 7 to 30 min (Figure 4B). This results in a nonlinear increase in MS spectra acquired in the longer analyses. For example, ~600 MS1 spectra were acquired with 7 min cycles vs ~3200 MS1 spectra with 30 min cycles. The duty cycle may be increased by implementing alternative valving strategies, increasing the number of columns or operating at higher flow rates. However, increasing the flow rate would be expected to reduce sensitivity due to decreased ionization efficiency.40,41 Additionally, fast gradients benefitted the analyses and partially compensated for the reduced acquisition time by reducing peak widths and increasing peak intensities as determined by the IMP apQuant node42 in PD (Figure 5).
Figure 4.
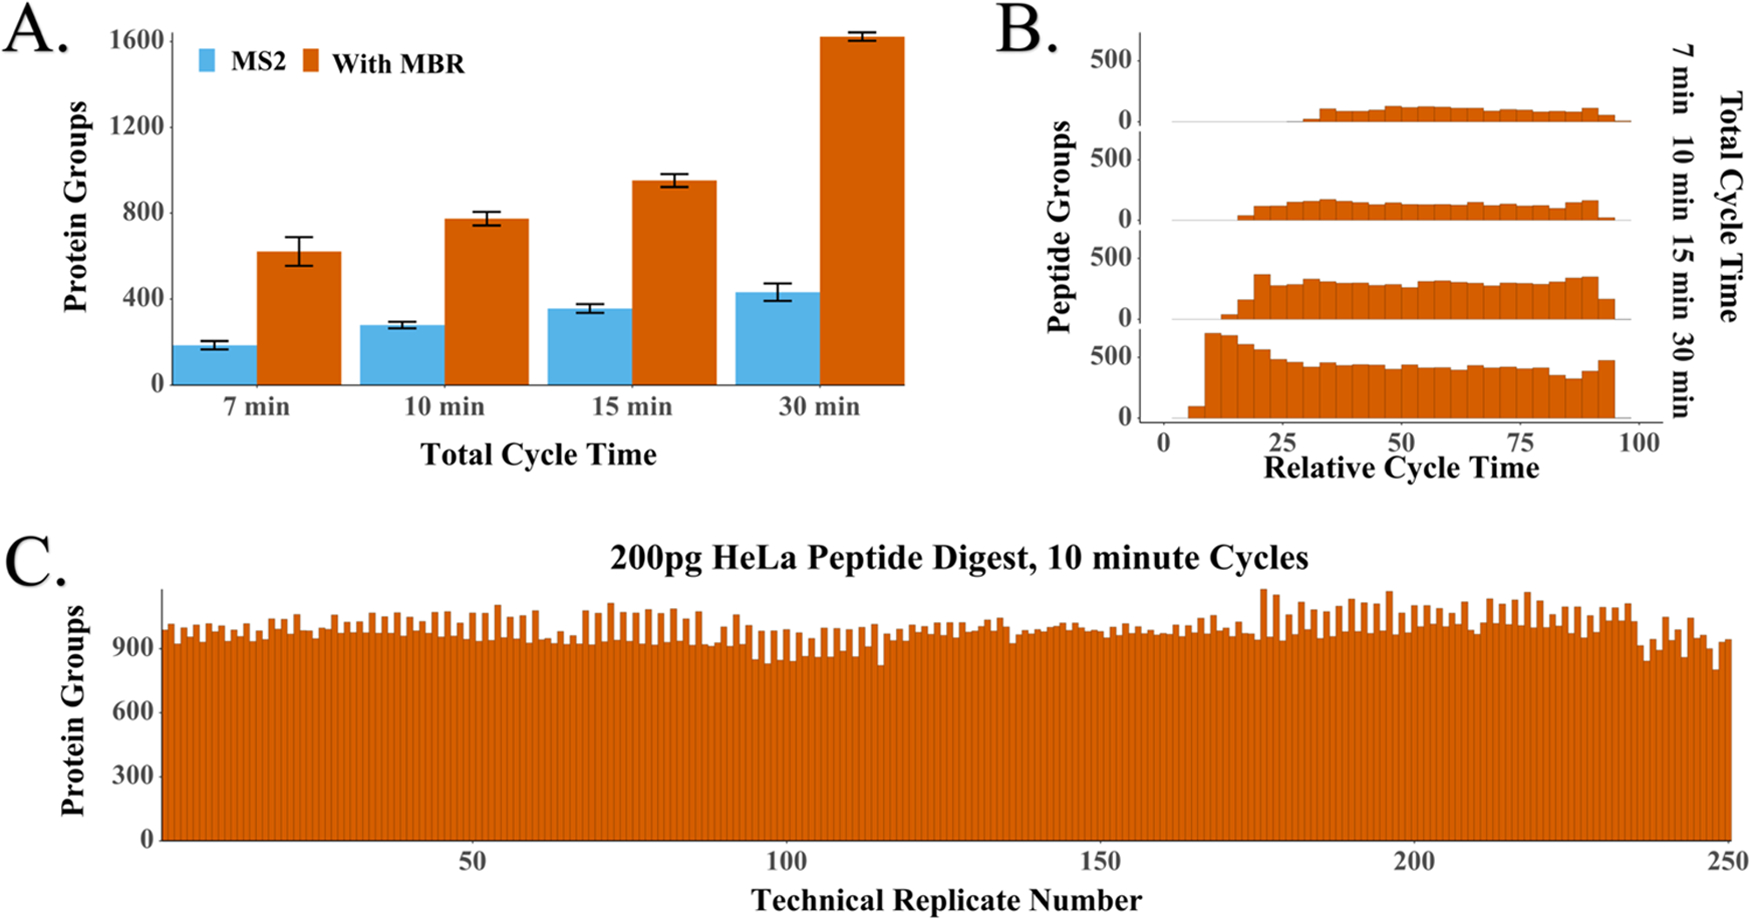
Impact of cycle time on proteome coverage. (A) Protein groups identified with or without MBR for different cycle times. Error bars represent standard deviations (n = 10). (B) Distribution of peptides identified across the cycle. Duty cycles were 58, 69, 73, and 83% for 7, 10, 15, and 30 min cycles, respectively. (C) Proteome coverage across 250 replicate injections of 200 pg aliquots of HeLa tryptic digest.
Figure 5.
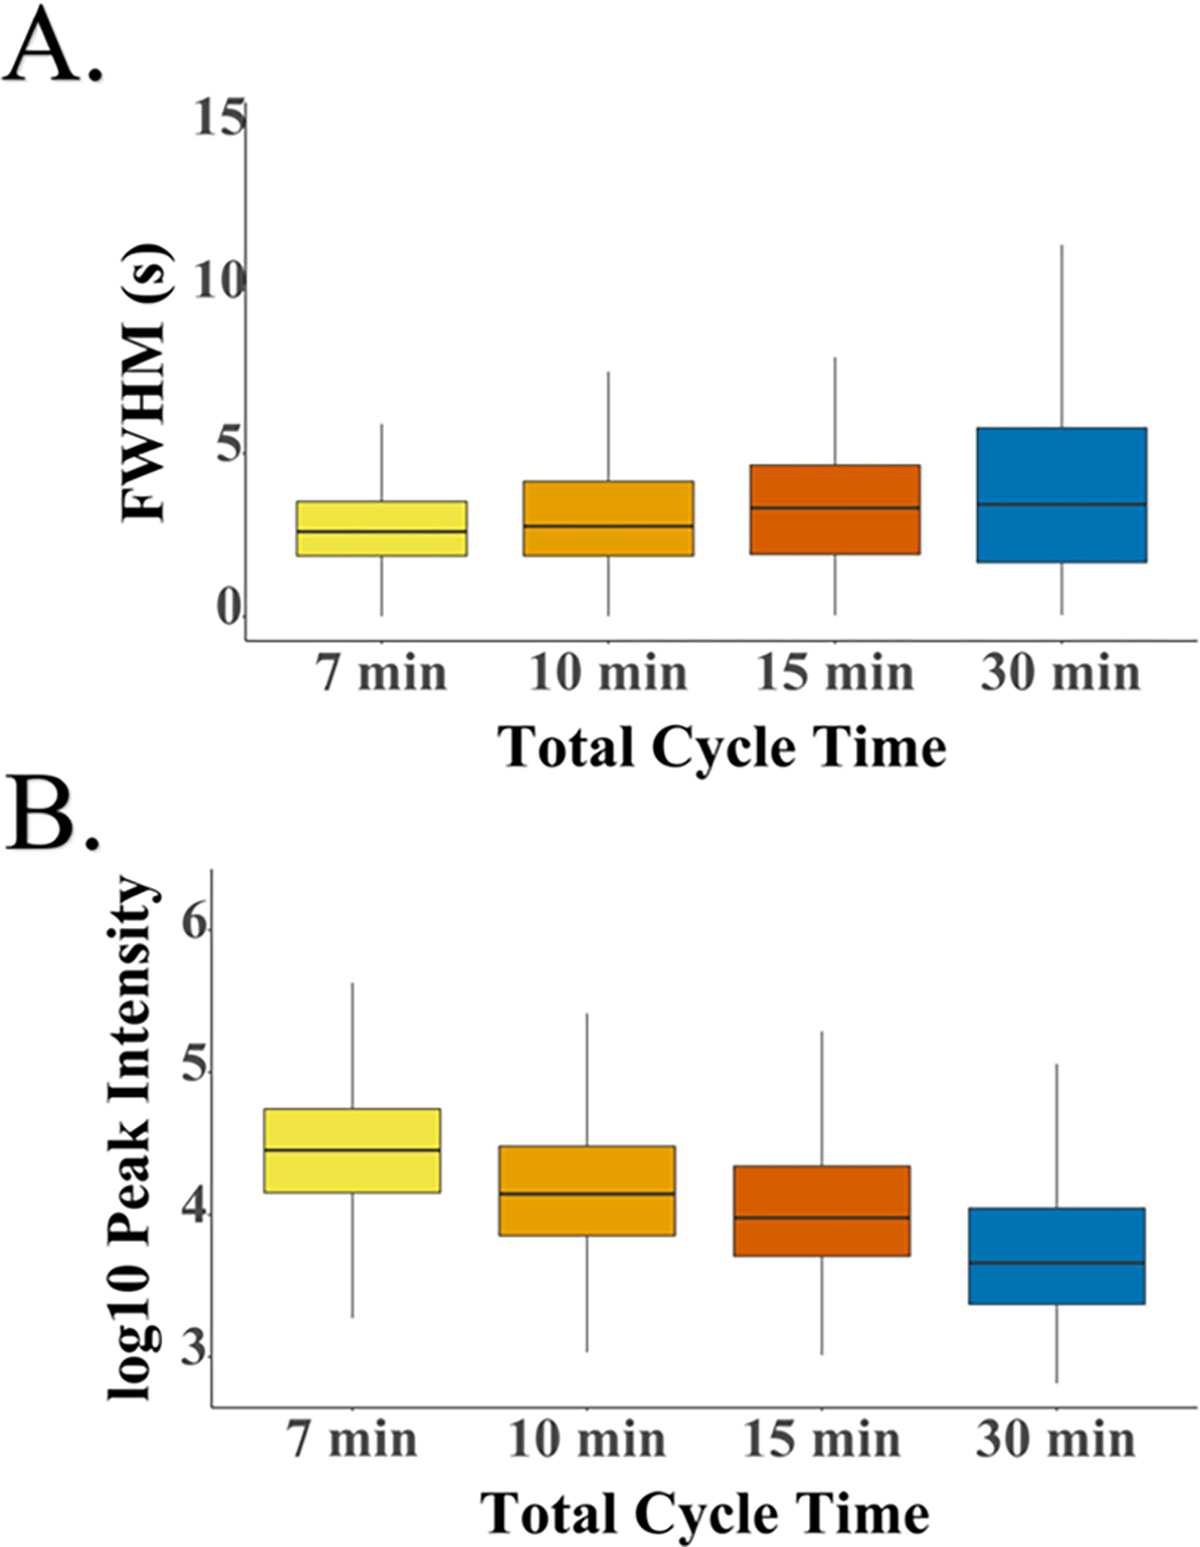
Peak parameter box plots. (A) Peak widths (full width at half-maximum) for the four different cycle times. (B) Peak intensities for each cycle time.
Having characterized the system using single-cell-sized aliquots of bulk-prepared digests, we next analyzed 50 single HeLa cells with 30 min cycles, which resulted in the identification of an average of 986 protein groups per single cell (Figure 6). This indicates that rapid analyses that rely on MBR, efficient chromatography, and high ionization efficiency achieved through low-flow electrospray can provide robust proteome coverage that rivals previously reported label-free and multiplexed single-cell proteomics coverage with a throughput of at least 48 single cells per day. Increasing measurement throughput to 96 cells/day (15 min cycles) yielded an average of 660 protein groups per cell across 150 single HeLa cells (Figures 6 and 7). These cells were not controlled for cell cycle or adjusted for cell size, so we expect that the increase in coefficients of variation for protein abundance from 18 to 37% is primarily biological. The identified peptides and proteins identified in the replicate analyses of single HeLa cells are provided in Table S12.
Figure 6.
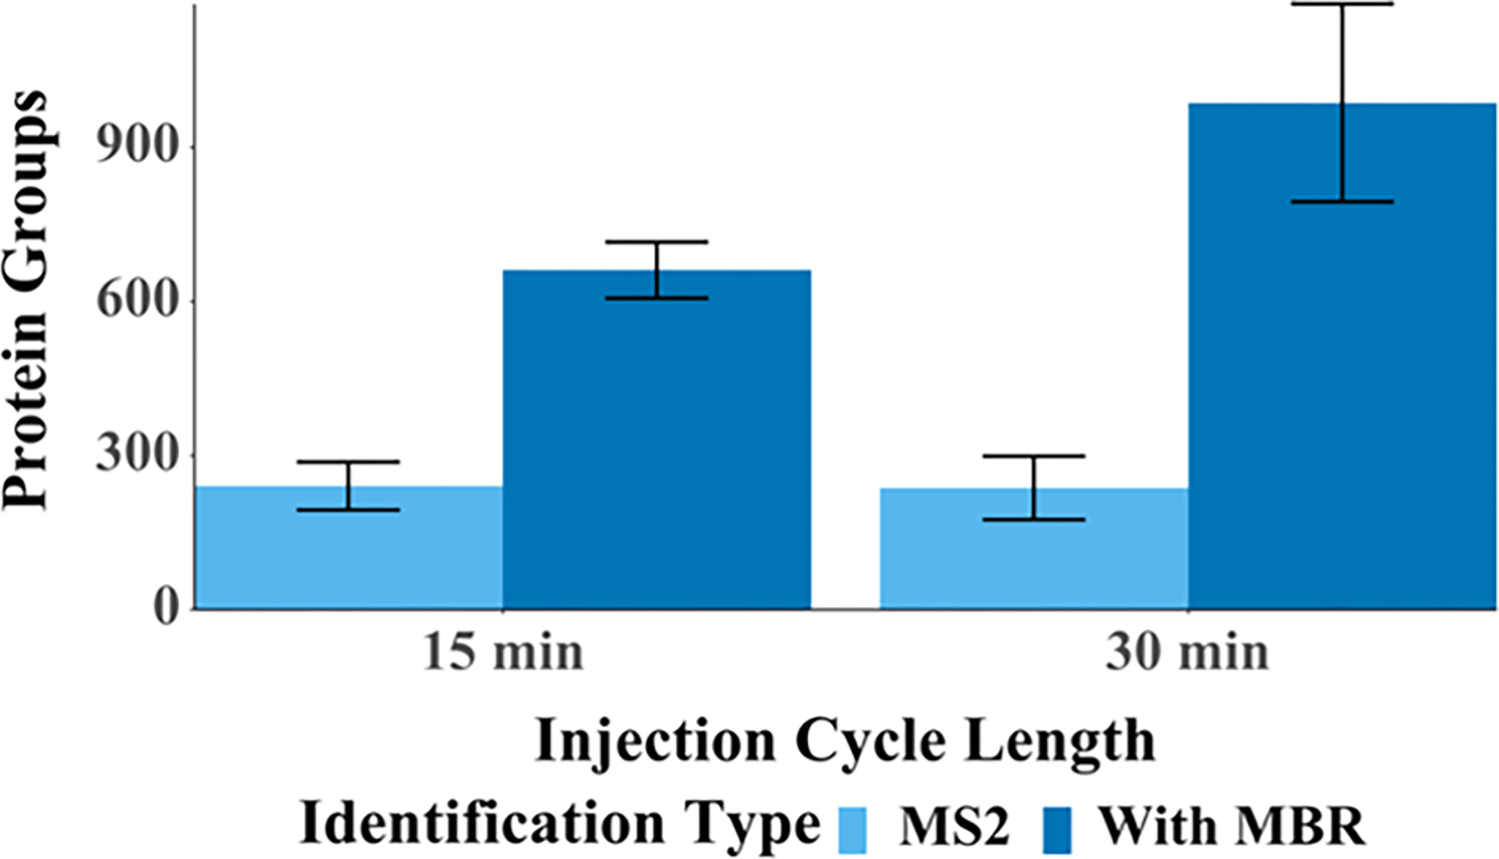
Proteome coverage for nanoPOTS-prepared single HeLa cells as a function of cycle time.
Figure 7.

Proteome coverage for 145 replicate analyses of single nanoPOTS-prepared HeLa cells.
We performed a comparative analysis between three different human cell lines: cervical cancer-derived HeLa (n = 10) and leukemic cells Jurkat (n = 8) and K562 (n = 10). An average of 876 and 850 proteins were identified from single Jurkat and K562 cells, respectively, for the 30 min cycle times. The number of identifications may be less due to smaller cell size. The identified peptides and protein groups are provided in Table S13. We expected to find the leukemic cells to be more closely related to each other in their proteome expression than to HeLa, and this was indeed the case as revealed by principal component analysis (PCA), where some overlap between K562 and Jurkat is observed (Figure 8). A more in-depth analysis of the proteomes of the K562 and Jurkat cells revealed detailed biological differences: 89 proteins were differentially expressed between the two leukemic cell lines (Figure S7, Table S6). Using the DAVID online gene ontology (GO) tool,38,39 we found that mitochondrial proteins were significantly increased in Jurkat cells relative to K562 cells with Benjamini-corrected p-values <0.05 (Figure S8).
Figure 8.
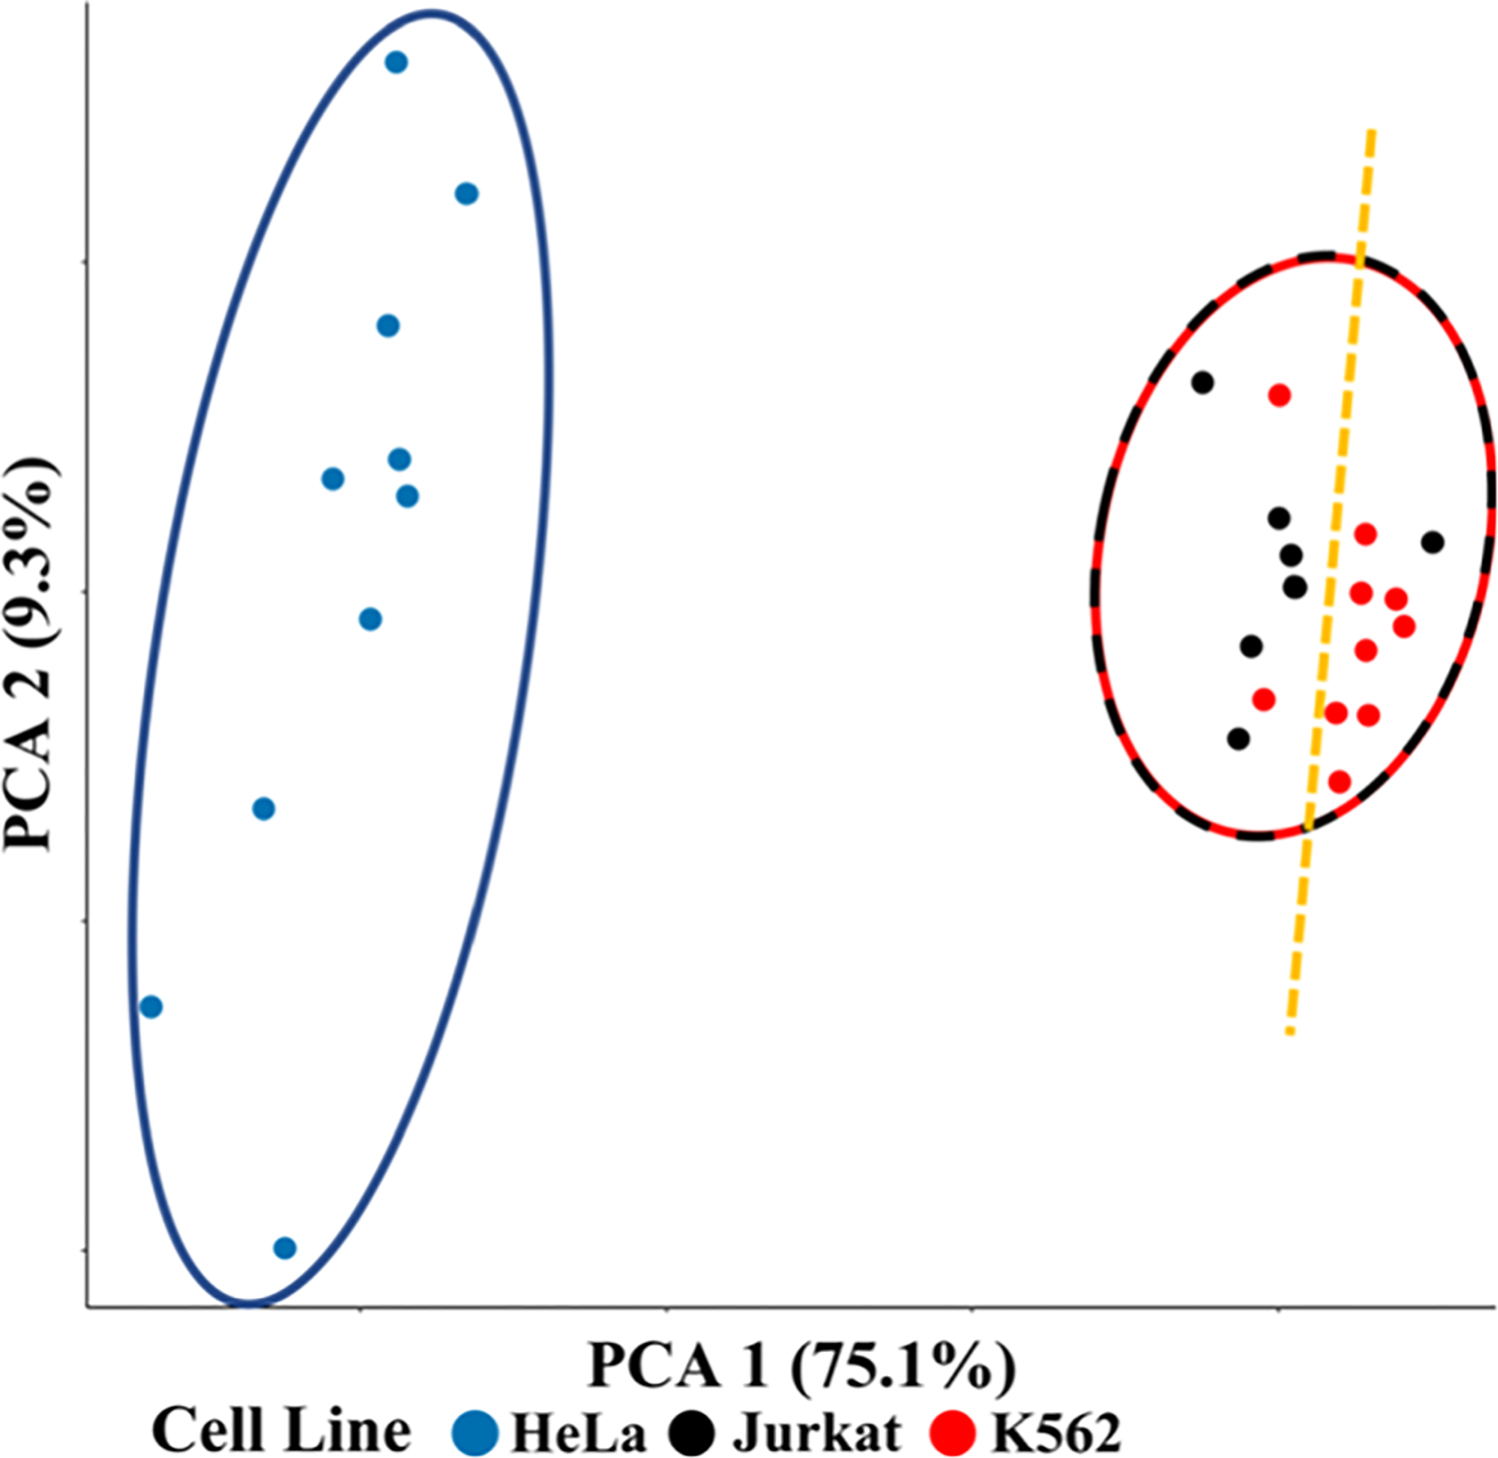
PCA plot for protein expression in single HeLa, Jurkat, and K562 cells. The blue circle is the HeLa cluster, the red/black dashed circle is the leukemia cluster, and the yellow line separates Jurkat and K562 cell lines.
Finally, in the Pharos database,43 all of these proteins were found to be druggable, four of them are known targets for cancer, and one (PSMB5) is an acute lymphoblastic leukemia drug target (Table S6). Additionally, Jurkat cells, which show a 6-fold enrichment of resistance-associated AKR1C1, are also sensitized to drugs that inhibit AKR1C1 production,44,45 suggesting the potential of using single-cell proteomics for precision medicine because known drugs could be screened based on the expression of therapeutic targets.
While average expression levels could also be measured in bulk studies, our single-cell method has the advantage of revealing cellular heterogeneity, which is important in the prognosis of cancers. For example, one could determine the fraction of cells that will potentially become resistant because they are not expressing the protein(s) targeted by an administered chemotherapy. For each of the proteins discussed in our study, there is at least one Jurkat cell that is more similar to K562 cells (Figure 9). Therefore, using SCP, we can determine that for these cell populations, targeting some of these proteins includes the risk of selecting the resistant, “outlier” Jurkat cells. Thus, high-throughput label-free SCP could potentially identify and correlate fractions of these resistant “outlier” cells with prognoses of relapse and survival. Additionally, we could use SCP to interrogate mechanisms of chemoresistance, and high-throughput SCP could provide insight into sample-limited studies such as the prognosis of metastasis using circulating tumor cells.46 In summary, we demonstrate that this workflow can readily differentiate between distal cancer types (cervical and leukemia) and potentially be used to guide the development of personalized cancer therapies within subtypes of leukemia (Jurkat/T-ALL, K562/CML).
Figure 9.
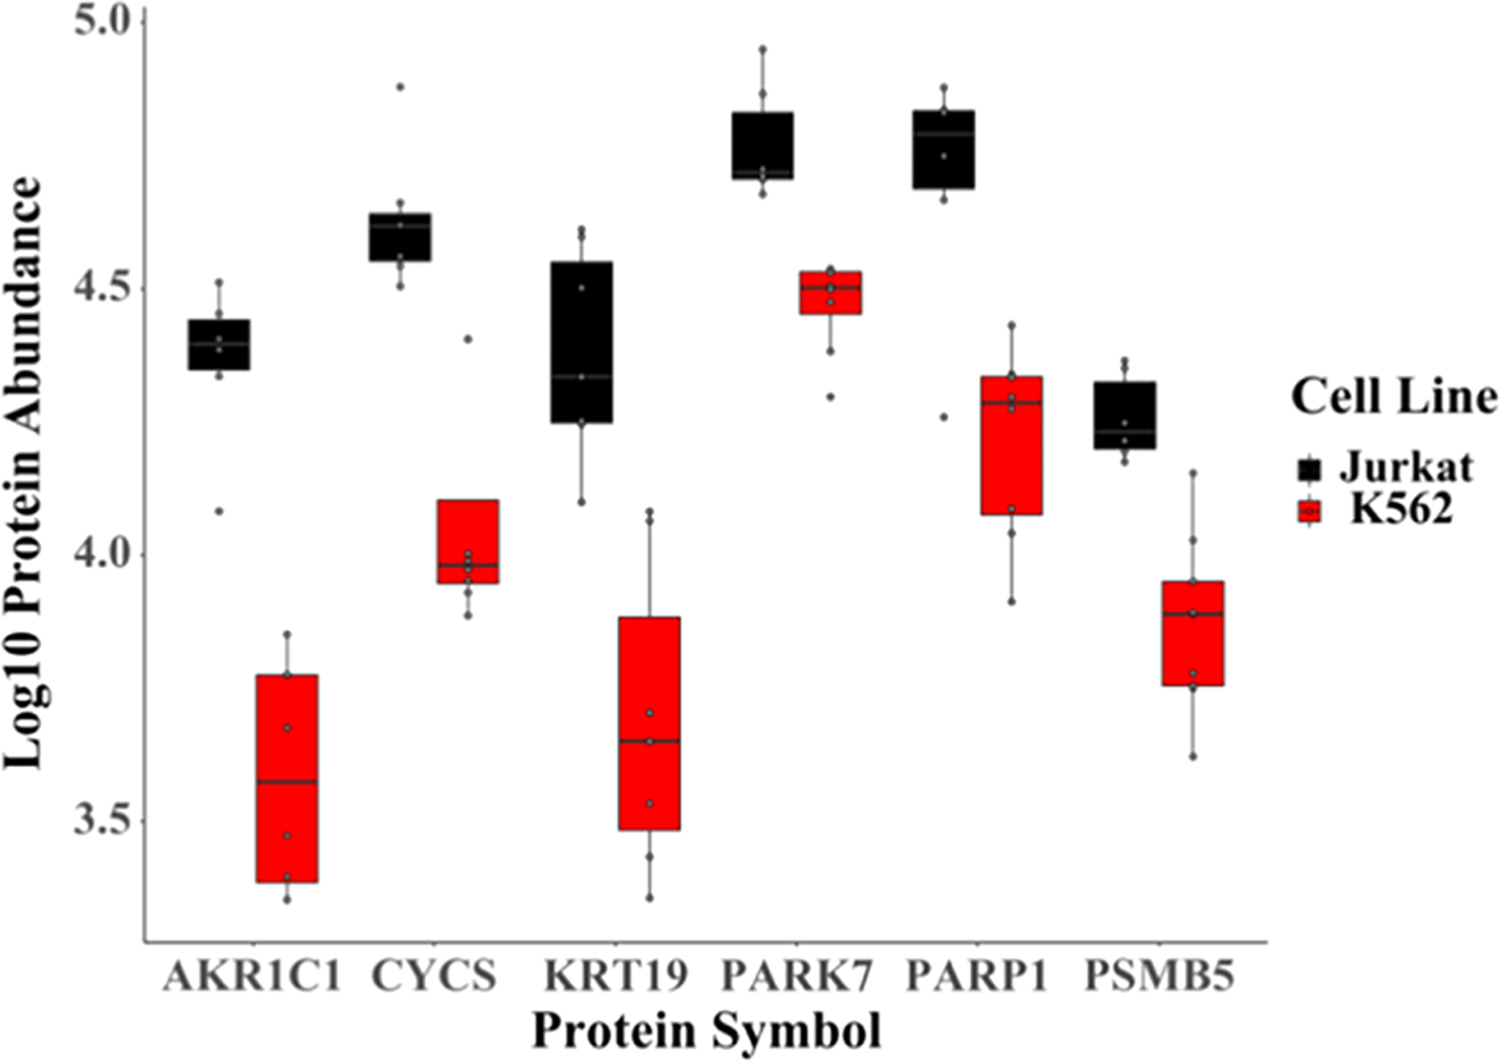
Expression profiles of potential and known (AKR1C1, DHFR, FASN) protein cancer targets discussed in the manuscript that are differentially expressed between Jurkat and K562 cells.
CONCLUSIONS
We have created a dual-column nanoflow liquid chromatography system that more than doubles the throughput of conventional label-free SCP approaches by employing fast gradients with reduced extra-column volumes and accurate MBR feature matching. Relying primarily on MS1 spectra with MBR allowed us to compensate for the long ion accumulation times normally required for each MS2 spectrum in SCP experiments. However, we note that for experiments involving extremely limited samples, MBR library generation becomes difficult. If it is not possible to pool a few cells of interest or similar cells from the same organism (50 cells ≈ 10 ng) to be used instead of bulk lysate for library runs, slightly slower analyses (>30 min) may be necessary to allow for MS2-based DDA analyses.
Our high-throughput column system also showed a high degree of reproducibility between the parallel columns, suggesting that multicolumn LC systems are a viable solution to increase the throughput and duty cycle of SCP, which should be further improved when using commercially produced columns with less variability. However, the high number of hand-tightened capillary connections and the multiple split flows may limit widespread adoption such that efforts to simplify such approaches should continue to be explored. Also, while we expect any column carryover to be minimal due to the small sample amounts, the column washing step, and the full mobile phase gradient that passes through the inactive column while the other elutes peptides, this should be studied in more detail.
Although 25 min gradients (30 min cycles) provided greater proteome coverage, shorter gradients displayed decreased peak widths and higher intensities, partially compensating for the decreased number of collected mass spectra. As such, further improvements to the LC system providing 100% duty cycles should provide increased proteome coverage and/or measurement throughput. Our high-throughput label-free system illustrates that we can approach throughput on par with TMT-reliant multiplexing approaches. Finally, we show that the data quality afforded by high-throughput label-free SCP allowed a detailed differential expression study of the K562 and Jurkat leukemia cell lines, showing that this workflow is sufficient to detect biological differences between phenotypically similar cells and opening the door to additional single-cell studies.
Supplementary Material
ACKNOWLEDGMENTS
Research reported in this publication was supported by a fellowship from the BYU Simmons Center for Cancer Research (K.G.I.W.) and by the National Institute of General Medical Sciences of the National Institutes of Health under award R01GM138931 (R.T.K.).
Footnotes
The authors declare the following competing financial interest(s): R.T.K. has a financial interest in MicrOmics Technologies LLC.
ASSOCIATED CONTENT
Supporting Information
The Supporting Information is available free of charge at https://pubs.acs.org/doi/10.1021/acs.analchem.2c00646.
Schematic for high-voltage switch (Figure S1); process for multiplexed sample analysis (Figure S2); timing for 15 min cycles (Figure S3); identified proteins for different feature matching parameters (Figure S4); 3D matrix of mass spectrometer settings and MS2-based identifications (Figure S5); ranked-abundance charts for different thresholds (Figure S6); volcano plot of proteins enriched in K562 and Jurkat cells (Figure S7); upregulated mitochondrial proteins only in Jurkat cells compared to K562 cells (Figure S8); LC gradients for injections cycles from 7 to 30 min in length (Tables S1 – S4,); MS settings (Table S5); differentially expressed proteins between Jurkat and K562 (Table S6); sample loading protocols for the LC system (Tables S7 and S8) (PDF)
Peptides and protein groups identified in method optimization (Table S9) (XLSX)
Peptides and protein groups identified in replicate analyses of 200 pg tryptic digest using 15 min cycles (Table S10) (XLSX)
Peptides and protein groups identified in replicate analyses of 200 pg of tryptic digest as a function of total cycle time (Table S11) (XLSX)
Peptides and protein groups identified in replicate analyses of single HeLa cells as a function of total cycle time (Table S12) (XLSX)
Peptides and protein groups identified in replicate analyses of single HeLa, Jurkat, and K562 cells (Table S13) (XLSX)
Contributor Information
Kei G. I. Webber, Department of Chemistry and Biochemistry, Brigham Young University, Provo, Utah 84602, United States
Thy Truong, Department of Chemistry and Biochemistry, Brigham Young University, Provo, Utah 84602, United States.
S. Madisyn Johnston, Department of Chemistry and Biochemistry, Brigham Young University, Provo, Utah 84602, United States.
Sebastian E. Zapata, Department of Chemistry and Biochemistry, Brigham Young University, Provo, Utah 84602, United States
Yiran Liang, Department of Chemistry and Biochemistry, Brigham Young University, Provo, Utah 84602, United States.
Jacob M. Davis, Department of Chemistry and Biochemistry, Brigham Young University, Provo, Utah 84602, United States
Alexander D. Buttars, Department of Chemistry and Biochemistry, Brigham Young University, Provo, Utah 84602, United States
Fletcher B. Smith, Department of Chemistry and Biochemistry, Brigham Young University, Provo, Utah 84602, United States
Hailey E. Jones, Department of Chemistry and Biochemistry, Brigham Young University, Provo, Utah 84602, United States
Arianna C. Mahoney, Department of Chemistry and Biochemistry, Brigham Young University, Provo, Utah 84602, United States
Richard H. Carson, Department of Chemistry and Biochemistry, Brigham Young University, Provo, Utah 84602, United States
Andikan J. Nwosu, Department of Chemistry and Biochemistry, Brigham Young University, Provo, Utah 84602, United States
Jacob L. Heninger, Department of Chemistry and Biochemistry, Brigham Young University, Provo, Utah 84602, United States
Andrey V. Liyu, Environmental Molecular Sciences Laboratory, Pacific Northwest National Laboratory, Richland, Washington 99354, United States
Gregory P. Nordin, Department of Electrical Engineering, Brigham Young University, Provo, Utah 84602, United States.
Ying Zhu, Environmental Molecular Sciences Laboratory, Pacific Northwest National Laboratory, Richland, Washington 99354, United States.
Ryan T. Kelly, Department of Chemistry and Biochemistry, Brigham Young University, Provo, Utah 84602, United States; Environmental Molecular Sciences Laboratory, Pacific Northwest National Laboratory, Richland, Washington 99354, United States.
REFERENCES
- (1).Elowitz MB; Levine AJ; Siggia ED; Swain PS Science 2002, 297, 1183–1186. [DOI] [PubMed] [Google Scholar]
- (2).Schmid A; Kortmann H; Dittrich PS; Blank LM Curr. Opin. Biotechnol. 2010, 21, 12–20. [DOI] [PubMed] [Google Scholar]
- (3).Fritzsch FSO; Dusny C; Frick O; Schmid A Annu. Rev. Chem. Biomol. Eng. 2012, 3, 129–155. [DOI] [PubMed] [Google Scholar]
- (4).Matuła K; Rivello F; Huck WTS Adv. Biosyst. 2020, 4, No. 1900188. [DOI] [PubMed] [Google Scholar]
- (5).Alfaro JA; Bohländer P; Dai M; Filius M; Howard CJ; van Kooten XF; Ohayon S; Pomorski A; Schmid S; Aksimentiev A; et al. Nat. Methods 2021, 18, 604–617. [DOI] [PMC free article] [PubMed] [Google Scholar]
- (6).Cong Y; Motamedchaboki K; Misal SA; Liang Y; Guise AJ; Truong T; Huguet R; Plowey ED; Zhu Y; Lopez-Ferrer D; et al. Chem. Sci. 2021, 12, 1001–1006. [DOI] [PMC free article] [PubMed] [Google Scholar]
- (7).Woo J; Clair GC; Williams SM; Feng S; Tsai C-F; Moore RJ; Chrisler WB; Smith RD; Kelly RT; Paša-Tolić L; et al. Cell Syst. 2022, DOI: 10.1016/j.cels.2022.02.003. [DOI] [PMC free article] [PubMed] [Google Scholar]
- (8).Kelly RT Mol. Cell. Proteom. 2020, 19, 1739–1748. [DOI] [PMC free article] [PubMed] [Google Scholar]
- (9).Zhang Z; Dubiak KM; Shishkova E; Huber PW; Coon JJ; Dovichi NJ Anal. Chem. 2022, 94, 3254–3259. [DOI] [PMC free article] [PubMed] [Google Scholar]
- (10).Zhu Y; Clair G; Chrisler WB; Shen Y; Zhao R; Shukla AK; Moore RJ; Misra RS; Pryhuber GS; Smith RD; et al. Angew. Chem., Int. Ed. 2018, 130, 12550–12554. [DOI] [PMC free article] [PubMed] [Google Scholar]
- (11).Specht H; Emmott E; Petelski AA; Huffman RG; Perlman DH; Serra M; Kharchenko P; Koller A; Slavov N Genome Biol. 2021, 22, No. 50. [DOI] [PMC free article] [PubMed] [Google Scholar]
- (12).Brunner A-D; Thielert M; Vasilopoulou C; Ammar C; Coscia F; Mund A; Hoerning OB; Bache N; Apalategui A; Lubeck M; et al. Mol. Syst. Biol. 2022, 18, No. e10798. [DOI] [PMC free article] [PubMed] [Google Scholar]
- (13).Ctortecka C; Hartlmayr D; Seth A; Mendjan S; Tourniaire G; Mechtler K bioRxiv 2022, DOI: 10.1101/2021.04.14.439828. [DOI] [PMC free article] [PubMed] [Google Scholar]
- (14).Sun L; Dubiak KM; Peuchen EH; Zhang Z; Zhu G; Huber PW; Dovichi NJ Anal. Chem. 2016, 88, 6653–6657. [DOI] [PMC free article] [PubMed] [Google Scholar]
- (15).Lombard-Banek C; Moody SA; Manzini MC; Nemes P Anal. Chem. 2019, 91, 4797–4805. [DOI] [PMC free article] [PubMed] [Google Scholar]
- (16).Cong Y; Liang Y; Motamedchaboki K; Huguet R; Truong T; Zhao R; Shen Y; Lopez-Ferrer D; Zhu Y; Kelly RT Anal. Chem. 2020, 92, 2665–2671. [DOI] [PMC free article] [PubMed] [Google Scholar]
- (17).Vasilopoulou CG; Sulek K; Brunner A-D; Meitei NS; Schweiger-Hufnagel U; Meyer SW; Barsch A; Mann M; Meier F Nat. Commun. 2020, 11, No. 331. [DOI] [PMC free article] [PubMed] [Google Scholar]
- (18).Greguš M; Kostas JC; Ray S; Abbatiello SE; Ivanov AR Anal. Chem. 2020, 92, 14702–14712. [DOI] [PMC free article] [PubMed] [Google Scholar]
- (19).Fang B; Izumi V; Rix LLR; Welsh E; Pike I; Reuther GW; Haura EB; Rix U; Koomen JM Proteomics 2020, 20, No. 2000116. [DOI] [PMC free article] [PubMed] [Google Scholar]
- (20).Russell CL; Heslegrave A; Mitra V; Zetterberg H; Pocock JM; Ward MA; Pike I Rapid Commun. Mass Spectrom. 2017, 31, 153–159. [DOI] [PubMed] [Google Scholar]
- (21).Saha-Shah A; Esmaeili M; Sidoli S; Hwang H; Yang J; Klein PS; Garcia BA Anal. Chem. 2019, 91, 8891–8899. [DOI] [PMC free article] [PubMed] [Google Scholar]
- (22).Gebreyesus ST; Siyal AA; Kitata RB; Chen ES-W; Enkhbayar B; Angata T; Lin K-I; Chen Y-J; Tu H-L Nat. Commun. 2022, 13, No. 37. [DOI] [PMC free article] [PubMed] [Google Scholar]
- (23).Zimmer JSD; Monroe ME; Qian W-J; Smith RD Mass Spectrom. Rev. 2006, 25, 450–482. [DOI] [PMC free article] [PubMed] [Google Scholar]
- (24).Cox J; Hein MY; Luber CA; Paron I; Nagaraj N; Mann M Mol. Cell. Proteomics 2014, 13, 2513–2526. [DOI] [PMC free article] [PubMed] [Google Scholar]
- (25).Tyanova S; Temu T; Cox J Nat. Protoc. 2016, 11, 2301–2319. [DOI] [PubMed] [Google Scholar]
- (26).Lombard-Banek C; Moody SA; Nemes P Angew. Chem., Int. Ed. 2016, 55, 2454–2458. [DOI] [PMC free article] [PubMed] [Google Scholar]
- (27).Zhu Y; Piehowski PD; Zhao R; Chen J; Shen Y; Moore RJ; Shukla AK; Petyuk VA; Campbell-Thompson M; Mathews CE; et al. Nat. Commun. 2018, 9, No. 882. [DOI] [PMC free article] [PubMed] [Google Scholar]
- (28).Cheung TK; Lee CY; Bayer FP; McCoy A; Kuster B; Rose CM Nat. Methods 2021, 18, 76–83. [DOI] [PubMed] [Google Scholar]
- (29).Williams SM; Liyu AV; Tsai C-F; Moore RJ; Orton DJ; Chrisler WB; Gaffrey MJ; Liu T; Smith RD; Kelly RT; et al. Anal. Chem. 2020, 92, 10588–10596. [DOI] [PMC free article] [PubMed] [Google Scholar]
- (30).Shen Y; Smith RD; Unger KK; Kumar D; Lubda D Anal. Chem. 2005, 77, 6692–6701. [DOI] [PubMed] [Google Scholar]
- (31).Shen YF; Strittmatter EF; Zhang R; Metz TO; Moore RJ; Li FM; Udseth HR; Smith RD; Unger KK; Kumar D; et al. Anal. Chem. 2005, 77, 7763–7773. [DOI] [PubMed] [Google Scholar]
- (32).Wang H; Hanash SM J. Proteome Res. 2008, 7, 2743–2755. [DOI] [PubMed] [Google Scholar]
- (33).Livesay EA; Tang K; Taylor BK; Buschbach MA; Hopkins DF; Lamarche BL; Zhao R; Shen Y; Orton DJ; Moore RJ; et al. Anal. Chem. 2008, 80, 294–302. [DOI] [PMC free article] [PubMed] [Google Scholar]
- (34).Orton DJ; Wall MJ; Doucette AA J. Proteome Res. 2013, 12, 5963–5970. [DOI] [PubMed] [Google Scholar]
- (35).Lee H; Lee JH; Kim H; Kim SJ; Bae J; Kim HK; Lee SW J. Chromatogr. A 2014, 1329, 83–89. [DOI] [PubMed] [Google Scholar]
- (36).Lee H; Mun DG; Bae J; Kim H; Oh SY; Park YS; Lee JH; Lee SW Analyst 2015, 140, 5700–5706. [DOI] [PubMed] [Google Scholar]
- (37).Hosp F; Scheltema RA; Eberl HC; Kulak NA; Keilhauer EC; Mayr K; Mann M Mol. Cell. Proteom. 2015, 14, 2030–2041. [DOI] [PMC free article] [PubMed] [Google Scholar]
- (38).Huang DW; Sherman BT; Lempicki RA Nat. Protoc. 2009, 4, 44–57. [DOI] [PubMed] [Google Scholar]
- (39).Huang DW; Sherman BT; Lempicki RA Nucleic Acids Res. 2009, 37, 1–13. [DOI] [PMC free article] [PubMed] [Google Scholar]
- (40).Marginean I; Tang K; Smith RD; Kelly RT J. Am. Soc. Mass Spectrom. 2014, 25, 30–36. [DOI] [PMC free article] [PubMed] [Google Scholar]
- (41).Tang K; Page JS; Kelly RT; Marginean I Electrospray Ionization in Mass Spectrometry. In Encyclopedia of Spectroscopy and Spectrometry, 3rd ed.; Elsevier Ltd., 2017; Vol. 22, pp 476–481. [Google Scholar]
- (42).Doblmann J; Dusberger F; Imre R; Hudecz O; Stanek F; Mechtler K; Dürnberger G J. Proteome Res. 2019, 18, 535–541. [DOI] [PubMed] [Google Scholar]
- (43).Sheils TK; Mathias SL; Kelleher KJ; Siramshetty VB; Nguyen D-T; Bologa CG; Jensen LJ; Vidoví C D; Koleti A; Schürer SC; et al. Nucleic Acids Res. 2021, 49, D1334–D1346. [DOI] [PMC free article] [PubMed] [Google Scholar]
- (44).Fas SC; Baumann S; Jia YZ; Giaisi M; Treiber MK; Mahlknecht U; Krammer PH; Li-Weber M Blood 2006, 108, 3700–3706. [DOI] [PubMed] [Google Scholar]
- (45).Wang H-W; Lin C-P; Chiu J-H; Chow K-C; Kuo K-T; Lin C-S; Wang L-S Int. J. Cancer 2007, 120, 2019–2027. [DOI] [PubMed] [Google Scholar]
- (46).Zhu Y; Podolak J; Zhao R; Shukla AK; Moore RJ; Thomas GV; Kelly RT Anal. Chem. 2018, 90, 11756–11759. [DOI] [PMC free article] [PubMed] [Google Scholar]
Associated Data
This section collects any data citations, data availability statements, or supplementary materials included in this article.


