Abstract
Colorectal cancer (CRC) is a heterogenous disease, and patients have differences in therapeutic response. However, the mechanisms underlying interpatient heterogeneity in the response to chemotherapeutic agents remain to be elucidated, and molecular tumor characteristics are required to select patients for specific therapies. Patient‐derived organoids (PDOs) established from CRCs recapitulate various biological characteristics of tumor tissues, including cellular heterogeneity and the response to chemotherapy. Patient‐derived organoids established from CRCs show various morphologies, but there are no criteria for defining these morphologies, which hampers the analysis of their biological significance. Here, we developed an artificial intelligence (AI)‐based classifier to categorize PDOs based on microscopic images according to their similarity in appearance and classified tubular adenocarcinoma‐derived PDOs into six types. Transcriptome analysis identified differential expression of genes related to cell adhesion in some of the morphological types. Genes involved in ribosome biogenesis were also differentially expressed and were most highly expressed in morphological types showing CRC stem cell properties. We identified an RNA polymerase I inhibitor, CX‐5641, to be an upstream regulator of these type‐specific gene sets. Notably, PDO types with increased expression of genes involved in ribosome biogenesis were resistant to CX‐5461 treatment. Taken together, these results uncover the biological significance of the morphology of PDOs and provide novel indicators by which to categorize CRCs. Therefore, the AI‐based classifier is a useful tool to support PDO‐based cancer research.
Keywords: artificial intelligence, colorectal cancer, integrin, organoid, ribosome biobenesis
We developed an artificial intelligence (AI)‐based classifier to categorize Patient‐derived organods(PDOs). Transcriptome analysis identified differential expression of genes related to cell adhesion and ribosome biogenesis and an RNA polymerase I inhibitor, CX‐5641, exhibeted type‐specific response. These results uncover the biological significance of the morphology of PDOs and the AI‐based classifier is a useful tool to support PDO‐based cancer research.
Abbreviations
- AI
artificial intelligence
- CRC
colorectal cancer
- ITGA6
integrin alpha 6
- ITGB4
integrin beta 4
- NES
normalized enrichment score
- NOM p val
nominal p value
- pap
papillary adenocarcinoma
- PDO
patient‐derived organoid
- por2
poorly differentiated adenocarcinoma
- tub1
well differentiated tubular adenocarcinoma
- tub2
moderately differentiated tubular adenocarcinoma
1. INTRODUCTION
Colorectal cancer is one of the most commonly diagnosed cancers and the third most common cause of cancer‐related death. Colorectal cancer is a heterogenous disease, and patients have various clinical and biological features, leading to differences in disease progression and therapeutic response. 1 Pathological staging by TNM and histological evaluation are regularly used to estimate prognosis and select treatment regimens for individual patients. Additionally, some molecular makers, including RAS and BRAF mutation status, are used to select treatment regimens. These advances in patient stratification based on clinicopathological parameters have greatly improved our understanding of CRC and the clinical output. However, a significant number of patients still do not benefit from the available regimens. Therefore, further clarification of unrevealed tumor characteristics is required to develop more effective cancer treatments for realizing precision medicine.
Organoids are an in vitro 3D culture system grown from stem cells. Patient‐derived organoids established from adult stem cells in tumor tissues recapitulate many functional aspects of the original tumors. Pioneering research into CRC PDOs indicated that they maintain the genetic alterations and gene expression profiles of the original lesions. 2 , 3 These studies also showed that PDOs reproduce the histological grade when transplanted into immunodeficient mice. More recent studies reported the potential utility of PDOs to predict patient response to chemotherapy and radiation therapy. 4 , 5 , 6
We recently established PDOs from matched primary and metastatic lesions from 21 patients with stage IV CRC and reported that they had distinct cellular heterogeneity. 7 During this study, we noticed that the PDOs showed a variety of morphological features. However, the significance of these morphological features has not been assessed, because no criteria for PDO structure have been established. In this study, we attempted to establish objective morphological criteria for PDOs using an AI‐based classifier to scientifically evaluate the morphology of PDOs and explore their potential application for cancer chemotherapy.
2. MATERIALS AND METHODS
2.1. Culture of PDOs
Tumor samples were obtained from patients who provided informed consent, and PDOs were established as previously described. 7
2.2. Image acquisition and type labeling
For imaging, PDOs were embedded in 25 μl Matrigel and cultured in 250 μl ENR medium in 48‐well dishes. Organoids were imaged using a stereomicroscope (M164FC; Leica) equipped with a monochrome CCD digital camera (DFC350FX; Leica).
2.3. Development of AI‐based classifier for PDOs
The classifier for PDOs consisted of an object extraction module and a PDO classification module. The object extraction module removed patch images from the microscopic images containing objects that could be organoids, and the PDO classification module identified the organoid type of each patch image (Figure 1A).
FIGURE 1.
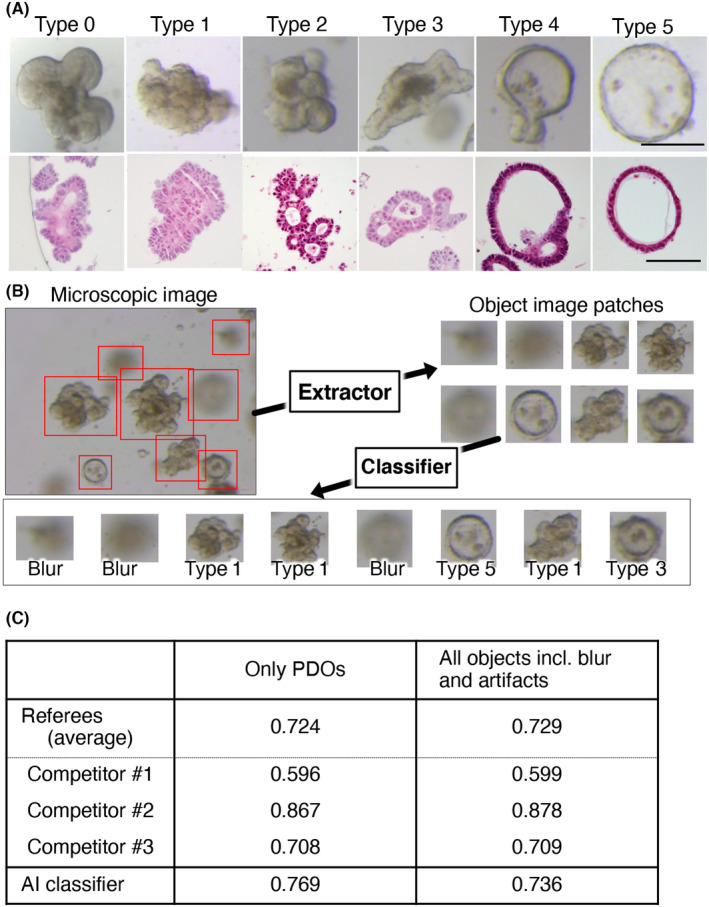
Development of artificial intelligence (AI)‐based classifier for patient‐derived organoids (PDOs). (A) Representative images of PDO types. PDOs in 48‐well dishes were imaged using a stereomicroscope (upper panels) and H&E staining of paraffin‐embedded sections (lower panels) are shown. PDOs were evaluated individually by three referees, and the final decision was made through a majority opinion. Bar (upper panels) = 200 μm; bar (lower panels) = 100 μm. (B) Workflow of the AI‐based PDO classifier. The object extraction module (Extractor) cuts out images containing objects from the microscopic images, and the classification module (Classifier) identifies the organoid type of each image. (C) Performance of the AI‐based classifier. Test data consisting of only PDO images (only PDOs) or PDO images and blurred and artifact images (all objects incl. Blur and artifacts) were used. The average accuracy of the three referees (referees [average]) and the individual accuracies of the three competitors (Competitor #1, #2, and #3) were compared to that of the AI classifier
Additional materials and methods are available in Appendix S1.
3. RESULTS
3.1. Performance of AI ‐based classifier of PDOs
In our previous study, we established PDOs from CRC patients and noticed that they are morphologically divergent. Some tumor‐derived PDOs generated structures resembling those derived from normal mucosa, 8 with one lumen surrounded by tumor cells. We designated this type 0 (Figure 1A). A significant fraction of PDOs had budding structures and a narrow lumen space, which were assigned either type 1 or 2. Type 1 PDOs had smaller protrusions and a narrower lumen than type 2 PDOs. Other organoids had larger luminal spaces and were designated type 3–5, depending on the luminal size and the circularity of the structure. Type 5 PDOs had a spherical structure. Type 4 PDOs also exhibited a spherical structure with small protrusions, and type 3 PDOs were characterized by relatively indefinite luminal spaces and wider cell layers than type 4 and 5 PDOs. In addition to the images assigned to the six types, blurred images and debris were included in the training set to develop the AI‐based classifier. To examine the morphological change during the culture, we video‐recorded organoids every 6 hours (Figure S1). Image acquisition was started at 4 days after plating when their structure became definite (Figure S2) and was continued for 3 days. The 19 of the 21organoids exhibited stable morphology. These observations indicated that once the structure has established after passaging, most organoids maintained their morphology.
The performance and characteristics of classification were compared with human “competitors,” who were experts at organoid culture and not “referees.” The test dataset was constructed by selecting the top 20 patch images for each PDO type based on the confidence level from the results of analyzing the images with AI which were previously developed as follows. For object extraction from microscopic images, we used the U‐Net trained on a dataset of 984 images, including images that were also used to train the model implemented in the object extraction module. For PDO classification, we used Support Vector Machine (SVM) and DensNet201 trained on 548 and 1553 image datasets, respectively, which were not used for training the model implemented in the PDO classification module. The PDO types was assigned based on the consensus of the three human referees. The confidence level for image type classification was calculated as
where is the th element of the vector , which is the output from our AI model with the patch image as input.
The results of the classifications of the test dataset by the trained PDO classification module and the three competitors are shown in Figure 1C. This table also shows the accuracy (the number of correct answers divided by the number of patch images) of the decisions made by the three referees and the AI when the classification target was limited to PDOs and when all patch images, including blurred images and artifacts, were included.
Competitor 2, who is a highly experienced investigator in organoid research, showed outstanding performance. The AI had the second best performance, with an accuracy above the average accuracy of the competitors when only PDOs were included and when all patch images were included. Interestingly, the accuracy of the AI when classifying only PDOs was better than that when classifying all the objects, whereas there was no significant difference in the performances of the three human competitors between the two. This implies that the criteria for determining whether objects can be classified (PDO types 0–5) or not (blurs and artifacts) are different between the AI and the human competitors.
3.2. Morphological typing of PDOs independent of clinicopathological features of original tumors
The AI‐based classifier was then used to determine the morphological type of previously established PDOs. We analyzed 66 PDOs derived from patients with stage IV CRC, as reported previously 7 (Table S1). In addition, six PDOs were established from primary tumors from patients with stage I–III CRC to investigate PDOs from nonmetastatic tumors. Therefore, 72 PDOs derived from 26 CRC patients were analyzed in this study: 25, 27, and 20 PDOs derived from primary, metastatic, and recurrent lesions, respectively. Pathologically, moderately differentiated adenocarcinoma (referred to as “tub2” in this paper) was the most common grade of the original tumors (58 samples, 80.6%), followed by well‐differentiated adenocarcinoma (“tub1” in this paper) (11 samples, 16.3%). Two poorly differentiated adenocarcinomas ( “por2” in this paper) (2 samples, 2.8%) and one papillary adenocarcinoma (“pap” in this paper) (1 sample, 1.3%) were included. The mutation profile of the cohort was comparable to those reported in CRC patients, including frequent mutation in APC, TP53, and KRAS (Figure S3). 9 , 10 , 11
Images taken at day 4 after expansion were subjected to the object extraction module, resulting in 10,272 images of individual organoids. Of these, 8417 were adopted at a confidence value of 0.9 (Table S2). A total of 2803 and 945 images were categorized as blur and dust, respectively. The remaining 4669 images were classified as type 0 (118, 2.5%), type 1 (477, 9.6%), type 2 (2633, 56.4%), type 3 (805, 17.2%), type 4 (552, 11.8%), and type 5 (114, 2.4%) PDOs (Figure 2A,B). Most PDOs had multiple structures, indicating that organoids are not fixed to a single shape but can transit across different types.
FIGURE 2.
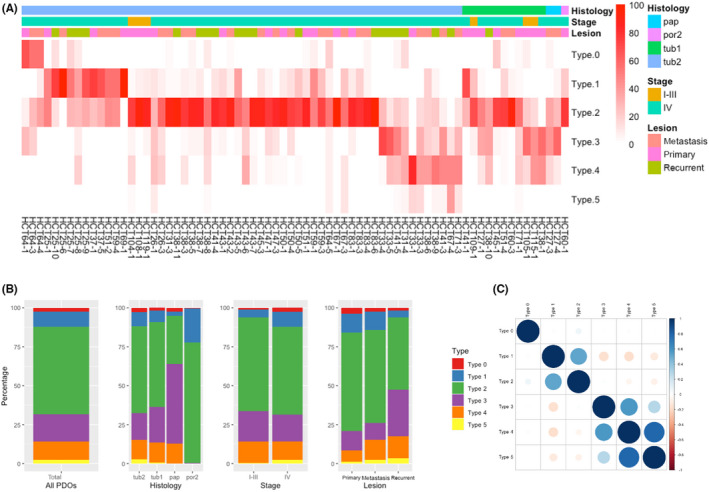
Artificial intelligence‐based morphological typing of patient‐derived organoids (PDOs) derived from colorectal cancer. (A) A total of 8417 images of 72 PDOs (average 117 images per PDO) were classified into six morphological types. Data are shown as the percentage of each type in an individual PDO. The histology, stage, and tumor type (primary, metastatic, or recurrent) of the corresponding lesion are shown on the top. (B) Percentages of morphological types per histology, stage, and tumor type are shown. (C) Correlation of morphological types. Pearson correlation coefficients between morphological types are shown
We next examined whether the histopathological grade of the original tumor contributes to the morphological type of the organoid. The type distributions of PDOs derived from tub1 and tub2 tumors were similar, indicating that the in vitro structure was not defined by the histological grade of the original tumor (Figure 2B). Although the percentages of PDOs established from por2 and pap tumors were different from those derived from tub1 and tub2 tumors, their significance needs to be tested using a larger cohort, because there were only two and one PDOs of these types, respectively. Similar percentages of morphological types were observed in PDOs established from patients with stage I‐III disease and those derived from patients with stage IV disease. The distributions of morphological types were also comparable based on the type of tumor (primary, metastatic, or recurrent), although type 3 organoids were marginally more common among PDOs from recurrent lesions. We did not observe apparent correlation with the mutation profile (Figure S3). Taken together, these results indicate that the morphology of PDOs is not correlated to the clinicopathological features of their original tumors, raising the possibility that PDOs could be useful to provide a novel classification of CRC.
In the correlation study, type 1 and 2 PDOs were significantly associated (correlation coefficient, 0.52) (Figure 2C). Type 4 PDOs were strongly correlated to type 5 PDOs (correlation coefficient, 0.8) and to type 3 PDOs to a lesser extent (correlation coefficient, 0.57). Furthermore, type 1 PDOs showed a negative correlation with type 3, 4, and 5 PDOs (correlation coefficients, −0.17, −0.17, and − 0.11, respectively). These observations suggest that type 1 and 2 PDOs can be categorized into one group that is distinct from another group consisting of type 3, 4, and 5 PDOs. Based on these observations, we designated type 1 and 2 PDOs as type A and type 3, 4, and 5 PDOs as type B.
3.3. Type A and B PDOs expressed distinct gene sets associated with cell–cell adhesion
The PDOs exhibited multiple shapes, but their distributions were not even. Therefore, each PDO was assigned to the dominant morphological type. We first sought to characterize type A and B PDOs, because they included a majority of CRC PDOs in our cohort and were negatively correlated (Figure 2C). There were 53 (76.8%) and 16 (23.2%) type A and B PDOs, respectively (Figure 3A). Several PDOs derived from different lesions of the same patient, including HCT38, 41, 27, 67, 31, and 71, contained both type A and B organoids, suggesting altered cellular properties during tumor progression.
FIGURE 3.
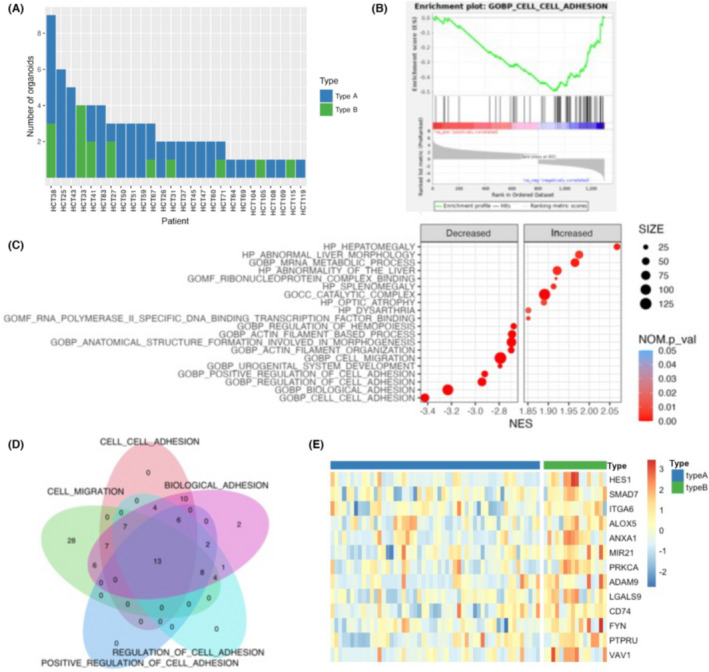
Gene expression profiling of type A and B patient‐derived organoids (PDOs). (A) Distribution of morphological types. PDOs were assigned to type A or B, and each type is shown for every patient. (B) Enrichment plot of the Gene Ontology Biological Process (GOBP) cell–cell adhesion gene set. (C) Dot plot of Gene Set Enrichment Analysis results. Significantly increased or decreased gene sets derived from the C5 ontology gene set in Molecular Signature Database are listed. The color of the dots represents the false discovery rate (FDR), and the diameter represents the enriched gene count. (D) Venn diagram of core enrichment genes in the top four gene sets. Thirteen genes were commonly included as enrichment genes. (E) Heatmap of 13 genes identified in (D). NES, normalized enrichment score; NOM p val, nominal p value
To elucidate the biological significance of the PDO types, we analyzed their differential expression profiles. Gene Set Enrichment Analysis of ontology gene sets (C5) in the Molecular Signature Database identified cell–cell adhesion as the most significantly downregulated pathway in type A PDOs (NES = −3.42, NOM p val < 0.001) (Figure 3B). Furthermore, three cell adhesion‐related gene sets, including biological adhesion (NES = −3.23, NOM p val < 0.001), regulation of cell adhesion (NES = −2.94, NOM p val < 0.001), and positive regulation of cell adhesion (NES = −2.92, NOM p val < 0.001) were included in the top four significantly decreased gene sets in type A PDOs (Figure 3C). These observations suggested that type A PDOs had decreased expression of genes involved in the attachment of cells to the ECM and their downstream molecules.
To refine the molecules involved in this process, we focused on the 13 core enrichment genes that were common in the gene sets (Figure 3D,E). These included transcription factors (HES1 and SMAD7) and signaling molecules that mediate nuclear signaling (PRKCA, FYN, PTPRU, and VAV1). We particularly focused on ITGA6 because it is a key molecule controlling cellular morphology and is reported to be involved in CRC tumorigenesis. 12 , 13 , 14 , 15 Integrins bind to the ECM and transmit signals into cells. 16 They interact with the actin cytoskeleton through adaptor proteins and transmit extracellular forces into intracellular components. 17 Consistent with these observations, two actin filament‐related gene sets, actin filament organization (NES = −2.70, NOM p val < 0.001) and actin filament‐based process (NES = −2.69, NOM p val < 0.001), were identified as decreased gene sets in type A PDOs (Figure 3C). Additionally, two integrin‐mediated cellular processes, cell migration and morphogenesis, were also identified as significantly decreased gene sets in type A PDOs. These include cell migration (NES = −2.79, NOM p val < 0.001), anatomical structure formation involved in morphogenesis (NES = −2.70, NOM p val < 0.001), and urogenital system development (NES = −2.79, NOM p val < 0.001). Overall, these analyses suggested that differences in cellular adhesion properties between type A and B PDOs might contribute to their distinct morphologies.
Integrin alpha 6 was decreased in type A PDOs (type 1 and 2) compared to type B PDOs (type 3 and 4) (Figure 4A). We also found that type 0 PDOs had higher levels of ITGA6 than type A PDOs. Immunofluorescence analysis of ITGA6 revealed patchy staining at the basal membrane in all types of PDOs (Figure 4B). Type A PDOs showed weak immunofluorescence compared to type B and type 0 PDOs. Notably, ITGB4, a binding partner of ITGA6, had a similar expression profile (Figure 4A). Immunofluorescence revealed linear staining at the basal membrane. Consistent with its expression profile, type A PDOs showed less ITGB4 than type B or type 0 PDOs. These observations clearly demonstrated the correlation between the expression of ITGA6/B4 and PDO morphology, but further studies are needed to determine whether they have functional roles in the morphogenesis of PDOs.
FIGURE 4.
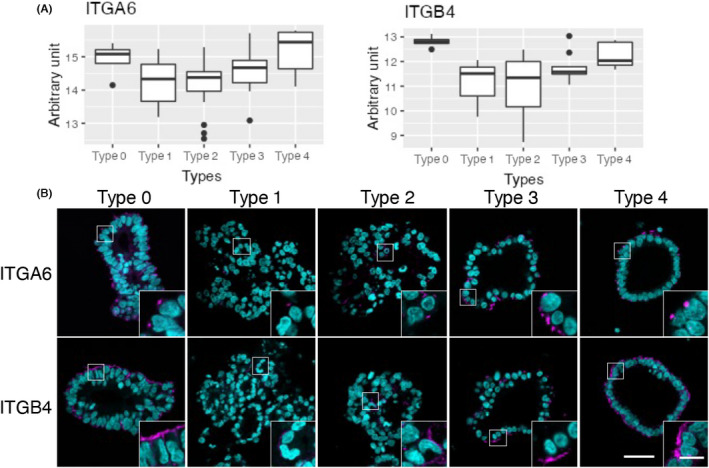
Expression of integrins in patient‐derived organoids (PDOs) established from colorectal cancer patients. (A) Gene expression profile of integrin A6 (ITGA6) and integrin B4 (ITGB4) in the five types of PDOs are visualized as box plots. (B) Immunofluorescence staining of ITGA6 and ITGB4. Slice specimens of formalin‐fixed paraffin‐embedded samples were stained with anti‐ITGA6 or ‐ITGB4 (magenta), and nuclei were visualized using DAPI (cyan). Representative images of type 0 (HCT64‐1 T), type 1 (HCT25‐5LMR), type 2 (HCT25‐10LMRR), type 3 (HCT33‐1 T), and type 4 (HCT41‐5LuMR) PDOs are shown. Bar = 50 μm; inset bar = 10 μm
3.4. Increased expression of ribosome biogenesis genes in type 1 PDOs
To further classify PDOs in detail and characterize their biological properties, each PDO was assigned a morphological type 0 to 5 (Figure 5A). Type 2 organoids were the most common (57.5%), followed by type 1 (16.4%). Type 3 and 4 organoids accounted for 11.0% and 11.9% of our cohort, respectively. There were no type 5 PDOs. As expected, the gene sets identified in the comparative analysis between type A and B PDOs were also decreased in type 1 and 2 PDOs (Figure 5B). These included cell migration, biological adhesion, cell–cell adhesion, and regulation of cell adhesion. Conversely, these gene sets were substantially increased in other PDO types, particularly type 0 PDOs. Interestingly, they were more profoundly decreased in type 1 PDOs than in type 2 PDOs, suggesting that type 1 PDOs might have unique morphological properties, which is in good agreement with the results of the correlation study (Figure 2C). Among these gene sets, cell migration was the most highly decreased (NES = −3.46, NOM p val < 0.001). Biological adhesion was also significantly downregulated in type 1 PDOs (NES = −3.37, NOM p val < 0.001). These observations further support the notion that the expression of genes related to cell adhesion might play a role in PDO morphology.
FIGURE 5.
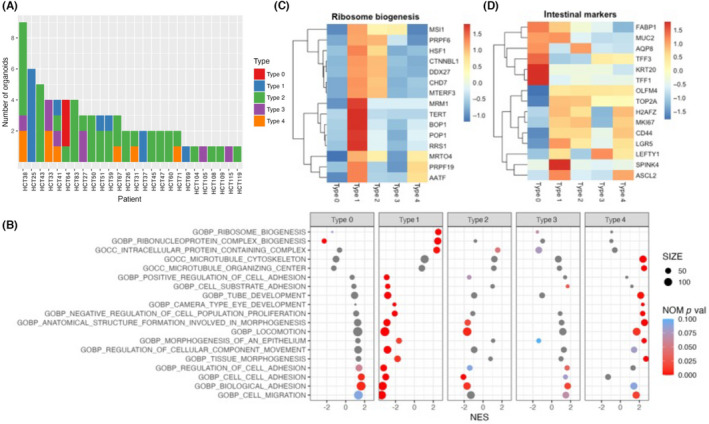
Gene expression profiles of type 0–4 patient‐derived organoids (PDOs). (A) Distribution of morphological types in patients with colorectal cancer. PDOs were assigned to type 0–4, and each type is shown for every patient. (B) Dot plot of Gene Set Enrichment Analysis results. Significantly increased or decreased gene sets derived from the C5 ontology gene set in Molecular Signature Database are listed. The color of the dots represents the false discovery rate value, and the diameter represents the enriched gene count. (C) Heatmap of core enrichment genes involved in ribosome biogenesis. (D) Heatmap of markers of intestinal tissue. NOM p val, nominal p value
Notably, two gene sets related to ribosome biogenesis were enriched in type 1 PDOs, including ribosome biogenesis (NES = 2.53, NOM p val < 0.001) and ribonucleoprotein complex biogenesis (NES = 2.47, NOM p val < 0.001) (Figure 5B). Ribosome biogenesis is critical in tumorigenesis for providing robust protein translation and has been suggested to be a driver of cancer proliferation and transformation. 18 Close examination of core enrichment genes revealed the overexpression of genes involved in several key pro‐tumorigenic pathways in type 1 PDOs, including cofactors or subunits of RNA polymerase (RRS1 19 and BOP1 20 , 21 ), pre‐mRNA processing factors (PRPF6 and PRPF19 22 ), and RNA binding proteins (MSI1 23 ) (Figure 3C). TERT, whose transcription is activated by ribosomal components, 24 was also highly expressed in type 1 PDOs.
Colorectal cancer stem cells have elevated ribosomal biosynthetic capacities. 25 , 26 Therefore, we examined the expression of intestinal markers 7 , 27 in the PDOs and found that type 1 PDOs expressed stem cell markers and proliferative markers, whereas type 0 PDOs expressed markers of differentiated cells, such as enterocytes (FABP1, AQP8, and KRT20) and goblet cells (TFF1, TFF3, and MUC2) (Figure 5D). Therefore, the morphology of PDOs derived from CRC was correlated to the expression of genes associated with ribosome biogenesis, and those expressing higher levels of stem cell markers showed elevated expression of these gene sets.
3.5. Morphology of PDOs correlated with sensitivity to RNA polymerase I inhibitor CX‐5461
Finally, we tried to utilize the morphological typing of PDOs for developing chemotherapies. To identify the chemical compounds with type‐specific effects on CRC PDOs, we undertook an upstream regulator analysis implemented in Ingenuity Pathway Analysis. 28 Using differentially expressed genes obtained by the comparative analysis between type A and B PDOs, 20 compounds were identified as significant upstream regulators (absolute activation z‐score > 2, p value of overlap <0.01) (Figure 6A). The RNA polymerase I inhibitor CX‐5461 was the top compound (activation z‐score = −3.207, p value of overlap = 7.61E‐17). This compound was predicted to produce an “inhibited” activation state, suggesting it produces an expression pattern in the input datasets opposed to the expected effect. 28 The expression profile of the downstream target genes of CX‐5461 is illustrated in Figure 6B.
FIGURE 6.
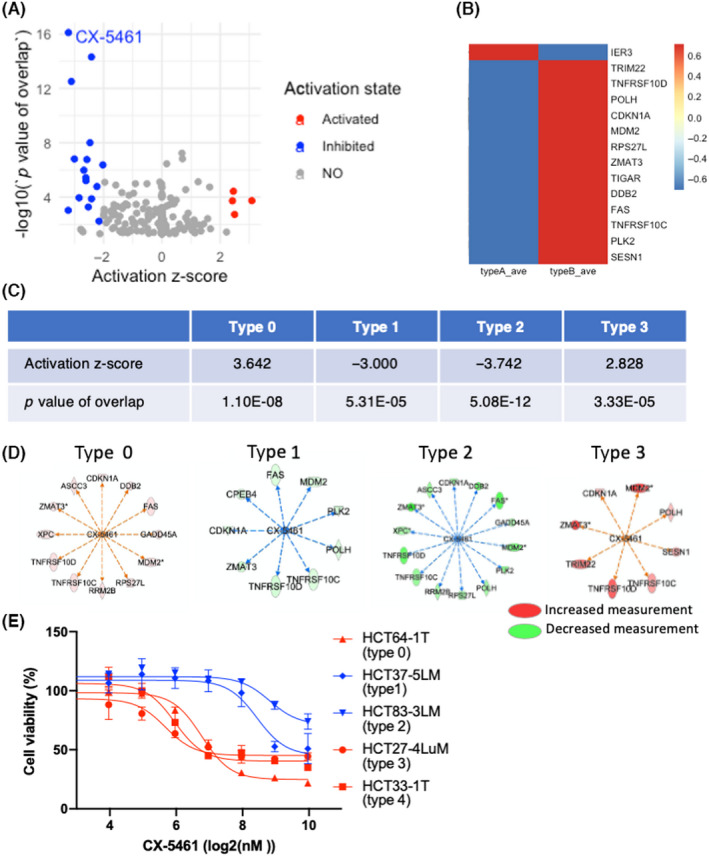
Correlation of morphology of patient‐derived organoids (PDOs) from patients with colorectal cancer and the sensitivity to an RNA polymerase I inhibitor, CX‐5461. (A) Volcano plot of upstream regulator analysis of type A and B PDOs. The activation states of the regulators are shown by color. Four and 16 compounds were activated and inhibited, respectively. (B) Heatmap of downstream target genes of CX‐5461. (C) Summary upstream regulator analysis of CX‐5461 in PDOs after five‐type classification. (D) Mechanistic network of CX‐5461. Increased and decreased measurement of downstream targets in PDOs classified into types 0, 1, 2, and 3 are shown in red and green, respectively. (E) Sensitivity of PDOs to CX‐5461. PDOs of each type were exposed to the indicated concentrations of CX‐5461, and cell viability was measured by the size of the organoids 10 days after adding the drug
The analysis of the five types of PDOs predicted that CX‐5461 produced an “inhibited” state in type 1 and 2 PDOs, whereas it produced an “activated” state in type 0 and 3 PDOs (Figure 6C,D). No downstream genes were differentially expressed in type 4 PDOs. Most downstream molecules were shared among the PDO types, including MDM2, TNFRSF10C, TNFRSF10D, and CDKN1A (Figure 6D).
To evaluate the biological significance of these findings, we treated PDOs with CX‐5461 and determined their response (Figure 6E). Type 1 and 2 PDOs that downregulated the downstream genes were resistant to CX‐5461, whereas type 0 and 3 PDOs, which showed upregulation of the downstream genes, were sensitive to CX‐5461. Type 4 PDOs were sensitive, despite the lack of significant correlation in the upstream regulator analysis. Although more comprehensive analyses are needed, these observations support the notion that the morphology of PDOs is correlated to the response to chemotherapeutic agents targeting RNA polymerase I.
4. DISCUSSION
In this study, we focused on the morphology of CRC PDOs and generated AI‐based classifiers, which categorized them into six types. Most CRCs are tubular adenocarcinomas and can be categorized into tub1and tub2 tumors based on the degree of gland formation. In our cohort, 69 of 72 (95.8%) PDOs were established from tubular adenocarcinomas. Notably, the pathological grading of the original tumor was not correlated to the morphological typing of the corresponding PDOs. This discrepancy can be explained by the fact that tumors grow in different microenvironments, whereas PDOs are cultured in identical culture conditions. We speculate that the morphology of PDOs reflects their cellular‐intrinsic properties and therefore can provide novel indicators of tumor character in addition to those obtained from the pathological studies of tumor tissues. Considering that a growing number of PDOs have been established in various facilities, the AI‐based classifier makes their objective morphological typing possible and therefore is of great help to characterize tumor tissue by providing the common research platform.
Comparative transcriptome analysis between type A and B PDOs revealed that gene sets related to cell adhesion were differentially expressed in different morphological types (Figure 3B). Integrins were among the core differentially expressed genes. They function as transmembrane linkers mediating interactions between the cytoskeleton and the ECM. 16 They bind to actin filaments, which shape the plasma membrane of cells. 17 Although the precise mechanisms by which integrins regulate morphogenesis are unknown, integrin‐mediated adhesion to the ECM is critical for cellular integrity and tissue architecture in the 3D culture in Matrigel. 29 , 30 In CRC, ITGA6/B4 dimers have been shown to be involved in tumor progression, migration, and anoikis resistance. 15 , 31 , 32 Our findings shed light on the significance of integrin‐mediated regulation of CRC development and provide the rationale to utilize PDOs as a platform for further investigation of integrin‐mediated signaling.
The five‐type morphological categorization of PDOs revealed the remarkable enrichment of ribosome biogenesis in type 1 PDOs (Figure 5B). The detailed analysis of enriched genes further indicated the increased expression of core molecules constituting the RNA polymerase I complex in type 1 PDOs, whereas their expression was low in type 0 PDOs (Figure 5C). Notably, PDOs with high expression of ribosome biogenesis‐related genes also had high expression of stem cell markers, whereas those with low expression of ribosome biogenesis‐related genes expressed differentiation markers (Figure 5D). Recent studies have reported that translational control and protein synthesis are fundamental regulators of stem cell identity and function. 33 , 34 In CRC, tumor tissues are composed of cells with varying levels of ribosome biogenesis‐related genes, and their overexpression defines stemness. 25 In this study, we showed that PDOs exhibiting stemness properties had increased expression of genes involved in ribosome biogenesis, whereas those with differentiation features retained low levels of ribosome biogenesis genes, indicating that there is interpatient diversity in ribosome biogenesis and cellular heterogeneity. We believe that uncovering the mechanisms controlling ribosome biogenesis in stem cells represents a promising approach to establishing a novel classification of CRC, which could aid in stratifying patients for prognosis and treatment.
CX‐5461 has been developed as a compound that selectively inhibits Pol I transcription of ribosomal DNA. 35 It exerts antitumor effects in a variety of cancer cell lines and multiple preclinical models. 36 , 37 Wang et al. recently demonstrated that colon‐specific knockout of a transcriptional repressor for rRNA, Znf545, accelerated tumor formation in ApcMin/+ mice and a model of azoxymethane/dextran sulfate sodium‐induced CRC. 38 Notably, CX‐5461 treatment of ApcMin/+Znf545−/− mice reduced the tumor number and tumor burden. Mechanistically, CX‐5461 induced biased differentiation toward the goblet cell lineage. 39 Considering the morphology of organoids correlated to the cellular composition, 40 the effect of CX‐5461 on the morphology of PDOs is of great interest, because it might provide the clue to uncover the role of Pol I transcription in the cell differentiation program in human advanced CRC. CX‐5461 is currently undergoing phase I/II clinical trials for advanced hematologic cancers. 41 , 42 This first in‐human study reported single‐agent antitumor activity, but only one in five patients achieved an objective response. Further comprehensive evaluation of CRC PDOs is needed to estimate the response rate in CRC. Nevertheless, we showed that approximately 20% of PDOs, comprised of type 0, 3, and 4, showed low ribosome biogenesis and were sensitive to CX‐5461. Considering the number of CRC patients, selection of patients that respond to this compound would make a significant contribution for cancer therapy. The CRC PDOs and the classification provide an excellent opportunity to obtain molecular markers for selection of patients for personalized therapy.
In this study, we developed the AI‐based extractor and classifier to categorize morphology of PDOs. Although there is still room for improvement, including the 3D culture, image acquisition, and the training of AI, we revealed its potential application for the development of cancer therapy. Patient‐derived organoids have been established in various facilities, and are used for basic research as well as for preclinical study, because they represent various features of original tumors. The morphological knowledge accumulated by experienced researchers in organoid culture is valuable, but, to the best of our knowledge, consensus has still not been reached. Importantly, manual morphological classification is time‐consuming and often results in different grouping among the referees. The extractor and classifier developed in this study is a useful tool to analyze tumor heterogeneity and to develop cancer therapy by providing the opportunity to evaluate the PDOs.
DISCLOSURE
The authors declare no conflict of interest. Ryoji Yao is an editorial board member of Cancer Science.
Supporting information
Table S1
Table S2
Figure S1–S5
Appendix S1
ACKNOWLEDGMENTS
We thank Dr. Kengo Takeuchi (Cancer Institute, JFCR) for the suggestions and comments on this paper. This work was supported in part by MEXT/JSPS KAKENHI grant numbers, 17H063333 (R.Yao), 19K22570 (R.Yao) and 21H02770 (R.Yao). This paper is partly based on the results obtained from a project, JPNP20006, commissioned by New Energy and Industrial Technology Development Organization (NEDO).
Okamoto T, Natsume Y, Doi M, et al. Integration of human inspection and artificial intelligence‐based morphological typing of patient‐derived organoids reveals interpatient heterogeneity of colorectal cancer. Cancer Sci. 2022;113:2693‐2703. doi: 10.1111/cas.15396
Funding information
Ministry of Education, Culture, Sports, Science, and Technology Japan/Japan Society for the Promotion of Science KAKENHI, Grant/Award Number: 17H063333, 19K22570, 21H02770
Contributor Information
Hidenori Sakanashi, Email: h.sakanashi@aist.go.jp.
Ryoji Yao, Email: ryao@jfcr.or.jp.
REFERENCES
- 1. Punt CJ, Koopman M, Vermeulen L. From tumour heterogeneity to advances in precision treatment of colorectal cancer. Nat Rev Clin Oncol. 2017;14:235‐246. [DOI] [PubMed] [Google Scholar]
- 2. Fujii M, Matano M, Toshimitsu K, et al. Human intestinal organoids maintain self‐renewal capacity and cellular diversity in niche‐inspired culture condition. Cell Stem Cell. 2018;23:787‐793.e6. [DOI] [PubMed] [Google Scholar]
- 3. van de Wetering M, Francies HE, Francis JM, et al. Prospective derivation of a living organoid biobank of colorectal cancer patients. Cell. 2015;161:933‐945. [DOI] [PMC free article] [PubMed] [Google Scholar]
- 4. Pasch CA, Favreau PF, Yueh AE, et al. Patient‐derived cancer organoid cultures to predict sensitivity to chemotherapy and radiation. Clin Cancer Res. 2019;25:5376‐5387. [DOI] [PMC free article] [PubMed] [Google Scholar]
- 5. Vlachogiannis G, Hedayat S, Vatsiou A, et al. Patient‐derived organoids model treatment response of metastatic gastrointestinal cancers. Science. 2018;359:920‐926. [DOI] [PMC free article] [PubMed] [Google Scholar]
- 6. Yao Y, Xu X, Yang L, et al. Patient‐derived organoids predict chemoradiation responses of locally advanced rectal cancer. Cell Stem Cell. 2020;26:17‐26.e6. [DOI] [PubMed] [Google Scholar]
- 7. Okamoto T, duVerle D, Yaginuma K, et al. Comparative analysis of patient‐matched PDOs revealed a reduction in OLFM4‐associated clusters in metastatic lesions in colorectal cancer. Stem Cell Reports. 2021;16:1‐14. [DOI] [PMC free article] [PubMed] [Google Scholar]
- 8. Sato T, Stange DE, Ferrante M, et al. Long‐term expansion of epithelial organoids from human colon, adenoma, adenocarcinoma, and Barrett's epithelium. Gastroenterology. 2011;141:1762‐1772. [DOI] [PubMed] [Google Scholar]
- 9. Yaeger R, Chatila WK, Lipsyc MD, et al. Clinical sequencing defines the genomic landscape of metastatic colorectal cancer. Cancer Cell. 2018;33:125‐136.e3. [DOI] [PMC free article] [PubMed] [Google Scholar]
- 10. Mondaca S, Walch H, Nandakumar S, Chatila WK, Schultz N, Yaeger R. Specific mutations in APC, but not alterations in DNA damage response, associate with outcomes of patients with metastatic colorectal cancer. Gastroenterology. 2020;159:1975‐1978.e4. [DOI] [PMC free article] [PubMed] [Google Scholar]
- 11. Cancer genome atlas N. comprehensive molecular characterization of human colon and rectal cancer. Nature. 2012;487:330‐337. [DOI] [PMC free article] [PubMed] [Google Scholar]
- 12. Beaulieu JF. Integrin alpha6beta4 in colorectal cancer: expression, regulation, functional alterations and use as a biomarker. Cancers (Basel). 2019;12:41. [DOI] [PMC free article] [PubMed] [Google Scholar]
- 13. Yang GY, Xu KS, Pan ZQ, et al. Integrin alpha v beta 6 mediates the potential for colon cancer cells to colonize in and metastasize to the liver. Cancer Sci. 2008;99:879‐887. [DOI] [PMC free article] [PubMed] [Google Scholar]
- 14. Cantor DI, Cheruku HR, Nice EC, Baker MS. Integrin alphavbeta6 sets the stage for colorectal cancer metastasis. Cancer Metastasis Rev. 2015;34:715‐734. [DOI] [PubMed] [Google Scholar]
- 15. Languino LR, Linhares MM, Affonso RJ, et al. Genetic and immunohistochemical expression of integrins ITGAV, ITGA6, and ITGA3 as prognostic factor for colorectal cancer: models for global and disease‐free survival. Plos One. 2015;10:e0144333. [DOI] [PMC free article] [PubMed] [Google Scholar]
- 16. Kechagia JZ, Ivaska J, Roca‐Cusachs P. Integrins as biomechanical sensors of the microenvironment. Nat Rev Mol Cell Biol. 2019;20:457‐473. [DOI] [PubMed] [Google Scholar]
- 17. Humphries JD, Chastney MR, Askari JA, Humphries MJ. Signal transduction via integrin adhesion complexes. Curr Opin Cell Biol. 2019;56:14‐21. [DOI] [PubMed] [Google Scholar]
- 18. Nait Slimane S, Marcel V, Fenouil T, et al. Ribosome biogenesis alterations in colorectal cancer. Cell. 2020;9:2361. [DOI] [PMC free article] [PubMed] [Google Scholar]
- 19. Kharde S, Calvino FR, Gumiero A, Wild K, Sinning I. The structure of Rpf2‐Rrs1 explains its role in ribosome biogenesis. Nucleic Acids Res. 2015;43:7083‐7095. [DOI] [PMC free article] [PubMed] [Google Scholar]
- 20. Lapik YR, Fernandes CJ, Lau LF, Pestov DG. Physical and functional interaction between Pes1 and Bop1 in mammalian ribosome biogenesis. Mol Cell. 2004;15:17‐29. [DOI] [PubMed] [Google Scholar]
- 21. Rohrmoser M, Holzel M, Grimm T, et al. Interdependence of Pes1, Bop1, and WDR12 controls nucleolar localization and assembly of the PeBoW complex required for maturation of the 60S ribosomal subunit. Mol Cell Biol. 2007;27:3682‐3694. [DOI] [PMC free article] [PubMed] [Google Scholar]
- 22. Wang Y, Liu J, Huang BO, et al. Mechanism of alternative splicing and its regulation. Biomed Rep. 2015;3:152‐158. [DOI] [PMC free article] [PubMed] [Google Scholar]
- 23. Hennig L, Bouveret R, Gruissem W. MSI1‐like proteins: an escort service for chromatin assembly and remodeling complexes. Trends Cell Biol. 2005;15:295‐302. [DOI] [PubMed] [Google Scholar]
- 24. Cheng L, Yuan B, Ying S, et al. PES1 is a critical component of telomerase assembly and regulates cellular senescence. Sci Adv. 2019;5:eaav1090. [DOI] [PMC free article] [PubMed] [Google Scholar]
- 25. Morral C, Stanisavljevic J, Hernando‐Momblona X, et al. Zonation of ribosomal DNA transcription defines a stem cell hierarchy in colorectal cancer. Cell Stem Cell. 2020;26:845‐861.e12. [DOI] [PMC free article] [PubMed] [Google Scholar]
- 26. Bastide A, David A. The ribosome, (slow) beating heart of cancer (stem) cell. Oncogenesis. 2018;7:34. [DOI] [PMC free article] [PubMed] [Google Scholar]
- 27. Uhlitz F, Bischoff P, Peidli S, et al. Mitogen‐activated protein kinase activity drives cell trajectories in colorectal cancer. EMBO mol Med. 2021;13:e14123. [DOI] [PMC free article] [PubMed] [Google Scholar]
- 28. Kramer A, Green J, Pollard J Jr, Tugendreich S. Causal analysis approaches in ingenuity pathway analysis. Bioinformatics. 2014;30:523‐530. [DOI] [PMC free article] [PubMed] [Google Scholar]
- 29. Knouse KA, Lopez KE, Bachofner M, Amon A. Chromosome segregation Fidelity in epithelia requires tissue architecture. Cell. 2018;175:200‐211.e13. [DOI] [PMC free article] [PubMed] [Google Scholar]
- 30. Lee JL, Streuli CH. Integrins and epithelial cell polarity. J Cell Sci. 2014;127:3217‐3225. [DOI] [PMC free article] [PubMed] [Google Scholar]
- 31. Benoit YD, Larrivee JF, Groulx JF, Stankova J, Vachon PH, Beaulieu JF. Integrin alpha8beta1 confers anoikis susceptibility to human intestinal epithelial crypt cells. Biochem Biophys Res Commun. 2010;399:434‐439. [DOI] [PubMed] [Google Scholar]
- 32. Gagne D, Groulx JF, Benoit YD, et al. Integrin‐linked kinase regulates migration and proliferation of human intestinal cells under a fibronectin‐dependent mechanism. J Cell Physiol. 2010;222:387‐400. [DOI] [PMC free article] [PubMed] [Google Scholar]
- 33. Blanco S, Bandiera R, Popis M, et al. Stem cell function and stress response are controlled by protein synthesis. Nature. 2016;534:335‐340. [DOI] [PMC free article] [PubMed] [Google Scholar]
- 34. Liakath‐Ali K, Mills EW, Sequeira I, et al. An evolutionarily conserved ribosome‐rescue pathway maintains epidermal homeostasis. Nature. 2018;556:376‐380. [DOI] [PubMed] [Google Scholar]
- 35. Drygin D, Lin A, Bliesath J, et al. Targeting RNA polymerase I with an oral small molecule CX‐5461 inhibits ribosomal RNA synthesis and solid tumor growth. Cancer Res. 2011;71:1418‐1430. [DOI] [PubMed] [Google Scholar]
- 36. Sanij E, Hannan KM, Xuan J, et al. CX‐5461 activates the DNA damage response and demonstrates therapeutic efficacy in high‐grade serous ovarian cancer. Nat Commun. 2020;11:2641. [DOI] [PMC free article] [PubMed] [Google Scholar]
- 37. Xu H, Di Antonio M, McKinney S, et al. CX‐5461 is a DNA G‐quadruplex stabilizer with selective lethality in BRCA1/2 deficient tumours. Nat Commun. 2017;8:14432. [DOI] [PMC free article] [PubMed] [Google Scholar]
- 38. Wang S, Wong CC, Zhang Y, et al. ZNF545 loss promotes ribosome biogenesis and protein translation to initiate colorectal tumorigenesis in mice. Oncogene. 2021;40:6590‐6600. [DOI] [PMC free article] [PubMed] [Google Scholar]
- 39. Stedman A, Beck‐Cormier S, Le Bouteiller M, et al. Ribosome biogenesis dysfunction leads to p53‐mediated apoptosis and goblet cell differentiation of mouse intestinal stem/progenitor cells. Cell Death Differ. 2015;22:1865‐1876. [DOI] [PMC free article] [PubMed] [Google Scholar]
- 40. Fatehullah A, Appleton PL, Nathke IS. Cell and tissue polarity in the intestinal tract during tumourigenesis: cells still know the right way up, but tissue organization is lost. Philos Trans R Soc Lond B Biol Sci. 2013;368:20130014. [DOI] [PMC free article] [PubMed] [Google Scholar]
- 41. Khot A, Brajanovski N, Cameron DP, et al. First‐in‐human RNA polymerase I transcription inhibitor CX‐5461 in patients with advanced hematologic cancers: results of a phase I dose‐escalation study. Cancer Discov. 2019;9:1036‐1049. [DOI] [PubMed] [Google Scholar]
- 42. Hilton J, Gelmon K, Cescon D, et al. A phase 1 trial evaluating CX‐5461, a novel first‐in‐class G‐quadruplex stabilizer in patients with advanced solid tumors enriched for DNA‐repair deficiencies Proceedings of the 2019 San Antonio Breast Cancer Symposium. San Antonio, TX. Philadelphia (PA): AACR. Cancer Res. 2020;80(Suppl. 4):Abstract nr PD4‐02. [Google Scholar]
Associated Data
This section collects any data citations, data availability statements, or supplementary materials included in this article.
Supplementary Materials
Table S1
Table S2
Figure S1–S5
Appendix S1


