Abstract
The butylene carbocation in its salts with anions CHB11F11– and CHB11Cl11– forms isomers CH2=C+–CH2–CH3 (I) and CH3–C+=CH–CH3 (II), which were characterized here by infrared (IR) spectroscopy and X-ray diffraction analysis. The strongest influence on the structure of the cations is exerted by geometric ordering of their anionic environment. In the crystalline phase, the cations uniformly interact with neighboring anions, and the C=C bond is located in the middle part of the cations forming a −CH=C+– moiety with the highest positive charge on it and the lowest νC=C frequency, at 1490 cm–1. In the amorphous phase with a disordered anionic environment of the cations, contact ion pairs Anion–···CH2=C+–CH2–CH3 form predominantly, with terminal localization of the C=C bond through which the contact occurs. The positive charge is slightly extinguished by the anion, and the C=C stretch frequency is higher by ∼100 cm–1. The replacement of the hydrogen atom in cations I/II by a Cl atom giving rise to cations CH2=C+–CHCl–CH3 and CH3–C+=CCl–CH3 means that the donation of electron density from the Cl atom quenches the positive charge on the C+=C bond more strongly, and the C=C stretch frequency increases so much that it even exceeds that of neutral alkene analogues by 35–65 cm–1. An explanation is given for the finding that upon stabilization of the vinyl cations by polyatomic substituents such as silylium (SiMe3) and t-Bu groups, the stretching C=C frequency approaches the triple-bond frequency. Namely, the scattering of a positive charge on these substituents enhances their donor properties so much that the electron density on the C=C bond with a weakened charge becomes much higher than that of neutral alkenes.
1. Introduction
Vinyl carbocations are known as a class of reactive intermediates important for organic synthesis1 and have been studied extensively.2,3 They are considered highly reactive and therefore uncontrollable intermediates that are difficult to investigate. Nonetheless, research by Mayr and co-workers shows that the reactivity of vinyl cations has been exaggerated.3 It is even weaker than that of diarylcarbenium cations, some of the stablest trisubstituted cations. Recently, it was demonstrated that the benzyl carbocation has carbine-like reactivity: it acts as a strong protonating agent, thereby converting into a carbine molecule, whose high reactivity can be perceived as the reactivity of the carbocation.4 The same conclusions have been reached by Niggemann and Gao:5 the high reactivity of vinyl cations is a myth: they are converted to reactive intermediates with carbine-like reactivity.
Stabilization of vinyl cations by nucleophilic substituents decreases their reactivity and facilitates studies in this field. Thus, the use of alkyl,6−8 aryl,9−11 and other substituents7,8,12−14 that effectively delocalize the positive charge on themselves has made it possible to obtain the salts of vinyl cations that are stable at room temperature. Their study by X-ray, infrared (IR), and NMR spectroscopy has revealed one unusual property:7,8,11,12 electron density on the C+=C bond, to which the electron-donor substituents are attached, significantly exceeds that of neutral alkene molecules. It seems that the positive charge on the C+=C bond promotes a strong increase in its electron density supplied by substituents. An explanation for this finding has not been reported.
Recently, vinyl-type isobutylene15 and propylene carbocation salts16 were obtained; they appear to be thermally stable up to 150 °C. Their investigation by X-ray crystallography and IR spectroscopy indicates that they strongly differ from stabilized cations by their νC+=C frequencies, which are significantly lower than those of the neutral alkenes (by ∼160–180 cm–1), which can be expected. Vinyl cations are strongly affected by the anionic environment. For example, the crystal lattice stabilizes the most unstable (according to quantum-chemical prediction17) isobutylene isomer (CH3)2C=C+H, or else, in amorphous salts, it ionically pairs with the anion. Another peculiarity of vinyl cations is that the calculated frequency of their C+=C stretch is completely inconsistent with an experimental one: the difference reaches 360 cm–1 for the propylene cation16 and 330 cm–1 for the isobutylene cation.15 The same unacceptable discrepancies between the calculated and experimental IR frequencies have been noted for saturated alkane carbocations.18 Nevertheless, quantum-chemical calculations with the same basis set are quite applicable to stabilized vinyl cations with substituents on which the positive charge is effectively dissipated.7,8
In the present work, we report the preparation of salts of other isomers of vinyl cation C4H7+, including monochlorinated cation C4H6Cl+. As counterions, carborane anions CHB11F11– and CHB11Cl11– were chosen because of their extreme inertness.19 A comparison of the features of IR-spectroscopic properties and structures of isomers of carbocations C4H6Cl+, C4H7+, and C3H5+ allows one to clearly see the general picture of the properties of vinyl carbocations (with the help of the literature data), both nonstabilized and stabilized ones. Quantum-chemical calculations were not carried out in this work owing to their inapplicability to nonstabilized vinyl cations15,16 and because of easy interpretation of their most characteristic IR bands without calculations.
2. Results
2.1. Chloronium Cation as a Precursor for Obtaining Vinyl Carbocations
Injection of 1,4-dichlorobutane vapors into an IR cell reactor with a thin film of HCHB11Cl11 acid (hereafter abbreviated as H{Cl11}) led to their interaction involving HCl elimination (Figure 1). Upon completion of the reaction, the characteristic IR spectrum of the acid disappeared and the absorption intensity of gaseous HCl reached a maximum. That is, the known reaction of chloroalkanes with superacid proceeds via the first stage20 according to eq 1
| 1 |
Figure 1.
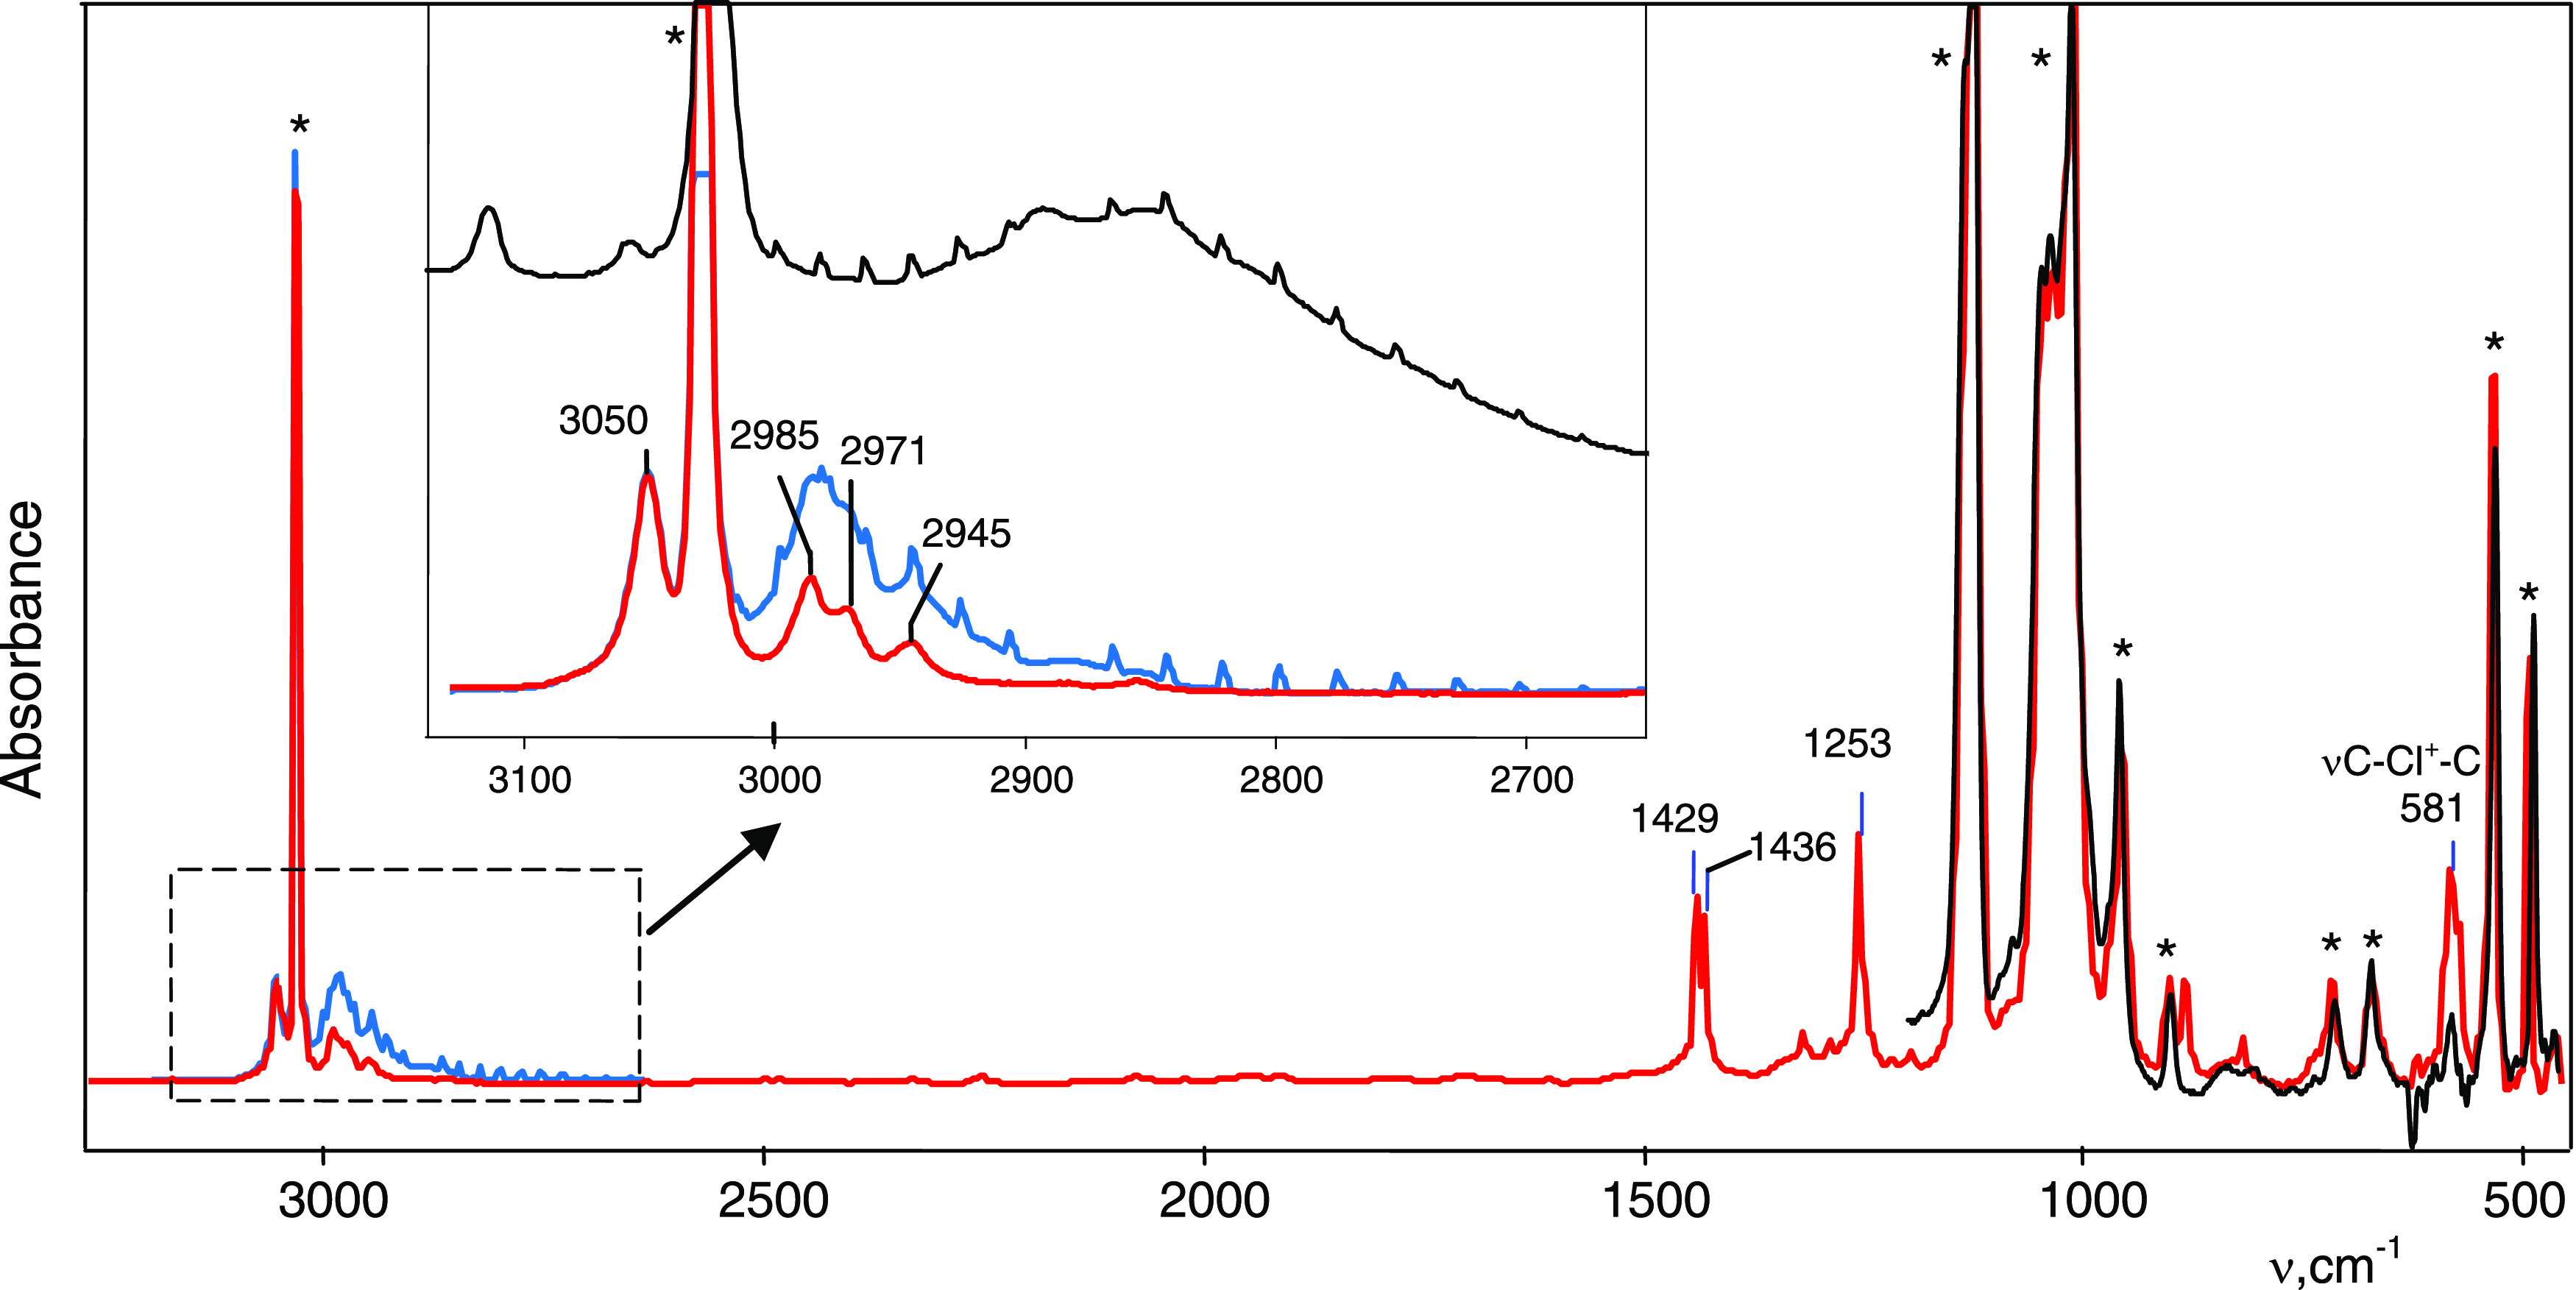
IR spectrum of products of the reaction of 1,4-dichlorobutane vapors with the H{Cl11} acid (blue) and an isolated spectrum of the formed salt (CH2CH2)2Cl+{Cl11–} (red), after the removal of 1,4-dichlorobutane vapors and gaseous HCl by evacuation. The spectrum of decomposition products of the salt (CH2CH2)2Cl+{Cl11–} when heated at 150 °C is black. The most distinctive bands of the {Cl11–} anion are marked with asterisks.
The IR spectrum of the resultant salt contains an intense band at 581 cm–1, typical for the C–Cl+–C group of the chloronium ion.20,21 Two types of chloronium cations can arise under these conditions. The first one emerges if the C4H8Cl+ cation formed according to eq 1 interacts with a molecule of C4H8Cl2 to form di-(chlorobutyl)chloronium
On the other hand, chloronium cations R–Cl+–R with more than three carbon atoms in R decompose at room temperature with the release of HCl and carbocation formation.21 Therefore, this pathway should be excluded. The second type of chloronium cation arises if the formed C4H8Cl+ cation cyclizes to (CH2CH2)2Cl+. Such a cation should be close in stability to diethylchloronium (CH3CH2)2Cl+, which is stable at room temperature but will decompose when heated. Indeed, heating of the chloronium salt obtained in the IR cell reactor to 150 °C destroyed the cation with the disappearance of the 582 cm–1 band of chloronium group C–Cl+–C and the emergence of a characteristic absorption pattern of gaseous HCl in the IR spectrum (Figure 1, black spectrum). The intensity of its absorption reached 90% of that of HCl, generated by reaction 1. This finding proves that chloronium cation (CH2CH2) 2Cl+ actually forms, which decomposes with increasing temperature with the release of one HCl molecule and the emergence of the C4H7+ carbocation
| 2 |
Chloronium salt C4H8Cl+{Cl11–} can be obtained in a weighable amount by direct interaction of a small amount of liquid 1,4-dichlorobutane with an acid powder (wetting without an excess), followed by washing with a small volume of cold dichloromethane (DCM) and drying in vacuum. The attenuated total reflectance (ATR) IR spectrum of the obtained white powder of the salt did not differ from that obtained in the IR cell reactor.
In the same way, we prepared a chloronium salt from the CHB11F11– anion (hereafter abbreviated as {F11–}) using the H{F11} acid. Its IR spectrum with the most characteristic band νasC–Cl+–C at 584 cm–1 is consistent with that of the salt of the {Cl11–} anion (Table S1).
Both salts of carbocations C4H8Cl+ and C4H7+ proved to be soluble in DCM. Crystals were grown from these solutions, which were studied by X-ray crystallography.
2.2. Chlorinated Vinyl Carbocation
We were unable to obtain crystals of the chloronium salt for X-ray-structural analysis. Nonetheless, the composition and schematic representation of the chloronium cation structure can be determined from a set of IR-spectroscopic assays and other experimental data. The main arguments in favor of the proposed composition and structure of the chloronium cation—which follow from the IR-spectroscopic data and the conditions for the preparation of its salts—are
-
(1)
the cation is formed by the elimination of anion Cl– from the C4H8Cl2 molecule by reaction 1;
-
(2)
its IR spectrum contains the band of the asymmetric stretching vibration of the bridged Cl atom at 581 cm–1, which is characteristic of the chloronium group C–Cl+–C;
-
(3)
when the salt is heated to 150 °C, the cation decomposes according to eq 2 with the release of one HCl molecule, and the absorption band of the chloronium group disappears in the IR spectrum;
-
(4)
in the frequency range of stretching CH vibrations, four bands are present (Figure 1). They correspond to two nonequivalent CH2 groups: the two frequencies at 3050 and 2971 cm–1 virtually match the bands νasCH2(Cl) = 3038 cm–1 and νsCH2(Cl) = 2974 cm–1 of the CH2–(Cl+) group in the crystalline salt of diethylchloronium, (CH3CH2)2Cl+{Cl11–};20 two others (at 2986 and 2945 cm–1) are typical for the frequencies νasCH2 and νsCH2 of aliphatic CH2 groups.22
These arguments are enough to assert that the cation under
study is cyclic butylchloronium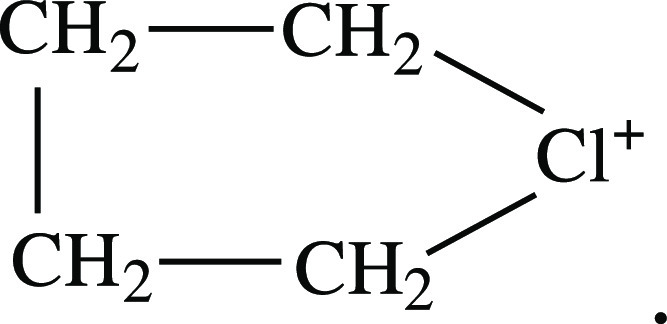
The chloronium salt is well soluble in DCM. Incubation of the solution above the hexane vapor causes the crystals to appear. The yield of crystals from this solution is low, and their formation takes several days, which may be an indirect sign that the crystals derive not from the initial compound but rather from the products of its secondary reactions.
X-ray structure of the crystals revealed that this is a C4HmCl+{Cl11–} salt with discrete cations and anions. The cationic part of the salt consists of two crystallographically nonequivalent C4 cations containing a Cl atom. One of the cations is more disordered. Therefore, to analyze the structure of the cations, we utilized additional information following from the IR spectra of these crystals.
Figure 2 shows an ATR IR spectrum of the single crystal flattened under pressure on the surface of a diamond of the ATR accessory. Sequentially recorded spectra indicated their time dependence. The first one contains two intense bands at 1710 and 1680 cm–1, which can belong only to C=C stretch. With successive recordings at short intervals (tens of seconds), the intensity of the 1710 cm–1 band decreased until it disappeared, and the 1680 cm–1 band increased accordingly. Therefore, the crystalline salt contains two isomers of the vinyl cation, which we will designate as A (with νC=C at 1680 cm–1) and B (with νC=C at 1710 cm–1). Isomer B is stabilized by the crystal lattice and, upon its destruction, transforms into isomer A, which is more stable in the amorphous phase. Subtracting the spectrum of cation A from the spectrum of the mixture of cations A and B, we can isolate the spectrum of cation B (Figure 2, green).
Figure 2.
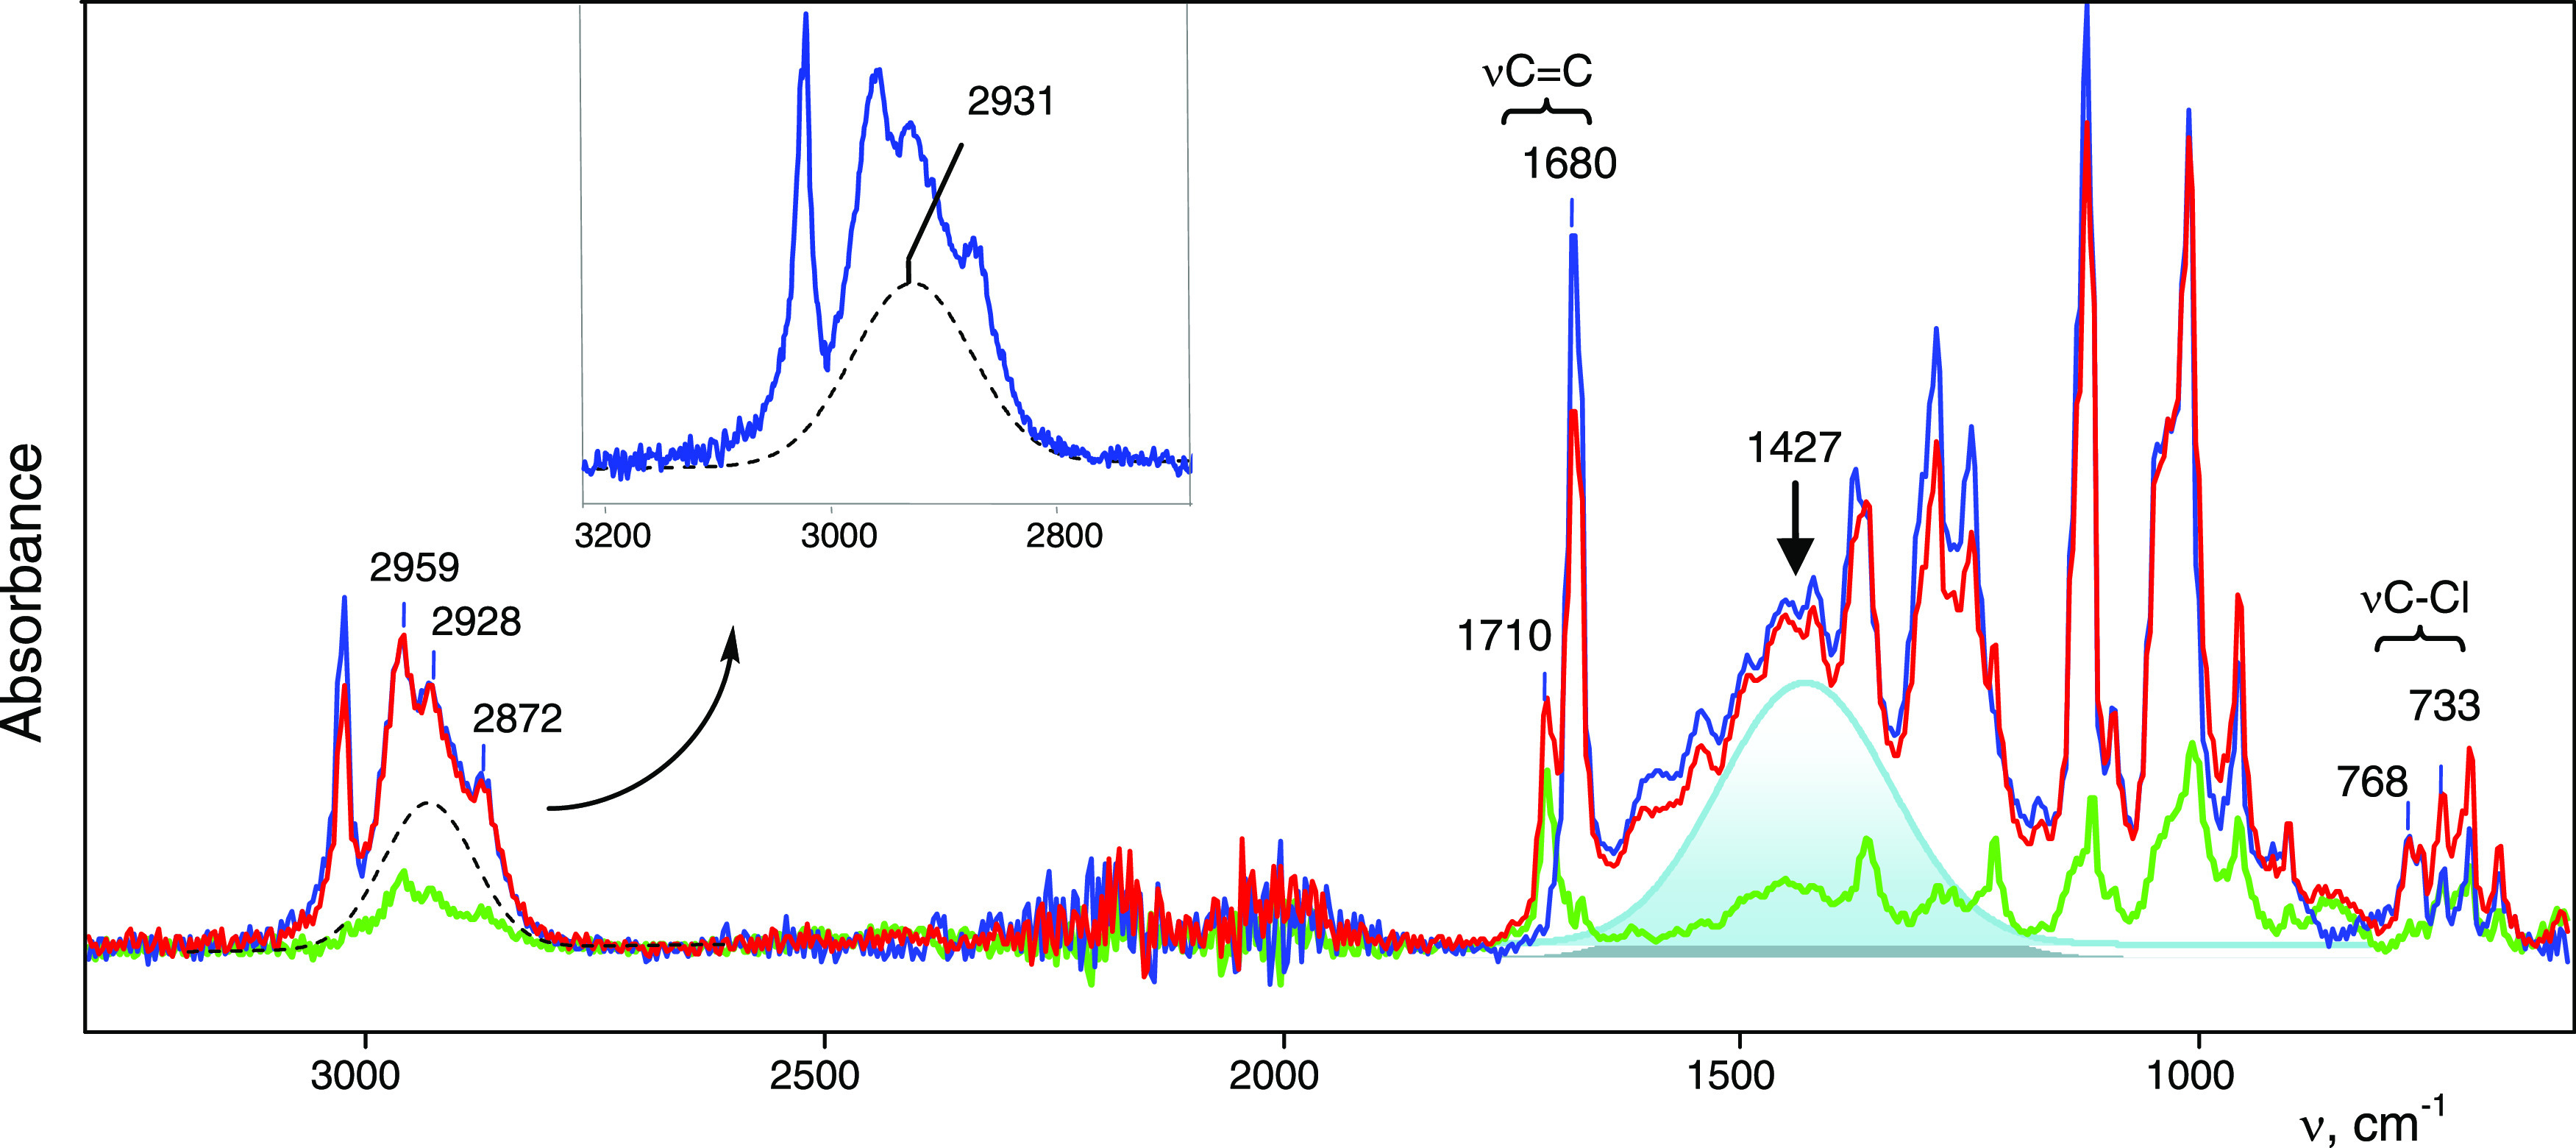
ATR IR spectrum (with ATR correction) of the crystal salt of C4HmCl+{Cl11–} after X-ray-structural analysis, as recorded within the first minute after crushing on the ATR accessory (red) and repeating the recording in 3–4 min (blue). The isomer B spectrum, obtained by subtracting the “blue” spectrum from the “red” spectrum is green. Broad intense absorption at ∼1400 cm–1 is shaded in light blue.
The spectra of isomers A and B are very different from that of the starting chloronium salt. They each contain one band of C–Cl stretch at 768 and 733 cm–1, respectively, which are characteristic of C–Cl bonds. In the frequency range of stretching C–H vibrations, three narrow bands are observed: at 2959, 2928, and 2872 cm–1, typical of CH3 groups of alkanes.22 The spectrum of isomer A contains a very broad absorption pattern in the frequency range of C–H stretching (2930 cm–1) and bending (1427 cm–1; Figure 2) vibrations, which is a sign of fast proton exchange at the IR spectroscopy time scale, known for alkane carbocations.23 Therefore, it can be expected that the isomer contains CH2 or CH groups, whose protons are involved in fast exchange.
Thus, according to the IR spectra, the cation of the crystalline salt C4HmCl+{Cl11–} consists of two isomers A and B, which have nonequivalent C=C and C–Cl bonds and contain nearly equivalent CH3 groups (Figure 3).
Figure 3.
(a) X-ray structure of the C4HmCl+ cation in its salt with the {Cl11–} anion (not shown), which represents overlapping structures of two isomers A (sticks) and B (balls); (b) structure of isomer A and its schematic representation; and (c) crystallographic superposition of the structures of isomer B with its schematic representation.
Let us go back to the X-ray structure of the C4HmCl+ cation. It does show the superposition of the structures of the two isomers A and B (Figure 3). The structure of A can be determined rather reliably (Figure 3b): it contains the −C+=CH2 group with a shortened double bond (1.33 Å) on which the positive charge is mainly concentrated. Isomer B is more disordered due to the crystallographic overlap of its two orientations, as presented in Figure 3c. This situation causes a strong increase in the ellipsoid of the Cl atom and to its apparent bridge type.
In the B cation, the chlorine atom is attached directly to the middle C+=C bond. This arrangement leads to a stronger extinguishing of the positive charge on this bond and a greater weakening of the C–Cl bond, as compared with those of A, where the Cl atom is more distant from the −C+=CH2 moiety. Cation A also contains CH and CH2 groups, which can participate in fast proton exchange on the IR time scale.
We attempted to obtain crystals of the salt of cations A and B with the {F11–} anion by recrystallizing the chloronium salt C4H8Cl+{F11–} from a DCM solution under exactly the same conditions where the crystals of cations A and B with the {Cl11–} anion were obtained. Next, the crystals were grown. Nevertheless, X-ray diffraction analyses showed that they are an ionic salt, Cat+{F11–}, with a carbocation that does not contain a chlorine atom. Therefore, we discuss this compound below.
2.3. X-ray Analysis of Vinyl-Type Butylene Carbocations in the Crystal Phase
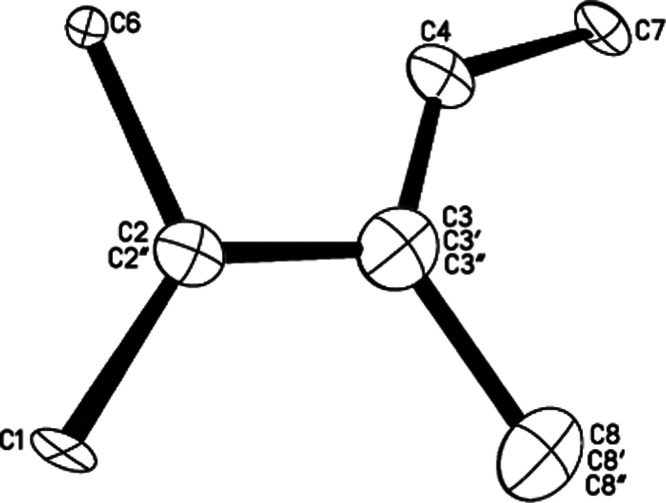
The crystals growing from a DCM solution of C4H7+{Cl11–} salt appeared rather quickly (1–2 days) with a good yield. The X-ray crystal structure uncovered an ionic compound with gross formula C4H7+{Cl11–} (Table S4) and a cationic moiety, which represents three crystallographically overlapping structures (Figure 4). This means that in one cell formed by the anions, the cation isomer can be in three different orientations.
Figure 4.
Crystallographic carbon skeleton of the cationic part of C4H7+{Cl11–} salt, as it looks when all orientations of the isomers are superimposed.
Separation of differently oriented isomers indicated that one of them has a trans-configuration, and we will denote it as I (Figure 5). The other two structures have a cis-configuration. Because they are very similar in geometry, we will designate them as IIa and IIb (Figure 5). The middle CC bond in the trans- and cis-isomers is noticeably shorter than two terminal CC bonds (Table S6) and should be attributed to a double bond. One of the two middle C atoms with the highest positive charge on it (C2′, C2, and C4, Figure 5) should have sp1 hybridization with an angle close to 180° (the same is true for A and B cations). By contrast, the experimental angle turned out to be much smaller. This issue will be discussed later in the paper.
Figure 5.
Structures of isomers I and IIa,b.
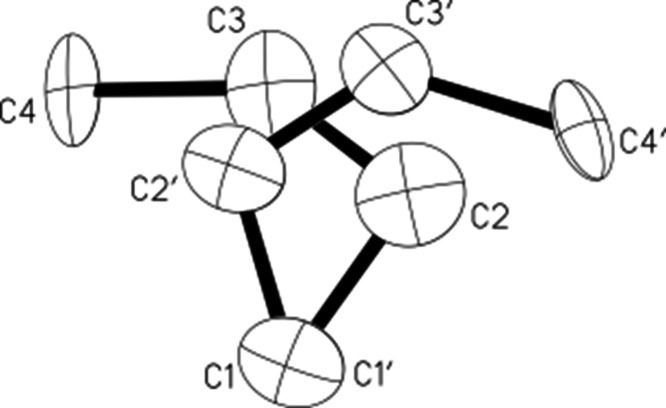
We already noted that our attempt to obtain the crystalline chloronium salt C4H8Cl+{F11–} from its DCM solution failed. Crystals were grown from this solution for a long time with a low yield, which may indicate their formation from the products of side reactions. The X-ray diffraction data showed that this is an ionic compound with gross formula C8H15+{F11–} (Table S4) and a chlorine-free organic moiety. The independent part of the unit cell contains the cation C4H7+ (which will be denoted as III) and the neutral 2-butene molecule, both in cis-configuration (Figure 6, the H atoms and the anion are not shown). Positions of the cation and neutral molecule are diversified by the center of symmetry. This adds two more positions, giving rise to real disordering shown in Figure 7. The location of four organic moieties with two {F11–} anions in the unit cell is presented in Figure 8.
Figure 6.
Positions of cation III and 2-butene in the independent part of the unit cell. Only carbon atoms are shown.
Figure 7.
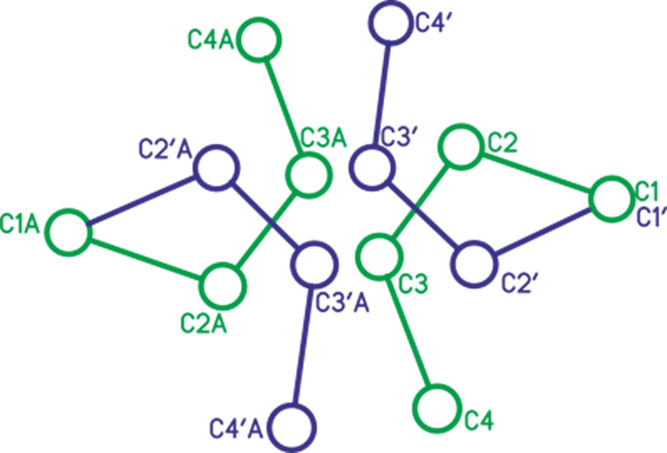
Disordering of cation III (green) and 2-butene (blue) in the crystal across all positions (the circles represent carbon atoms). Moieties of the dependent part are marked with A.
Figure 8.
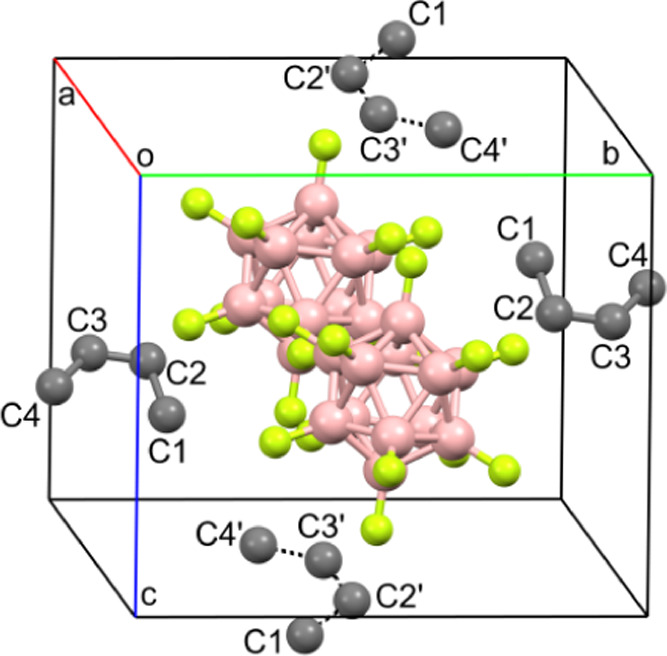
Locations of anions, cations, and 2-butene molecules (with dotted CC bonds) in the unit cell.
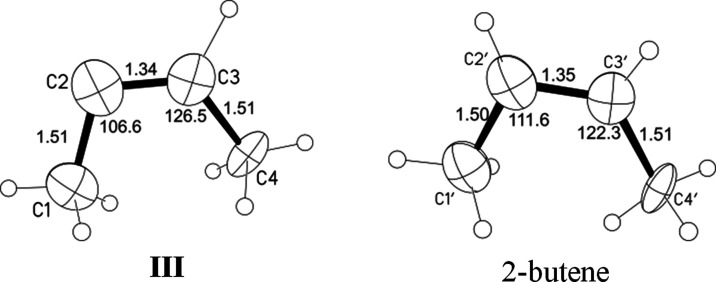
The geometry is very similar between cation III and 2-butene (within the margin of error of determination, Figure 9). Due to the high R-factor because of disorder of the crystal structure it is not possible to localize the H atom on C2 or C2′ atoms. Nonetheless, geometric calculation gives a better R-factor when the H atom is positioned on the C2′ atom instead of the C2 atom. Therefore, we will assume that the C2′ atom (with all C′ atoms) belongs to 2-butene and the second entity is cation III. The geometric parameters of isomer III and 2-butene are given in Figure 9 and Table S7.
Figure 9.
Geometry of cation III and 2-butene in the independent part of the unit cell.
3. Discussion
3.1. Effect of the Environment on Vinyl Carbocations
Vinyl cations are affected by the basicity of the anions and the order of their localization in the immediate environment.
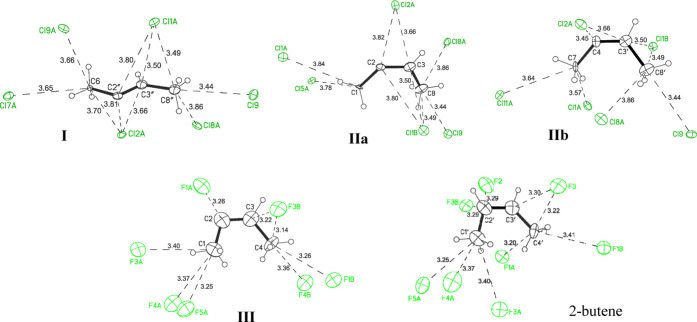
Surrounded by weakly basic {F11–} anions, the C4H7+ cation forms only cis-isomer III. The shortest eight C···F distances between the C atoms of the isomer and the F atoms of the anions are similar and are in fact identical to those formed by neutral 2-butene (Figure 10). This means that the weak basicity of the anionic environment contributes to the increased uniformity of its interaction with the cations and to the uniformity of charge scattering over the cation. The stronger interaction of the C4H7+ cation with the more basic {Cl11–} anions diminishes the homogeneity of this interaction: (C)=CH–CH3 moieties of isomers I and IIa,b are the same because the interactions of their C atoms with the Cl atoms of neighboring anions (C···Cl distances) are identical. Nonetheless, the same interaction of their second part CH3–C+=(C) with the environment is different (Figure 10). This state of affairs enhances the asymmetry of the cations, and the CH3–C+=C angle can take two values, thereby leading to the formation of the trans-I isomer.
Figure 10.
X-ray structure of C4H7+ isomers I, IIa, and IIb in salts with the {Cl11–} anion and isomer III and 2-butene molecule in salts with the {F11–} anion having the shortest distances between C atoms of the organic moieties and F/Cl atoms of neighboring anions.
Isomers I–III all have one feature: the bond angle at the sp1 carbon atom with the highest positive charge is much smaller (130–109°) than the 180° angle at the sp1 C atoms in neutral hydrocarbons. It can be assumed that the reason is the enhanced interaction of the sp1 carbon atom with one or two fluorine or chlorine atoms of the nearest anion, but this is not the case. The Csp1···F/Cl distances are similar to those of other carbon atoms in the isomers (Figure 10). That is, this property is an intramolecular feature of carbocations. The same feature (the angle at sp1 C atom less than 180°) is also true for cations A and B.
X-ray crystallography determines only the carbon skeleton of cations. The positions of H atoms in structures I–III presented in Figures 5 and 10 are the result of a calculation based on the fact that, according to X-ray diffraction data, the C=C bond is located in the middle of the nearly symmetric molecule, and in the IR spectra in the CH stretch frequency range, only absorption of CH3 groups is observed. Nonetheless, the high similarity of geometrical parameters of cation III with those of neutral 2-butene (Figure 10) suggests that a H atom must be attached to the C2 atom in III. It also follows from the similarity of the geometry of cations II and III that their two middle C atoms with sp1 hybridization are nearly equivalent. That is, they must contain the C–H group and their structure can be depicted as shown in Scheme 1.
Scheme 1. Schematic Representation of the Structures of Cations II and III.
In the a structure, the H atom looks like a bridge: it quickly migrates between two potential holes located near the C atoms, as in proton disolvates L–H+–L, where L is the base molecule. The IR spectrum of II contains intense low-frequency absorption at ∼1400 cm–1 (Figure 11), which indicates the presence of fast proton dynamic effects in the cation (in the spectrum of III, this frequency range overlaps with intense absorption of the anion) and can indirectly confirm the presence of a bridging proton with a double-well proton potential. The bridging proton promotes the formation of cis-isomers.
Figure 11.
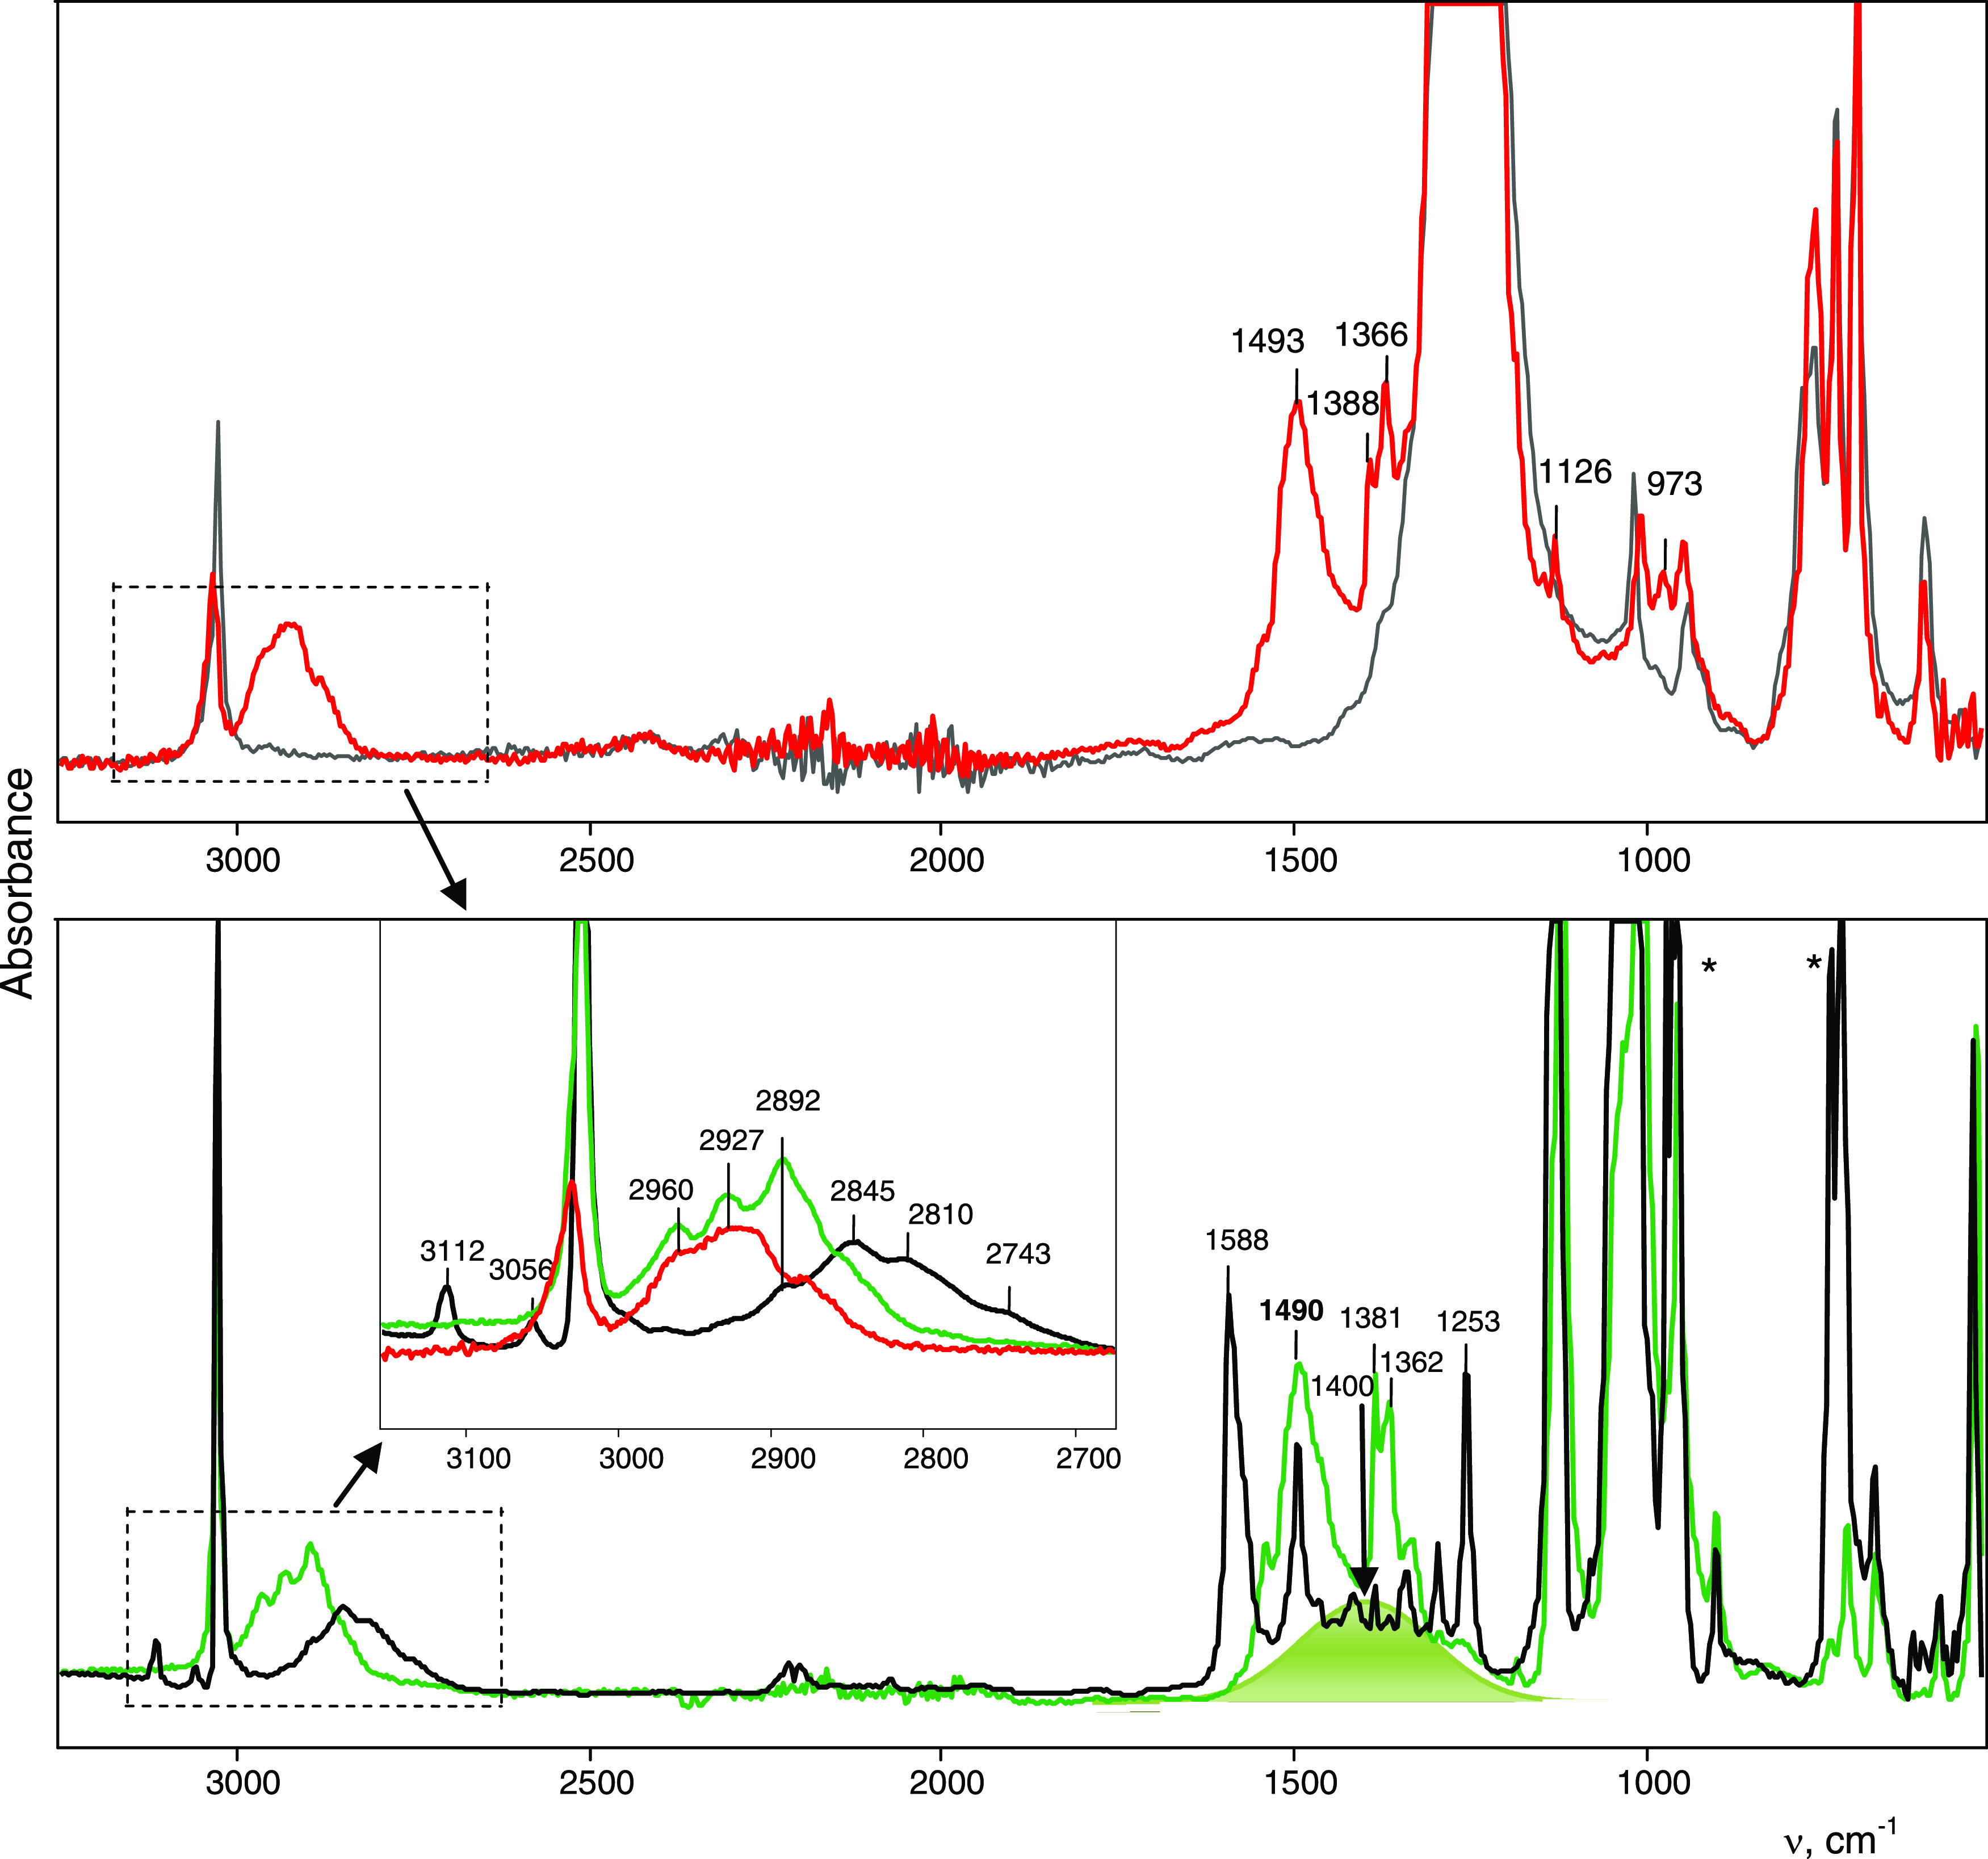
ATR IR spectra (with ATR corrections) of cations I/II (green) and III (red) in their crystal salts with anions {Cl11–} and {F11–}, respectively, and the IR spectrum (in transmission mode) of amorphous salt C4H7+{Cl11–} (black). To illustrate the spectrum of the {F11–} anion, an IR spectrum of the Cs{F11} salt is given (gray). Two intense bands of the adsorbed CD2Cl2 molecules that were not removed by evacuation after we washed the amorphous salt with d2-DCM are marked with an asterisk. Intense bands with unspecified frequencies belong to the anion. Broad intense absorption in the region ∼1400 cm–1 is shaded in green.
The geometry of the carbon skeleton of trans-isomer I can be explained satisfactorily by structure  . Nonetheless, because the details
of its IR spectrum, overlapping with the spectra of isomers IIa and IIb cannot be seen, this structure can
neither be confirmed nor refuted.
IR spectra of cations A and B also contain very strong and broad absorption at 1427 cm–1 (Figure 2), indicating a fast proton exchange at the IR time scale that is characteristic of a bridging proton. Therefore, for cation A, a similar structural scheme can be proposed as for cations II and III (Scheme 2).
Scheme 2. Schematic Representation of the Structure of Cation A.
The positions of the C and Cl atoms in the B cation were determined with greater error; therefore, for this cation, we will not discuss the situation with a fast proton exchange and the possibility of the formation of a bridging proton.
It should be noted that a linear isomer CH3–C+=CH2 with an angle at the central sp1 carbon atom of 180° does not yield broad intense absorption at 1400 cm–1 in the IR spectrum.16 Its presence in the IR spectra can probably serve as an indicator of a bridging proton in carbocations, as shown in Schemes 1 and 2.
The fact that, in crystalline salts, there are no shortened C···F/Cl distances between cations and anions and all of the distances are similar to or exceed the corresponding van der Waals distances (rC + rCl = 3.53 Å)24 indicates that the cations are in uniform anionic surroundings (UAS) with strong dispersion of a positive charge over them. This observation supports their symmetric structure with a bridged proton (Scheme 1). They will be hereafter designated as UAS cations.
The IR spectra of the carbocations are highly informative. 2-Butene of the (C4H7+)(C4H8) {F11–} salt does not yield a band of the C=C stretch vibration. This means that in the crystal lattice, 2-butene is a highly symmetric molecule because only in this case is the C=C vibration not IR-active. Small differences between angles C1′–C2′–C3′ and C2′–C3′–C4′ in 2-butene, as determined by X-ray diffraction analysis, are within the margin of error of determination for this disordered system (Table S7). For cation III, the band of the C=C stretch vibration at 1493 cm–1 has high intensity (Figure 11), indicating the asymmetry of its charged central moiety −C+=CH–.
For all studied salts of carbocations, two sets of νC=C stretch frequencies can be distinguished, which belong to two types of isomers of cations C4H7+ and C3H5+.
The first set is UAS cations
of the crystal salts with a broad
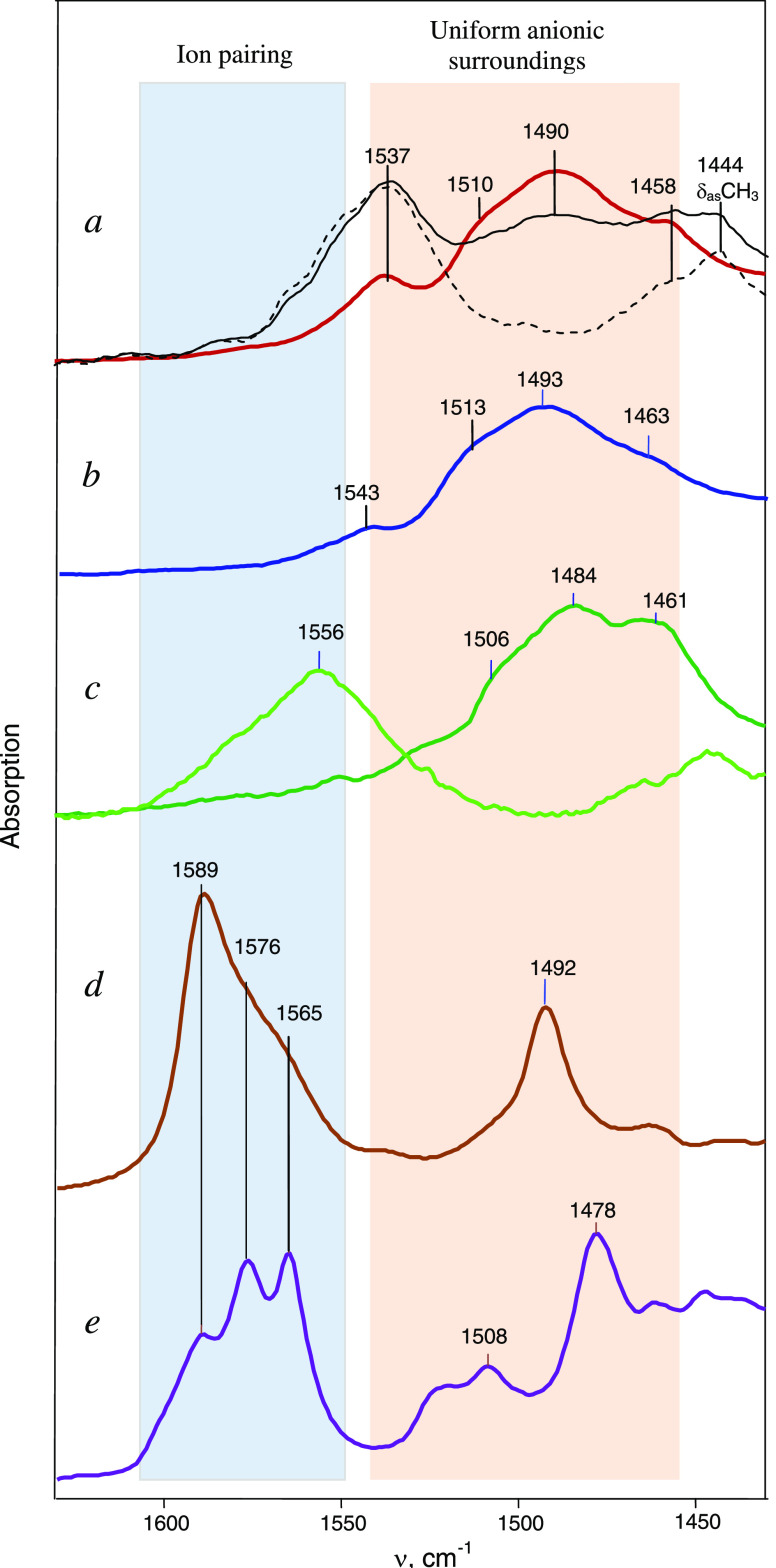
band of the C+=C stretch at ∼1490 cm–1 (Figure 12). Their frequencies are almost independent of the basicity
of the anionic environment, {F11–} or
{Cl11–} (Figure 11, Table 1); being very weak, basicity differs significantly
between these anions.21 Moreover, the C+=C stretches of the middle  group of isomers I–III are very similar to those of the terminal
 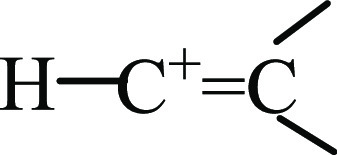 groups of UAS vinyl cations15,16 H–C+=CH–CH3 and H–C+=C(CH3)2 (Table 1). That is, the middle and terminal C=C
bonds of the UAS cations hardly differ in electron density.
Figure 12.
IR spectra in the C=C stretch frequency range: (a) UAS cations I/II with the {Cl11–} anion in the crystalline (brown) and amorphous (black) phases. The latter was obtained by evaporation of the solution from which the crystals were grown. The dotted spectrum is the difference between the black and brown spectra. (b) UAS cation III with the {F11–} anion in the crystal phase. (c) (CH3)2C=C+H cation with the {Cl11–} anion under UAS conditions in the crystal phase (dark green) and in IPs in the amorphous phase (light green).15 (d) CH2=C+CH2CH3 cation with the {Cl11–} anion in both IPs and UAS conditions in an amorphous salt. (e) CH2=C+CH3 cation with the {Cl11–} anion in both IP and UAS conditions within the crystal salt.16
Table 1. Some Indicative C–H and C=C Stretch Frequencies of the UAS Cations.
| cation | anion | phase | CH stretch of CH3 group | C=C stretch | |||||
|---|---|---|---|---|---|---|---|---|---|
| I/II | CH3−C+=CH−CH3 | {Cl11−} | crystal | 2960 | 2928 | 2892 | 1537 | 1510 | 1490a |
| CH3−C+=CH−CH3 | {Cl11−} | amorphous | 2970 | 2929 | 2878 | 1537 | |||
| III | CH3−C+=CH−CH3 | {F11−} | crystal | 2960 | 2922 | 2877 | 1541 | 1513 | 1493 |
| i-butylene15 | (CH3)2C=CH+ | {Cl11−} | crystal | 2960 | 2930 | 2874 | 1506 | 1485 | |
The intense band belonging to the main cation is underlined.
In the CH stretch frequency region, IR spectra of I/II and III show only the absorption of the CH3 groups, and that of the CH group should be at ∼1400 cm–1 if its H atom is bridged (Figure 11). The CH3 frequencies are very close to those of neutral alkenes,22 suggesting that the positive charge of the cation, being distributed over the carbon skeleton of isomers I–III, has little impact on their CH3 groups.
The second group of the vinyl isomers has higher C=C stretching frequencies, at 1550–1600 cm–1 (Figure 12). They are seen in the spectra of the amorphous salt obtained via decomposition of chloronium salt C4H7+{Cl11–} at 150 °C. The spectra of this group differ from those of UAS cations not only by the increased frequency of the C=C stretch (by 70–100 cm–1) but also by the presence of new bands at 3112 and 3056 cm–1, which are highly characteristic for the CH2 = group (Figure 11, Table 2).
Table 2. CH and C=C Stretch Frequencies of an Ion-paired Cation with the {Cl11–} Anion in Comparison with Those of Their Neutral Analogues.
| cation or neutral analogue | phase | CH stretches for =CH2 or =CH+ | C=C stretches | ΔνC=Cc | |||
|---|---|---|---|---|---|---|---|
| CH2=C+–CH2–CH3 | solid | 3112 | 3056 | 1589a | 1576 | 1561 | |
| CH2=CH–CH2–CH325 | gas | 3090 | 3008 | 1645 | 56 | ||
| CH2=C+–CH3 | solid | 3104 | b | 1589 | 1576 | 1565 | |
| CH2=CH–CH322 | gas | 3087 | 2990 | 1642 | 66–77 | ||
 |
solid | 3040 | 1556 | ||||
| (CH3)2C=CH222 | gas | 3088 | 2980 | 1660 | 104 | ||
The most intense bands are underlined.
Not determined.
The difference between C=C stretching frequencies of neutral alkenes and their corresponding carbocations.
This means that the other isomer of the C4H7+ cation with the terminal CH2=(C) group arises in the amorphous phase; we denoted it as IV
| IV |
(Formation of the methyl allyl cation  is not possible because its
νasCCC frequency must be close to that of the allyl
cation, 1303 cm–1, with CH stretch frequencies below
3000 cm–1.16)
We have already encountered such phenomena when investigating isobutylene cation HC+=C(CH3)2 and propylene cation C3H5+ in amorphous salts with the {Cl11–} anion.15,16 The reason for the difference between their spectra and the spectra of crystalline salts is that in the amorphous phase, the anionic environment of the cation is disordered. This situation favors the interaction of the cation with one of the anions, thereby producing an ion pair (IP) in which a cation charge is shifted to the site oriented toward the anion.
C=C stretch frequencies of isomer IV (and frequencies of its =CH2 group) match those of the CH2=C+–CH3 cation in the crystalline salt with {Cl11–} (Figure 12d,e), which was studied by X-ray crystallography.16 In other words, cation IV in the amorphous phase, and cation CH2=C+–CH3 in the crystalline phase, form identical IPs with the {Cl11–} anion. Therefore, if we analyze the structure of the IP of a propylene cation in a crystal phase in more detail than we did earlier in ref (16), it will be possible to acquire information about the structure of the IP formed by IV in the amorphous phase.
The C3H5+{Cl11–} crystal contains two types of linear isomers of CH2=C+–CH3, which differ in the character of interaction with the anions of the environment. In one isomer, all C···Cl distances exceed 3.642 Å (i.e., the sum of van der Waals radii rC and rCl: 3.53 Å), and this is the UAS cation. The second cation has a shortened C···Cl distance, 3.189 Å, which indicates the formation of IPs by this cation. Let us consider the second case.
The X-ray structure of the ion-paired cation looks symmetric due to the crystallographic overlap of oppositely oriented cations, as displayed in Figure 13. This arrangement leads to apparent equalization of a shortened C1/C3···Cl(anion) distance and bond lengths between atoms C1, C2, and C3. In the IP, the emergence of a C1/C3···Cl contact between the =CH2 group of the cation and the Cl atom of the anion inevitably lengthens the opposite C(H3)···Cl distances, which should exceed 3.642 Å. Then, for the average value of the C1/C3···Cl distances to match the experimentally determined 3.189 Å, the length of the short contact should be less than 2.73 Å. The latter value can be used as an estimate of the upper limit of the contact length in the IPs. Then, the structure of similar IPs formed by the butylene cation in an amorphous salt can be schematically presented as in Figure 14.
Figure 13.
Schematic representation of a linear CH3–C+=CH2 cation ion-paired with the {Cl11–} anion in the crystal salt.14 The carbon skeleton of the cation was determined by X-ray crystallography and is shown by gray balls. Crystallographic superposition of two oppositely oriented structures of C3H5+ leads to the alignment of the C–C bonds and C···Cl distances.
Figure 14.
Schematic representation of the structure of the IPs arising in the amorphous salt C4H7+{Cl11–}.
The similarity of the IR spectra between cations IV and CH2=C+CH3 is manifested not only in the matching of their C=C stretch frequency but also in the identity of their spectra in the region of CH stretch vibrations (Figure 11): all νCH of CH2 and CH3 groups are lowered by ∼100 cm–1 as compared with those of the neutral alkenes or UAS cations. For the ion-paired CH2=C+–CH3 cation, this feature has been explained by the involvement of the CH3 group in weak hyperconjugation with the 2pz orbital of the charged central carbon atom.16 In the case of cation IV, such an explanation is hardly acceptable. For vinyl-type carbocations, the nature of the hyperconjugation effect probably requires clarification.
The absorption bands of stretching C=C vibrations of cations IV in the IP consist of three components (Figure 12d, Table 2). A possible reason is that anions {F11–} and {Cl11–} have three sites of halogen atoms with different basicity: a < b < c (Figure 15). This has been experimentally proven by means of protonated carbon monoxide, H+CO, as a test cation: it is attached to three sites—a, b, and c—forming IPs, thereby leading to the splitting of its νCH and νCO frequencies into three components.26
Figure 15.
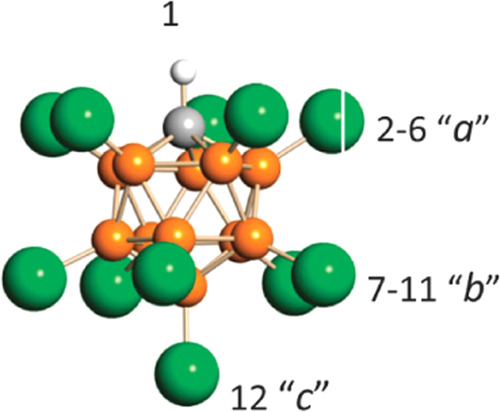
Icosahedral carborane anion, CHB11Hal11– (Hal = F, Cl), with the numbering of three types of Hal atoms differing in basicity.
The same can happen when vinyl cations form IPs. The X-ray structure shows that the CH3–C+=CH2 cation is attached to the most basic site c of the anion. Nonetheless, different rotational orientations of the anion are possible, allowing the cation, albeit less likely, to come into contact with sites a and b, which will cause the observed splitting of the νC=C band into three components.
The influence of the inhomogeneous basicity of the Cl atoms of the {Cl11–} anions on the absorption bands of the C=C stretch in the UAS cations is weaker and can broaden them. Indeed, the IR spectra of UAS cations show one broad intense band νC=C at ∼1490 cm–1. Nonetheless, weak bands are also observed at 1513 and 1537 cm–1 (Figure 12). Their nature was revealed by the following experiment. A drop of a solution of the amorphous salt C4H7+{Cl11–} in DCM, from which crystals of the salt of isomers I/II were grown, was placed on the surface of the crystal of ATR accessory and evaporated. The IR spectrum of the resulting amorphous film shows two C=C stretch bands: one is the same as that of UAS isomers I/II at 1490 cm–1 and the second at 1537 cm–1 belongs to another cation. By subtraction of the spectrum of isomers I/II from this spectrum, the band at 1490 cm–1 can be well compensated and the band at 1537 cm–1 can be isolated (Figure 12a) along with the full spectrum across the entire frequency range. It hardly differs from the spectrum of I/II, except for the band of the C=C stretch and moreover does not contain the characteristic bands of the =CH2 group. Consequently, the amorphous film comprises only isomers of UAS-type cations: the most symmetrical I/II, and a second cation, more distorted in a less homogeneous anionic environment; it approaches the formation of the IP but does not reach it. Therefore, the presence of a weak band at 1537 cm–1 in the spectra of crystals can be explained either by the fact that the surface of the crystals is contaminated with a dried initial solution, or by the finding that the crystal contains inclusions of UAS isomers in a more inhomogeneous anionic environment.
The spectra of amorphous and crystalline salts of vinyl cations containing an IP also show additional weak bands of C=C stretch vibrations of UAS cations (Figure 12). That is, in solid salts with IP cations, some portion of UAS cations is always in equilibrium with them.
The νC=C frequencies can serve as indicators for the identification of IP and UAS cations in the solid salts. Crystalline salts of C4H7+ cations contain only UAS cations, possibly with a small proportion of slightly distorted ones. Amorphous salts of cations C3H5+ and C4H7+ contain mainly IP cations with some proportion of UAS cations as well.
The frequencies of C=C stretches of the IP cations exceed those of the UAS cations by ∼100 cm–1, which means that the π-bonding is strengthened when some of the positive charge is transferred to the anion upon contact. In this regard, it is interesting to trace how the addition of an electron-donating substituent to the vinyl group affects the C=C bond.
3.2. Effect of Nucleophilic Substituents on the Vinyl Cations
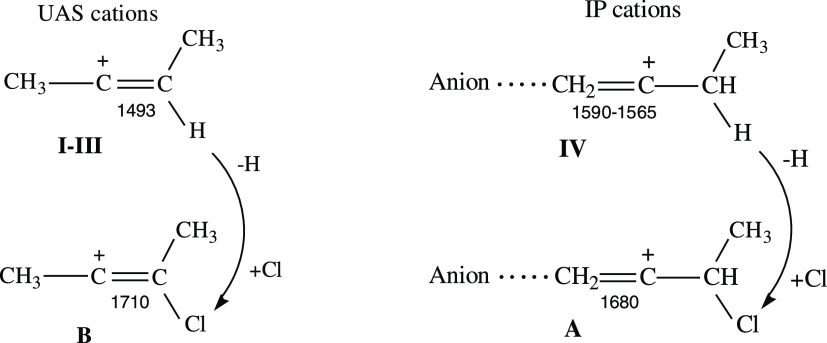
The crystalline salt C4H8Cl+{Cl11–} contains two isomers A and B of the chlorobutylene cation. On the other hand, when the crystal lattice is destroyed, isomer B turns into A. The question arises whether isomer B is stabilized by the crystal lattice and then is a UAS isomer, and in the amorphous phase, whether isomer A is stabilized by ion pairing, and then is an IP isomer? Serious arguments in favor of such an assumption are the finding that the C+=C bond in B is the middle one, which only UAS cations have, and during ion pairing, it relocates to the terminal site of the cation, converting the cation to isomer A (Scheme 3).
Scheme 3. Transition of Cation B to A upon Destruction of the Crystal Lattice and Formation of IPs .
The replacement of the H atom in UAS cations by a chlorine nucleophile raises the C=C stretching frequency by ∼220 cm–1, which almost twofold exceeds that when UAS cations are transferred to IP cations (Scheme 4). The same substitution in IP cations leads to a smaller increase in νC=C (by 90–115 cm–1) because the Cl atom is at a greater distance from the C=C bond. For both isomers A and B, the νC=C exceeds that of the neutral alkene analogues by 35 and 65 cm–1, respectively.
Scheme 4. Comparison of the UAS and IP Cations with Their Chlorovinyl Analogues B and A, Respectively.
The stretching frequencies are given underneath the C=C bonds.
It is interesting how much the chlorine atom extinguishes the positive charge on the C=C bond? C–Cl stretch frequency of cation A (770 cm–1) matches that of the CH2Cl– groups of the di(chloromethyl)chloronium cation: (CH2Cl)2Cl+ (768 cm–1).20 Therefore, the positive charge on the Cl atom of A is similar to that on the terminal Cl atoms of the (CH2Cl)2Cl+ cation, meaning that a smaller part of the charge is distributed to the Cl atom, and the charge remains mostly on the C=C bond.
The attachment of a nucleophile to a charged C+=C
bond results in a decrease of its charge and in a high-frequency shift
of the C=C stretch to such an extent that it can even exceed
the νC=C of neutral alkenes. This observation is in agreement
with other reports on vinyl-type carbocations R′C+=CR″2 stabilized by electron-donating groups R′ and R″. For instance,
in vinyl cation  with nucleophile R′ = alkyl or aryl groups
and two β-silyl substituents, which are not nucleophiles in
neutral molecules, the positive charge on the C=C bond is greatly
reduced due to the combined influence of three substituents directly
attached to the positively charged C=C bond.7,8,11,12 From NMR data,
it follows that considerable delocalization of the charge onto the R′ substituents and the silyl groups occurs. According
to the X-ray diffraction analysis, the C=C bond is shortened
to 1.234 Å for R′ = cyclopropyl7 or 1.221 Å for R′
= t-Bu,8 and the C=C
stretching frequencies in the IR spectra increase significantly up
to 1958 and 1987 cm–1, respectively. These data
are more consistent with a triple C≡C bond than a double C=C
bond. Not only do electron-donating substituents R′ significantly
decrease the electron deficiency in the positively charged C=C
group but also β-silyl groups promote quenching of the charge
of the (Cα=Cβ)+ bond owing to the involvement of Cβ–Si σ-bonds
in hyperconjugation with the formally empty 2p orbital at the positively
charged Cα atom.7,8,11,12
For small nonstabilized vinyl-type cations, C3H5+ and C4H7+, the positive charge is localized mainly on the C=C bond that naturally approaches one-and-a-half-bond status with a reduced C=C stretching frequency down to 1490 cm–1. When vinyl-type cations are stabilized by substituents capable of effectively dissipating a positive charge on themselves, their ability to donate electrons through σ-bonds, π-bonds, or the hyperconjugation effect is enhanced and nucleophilicity increases. This brings the C=C linkage closer to the triple-bond status.
The peculiarity of the C=C stretch frequency is in agreement with the results of density functional theory (DFT) calculations [at the B3LYP/6–311+G(d,h) level of theory] only for the stabilized vinyl cation.7,8,11,12 At the same time, DFT and MP2 calculations with the same basis set predicted for isobutylene (CH3)3C=CH+ and all studied isomers of the nonstabilized C3H5+ cation15,16 that the frequency of C=C stretches exceeds that of neutral alkenes by ∼200 cm–1, while experimental νC=C values are lower by ∼160 cm–1. This is a drastic mismatch, reaching 360 cm–1. A similar mismatch between calculated (with different basis sets) and experimental frequencies for CH stretches of C–H bonds involved in hyperconjugation was reported for all alkane carbocations.18,23 It looks like the modern quantum-chemical calculations are consistent with experimental data for carbocations with effective charge dispersion on a large number of substituent atoms but are not applicable to nonstabilized carbocations with significant charge localization on the C=C bond or a small number of C atoms. This issue remains to be resolved.
The present work yielded another interesting result: in a DCM solution, chloronium cation C4H8Cl+ (with the {F11–} or {Cl11–} counterions) containing eight H atoms transforms into vinyl cations containing six H atoms and a double C=C bond. This happens in two ways: (i) with a release of a H2 molecule and transition to chlorinated vinyl cation A or B (Scheme 5), which crystallizes from the solution with the {Cl11–} anion or (ii) with the release of an HCl molecule, thus producing vinyl cation III (Scheme 5), which crystallizes from the solution with anion {F11–}.
Scheme 5. Spontaneous Transition of the Chloronium Cation at Room Temperature in Solutions of its Salts in DCM to Vinyl Cations A and B (with the {Cl11–} Anion) and III (with the {F11–} Anion).
These reactions are possible if the solvation of the chloronium cation with DCM leads to the opening of its ring with the formation of an unstable chlorobutyl cation, which decomposes to more stable vinyl cations with the release of H2 or HCl. At room temperature, spontaneous decay of a saturated carbocation to vinyl with the release of H2 requires more detailed research, and we will devote a separate publication to this phenomenon.
In solid salts, the chloronium cation is stabler because it is “solvated” by anions {Cl11–} or {F11–}. To decompose it, one has to raise the temperature to 140–150° C. Then, it degrades with the release of HCl and the formation of cation IV (Scheme 6).
Scheme 6. Decomposition of the Chloronium Cation.
4. Conclusions
Vinyl-type butylene carbocation C4H7+ can form trans- and cis-isomers CH3–C+=CH–CH3 (I–III) in crystalline salts and isomer CH2=C+–CH2–CH3 (IV) in amorphous salts. They exhibit the following properties:
In crystals, isomers I–III are uniformly surrounded by F/Cl atoms of neighboring anions with C···F/Cl distances between the cation and anion not less than the sum of van der Waals radii rC and rCl. This contributes to the greatest localization of the positive charge on the C=C bond and a decrease in νC=C up to ∼1490 cm–1 (i.e., by 160 cm–1 compared to that of neutral alkenes), which approaches that of aromatic CC bonds.
In amorphous phase, the disorder of the anionic environment of the cation drives the formation of contact IPs with asymmetric cation isomer IV. It binds to the anion through the CH2= group with the contact distance C···Cl not exceeding 2.73 Å, thereby leading to a decrease in the positive charge on the C=C bond and an increase in its C=C stretch by ∼100 cm–1, as compared to UAS cations. Intermediate states are also possible.
Stabilization of cations C4H7+ by the replacement of the H atom with a Cl atom gives rise to isomers A (CH3–CHCl–C+=CH2) and B (CH3–CCl=C+–CH2), both of which are present in crystals. Upon amorphization, isomer B transitions to isomer A owing to ion pairing. Donation of the electron density from the Cl atom to the C=C bond leads to its strengthening and νC=C rises by 90–115 cm–1 (A) and 220 cm–1 (B) relative to their nonchlorinated analogues, respectively.
Stabilization of vinyl cations with polyatomic substituents such as alkyl, aryl, and silylium (R3Si) groups induces a further significant increase in the C=C+ stretching vibration up to 1958 cm–1.7,8,11,12 This value exceeds that for neutral alkenes by ∼308 cm–1. The effective scattering of the positive charge on these polyatomic substituents significantly improves their electron-donating ability. As a consequence, the charge on the C=C linkage greatly wanes, and the electron density on it goes up so much that it approaches a triple-bond state.
Summing up, we can conclude that in this series of “in UAS—ionically paired—stabilized by the Cl atom—stabilized by polyatomic substituents”, the frequency of C=C stretch (and bond strength) monotonically increases from 1490 to 1958 cm–1 (by 470 cm–1!).
A specific feature of the chloronium cation C4H8Cl+ is its ability to spontaneously decompose into the vinyl chloride cation C4H6Cl+ (with release of H2) or the butylene cation C4H7+ (with release of HCl) in a DCM-based medium at room temperature. This means that, under solvation conditions in solutions, the stability of chloronium is inferior to that of vinyl cations. In solid salts, the chloronium is stronger, stabilized by “solvation” with anions {Cl11–} or {F11–}, and decomposes at elevated temperatures of 140–150 °C to form the carbocation CH2=C+–CH2–CH3.
The thermal stability of vinyl cations in their carborane salts up to at least 140 °C allows their salts to be stored for a long time under anaerobic conditions and used as stable reagents in synthetic chemistry.
5. Experimental Section
The carborane acids H{Cl11} and H{F11} were prepared as described previously.27,28 They are purified by sublimation at 150–160 °C under a pressure of 10–5 Torr on cold Si windows in a specially designed IR cell reactor, whose detailed description is given in ref15. The formed thin translucent layer yielded a clearcut IR spectrum. Dry vapors of 1,4-dichlorobutane were injected anaerobically into the IR cell and their interaction with the acid was controlled by sequential recording of IR spectra at short time intervals. All sample handling was carried out in an atmosphere of argon (H2O concentration < 0.5 ppm) in a glovebox. To obtain crystals, a weighable amount of the studied salts was prepared via a direct reaction of the acid powder with a small amount of liquid 1,4-dichlorobutane (wetting without an excess), followed by washing with a small volume of cold DCM and drying in vacuum. 1,4-Dichlorobutane from Sigma-Aldrich, Inc. was used without further purification.
IR spectra were acquired on a Shimadzu IRAffinity-1S spectrometer housed inside a dry box in either transmission or ATR mode (525–4000 cm–1). The spectra were processed in the GRAMMS/A1 (7.00) software from Thermo Fisher Scientific.
X-ray diffraction data were generated on a Bruker Kappa Apex II CCD diffractometer using φ, ω scans of narrow (0.5°) frames with Mo Kα radiation (λ = 0.71073 Å) and a graphite monochromator at a temperature of 200 K. The structures were solved by means of SHELX-2014/529 and refined by a full matrix least-squares anisotropic–isotropic (for H atoms) procedure using the SHELXL-2018/3 software suite.29 Absorption corrections were applied by the empirical multiscan method in SADABS.30 The positions of the hydrogen atoms were computed via the riding model. The crystal structures were analyzed for molecular geometry and short contacts between nonbonded atoms in PLATON(31) and MERCURY software.32 Crystallographic data and details of the X-ray diffraction experiment are listed in Tables S4–S7. CCDC 2143520, 2143521, and 2143522 contain the supplementary crystallographic data for this paper. These data can be obtained free of charge viahttp://www.ccdc.cam.ac.uk/cgi-bin/catreq.cgi, or from the Cambridge Crystallographic Data Centre, 12 Union Road, Cambridge CB2 1EZ, UK; fax: (+44) 1223 336 033; or e-mail: deposit@ccdc.cam.ac.uk.
The high R-factor for the salt of the CH3–C+=CH–CH3 cation with anion {F11–1} is explained by the poor quality of the crystals obtained (crystals of better quality could not be prepared) and well-pronounced disorder of the cations, which is typical for all of the crystals obtained.
Acknowledgments
This research was supported by the Ministry of Science and Higher Education of the Russian Federation (state registration no. 1021052806375-6-1.4.3). The English language was corrected and certified by shevchuk-editing.com.
Supporting Information Available
The Supporting Information is available free of charge at https://pubs.acs.org/doi/10.1021/acsomega.2c03025.
The authors declare no competing financial interest.
Supplementary Material
References
- Naredla R. R.; Klumpp D. A. Contemporary Carbocation Chemistry: Applications in Organic Synthesis. Chem Rev. 2013, 113, 6905–6948. 10.1021/cr4001385. [DOI] [PubMed] [Google Scholar]
- Dicoordinated Carbocations, Rappoport Z.; Stang P. J., Eds.; Willey: New York, 1977. [Google Scholar]
- Byrne P. A.; Kobayashi S.; Würthwein E.-U.; Ammer J.; Mayr H. Why Are Vinyl Cations Sluggish Electrophiles?. J. Am. Chem. Soc. 2017, 139, 1499–1511. 10.1021/jacs.6b10889. [DOI] [PubMed] [Google Scholar]
- Stoyanov E. S.; Stoyanova I. V. The Mechanism of High Reactivity of Benzyl Carbocation, C6H5CH2+, during Interaction with Benzene. ChemistrySelect 2020, 5, 9277–9280. 10.1002/slct.202001852. [DOI] [Google Scholar]
- Niggemann M.; Gao S. Are Vinyl Cations Finally Coming of Age?. Angew. Chem., Int. Ed. 2018, 57, 16942–16944. 10.1002/anie.201810701. [DOI] [PubMed] [Google Scholar]
- Mayr H.; Foerner W.; Schleyer P. vR. Methyl-substituted allyl cations. A comparison of experimental stability, rotational barrier, and solvolysis data with ab initio calculations. J. Am. Chem. Soc. 1979, 101, 6032–6040. 10.1021/ja00514a028. [DOI] [Google Scholar]
- Klaer A.; Saak W.; Haas D.; Müller T. Molecular Structure of a Cyclopropyl Substituted Vinyl Cation. J. Am. Chem. Soc. 2008, 130, 14956–14957. 10.1021/ja8069055. [DOI] [PubMed] [Google Scholar]
- Müller T.; Juhasz M.; Reed C. A. The X-ray structure of a Vinyl Cation. Angew. Chem., Int. Ed. 2004, 43, 1543–1546. 10.1002/anie.200352986. [DOI] [PubMed] [Google Scholar]
- Olah G. A.; Prakash S. G. K.; Molnar A.; Sommer J.. Superacid Chemistry; 2nd ed.; Wiley: Hoboken, NJ, 2009. [Google Scholar]
- Albright T. A.; Freeman W. J.; Schweizer E. E. Magnetic resonance studies. II. Investigation of phosphonium salts containing unsaturated groups by carbon-13 and phosphorus-31 nuclear magnetic resonance. J. Am. Chem. Soc. 1975, 97, 2946–2960. 10.1021/ja00844a003. [DOI] [Google Scholar]
- Müller T.; Margraf D.; Syha Y. σ-Delocalization versus π-Resonance in α-Aril-Substituted Vinyl Cations. J. Am. Chem. Soc. 2005, 127, 10852–10860. 10.1021/ja0516864. [DOI] [PubMed] [Google Scholar]
- Klaer A.; Müller T. Hyperconjugation in β,β′-silyl substituted vinyl cations – indication from IR spectroscopy. J. Phys. Org. Chem. 2010, 23, 1043–1048. 10.1002/poc.1755. [DOI] [Google Scholar]
- Siehl H.-U.NMR Spectroscopic Characterization. In Dicoordinated Carbocations Rappoport Z.; Stang P., Eds.; Wiley: New York, 1997; pp 189–236. [Google Scholar]
- Siehl H.-U.Vinyl cations. In Stable Carbocation Chemistry Prakash G. K. S.; Schleyer P. v. R., Eds.; Wiley: New York, 1997; Chapter 5, pp 165–196. [Google Scholar]
- Stoyanov E. S.; Bagryanskaya I.Yu.; Stoyanova I. V. Unsaturated vinyl-type carbocation [(CH3)2C=CH]+ in its carborane salts. ACS Omega 2021, 6, 15834–15843. 10.1021/acsomega.1c01297. [DOI] [PMC free article] [PubMed] [Google Scholar]
- Stoyanov E. S.; Bagryanskaya I.Yu.; Stoyanova I. V. Isomers of the allyl carbocation C3H5+ in solid salts: Infrared spectra and structures. ACS Omega 2021, 6, 23691–23699. 10.1021/acsomega.1c01316. [DOI] [PMC free article] [PubMed] [Google Scholar]
- Traeger J. C. A photoionization study of [C4H7+] ions in the gas phase. Org. Mass Spectrom. 1989, 24, 559–564. 10.1002/oms.1210240808. [DOI] [Google Scholar]
- Stoyanov E. S.; Nizovtsev A. S. Stabilization of carbocations CH3+, C2H5+, i-C3H7+, tert-Bu+, and cyclo-pentyl+ in solid phases: experimental data versus calculations. Phys. Chem. Chem. Phys. 2017, 19, 7270–7279. 10.1039/C6CP06839A. [DOI] [PubMed] [Google Scholar]
- Reed C. A. Carborane acids. New “strong yet gentle” acids for organic and inorganic chemistry. Chem. Commun. 2005, 1669–1677. 10.1039/B415425H. [DOI] [PubMed] [Google Scholar]
- Stoyanov E. S.; Stoyanova I. V.; Tham F. S.; Reed C. A. Dialkyl Chloronium Ions. J. Am. Chem. Soc., 2010, 132, 4062–4063. 10.1021/ja100297b. [DOI] [PubMed] [Google Scholar]
- Stoyanov E. S. Chemical Properties of Dialkyl Halonium Ions (R2Hal+) and Their Neutral Analogues, Methyl Carboranes, CH3–(CHB11Hal11), Where Hal = F, Cl. J. Phys. Chem. A 2017, 121, 2918–2923. 10.1021/acs.jpca.7b01203. [DOI] [PubMed] [Google Scholar]
- Sverdlov L. M.; Kovner M. A.; Krainov E. P.. Vibrational Spectra of Polyatomic Molecules; Nauka: Moscow, 1970. [Google Scholar]
- Stoyanov E. S. Gabriel dos Passos Gomes. tert-Butyl Carbocation in Condensed Phases: Stabilization via Hyperconjugation, Polarization, and Hydrogen Bonding. J. Phys. Chem. A 2015, 119, 8619–8629. 10.1021/acs.jpca.5b04657. [DOI] [PubMed] [Google Scholar]
- Rowland R. S.; Taylor R. Intermolecular nonbonded contact distances in organic crystal structures: Comparison with distances expected from van der Waals radii. J. Phys. Chem. A 1996, 100, 7384–7391. 10.1021/jp953141+. [DOI] [Google Scholar]
- Durig J. R.; Compton D. A. C. Spectroscopic and Thermodynamic Study of the Conformational Properties and Torsional Potential Functions of 1-Butene. J. Phys. Chem. B 1980, 84, 773–781. 10.1021/j100444a015. [DOI] [Google Scholar]
- Stoyanov E. S.; Malykhin E. S. Carbon monoxide protonation in condensed phases and bonding to surface superacidic Brønsted centers. Phys. Chem. Chem. Phys. 2016, 18, 4871–4880. 10.1039/C5CP07441J. [DOI] [PubMed] [Google Scholar]
- Juhasz M.; Hoffmann S.; Stoyanov E. S.; Kim K.; Reed C. A. The strongest isolable acid. Angew. Chem., Int. Ed. 2004, 43, 5352–5355. 10.1002/anie.200460005. [DOI] [PubMed] [Google Scholar]
- Nava M.; Stoyanova I. V.; Cummings S.; Stoyanov E. S.; Reed C. A. The strongest Brønsted acid: protonation of alkanes by H(CHB(11)F(11)) at room temperature. Angew. Chem., Int. Ed. 2014, 53, 1131–1134. 10.1002/anie.201308586. [DOI] [PMC free article] [PubMed] [Google Scholar]
- Sheldrick G. M. SHELXT - Integrated space-group and crystal-structure determination. Acta Cryst. 2015, C71, 3–8. 10.1107/S2053273314026370. [DOI] [PMC free article] [PubMed] [Google Scholar]
- SADABS, v. 2008-1, Bruker AXS: Madison, WI, 2008. [Google Scholar]
- a Spek A. L.; Platon A.. Multipurpose Crystallographic Tool (Version 10M); Utrecht University: Utrecht, The Netherlands, 2003. [Google Scholar]; b Spek A. L. J. Appl. Crystallography. 2003, 36, 7–13. 10.1107/S0021889802022112. [DOI] [Google Scholar]
- Macrae C. F.; Edgington P. R.; McCabe P.; Pidcock E.; Shields G. P.; Taylor R.; Towler M.; van de Stree J. Mercury: Visualization and Analysis of Crystal Structures. J. Appl. Crystallogr. 2006, 39, 453–457. 10.1107/S002188980600731X. [DOI] [Google Scholar]
Associated Data
This section collects any data citations, data availability statements, or supplementary materials included in this article.


