

Abstract
Metabolic Syndrome (MetS) is a highly heritable disease and a major public health burden worldwide. MetS diagnosis criteria is met by the simultaneous presence of any three of the following: high triglycerides, low HDL/high LDL cholesterol, insulin resistance, hypertension, and central obesity. These diseases act synergistically in people suffering from MetS, and dramatically increase risk of morbidity and mortality due to stroke and cardiovascular disease, as well as certain cancers. Each of these component features is itself a complex disease, as is MetS.
As a genetically complex disease, genetic risk factors for MetS are numerous, but not very powerful individually, often requiring specific environmental stressors for the disease to manifest. When taken together, all sequence variants that contribute to MetS disease risk explain only a fraction of the heritable variance, suggesting additional, novel loci have yet to be discovered. In this review, we will give a brief overview on the genetic concepts needed to interpret GWAS and QTL data, summarize the state of the field of MetS physiological genomics, and to introduce tools and resources that can be used by the physiologist to integrate genomics into their own research on MetS and any of its component features. There is a wealth of phenotypic and molecular data in animal models and humans that can be leveraged as outlined in this review. Integrating these multi-omic QTL data for complex diseases such as MetS provides a means to unravel the pathways and mechanisms leading to complex disease and promise for novel treatments.
Introduction
Complex disease refers to any disease for which there is no one single cause. Mendelian, or monogenic diseases have relatively predictable genetic underpinnings—a single mutation directly causes disease. In complex disease, however, single mutations are insufficient to induce a disease state. Instead, complex (also known as multifactorial) diseases are influenced by combinations of genetic and environmental risk factors, only resulting in disease if enough risk factors are present. Metabolic Syndrome (MetS) is a complex disease and a major public health burden, with most recent estimates placing MetS incidence at approximately 33% of US adults (271). It is characterized by dyslipidemia (high triglycerides, low high-density lipoprotein cholesterol), insulin resistance, hypertension, and central obesity (41, 89, 237, 329, 352). Collectively, the individual features of MetS increase cardiovascular disease risk (i.e. stroke, myocardial infarction, coronary artery disease), and the presence of any three of these criteria is sufficient for a diagnosis of MetS (41, 89, 237, 329, 352).
Several monogenic forms of hypertension (255), obesity (135), dyslipidemia (305), and diabetes (354), or syndromes involving these conditions exist; however, these cases are vastly outnumbered by the volume of patients with complex forms of these disorders (73). Complex diseases such as essential hypertension, obesity, and type 2 diabetes, only result from the combined effects of common variants, rare genetic variants, genetic regulatory elements, and their interactions with external and internal environmental influences.
Each individual feature of MetS is a measurable, quantitative trait, with phenotypes existing in a continuum at the population level. These traits are the sum of the effects of environmental interactions and numerous genetic variants, with disease resulting when a certain threshold is met (125). Although most of the identified variants that contribute to MetS or other complex diseases are common, when compared to mutations associated with monogenic forms of disease, most individual loci for MetS have minimal effect sizes on their respective phenotype (Figure 1).
Figure 1: Common Diseases are Most Often Caused by Common Variants.

The “common disease, common variant” hypothesis is used to explain the prevalence of both disease and the causal genetic variants. Mendelian diseases are caused by rare or ultra-rare single variants. Alternatively, common diseases such as Metabolic Syndrome (or its component features) are typically caused by common variants that may be found at frequencies higher than 1% in the population. Common variants usually have minimal effects on a phenotype and are insufficient to cause disease without other genetic or environmental interactions. Rare variants that cause rare diseases have high effects and are usually sufficient to cause disease alone. Worth mentioning is that the same common disease, such as obesity, can result from numerous mutations, both rare and common. Though most obese individuals have numerous individual risk alleles, where each may only contribute a few grams of excess body weight, rarer variants may also cause the same diseases. For example, individuals with complete loss of the leptin receptor always exhibit profound obesity, but these alleles are rare, as is this form of obesity. Variants in the MC4R and FTO loci exhibit modest effects on body weight and can be found at frequencies higher than 1% in most populations.
As an example, there are now over 1000 validated hypertension risk loci, however, their combined effect only explains ~5.7% of the phenotypic variance (32, 84). Since no human is likely to have inherited every pathogenic allele at every hypertension risk locus, clearly there are numerous unknown genetic and environmental factors that are yet to be identified. Even alleles that only modestly increase risk of disease are worthy of study because if enough of these minimal risk loci and environmental stressors are present, that disease will manifest. The purpose of this review is threefold: (1) to educate physiologists with minimal genetic background on the basic genetics concepts needed to interpret QTL and GWAS findings, (2) to illustrate the importance of individual loci in the context of complex diseases such as MetS, and (3) to provide suggestions for the physiologist on how to integrate genomics into their own research to interrogate the functions of novel genes in the context of MetS.
What is a quantitative trait locus (QTL)?
If a phenotype has a genetic component, the region containing that genetic component can be mapped to a genome location, or locus, on the genome. A quantitative trait locus (QTL) is a defined region of the genome that contributes to a quantitative phenotype such as height, eye color, waist-hip ratio, etc. Depending on the method of discover, the size, or resolution of a quantitative trait locus can vary dramatically, as the term “locus” or “loci” refers to a specific position in a genome but is less specific about the size of the element. In genetics, the term “locus” may be used to specify many different types of chromosomal elements, such as individual SNPs, single genes, and even entire arms of chromosomes.
In addition to human population genetic studies, there are a variety of model organisms used to identify QTLs for metabolic syndrome and its defining phenotypes. Model systems are critical for progress in the study of complex diseases, where control of environmental modifiers and confounders is nearly impossible with human subjects. Certain quantitative traits, such as body weight and adiposity, have intrinsic commercial value in livestock, (107) thus these features have been studied and mapped in swine, chicken, and cow. Although rodent models do not have the same inherent commercial value that livestock do, they are extensively used as a proxy for human MetS, particularly when human subjects research is not feasible, either due to cost or accessibility of disease-relevant conditions and tissues. Sufficient conservation of rodent and human genomes, as well as analogous physiological processes, makes them a necessary surrogate for study of human complex diseases such as MetS.
Genetics and Genome-Wide Association Studies
By far the most common method employed to identify new disease-causing loci for complex traits in human populations has been the genome-wide association study, or GWAS (196). A GWAS experiment is designed to identify novel associations between genotype and phenotype and is a powerful tool for mapping the genetic basis of complex heritable traits to the genome in diverse, outbred populations such as humans. Heritability is the proportion of a phenotype that is explained by genetic, or heritable factors. Because of genetic variation between individuals, heritable phenotypes exist on a continuum, especially for a complex disease like MetS. Due to variability at the genotype and phenotype levels, traits that are genetically controlled will have some association with DNA variation controlling it. Associations are identified when specific variants are found at significantly different frequencies in those with the trait, compared to a control population.
Alleles and Genetic Variants
The average sequenced human has between 4 and 5 million variants, comprising about 0.1% of the roughly 6 billion bases of the reference human diploid genome (79, 102). Since most of the variants in the human genome are single nucleotide variants (SNVs) or small insertions and deletions. A single nucleotide polymorphism (SNP) is a single nucleotide variant that is present in ≥1% of a population; these are the type of genetic marker that are typically surveyed in GWAS (102). However, the genome also contains polymorphic short tandem repeats (STRs), copy number variants (CNVs), large deletions, and long and short interspersed retrotransposable elements (LINEs and SINEs) (102). An allele is a specific form of a variant at a locus, or a collection of several linked variants that are segregating in a population. For each SNP, there is one DNA base that appears most commonly in each population, i.e. the major allele, while the other variant(s) are considered the minor allele or alleles (307).
It is important to understand that SNPs are not mutations—a DNA mutation is a rare deviation from the normal sequence, whereas SNPs are common, comprising about 98% of all variants in a typical genome (102). Common DNA base substitutions, i.e. SNPs, must be present at a rate of 1% or greater in a population to be considered polymorphic, while for rare (<1%) or ultra-rare (<0.1%) substitutions, the term “single nucleotide variant” or SNV is used (323). Understanding allele frequency is vital in designing a GWAS or interpreting the results of one.
The basics of GWAS
GWAS experiments depend upon a concept called ‘linkage disequilibrium’ or LD, in that each individual DNA base does not exist in spatial or evolutionary isolation (323). In species that reproduce sexually, meiotic recombination events, or crossovers, shuffle genomic sequence between offspring (183). Two hypothetical loci will be divided by a recombination at rates that are proportional to the spatial distance between them. Variants on different chromosomes are completely unlinked, as different chromosomes segregate independently during meiosis (183). On the other hand, SNPs on the same chromosome are correlated when the sequence between them has not been rearranged by historical recombination events (245). For example, two bases that are separated by one thousand base pairs are less likely to be divided by a crossover than two which are separated by ten thousand base pairs. In a finite population the probability of some loci becoming separated during meiosis is vanishingly low because the two are so close together. Thus, bases which are located close together on the same chromosome are typically inherited together, or in other words, recombination rate between them is low.
When multiple variants are close together, they are inherited in groups rather than at random, thus the loci are in linkage disequilibrium. This allows the experimenter to collect genotype information at loci that are ‘linked’ to the DNA that has been genotyped without additional tests. Determinations of which loci to genotype are made based on whole genome reference panels containing haplotype information (307). Haplotypes are stretches of sequences that are spatially linked on the same DNA strand and can be fully and uniquely identified with limited genotyping due to the linkage disequilibrium of the sequence therein (343). In the case of rare haplotypes that are not included in these panels, reference sequence is of limited use. In this instance, full sequencing is required. Sequencing whole genomes is informative for rare variants, but the ability to detect associations between phenotype and genotype is lessened. Instead, it is often better to genotype at “tag SNPs” that define the haplotype and infer the rest of the sequence (343). This process, called imputation, can add tens of thousands of genotypes to a genome, even though they were not directly tested, per se (183).
To identify genotype-phenotype associations, each genotyped SNP is tested for association with the categorical disease state or quantitative phenotype of interest. For categorical variables such as “hypertension” or “obesity” (Figure 2), Chi-Square tests are used to determine if a SNP is more often found in one of the categories than would be expected by chance. For quantitative traits, such as “systolic blood pressure” or “waist circumference”, association is determined by linear regression, where Type I error (P values) <0.05 are considered nominal associations. However, because so many independent tests, i.e. genotypes, are done, it is important to correct for multiple testing. A convention in the field is to apply Bonferroni’s correction (183); for example, a GWAS with 1 million SNPs would require P values less than 5 x 10⁻⁸, or equivalent to 0.05/1000000 (183). An additional measure to control the Type I error is to apply a cutoff on the False Discovery Rate (FDR), which represents the proportion of false positives amid the large dataset of independent hypotheses (28). These results are usually taken as “genome-wide significance”, although some do report marginal associations between 5 x 10⁻⁸ and 0.05 as “suggestive” if FDR remains below 5% (180, 227).
Figure 2: Statistical Associations between Genotypes and Phenotypes on a Genome-Wide Scale.

Genetic tests of association begin with a population comprised of a selection of cases with a trait, such as obesity, and a selection of controls that are ideally identical to the cases, apart from the trait that is being tested. In this example of outbred rats, a group of obese cases and lean controls are genotyped at some position for the alleles A and a, where the allele frequencies of each are shown. While allele a is present in both subgroups, it is significantly enriched among the obese cases. Compiling this individual test and other like it across the genome produces a genome-wide plot, where each point represents an individual test. The p-values of each association test are −log10 transformed and plotted with respect to their genomic position, with individual chromosome positions shown here in alternating colors. Most GWAS datasets contain tests of association for hundreds of thousands to millions of independent SNPs, and at that density of points, the plots begin to resemble city skylines and are called Manhattan plots. When multiple independent tests are conducted, it is important to adjust the threshold for p-values significance to lower the chances of detecting a false association. By convention, a Bonferroni correction is applied. If you test 100 independent loci, the threshold for genome-wide significance is equal to 0.05/100, or 5x10^−4, to account for the 100 independent tests. The negative log transformation of this threshold puts the cutoff for significance roughly at 3.3, indicated with a solid red line. The hypothetical example shown here is the only SNP that exceeds the threshold, so allele a is significantly associated with obesity, although that does not necessarily mean it is causing obesity.
The P value generated from hundreds of thousands of SNP association tests is log transformed and plotted as a function of SNP’s genomic location on a Manhattan plot, so named due to its resemblance to a big city skyline. The y axis is labeled −log10 (P value), which is a log-transformation of the P value of that SNP’s summary statistics (103). These plots will often mark the threshold for significance with a horizontal line. Most SNPs will be far below this value, with a few tall “peaks”, containing at least one SNP (plus others that are in LD) that has a higher association score than others a little further away. The genomic locations of these peaks mark loci of interest for the trait or disease being studied (Figure 2). These peaks are often identified as the SNP or locus with the strongest association (lowest P value) and may be referred to as the “lead”, “index”, “sentinel”, or “top” variant (34).
Methods of data collection
For a GWAS, there are several ways to collect genetic data, and each has an application for which it is currently best-suited. A classical GWAS utilize SNP arrays to genotype hundreds of thousands to millions of variants, and impute, or fill in others that were not assayed directly to obtain more coverage of the whole genome (307). This approach is employed because the cost of collecting, analyzing, and storing whole genome sequences for the large populations needed to obtain meaningful results remains cost-prohibitive for many (343). Whole genome sequences contain all DNA that is sequenced directly, without imputation (307). Both approaches can be used to discover genotype-trait associations, and aside from the obvious differences in the scope and scale of the data collected, the choice comes down to logistical and mathematical principles, namely sample size, minor allele frequency (MAF), and effect size of the hypothetical causative variant. In the absence of preliminary data, SNP-based GWAS are cheaper to conduct and are statistically more likely to detect associations (307); however, their disadvantage is they are not able to assess the rare variants in a population that are likely to contribute significantly to complex disease. As human population studies are often extremely large, collaborative efforts, and as sequencing costs have substantially decreased, sequencing the whole genome or only the protein-coding exome is becoming a feasible option to identify genotype-phenotype associations (22).
When conducting a GWAS based in an animal model, however, high-coverage, whole genome sequencing (WGS) for a large cohort is a formidable expense for individual labs or small research groups (22). There are two intermediate approaches between SNP arrays and deep WGS, which compromise on either sequencing depth or breadth of coverage but keep costs low (22). Coverage “depth” refers to the average number of instances that any locus would be sequenced and is used as a measure of the confidence of a genotype call (170). Usually, a good depth is 30X, however, >20X depth is standard in most, non-clinical applications (170). Low coverage WGS collects the entire genome sequence at an average depth of 2X or less, yielding a breadth of genotype information at the expense of certainty, although this may be improved upon with subsequent imputation (347). Another approach is genotype-by-sequencing (GBS), a strategy where DNA is fragmented with restriction enzymes that target enzyme-specific recognition sites, then the cut fragments are ligated to unique “barcode” identifying sequences and sequenced as usual (347). This yields high-depth, high-confidence information on a more limited range of the genome, which may be expanded with additional imputation (22). For researchers working with mice, there are a series of commercially available Mouse Universal Genotyping Arrays (MUGA) originally developed to genotype the Diversity Outbred (DO) mouse, and offers a range of informative SNP markers, the largest being the GigaMUGA with about 143,000 SNPs (220). No such platform exists for other commonly used model organisms, so either GBS or low coverage WGS is a good alternative when genotyping outbred laboratory animals, such as rats, or outbred mice that are not composed of the mouse strains present in the DO (347).
Genetic confounders and population stratification in human and animal models
Ideally, a GWAS would collect samples from a large group of cases—those with the disease or phenotype of interest—and an equally large, matched set of controls, where no participants are closely related. For a common disease or phenotype, such as hypertension or waist-to-hip ratio, sample collection and subject recruitment should be relatively straightforward, but considerations of population structure are key. Population genetics will generally assume random mating when populations are sufficiently large, however, this is not always the case in practice (229, 360). Assortative, or non-random mating is largely affected by ancestry, and because allele frequencies can vary between different ancestral groups, in a genetic study it is just as important to select controls that are matched for ancestry as well as other common clinical parameters (124, 360). If cases and controls are not carefully matched by ancestry, there is a risk of encountering spurious associations due to population stratification (124). Population stratification occurs when the study groups have differences in their underlying substructure, attributable to factors such as ancestry, socioeconomic status, educational attainment, etc (245). Another aspect to consider is admixture, the recent combination of two or more human populations that had previously been reproductively separated by at least 1000 generations, such as the two-group combinations found in Black Americans, Uyghur Muslims, and others (198, 201). Admixture mapping for QTL or gene identification is favored over GWAS when the disease or trait shows obvious ethnic and heritable disparity in the parent populations of the admixed group (124, 198), such as blood pressure or T2D traits in ancestral groups of Latin Americans, an example of a recent three-way admixture between Europeans, indigenous Americans, and Africans (273, 291). The underlying assumption is that the risk allele will be present in the ancestral genome that experiences a higher disease burden (198). This approach requires fewer independent tests of unlinked SNP markers than a typical GWAS, provided that the SNPs are informative, i.e. allele frequencies are widely different between the ancestral populations (198).
While population stratification is an example of ancestral relatedness, another example of genetic confounding is cryptic relatedness, where study subjects share unknown close family relationships (313). Epidemiologic studies, such as the National Health and Nutrition Examination Surveys (NHANES) and the Framingham Heart Study, often survey communities or households without collection of sufficient pedigree data, and this has the potential to confound genetic associations, particularly if the participants were enrolled from an ethnically homogenous area (197). This is also a problem with most model organisms, as the population size in a closed breeding colony is fixed, thus some degree of relatedness among subjects is unavoidable and must be accounted for (313, 347). When family pedigrees in human or animal cohorts are available, a linear mixed model (or LMM) is used to adjust for known kinship, and there are many R packages that serve this purpose (347). When a disease or phenotype is rare in a population, it is more likely caused by minor alleles with a frequency less than 1% (73, 323). If a disease is sufficiently rare, it may not be possible to collect data from enough unrelated individuals because the causative mutation or mutations are identical-by-descent, or were inherited from a recent common ancestor (276). In these cases, it is better to employ linkage-based methods, which employ small pedigrees to identify genotype associations within families (124, 240). Historically, this was conducted using panels of several hundred STRs distributed evenly throughout the genome, although SNP arrays are now used, due to their abundance and lower cost (235). Usually, it is more practical to directly sequence the subjects, however, since sequencing is better able to detect very low frequency variants.
Sample size considerations and power: MAF and effect size
True predictions of sample size rely on two things: the genetic effect of the causative SNP and the allele frequency of the locus. Unfortunately, it is nearly impossible to have a priori knowledge of these without first sampling the population with a discovery cohort, then retesting a new population based on that preliminary data (131). Small discovery cohorts tend to overestimate the genetic effect of significant loci when the allele frequency is low, whereas larger discovery cohorts generate estimates of variance that are closer to the actual value (368). This “Winner’s Curse” phenomenon results in replication cohorts that are underpowered, and is a major reason why most significant GWAS loci are never replicated (131).
Statistical power, or the ability to correctly reject the null hypothesis, refers to the probability of detecting a true QTL (332). The required sample size to achieve sufficient power for a GWAS or QTL study is dependent on the number of SNPs tested, as well as the minor allele frequency (MAF). The SNPs selected for genotyping in a GWAS are usually manufactured in arrays of various sizes, and are specifically selected to be common in the population to be genotyped, i.e. have a MAF greater than 1% (323). Variants with a MAF <1% are considered rare variants (323), and those are more easily identified in whole genome or whole exome sequencing studies, where the genome coverage is more complete (323). For common polymorphisms, the number of samples required is inversely proportional to the frequency of the minor allele, and directly proportional to the number of independent tests, i.e. genotyped SNPs (323). Two hundred thousand to two million SNPs are measured in a typical GWAS, which increases both the coverage of the genome, as well as the likelihood that the causative variants will be near or in LD with the genotyped ones (323).
The final aspect that dictates sample size is the genetic effect of the causative SNP. Effect size is a quantitative measure of how much a SNP contributes to the phenotypic variation. In an additive genetic model, each risk allele and protective allele add and subtract genetic likelihood, respectively (248, 307). In general, SNPs with higher MAF have lower effect sizes (25); in other words, the more common the allele, the less likely it contributes very much to the disease or trait of interest (200). For common diseases such as hypertension and Type II diabetes, many loci contribute to risk in an additive manner, but their effect sizes are mostly very small— usually fractions of a standard deviation (323). Typically, SNPs with the highest effect size in the GWAS dataset will be rarer (25), requiring increased sample size to detect. On the other hand, common SNPs with small effects also need increased numbers to find smaller signals that exceed random background signals. Generally when performing a power calculation to estimate needed sample size, researchers typically follow “biologically meaningful” conventions, such as effect sizes that explain 5% of the variance (332).
Limitations to GWAS and WGS: Lack of reproducibility
The most obvious problem with GWAS approaches is that large haplotype blocks can easily contain hundreds or thousands of genes, and the peak SNP will almost certainly not be the causal variant of the complex disease. In fact, the peak SNP may not be within any gene, much less the causal gene, and may in fact lie in the intergenic space in the genome that is thought to serve a regulatory function (85). This is partly due to the low genome-wide density of genotyped variants (96). Increasing the number of genotyped variants may help shorten the intervals by better defining the bounds of the haplotype, but this comes with increased costs and loss of statistical power as increased tests further reduce the necessary threshold for genome-wide significance. Even relatively small datasets generate scores of potential candidate loci, with large GWAS, WGS, or WES studies, suggestive variants may number in the hundreds. At a certain point, demonstrations of functional relevance in vitro or in model organisms is more informative than finding yet another QTL or SNP association.
Another potential confounder of GWAS is that allele and haplotype frequencies differ between populations, sometimes dramatically (183). When SNPs in specific haplotypes are genotyped, the rest of the sequence in that haplotype can be inferred with some confidence provided the MAF is not too low. Most large-scale human genetics research has historically been based on Caucasian populations (353), thus these populations are thoroughly genotyped and their major haplotypes are well-defined (253, 287). If the SNPs on the genotyping chip are suitable for a European population, they may not be appropriate to genotype in another population (183). In addition to considerations of SNP selection and data collection, a variant that may be causal in one population may show no association in another or be uncommon or even absent entirely (344).
Numerous MetS-related traits display substantial variation within and between populations, and disease burden often differs across different ancestral populations in humans (71, 171, 292) and other species (15). Thus, findings in single populations are not necessarily translatable to any other population, although findings are more convincing when this is found to be the case. While these disparities in prevalence, mortality and morbidity can be partly attributed to socioeconomic and environmental factors, these traits also have a heritable component (361). The few human GWAS that do study people of color usually include fewer subjects (200), especially those that have been disproportionately underrepresented in these studies, including Black people, worldwide indigenous populations, Latin Americans, Arabs, South Asians, and Africans (307). The only solutions to these problems are gathering more information about the genome in general and studying multi-ethnic cohorts wherever possible (344). The United States and other nations have recently made a concerted effort to increase knowledge of human genome diversity (353) using historically underrepresented demographics and active recruitment of these populations (6). Alternatively, animal models (discussed below) that have been bred for sufficient diversity confer the ability to sample a population that captures the breadth of the species’ genetic diversity, a goal human genetics studies are actively striving for, but have yet to attain (236).
Translating GWAS results to the clinic
While genome-wide mapping approaches are necessary hypothesis-generating experiments, they are not without some important limitations. GWAS are agnostic and only analyze what is directly surveyed. There are no a priori assumptions or hypotheses guiding interpretation of results. Consequently, loci associated with phenotypes or diseases that are related do not necessarily overlap. For instance, some SNPs in FTO, colloquially known as “the obesity gene” are associated with BMI phenotypes, but not type II diabetes risk, even though the traits are often concomitant (200). Because many QTL that are directly or indirectly related to MetS are non-overlapping, it can be difficult to interpret results and communicate them to at-risk patients. From a clinical standpoint, genotype alone is not currently able to predict complex phenotypes in a patient population. Despite hundreds of thousands of variants implicated in various GWAS for MetS traits, most of these variants have small effect sizes and understanding of the heritability of common traits and disease is still incomplete. Because of this, genotype information about single significant SNPs is of limited clinical relevance for healthcare providers seeking to treat disease of predict future disease in their patients (136, 248). In addition, GWAS have routinely shown that the same phenotype loci may be associated with multiple diseases, so one SNP result is insufficient as a diagnostic test (323). As more and more of these individual markers are discovered, however, multiple signals contributing positively and negatively to the genetic burden in the individual can be tallied and combined to generate a polygenic risk score (PRS) (136). PRSs combine the modest effects of suggestive SNPs that do not individually meet the more stringent thresholds for genome-wide significance (200). Each SNP that is associated with a trait has an odds ratio, or the increased or decreased likelihood of that trait appearing due to that SNP’s contribution alone. Common variants usually explain very little of the trait variance in a population, while rare variants (that may not be commonly genotyped) typically account for the majority of the heritability (189). By combining the ratios of numerous factors, the PRS begins to explain more significant proportions of heritability in ways that start to be clinically meaningful (323). Direct-to-consumer genetic testing services, such as 23andMe now offer T2D risk scores, and the clinical utility of these metrics can only improve with greater knowledge of risk alleles in disparate populations, and replication and validation of novel loci (58, 175).
The case of the “missing heritability”
A major criticism of the GWAS has been the concept of “missing heritability”, where the combined effect sizes of all identified variants fail to explain all of the trait’s heritable variation (189). After the completion of the first human reference genome sequence, there was a lot of optimism that in a few short years, a few GWAS would be performed, and this simple test would be able to fully explain heritable traits, complex disease, and variance in a population (248). This was ambitious—virtually every trait that has a heritability estimate from a family-based study was likely an overestimate due to the confounding variables of shared environments in families (351). Likely the “missing heritability” problem was due to some combination initial overestimation of heritability as well as additional unidentified rare single nucleotide and copy number variants with large effect sizes, and numerous known common variants that do not consistently meet genome-wide significance thresholds (189).
Another possible factor contributing to “missing heritability” is that most single GWAS are insufficiently powered to detect epistasis, or gene interactions, thus many independent GWAS datasets are later combined in post-hoc meta-analyses (187). This has been recently employed to detect novel MetS-related loci, including obesity (74), and atrial fibrillation (182, 339). Occasionally, these studies discover novel significant interactions between SNPs that independently failed to reach statistical significance (74). In addition to gene-gene or SNP-SNP interactions, there can also be relevant environmental interactions with genes or SNPs, such as those accounting for diet (228) and smoking behaviors (142, 300). These studies have met with variable success—much is still unknown about most of the genome, the genes within and how they interact with each other in time and space (88).
It is for the reasons mentioned above that the number of SNPs with significant associations is still increasing exponentially after 15 years (26). While there are those who argue that GWAS’ may yet yield more important associations (307), there are others who argue that if everything is significant, nothing is (136). Some who believe there is more to discover argue for the ‘omnigenic model’, in which genetic regulation of the entire genome is sufficiently interconnected, such that sequence changes in genes that are seemingly unrelated to the trait will nevertheless impact that trait (26, 307). Whatever the case may be, this is a concern that might be addressed with increased demand for functional validation of GWAS results in animal models.
Human GWAS data resources
Human genomic data can be easily obtained through several sources (Table 1). The data generated in all published GWAS conducted to date can be found in the GWAS catalog, and have previously been used to identify novel associations for MetS traits (146). The National Center for Biotechnology Information (NCBI) has developed a database (dbGaP) of genotypes and phenotypes, which contains all published genotype/phenotype correlations, including GWAS results as well as whole-genome and whole-exome sequence data (346). Medical genetics resources that may be of particular interest to clinicians are: the Online Mendelian Inheritance in Man (OMIM), Electronic Medical Record and Genomics (eMERGE) databases (9, 77, 340) and the Polygenic Risk Scores (PRS) Catalog.The Polygenic Risk Scores (PGS) catalog has curated data from numerous cardiovascular and metabolic traits relevant to MetS, and several studies have been conducted to demonstrate the utility of PRS predictions and lifetime risk of hypertension (320), other MetS-related phenotypes (80) and clinical outcomes (202).
Table 1:
Human GWAS and QTL Datasets
| GWAS Catalog | Contains all unique SNP-trait associations (p<1x10⁻⁵) that have been reported in the literature (196, 338) | https://www.ebi.ac.uk/gwas |
| Database of Genotypes and Phenotypes (dbGaP) | Compilation of individual- and summary-level statistics of genotype and phenotype data from large genomic studies, including but not limited to GWAS (346) | https://dbgap.ncbi.nlm.nih.gov/ |
| Online Mendelian Inheritance in Man (OMIM) | Medical genetics resource containing gene and phenotype information, searchable by gene OR by clinical features, includes inheritance pattern (if known) (9) | https://www.omim.org/ |
| Polygenic Risk Score (PRS) Catalog | Online platform for researchers to deposit PRS information, with standardized reporting conventions and quality control; closely linked to GWAS Catalog (328) | https://www.pgscatalog.org/ |
| QTLbase | New resource collecting QTL summary statistics from several large multi-omic studies relevant to MetS (365) | http://mulinlab.org/qtlbase |
| Trans-Omics for Precision Medicine (TOPMED) | Over 50,000 whole human genomes of patients with well-defined phenotypes (including obesity and hypertension) and available clinical outcomes; data available in dbGaP (226, 306) | https://dbgap.ncbi.nlm.nih.gov/ https://biodatacatalyst.nhlbi.nih.gov/ |
| Electronic Medical Record and Genomics (eMERGE) Network | Integrates genetic data with personal electronic health records for clinicians to improve and personalize patient care (77, 340) | https://emerge-network.org/ |
Resources for Published Human GWAS and QTL
TOPMED and QTLbase are two resources of particular interest to those studying MetS or a related feature. TOPMED is an NHBLI resource of WGS and other “omics” data specifically compiled and designed to understand risk factors for heart, lung, blood, and sleep disorders. These data are available through dbGaP as well as NHLBI’s BioData Catalyst project (226), and now contains over 130,000 deeply phenotyped, ancestrally diverse samples relevant to MetS and heart disease (306). QTLbase is a comprehensive resource that contains QTL summary statistics for a variety of human molecular traits and is searchable by gene or trait of interest. Their comprehensive website contains well-designed plots of any trait- or variant-associated molecular gene expression cis- and trans-QTL (365)
Metabolic Syndrome QTLs—Human Datasets
Human GWAS have identified numerous loci involved in MetS or related complex traits, and associated loci for plasma lipids (180), insulin resistance (166), blood pressure (32), and obesity (136, 144) now number in the thousands. The datasets used to map these loci are ever increasing in scope, scale, and diversity. Biobanks, or repositories of biological and genetic data from large groups of people, are the future of genetic mapping studies, as their scale and scope can dwarf even the largest GWAS consortia, and are valuable resources for human gene-MetS trait associations (Table 2).
Table 2:
Population-based Metabolic Syndrome Studies in Humans
| All of Us | 1,000,000 sample biobank of US adults completed by 2024; combines health records, questionnaires, emphasis on recruitment of historically underrepresented populations (6) | https://allofus.nih.gov/ |
| China Kadoorie Biobank | 500,000 sample biobank of Chinese adults, contains mostly lifestyle and clinical data (42), minimal genotyping so far (176) | https://www.ckbiobank.org/site/ |
| UK Biobank | Source of 500,000 predominantly white adult biological samples, health questionnaires, genotypes for 850,000 SNPs (7) | https://www.ukbiobank.ac.uk/ |
| VA Million Veteran Program (MVP) | Large, multi-ethnic cohort of mostly male, former US veterans; significant burden of cardiometabolic disease (101) | https://www.mvp.va.gov/ |
| TwinsUK-Multiple Tissue Human Expression Resource (MuTHER) | Twin registry in the UK, contains roughly 14,000 twins, group is mostly female and middle-aged; formed to study genetic basis of complex disease; female only subset of the twins underwent subcutaneous fat biopsies for gene expression mapping (MuTHER) (214) |
https://www.twinsuk.ac.uk/
https://www.muther.ac.uk/ |
| Population Architecture using Genomics and Epidemiology (PAGE) | Collaboration between consortia to address questions of genome generalizability to non-whites; Trans-ethnic cohort of American minorities, phenotyped for many complex disease traits, fully genotyped; all study data accessible through dbGaP (20, 204) | https://www.pagestudy.org/ |
| Metabolic Syndrome in Men (METSIM) Study | 10,000 Finnish men densely genotyped and comprehensively phenotyped for MetS-related traits and subtraits. Useful for identification of rare variants (165) | dbGaP Study Accession: phs000743.v1.p1 |
Established GWAS cohorts in humans with MetS phenotype and genotype data
The All of Us (6) and Kadoorie Biobanks (42), based in the United States and China respectively, contain comprehensive lifestyle and clinical data on hundreds of thousands of people, including calculations of genetic risk scores for T2D based on about 50 known loci, and additional genotype collection is ongoing (42, 176). Importantly, these studies survey ethnic groups that are historically underrepresented in the genetics field, and once completed will have the potential to be useful for genetic mapping of hundreds of traits, including those related to MetS.
The UK Biobank (UKBB) contains samples from over 500,000 middle aged men and women from the United Kingdom, and was specifically established to decipher the genetic and environmental underpinnings of complex disease (7). As such, it is one of the larger human populations with extensive, genome-wide, array-based genotypes available. Subjects participated in lifestyle, family and medical history questionnaires, donated samples of blood, urine and saliva, and were measured for an array of physical characteristics (7). Many GWAS studies have successfully mined UKBB data for a variety of MetS-related traits, such as blood pressure, body composition (126, 144, 259), Type 2 diabetes (T2D) (119), and circulating lipids (264). Although the UKBB was not specifically established to address MetS-related traits, the data have been used to map loci associated with MetS as a binary trait (i.e. MetS diagnosis present vs absent) in a subset of the UKBB with self-reported British and European ancestry (184). Interestingly, this GWAS uncovered 93 MetS loci, almost all of which have been previously associated with at least one MetS component, although a handful were completely novel (184). Although this group is predominantly white, the scale of the study as well as the extent of information available makes the UK Biobank an important resource for future studies (31).
The Million Veteran Program (MVP) was established as a large-scale, longitudinal study of former United States Armed Forces veterans (101). This study is of particular importance because the number of enrolled minorities is somewhat proportionate to that of the US population, is one of the larger multi-ethnic cohorts, and currently has 825,000 participants, of which over 90% are male (101). This group also has a significant burden of cardiometabolic disease—roughly two-thirds are hypertensive, over half have hyperlipidemia, and one quarter are diabetic (101). This dataset contains electronic medical records, blood analytes, and whole genome SNP genotyping, which have been used to map traits related to MetS phenotypes, such as plasma lipids (154, 185, 299); blood pressure (105), peripheral artery disease (155), and T2D (327).
Studies of twins have always been important for genetics research. Before genome mapping was possible, heritability of traits was estimated in both monozygotic and dizygotic twins. Identical, or monozygotic (MZ) twins share 100% of their DNA and are always the same sex, whereas fraternal, or dizygotic (DZ) twins do not have additional genetic similarity beyond their relationship as full siblings (115). If a trait was equally likely to be shared by MZ and DZ twins, then the influence of their shared environment is more important for that trait (115). Traits that define the Metabolic Syndrome are somewhat more likely to be shared by MZ twins than DZ twins, which indicates that genetic factors have a greater influence on these traits (115). TwinsUK is a twin registry in the United Kingdom which contains around 14,000 predominantly middle-aged female MZ and DZ twins of Caucasian ancestry (214). This cohort has been used for phenotyping and estimates of heritability for complex traits such as blood pressure (40), T2D (208), and blood lipids (44). Recently, other “-omics” techniques on subsets of this cohort have generated data on transcriptomes (106), metabolomes (225) and microbiome composition assessment (207). This group has not been comprehensively SNP genotyped but is ideal for heritability estimates or analysis of epigenetics.
Most genome-wide association studies to date have focused on white individuals with European ancestry (20). The Population Architecture Using Genomics and Epidemiology (PAGE) consortium was designed to determine if previously identified associations were generalizable to other populations and to identify genetic background modifiers of complex disease (204). PAGE is essentially a meta-analysis in terms of its design, combining genotypes and phenotypes from multiple ancestrally diverse cohorts to investigate SNPs associated with obesity, lipids, cardiovascular disease and T2D, among others (204). African American populations are particularly valuable for genetic mapping studies as a recently admixed population (308). Their genomes tend to have more variation at each locus, which may increase MAF and statistical mapping power (308). Also, smaller LD blocks facilitate greater resolution in fine-mapping and leads to quicker identification of novel, causative variants (127). PAGE data has been leveraged to identify novel loci associated with BMI (90, 109), central adiposity (357), dysregulated glucose metabolism (19), and blood lipids (127). Given the disproportionate burden of MetS and its associated traits in African American, Hispanic/Latino and American indigenous populations, the PAGE findings are invaluable to the public health field (19, 90).
The Metabolic Syndrome in Men (METSIM) study was a population based GWAS of more than 10,000 Finnish men, which collected comprehensive metabolic and cardiovascular phenotyping, and is one of the few studies that included MetS diagnosis as a binary trait (165). Due to a recent bottleneck event, the Finnish population has relatively less genetic diversity than other European populations, and many alleles that are rare in other populations are enriched in Finns (165). This makes the METSIM study particularly well-suited to identify novel, rare variants contributing to MetS (165, 188). METSIM participants have been densely genotyped; full exome sequences are available for essentially all subjects, and a substantial proportion have had their whole genomes sequenced (165). Exome-wide association studies for cardiovascular and metabolic traits identified several rare variants that are unique to Finns (188). Moreover, many “deep phenotyping” endpoints were collected by leveraging -omics technologies, such as metabolomic analysis of lipid and lipoproteins via nuclear magnetic resonance (63, 97). Deep phenotyping, or collection of highly specific molecular phenotypes, enables detection of significant loci with smaller sample sizes, as the genetic etiology underlying these molecular phenotypes is often more straightforward, with larger effect sizes (150). Because this cohort has been well-characterized for detailed clinical phenotypes and genotyped thoroughly, these data have been successfully employed for mapping a variety of QTL and molecular QTL (63, 97, 239, 262, 349).
Genetic crosses to identify QTL in Rodent Model Organisms
By definition, a complex disease has multiple causes, which cannot be entirely attributable to genetics. Genetic variants may contribute to risk, but disease typically only results in the presence of a certain environmental stressor. With human subjects, it is virtually impossible to standardize exposure to uncover all disease-causing genetic variants. Also, human studies are costly, often underpowered, usually retrospective and limited by incomplete or non-standardized phenotyping and medical records (3, 275). A complementary approach to identifying the multifactorial elements of complex disease is to identify QTL in rodent models, which are both genetically and environmentally tractable (121). Although gene sequence in rodents is different to humans, most genes exhibit strong functional conservation, to the point that it is not difficult to translate many rodent phenotypes to a human phenotype or disease. Though much research employing rodents utilizes inbred, genetically modified isogenic strains derived from the C57BL/6J mouse or the outbred genetically undefined Sprague Dawley rat, several genetic tools and breeding schema can be used to leverage rodent models to map complex traits and uncover novel genetic underpinnings of disease.
The purpose of any rodent cross serves to either decrease genetic diversity with inbreeding or increase genetic diversity through outbreeding. All approaches rely on the recombination that occurs during meiosis to divide chromosomes into smaller functional units that may be identified as a QTL or group of QTLs. Genetic distances such distance between marker SNPs and loci of interest are expressed as centiMorgan (cM) units, which refers to the number of crossovers per 100 meioses (258). These intervals may also be reported in terms of the linear length or number of bases of DNA dividing the two points (258). Between 0.5 and 1 megabases (Mb) is a well-resolved QTL and given the complex nature of gene structure and the somewhat fluid definition of the bounds of genes, it is not practical to refine mapping much further below that (258, 341).
Backcrosses and Intercrosses involving two genomes
The process of inbreeding results in homogenous genomes which are ideal for phenotypic characterization and mechanistic study of disease-causing loci or quantitative traits. Consider two inbred parent strains A (PA) and B (PB) with phenotype differences (Figure 3). All mapping crosses begin with crossing PA and PB to generate F1s, who are genetically heterozygous for all segregating loci in PA and PB. In other words, these animals are identical to one another, and approximately 50% like each parent. For a backcross, F1s are mated back to either of the parent strains, and the N1 progeny (where 1 denotes the number of backcrosses performed) are genotyped and screened for the phenotype of interest. Though mapping specifically with backcrosses is no longer commonly done, it is useful for mapping a trait with a dominant pattern of inheritance, where the individuals with the trait are backcrossed to the parental strain without the trait (123). Backcrosses are now mostly used as intermediate steps to place loci of interest from a donor genome onto the genetic background of a recipient strain through several generations of backcrossing, for the purpose of colony maintenance or fine mapping relevant QTL (57, 181, 278). Each round of mating back to a parent strain and screening for genotype or phenotype of interest increases the N number by one, and reduces genetic heterozygosity by a factor of ½N. By convention, animals that have been backcrossed 10 times can be considered a new inbred strain, as the level of heterozygous loci is now less than a tenth of the starting level.
Figure 3: Backcrosses, Intercrosses and Outbreeding with Two Parent Genomes.

When two distinct parental genomes (blue and red) are combined, the resulting progeny in the F1, or first filial generation are identical to each other and an equal mixture of both Parent A and Parent B. In a backcross scheme, the F1 progeny are subsequently crossed back to either parent, with successive phenotyping and/or genotyping at each stage. This type of approach is useful when the trait one is attempting to map has an autosomal dominant inheritance pattern, and after 10 generations, an inbred animal is achieved that has been selected to have the minimum portion of the donor genome necessary to produce a phenotype, while the rest of the genome is homozygous for the recipient parental genome. For traits where the inheritance pattern is unknown or recessive, an intercross breeding scheme must be used, where F1 progeny are sibling mated to produce F2s, the genomes of which are random mosaics, containing portions of chromosomes that are heterozygous (purple) or homozygous for one genome or the other (blue or red). Each additional intercross produces new recombinations, which increases genetic complexity and leads to finer mapping resolution, and this process can be theoretically continued indefinitely. 20 intercrosses are required to produce a fully inbred animal for followup functional studies with brother-sister mating.
The basic intercross was employed to establish all the mating schemes discussed below. As with backcrosses, a pool of F1s is generated, but instead of crossing them back to either parent strain, they are brother-sister mated (Figure 3). During meiosis in the F1s, some chromosomes are recombined to shuffle genetic markers or alleles. Alleles generally follow Mendelian inheritance patterns, thereby fixing some of them in one genome or the other, resulting in a population of genetic individuals that are a mosaic of both parent genomes. The first round of brother-sister mating yields F2s, and each subsequent round of brother-sister mating increases the F number (for Filial generation) by 1. After 20 rounds of brother-sister mating (or at the F20 generation), the probability of homozygosity at any locus is essentially 100%, thus same sex animals are effectively clones and are by definition inbred. The recombinant inbred (RI) design takes this concept several generations further. Pairs of F2s are intercrossed, and the resultant progeny is intercrossed so that with each successive generation, more crossovers accumulate, and heterozygosity is lost. Twenty rounds of iterative brother-sister mating results in a panel of individual inbred “families”, in which all the members are genetically identical across time—a major advantage for reproducibility and heritability estimates, since the impact of non-genetic trait variance is reduced (341). To use this breeding scheme for genetic mapping, however, numerous intercross-derived “families” must be established in parallel and kept separate, such that each is a distinct mosaic of homozygous parent haplotypes. This approach is a powerful tool, but must be utilized as a panel, in which multiple RI strains are studied at once. Generating the RI panel requires large numbers of animals and is extremely costly and time-consuming to establish, but after they are created, you can perform mapping in the panel without the need to further genotype animals.
Outbreeding Schemes for Genetic Mapping from two parental genomes
In contrast to inbreeding, outbreeding is designed to maximize genomic variability, which is necessary for mapping novel disease and trait associations, which may provide greater translatability to diverse human populations. The simplest mapping experiments leverage the genetic mosaicism of an F2 intercross (Figure 3). As recombination events break up parent chromosomes in various ways, each member of the F2 generation is genetically distinct from every other member. This allows genetic mapping of traits by screening a large pool of F2s for a phenotype of interest and genotyping them at all segregating loci. This design has three serious advantages compared to some others: comparatively less genotyping, smaller sample sizes needed for statistical power to detect significant association, and generation of experimental animals is rapid. Fewer SNP markers are needed to tag segregating alleles between two-parent genomes, and P values need not be as stringent, due to fewer independent tests. This retains statistical power with fewer subjects, which is cost-effective. Furthermore, as only two rounds of breeding are needed, experimental animals can be generated quickly. Both backcrosses and F2 intercrosses are separated from the F1 hybrids by a single round of recombination and have the same disadvantages that confers. The members of F2 populations typically have 20-30 recombinations across the genome (341), occurring more frequently towards the ends of chromosomes (221). In addition, crossovers rarely happen more than once on a single chromosome during meiosis, so resulting QTLs tend to be very large and relevant regions close to a centromere will be hard to identify. Consequently, identifying causal variants in a large QTL requires multiple other lines of study.
In the context of complex phenotypes, the associated QTL is almost certainly due to the combination and genetic interaction, or epistasis of numerous smaller, linked QTL that independently have more modest effects. This phenomenon is an obstacle for backcrosses, F2s and congenic-based QTL fine-mapping, and is frequently a reason these approaches fail to identify causal genes without substantial iterative fine-mapping (110). These methods have been widely used to identify thousands of large QTLs for hundreds of phenotypes and diseases, but often fall short of identifying causative genes or nucleotides (293). When gene interactions are required for a phenotype of interest, breaking up the QTL into smaller and smaller pieces with successive crosses could result in a loss of that phenotype. Conversely, two tightly linked QTLs may have opposite effects of the phenotype of interest and cancel each other out if not divided by recombination (110). Even if a QTL is discovered, the genetic maps that can be obtained have low resolution, and any identified QTLs can span tens of millions of base pairs and may contain hundreds or thousands of genes.
Aside from increasing the number of animals phenotyped in an F2 intercross, the only way to increase the resolution of the genetic map is to perform further intercrosses, as the number of linked SNPs decreases with more recombination events. Advanced intercross (AI) are the simplest possible means to refine QTL intervals by continuing brother x sister mating beyond the F2 generation to improve mapping resolution with the increase of crossovers (111). AI lines differ from RIs in that within each sequential F generation, animals are crossed semi-randomly (specifically excluding sibling mating), such that genome-wide heterozygosity is retained, and the odds of recombination between any two loci is increased (43, 61). An advantage of AI lines over an F2 cross is that with equal population sizes, QTLs sizes are reduced by as much as five-fold with only 8 subsequent intercrosses, allowing for finer mapping resolution (61).
Another advantage to mapping QTLs with AIs is that they are simpler to establish for individual labs, compared with more elaborate cross designs discussed below. Furthermore, if complex family relationships are accounted for, data from F2 and AI crosses can be combined, integrating power from F2s and resolution from AIs (293). Several AI lines of mice are commercially available, but these are not suitable for investigators who wish to study diseases or traits that do not segregate in the two parents of origin. Establishing a novel AI line can be costly and time-consuming. With F2 intercrosses, fewer recombinations separate each animal from the parent genomes, so only a handful of genetic markers are needed per chromosome to tag all the haplotypes, whereas far more are needed in an AI. Every animal is genetically distinct, requiring full genotyping and phenotyping with every new study.
Multi-parental Rodent Stocks and Their Uses
In contrast to F2s and AIs which only have two parent strains, the heterogeneous stocks (HS), Collaborative Cross (CC) and diversity outbred (DO) models are created by carefully combining the parent genomes of 8 distinct inbred parental strains (Figure 4) (293). The mouse CC is essentially a more complex RI design. Using reciprocal crosses of all eight founders (C57BL/6J, 129S1/SvlmJ, A/J, NOD/ShiLtJ, NZO/HiLtJ, CAST/EiJ, PWK/PhJ, WSB/EiJ), the resultant inbred lines contain roughly equal proportions all eight founder genomes. This is particularly advantageous with genetic mapping studies because MAF in these populations should theoretically be above 12.5%. Because they are inbred, CC mice have a significant advantage in that if a QTL or candidate gene is identified, additional genetically identical animals from that line can be obtained for functional studies and validation. In addition, mapping resolution is high, the genomes of the parents are fully sequenced (thus segregating alleles are known) and these animals are commercially maintained and available for purchase.
Figure 4: Multi-Parental Rodent Populations for QTL Mapping.

Eight founder genomes are represented in the Collaborative Cross mouse, Diversity Outbred mouse, and Heterogeneous Stock rat. In contrast to the other two, the Collaborative Cross (CC) mice are inbred, and were developed as highly diverse series of lineages in a Recombinant Inbred (RI) Panel. From the CC resource populations, a subset of animals was outbred in order to reestablish genetic variation using at least 20 generations of circular or semi-random mating designed to maximize outbreeding by ensuring close relatives were never bred together. This became the Diversity Outbred (DO) mouse. The founder genomes of the CC/DO populations are: C57BL/6J, 129S1/SvlmJ, A/J, NOD/ShiLtJ, NZO/HiLtJ, CAST/EiJ, PWK/PhJ, WSB/EiJ, and the inclusion of wild strains of Mus musculus generates the most diverse rodent population and is the closest to matching the spectrum of human genetic diversity. Aside from species differences, a major factor affecting the genetic diversity of the Heterogeneous Stock (HS) rat is that the HS rat was established using a one-way breeding funnel, which allows alleles to become fixed within the population more easily, rather than retaining the high degree of variance. With balanced, reciprocal crosses, allele fixation or loss is less likely. Although the introduction of wild alleles increases the breadth of diversity in the CC/DO genomes; these alleles have proven somewhat deleterious as they have undergone negative selection in the unfavorable laboratory environment.
Heterogeneous Stocks (HS) exist in both mouse (275) and rat (347), and in contrast to the CC, these animals are bred together in a way that reduces inbreeding, either by circular or pseudo-random mating (347). After many generations, resultant haplotypes are small, thus QTL can often be mapped to small confidence intervals (>9 Megabases is typical), facilitating the rapid identification of causal genes and variants contributing to MetS phenotypes, such as Tpcn2 and its identified role in diabetes-related traits (315, 347). Because HS rats are a composite of 8 inbred founder genomes, these animals exhibit high phenotypic variability, and consequently have been used to map numerous complex traits (347). Both HS mice and rats have been used to fine map MetS QTLs, such as body mass index, cholesterol, adipose phenotypes and glucose and insulin levels (294, 295, 315) to chromosomal intervals of 5 Mb or less (151, 317). On the other hand, a serious disadvantage to the HS mouse or rat is that like other outbred lines, each animal is unique, and even if candidate genes are identified, there is no inbred model to utilize for further validation or functional studies. Because there is so much genetic variation, genotyping experimental animals requires thousands to hundreds of thousands of SNPs, and for adequately powered studies, thousands of animals. As such, it is advantageous to phenotype as many traits as possible, but this is logistically demanding and further increases expense (347).
While the HS outbred animals are derived from laboratory strains, the Diversity Outbred (DO) mouse stocks are composed of a mixture of laboratory and wild-derived mouse genomes, capturing roughly 90% of all mouse genetic diversity (232), and with approximately 40 million SNPs, this rodent population recapitulates the genetic diversity of the entire human population, resulting in the most diverse rodent population to date (153). This population was developed by random selection of CC animals undergoing inbreeding, and as such, contain balanced contributions of the same eight founder genomes. These animals are designed to recapitulate the genetic and phenotypic diversity of a population, and as such, each animal is genetically unique, necessitating large numbers for adequately powered investigations. Although DO-based mapping projects require large scales of animals and high-throughput genotyping, any identified QTL are small (in the 1 cM range). They have been successfully used to map atherosclerosis QTL (288), including replicating a triglyceride QTL on chromosome 9 that was refined down from about 30Mb in size (301) to 1.4Mb (288).
Finally, the Hybrid Mouse Diversity Panel (HMDP) (192) and the Hybrid Rat Diversity Panel (HRDP) are powerful systems genetics resources for mapping phenotypes and molecular traits. Comprised of roughly 100 inbred strains each, these combine the mapping resolution of divergent inbred strains with the mapping power of recombinant inbred panels, though not to the level of a large human GWAS (192). Despite this, the hybrid diversity panels are advantageous due to their environmental tractability, ease of tissue collection, and as inbred strains, are renewable across time and space (192, 262). Since its inception, the HMDP has been used to map traits relevant to obesity (250), T2D (251), non-alcoholic fatty liver disease (133), heart failure (261), and atherosclerosis (17). The HMDP is composed of 32 divergent inbred strains, as well as 71 RI strains derived from crosses between C57BL/6J and both the DBA/2J (BxD) and A/J (AxB and BxA) inbred mice (192). The HRDP is generated in a similar manner—35 inbred strains chosen specifically for genetic diversity, and two different RI panels of 30 and 34 strains, utilizing crosses between the Spontaneously Hypertensive and Brown Norway rats (HXB/BXH) and the F344 and Long Evans (FXLE/LEXF) rat strains, respectively, both of which are also included among the 35 inbred lines (304). The mapping resolution of the HMDP is on the same order as the CC or DO mouse, while the HRDP provides increased mapping power and precision to any other rat or mouse resources, with the major advantage of reproducibility and downstream functional applications provided by an inbred animal (304). Total genetic variability in the CC or DO exceeds that of the HMDP due to the contribution of wild-derived alleles in the former. At least in the case of the CC, however, the interplay between animals artificially selected to thrive in laboratory environments and alleles from wild mice has resulted in systemic loss of these alleles, particularly from the CAST/EiJ and PWK/PhJ strains (296).
Metabolic Syndrome QTLs—Rodent Studies
Rats have been used to map various traits relevant to MetS, such as body weight (143), blood pressure (99, 100, 113, 219, 316), insulin resistance or diabetes (92), dyslipidemia (145, 203), or some combination of these (21, 219, 263, 330). Mice have also been used for holistic Metabolic Syndrome mapping studies (161, 230, 297, 325) many of which have involved the New Zealand obese mouse as one of the parent strains, which is a well-characterized inbred model of obesity, insulin resistance and diabetes. Work on cholesterol loci have also been well-studied using crosses with and between apolipoprotein ε-deficient mice on various genetic backgrounds (114, 147, 269, 285).
Studies using RIs derived from 2 parent genomes, such as the HXB/BXH rats and the BXD mice, have been performed to investigate complex behavioral traits such as drug and alcohol preference and locomotor activity (111), as well as for blood pressure eQTL (132) and other MetS-related traits such as cardiac fibrosis (148) and histone modifications in cardiomyocytes (11). The Collaborative Cross (CC) mouse has been widely used for genetic mapping of many MetS traits, such as hyperglycemia and insulin sensitivity (2, 350) and several other features of obesity after high fat diet challenge (23). Strains from the CC are also used for mapping cellular level quantitative traits, such as differential expression and chromatin accessibility of genes involved in glycogen metabolism (152)
Populations of outbred animals such as the DO mouse and the Heterogeneous Stock (HS) rat have been used to map even more MetS traits, including the recent study by Chitre, et al that identified 32 independent loci associated with adiposity, body size, BMI, and fasting glucose levels on the largest rat GWAS ever conducted (46). Because of the population size and the genetic diversity of the HS rat population, all loci were small enough that they only contained one or very few genes, a clear advantage of this model (46). The DO mouse is similar in terms of advantages and drawbacks, and has been used in studies to map traits such as atherosclerosis susceptibility (48, 288), and insulin secretion (153) down to single genes.
Hybrid Diversity Panels exist for both mouse (HMDP) and rat (HRDP), and in the case of the HMDP, has been used to map MetS traits. Recently, the elucidation of Ifi203 and Map2k6 as regulators of liver processes involved in insulin resistance and non-alcoholic fatty liver disease (233), both of which are common comorbidities in MetS (329). Much of the work done on the HMDP has been performed to tease apart genetic regulation of heart failure (274, 284) and of the mouse liver proteome and metabolome, as well as liver gene expression, all of which have obvious connections to several traits such as HDL/LDL cholesterol balance, triglycerides, and obesity (104, 243).
Resources
As with humans, much of the data obtained from rodent research models is publicly available. The Mouse Genome Informatics (MGI) database curates data from hundreds of thousands of publications and is a comprehensive resource for information about mouse models, gene functions, expression data from its integrated gene expression database (GXD), as well as the official source of mouse strain and gene nomenclature (173). One unique feature of MGI is the Human-Mouse: Disease Connection (HMDC) tool, which can display comparative human and mouse genomics, allowing a researcher to quickly find existing mouse models for human diseases (83, 173). Another tool is the Mouse Phenome Database (MPD), which is a source of quantitative trait and QTL data and provides more granular information about mouse strain phenotypes in specific study contexts (24).
Although the laboratory mouse has supplanted the rat in genetics studies, rats are still a preferred model for many behaviorists, pharmacologists, toxicologists, and physiologists (4). Like mice, the rat genome has been fully sequenced, and though genome-editing tools have not fully reached the sophistication of those in mice, there is no shortage of rat genetic tools, and as of 2021, there are 3911 rat strains registered with the Rat Genome Database (286, 290). These include inbred rat models with spontaneous mutations and widely diverse phenotypes, carefully maintained outbred stocks with comprehensive pedigrees, and even genetically modified strains induced via Zinc-Finger Nucleases (ZFNs), Transcription Activator-Like Effector nucleases (TALENs) or CRISPR-Cas9 mutant rats (205, 286). The Rat Genome Database (RGD) is the leading location for genome and phenome data in the laboratory rat as well as human, mouse, and other model organisms (dog, bonobo, green monkey, chinchilla, thirteen-lined ground squirrel, pig, naked mole rat) to aid in cross-species and translational studies (286, 290). RGD also contains several useful analysis tools: Online List Generator and Analyzer (OLGA) which generates lists of genes from specified regions or QTL and the new Multi Ontology Enrichment Tool (MOET) that calculates whether gene lists are significantly enriched for a specific pathway, disease, or phenotype (286, 290). These lists can be analyzed for overrepresentation of cellular processes, or disease, phenotype, and pathway annotations and may be used to guide further research. For phenotypes and processes relating to MetS, RGD has a portal dedicated to Obesity and Metabolic Syndrome, containing QTL, genes, and relevant rat strains, as well as comparative human data (https://rgd.mcw.edu/rgdweb/portal/home.jsp?p=8).
Systems Genetics and Molecular QTLs
Regardless of mapping resolution or number of genes in a QTL, when dealing with complex phenotypes, a complex approach is required. The fundamental problem that plagues GWAS and traditional phenotype QTL studies is that the etiology of complex disease is far more intricate than the linear relationship between a pathogenic nucleotide variant, a mutant protein, and a disease. GWAS identify loci that are linked to causal variants, but rarely implicate individual genes or mechanisms, as 90% of GWAS-identified variants are non-coding or intergenic (35). These loci can contain many genes that may or may not contribute to the disease, or may overlap with “gene deserts” which are devoid of protein coding genes entirely (160).
Genetic regulation can exert its effects from anywhere in the genome—even on different chromosomes. Portions of the genome without an obvious link to the associated phenotype may be harboring variants that affect loci thousands or hundreds of thousands of base pairs away (177). With complex diseases, a causal mutation may not be within the body of an expected gene but may be genetically regulating or dysregulating the relevant gene or genes in some important way (177). To make sense of the complexity, the solution is to integrate the phenotype QTL with other approaches and evaluate the genomic region for variants in the context of the entire system being regulated. Systems genetics integrates genomics, or whole genomes, with molecular “-omics”, the comprehensive assessment of a molecular phenotype, to analyze a biological network (121, 218). This type of analysis is informative because local QTLs often influence multiple molecular phenotypes (117). These additional layers of analysis may aid in the prioritization of candidate genes, identify causative variants, and guide functional and mechanistic follow up studies.
Transcriptome Modifications and QTLs
All the ribonucleic acid (RNA) in a cell is collectively referred to as the transcriptome (199). Although most previous work has focused on coding messenger RNA (mRNA), most RNA is non-coding, including ribosomal RNAs (rRNA), transfer (tRNA), small nuclear (snRNA), small interfering (siRNA), microRNA (miRNA), and long non-coding (lncRNA) (199). Transcription of mRNA is the intermediate step between DNA and protein, and regulation of this process is extremely complex to accommodate protein function in a wide array of situations. Variants within regulatory elements in the genome influence transcriptional regulation, which can be mapped with simple modifications to the classical QTL paradigm. Most molecular QTL studies capitalized on the ease of mRNA analysis to identify and quantify mRNA transcripts and link this information to genotype influence on gene expression (eQTL), and a large proportion of GWAS-identified variants reside within eQTLs (211). Transcription level, however, is an endpoint measurement and an eQTL may be dependent on a component of transcriptional regulation such as chromatin organization (chrQTL), histone modifications (hQTL), DNA methylation (meQTL), and alternative splicing (sQTL). As high-throughput genome-wide approaches become more sophisticated, it has enabled QTL studies of these other processes regulating the transcriptome, however, these are relatively understudied compared to eQTLs.
eQTL: gene expression as a quantitative trait
Variation in RNA transcript abundance is a quantitative trait, and eQTL analysis uses gene expression data to identify variants associated with changes in mRNA levels (34). This is done by isolating RNA from a tissue or cell type of interest and converting them into the far more stable complementary DNA, or cDNA (199). Identification and quantification of the transcripts in these samples are done either with microarrays or RNA sequencing, which are somewhat analogous to SNP chips and whole genome sequencing, respectively. Microarrays are designed with sequence-specific probes that are printed on a slide or incorporated into a chip, which emit light when fluorescently tagged cDNA binds to its sequence, whereas RNA sequencing is done using high-throughput next generation sequencing modified for RNA (199). The coordinates on the chip indicate the transcripts identity, while the abundance of light is the quantitative measurement of expression of that transcript (199). RNA sequencing, or RNA-Seq has essentially supplanted microarrays as the technology has gotten cheaper, because it does not rely on predesigned transcript-specific probes on a chip. Thus, RNA-Seq can detect novel transcripts and isoforms as well as known ones across a larger dynamic range. The datasets generated by either technology can be combined with whole genome genotyping (either by SNPs or by sequence) to map expression (e)QTL, or the DNA variants that impact gene expression (Figure 5) (199). RNA-Seq expression studies typically publish results and deposit the data into public repositories for others to replicate their findings. Because new versions and updates of these tools are published constantly, it can sometimes be difficult to identify if associations are replicating previously published ones, or if they are novel (199).
Figure 5: The Abundance of an mRNA Transcript is Genetically Regulated by eQTL and sQTL.

Transcription factors recruit RNA polymerases when bound to transcription factor binding sites (TFBS). The strength of the TFBS is dependent on the sequence, and variation in sequences can alter the abundance of the transcribed gene. When the sequence variant is located near the gene-often in a TFBS, it is said to be cis regulated or a cis-eQTL. If the transcription factor itself has a variant that hinders its ability to bind to its TFBS, then the gene is trans-regulated and the SNP is a trans-eQTL, as the coding region for the transcription factor need not be near to the regulated gene. When the nascent mRNA is transcribed, introns are spliced out to form the mature mRNA. Each exon is bounded by GT----AC nucleotides that signal the boundaries of the intron to be removed. When these sites vary, the proportions of certain exons might change, or exons that are normally included in the transcript might be skipped entirely.
There are two types of eQTL: cis-acting or trans-acting eQTL, which are distinguished by whether the associated SNP is within the gene it regulates or not (50). This is another important aspect of an eQTL study, because cis- and trans-acting SNPs tend to have distinct mechanisms by which they influence gene expression. Consequently, the ability to elucidate the genetic distance between the gene and the SNP that regulates it is one of the most important aspects of an eQTL study (5, 35). Cis-eQTL map to the gene whose expression level is influenced by that locus (52). Thus, these SNPs tend to be found in regulatory elements such as promoter regions, transcription factor binding sites, or other elements considered proximal to the gene, and typically exert stronger effects on individual gene expression (218). In heterozygotes, cis-eQTLs act in an allele-specific manner, as by definition, they can only exert their effects on a nearby gene on the same physical chromosome (5, 52). Though the actual distance in base pairs is situation-dependent, typically same-strand DNA motifs within 1Mb of the transcription start site (TSS) are considered proximal or cis-acting regulatory elements; however, this does not include the homologous chromosome (5). On the other hand, trans-eQTL regions are distant from the transcripts they regulate, and often lie on other chromosomes (5). These elements generally are more tissue-specific than cis-eQTL, and may encode transcription factors or cofactors, RNA-binding proteins, or members of signaling cascades, none of which need to be proximal to the genes under their control (5, 218). In addition, because trans-acting factors are freely diffusible, they do not exert allele-specific effects on heterozygotes (5).
Cis-eQTL tend to explain a large proportion of individual transcript variation, or the heritability of that gene’s expression (52). When cis-eQTLs overlap with QTL intervals for a given trait, the genes affected by the SNP are strong candidates for a causal relationship to the phenotype of interest. In contrast, trans-eQTLs have smaller effect sizes, and usually explain comparatively less variation of single genes, however, they are enriched with complex traits (35). Typically, these eQTL are detected as ‘clusters’, or “hotspots”, and define collections of genes whose expression is somehow related (174). Thus, a trans-eQTL may define a set of genes under polygenic control, or that share a causal relationship with a single master regulator of their expression, and collectively explain most of mRNA heritability as a whole (26).
One of the largest studies on MetS traits in humans was the METSIM study, a group of over 10,000 Finnish men, ages 45 to 73, which aimed to investigate genetic and non-genetic factors involved in risk of type 2 diabetes mellitus (T2DM), cardiovascular disease (CVD) and other related phenotypes (165). A subset of this population also underwent eQTL mapping using subcutaneous adipose tissue biopsies, and this analysis identified over 100 eQTL loci that colocalized with GWAS loci, some of which replicated in previous associations of other populations, while others were novel, or perhaps specific to Finns (165).
Another example of eQTL mapping in humans is the discovery of the KLF14 association with T2DM, as well as other metabolic traits such as cholesterol (47). Meta-analysis of the original GWASs revealed a locus near KLF14 as having pleiotropic effects on T2DM, and HDL cholesterol, however, this region contained 55 genes, which eQTL analysis helped to prioritize and eventually identify KLF14 as the driver gene (47, 352). Though initially conducted in Caucasian Europeans, these findings have been replicated in other populations (Pakistani, African American, Han Chinese) (352), which is good evidence of a true association.
A major disadvantage to eQTL mapping performed using human tissue is that disease-relevant tissues that are invasive to collect can only be obtained during medically necessary surgical procedures or during autopsies (183). To obtain quality RNA, samples must be collected and preserved extremely quickly, and obtaining tissue from humans may increase confounding variables, as certain tissues can only be collected from people with comorbidities that either required surgery or led to death (183). Because of these limitations, most human RNAseq datasets utilize subcutaneous white adipose tissue (WAT) biopsies or blood as their tissue source, both of which are readily accessible in humans (223). While WAT is undoubtedly of great metabolic relevance for MetS and its associated phenotypes, the highly tissue-specific nature of gene expression means that eQTL identified in human WAT are not necessarily translatable to other cardiometabolic tissues, nor to other WAT (223).
Even biopsies of the same tissue types cannot be directly compared if the tissue is heterogeneous. Adipose tissue is mainly composed of four cell types: adipocytes, macrophages, CD4+ T cells and micro-vascular endothelial cells; the relative proportions of these are variable depending on the fat depot from which the tissue is collected (106). The transcriptome of adipose tissue is largely dependent on the subject’s BMI and can vary substantially in overweight or obese participants, therefore eQTL analysis typically adjust for BMI in these datasets (47). Although transcriptomes of whole blood are corrected for cell type proportions, surprisingly little is known about how heterogeneity of bulk tissues samples affects RNA. Glastonbury, et al., asked whether this oversight might result in some false associations in existing eQTL and GWAS datasets (106). They compared subcutaneous adipose RNA between the GTEx and TwinsUK datasets, and when they adjusted for macrophage infiltration, 11% of prior associations were no longer significant (106). As one of the hallmarks of obesity is an increase in immune cell infiltration into fat tissue, it is unsurprising that obesity phenotypes were also highly correlated with macrophage content (106, 322).
To solve these issues, some investigators turn to differentiated and cultured cells, such as induced pluripotent stem cells, employ cell sorting methods, or more recently, single cell (or single nuclear) RNAseq (223). These also have their problems with complex disease states, as it is impossible to know whether a single cell type can replicate biological phenomena in a tissue context. For this reason, leveraging animal models for eQTL mapping may answer questions about gene expression mechanisms that human datasets cannot. Human expression mapping data is invaluable and has greatly increased our understanding of many of the molecular underpinnings of common cardiovascular and metabolic diseases. Due to the limitations of human subjects’ research, however, the depth of published research has been inadequate for identifying more complex regulation, such as gene x environment interactions, or pathogenesis of disease in tissues that are difficult to obtain in humans. Carefully outbred rodent studies can achieve statistically significant results with greater power and far fewer numbers than human GWAS due to the more complete phenotype information and ability to control the environment (250). The HMDP has been leveraged for this purpose to map adipose tissue changes because of diet interventions (250, 251). These data have also been compared to human populations to prioritize candidate genes out of long lists of possibly specious associations (47, 165).
The LH and LN rats are inbred strains selectively bred solely for high and normal blood pressure, respectively (330). Interestingly, the LH also developed concomitant obesity and dyslipidemia, creating an inbred rat strain with spontaneous MetS, while the LN, its closely related control strain, is metabolically healthy (330). An F2 intercross population derived from LH and LN parentals was generated to map physiological and eQTLs contributing to MetS (330). Over the course of 12 weeks, animals were comprehensively phenotyped for obesity, lipid and blood pressure parameters, and QTL for systolic blood pressure and plasma leptin were identified on chromosome 17 (330). An eQTL analysis was performed with liver tissue, and identified 276 significant eQTLs genome-wide, with a single SNP in a trans-eQTL hotspot that colocalized with the blood pressure and plasma leptin locus (330), as well as QTL for body weight and other MetS traits that were mapped in a previous cross between the same strains (21). These data led to the identification of the cis-regulated, novel, uncharacterized gene, C17h6orf52 (330). C17h6orf52’s coexpressed network implicated dysregulation of transcription regulation and mitochondrial oxidative phosphorylation (330). This study shows how rodent mapping studies may be used discover new associations between known genes, as well as to identify completely novel ones.
eQTL Resources
As the best-studied molecular QTL and most widely incorporated into systems genetics approaches for complex disease, a large number of analysis tools for eQTL datasets can be found in the literature and are reviewed extensively elsewhere (1). There are several significant resources that deserve special mention (Table 3).
Table 3:
Generating and analyzing eQTLs
| Genotype-Tissue Expression (GTEx) Database | Establish and maintain a comprehensive reference resource of gene expression data in a large panel of various “normal” human tissues (52) | gtexportal.org/home/ |
| EMBL-EBI Expression Atlas | Compilation of published data on gene expression in a variety of species, tissues, experimental conditions; includes GTEx data, now includes single cell RNAseq data (246) | ebi.ac.uk/gxa/home |
| Gene Expression Omnibus (GEO) | NCBI’s repository of freely available, raw microarray and sequencing data, submission agreement is a prerequisite for funding (13) | ncbi.nlm.nih.gov/geo/ |
| GeneNetwork | Tool that stores QTL and eQTL datasets from human, mouse and rat; indicates peak location and effect size; is searchable by phenotypes or genomic position (222) | http://www.genenetwork.org/ |
| PhenoGen | Database of transcriptome data on animal models, such as HRDP, with integrated systems genetic tools to explore genetic relationships in the basal state of the animal (304) | https://phenogen.org/ |
| Weighted Gene Coexpression Network Analysis (wGcnA) | Tool that describes correlation patterns between genes in a gene set in an unbiased way, groups coexpressed genes into modules that share function (169) | https://horvath.genetics.ucla.edu/html/CoexpressionNetwork/Rpackages/ |
| Network Edge Orienting (NEO) R package | Bioinformatic tool that predicts causal relationships within gene networks and infers the directionality of the relationship (10) | https://horvath.genetics.ucla.edu/html/CoexpressionNetwork/Rpackages/ |
| PrediXcan | In-silico tool that predicts gene expression based on allelic variance (98), inaccurate in non-European populations (211) | github.com/hakyimlab/PrediXcan |
Resources to find and analyze published eQTL datasets
The largest databases of published gene expression data for humans and other species are the Genotype-Tissue Expression (GTEx) Portal, EMBL-EBI’s Expression Atlas, and the Gene Expression Omnibus (GEO). The goal of the GTEx project was to establish a comprehensive tissue panel from 900 deceased donors for evaluation of gene expression in a wide array of adult donors (50). A particularly important limitation of these datasets for the study of metabolic phenotypes such as obesity and dyslipidemia is that subjects are immediately excluded when body mass index exceeds 35 (50). The Expression Atlas is another curated resource for gene expression data and eQTL (246). Although the GTEx resource is far more comprehensive than the Expression Atlas for human data, an advantage to the Expression Atlas is that it stores data on a number of species and has recently been updated to include single cell RNA sequencing datasets (246). Finally, GEO is a central database of all expression data in cells, tissues, animals, and humans. As many research funding networks require investigators make their data freely available on GEO, it could theoretically serve as a source of eQTL data, though it is not well organized for this purpose (13). Finally, two eQTL webtools are PhenoGen and GeneNetwork, for rodent and for human, mouse, and others, respectively. While these databases are not as large as those represented in GTEx or EBI’s Expression Atlas, PhenoGen and GeneNetwork include rodent datasets and are searchable by trait, QTL or eQTL position, and is well designed for further genetic applications with web tools generating gene lists and identifying causal connections between them (16, 222).
Weighted Gene Coexpression Network Analysis (WGCNA) is a commonly used systems biology tool for the analysis and interpretation of RNAseq or microarray data. This can be conducted on lab generated or publicly available data and is used to find modules of genes whose expression is highly correlated (139, 231). Once annotated, enrichment of certain modules is key preliminary data that may guide future studies. This analysis has been recently used to profile and construct novel networks from publicly available datasets of patients with heart failure (231) or coronary artery disease (139). While WGCNA is useful for generating networks of related genes, it is not able to discern the nature of that relationship. The Network Edge Orienting (NEO) package in R can infer causal relationships in gene modules by sequentially evaluating pairs of eQTL for the likelihood of a causal relationship, and then predicting the directionality of that relationship (10). This analysis allows the investigator to make in-silico predictions about the effect of SNPs or targeted mutations in a gene of interest upon its potential downstream targets or effectors (260). It has been used for this purpose to identify Adamts2 as a novel regulator of cardiac pathological remodeling in a mouse model of cardiac hypertrophy (260, 261). NEO is unique in that it can establish relationships between pairs of eQTL, QTL or both (10).
Another important tool for interpretation of eQTL and generation of eQTL maps is PrediXcan, especially if sequence data is limited or unavailable (98). In fact, no actual transcriptome data are required—thereby giving any existing GWAS dataset the potential for eQTL mapping (98). PrediXcan is a widely used tool for testing associations between genotype and gene expression and can predict likely expression values based on SNP genotyping or sequencing—especially useful when tissues of interest are not easily accessible (211). A major limitation of this, however, is that this program was developed using expression data of predominantly white individuals (211). Consequently, accuracy of predictions suffers in non-Caucasian populations, particularly those with substantial African ancestry, and it will not work with animal data (211).
sQTL-transcript isoforms and splicing junctions as a quantitative trait
Prior to the completion of the human genome, protein-coding genes were estimated to exceed 100,000 in number, in order to account for the complexity of tasks that proteins must perform (272). Now, we know the true number of protein-coding genes is roughly 1/5 of what those early estimates predicted, as most multi-exonic genes produce several different isoforms of their encoded protein. While each protein has a canonical transcript sequence, many genes with multiple exons have alternative transcripts that involve inclusion or exclusion of alternative exons, which greatly increases the complexity of the transcriptome, sometimes by as much as 10-fold (247). The ratios between alternative mRNA transcripts are another example of a regulatory quantitative trait, and splicing QTL are studied to understand how alternative splicing influences complex disease.
Most genes have multiple exons, or protein-coding sequences, and in eukaryotes, exons are separated by introns, which are spacer regions of non-coding sequence that often are kilobases in length and must be removed to generate mature mRNA transcript during RNA splicing. Different RNA isoforms produced by alternative splicing are often unique to a specific biological context and developmental stage. Most genes are alternatively spliced, and this process includes seven different potential RNA processing patterns: exon skipping, intron retention, alternative first exon, alternative last exon, mutually exclusive exons, and alternative 5’ or 3’ splice sites. Many genes have isoforms that employ several of these schemes, even within the same alternative transcripts, which greatly increases the number of RNA transcripts that can be produced from a single gene. Due to this complexity, its unsurprising that a primary cause of Mendelian diseases (including some congenital cardiomyopathies) and other genetic mutations is aberrant splicing (282).
Just as genetic variants produce individualized, or quantitative levels of mRNA transcripts (see section on eQTL), levels of alternative transcripts or splicing events may also be mapped in a quantitative manner (Figure 5). Splicing QTL (sQTL) is the quantitative measurement of isoforms and splicing junctions that are correlated with genetic variants. The process to interrogate these is similar to that of eQTLs, but with one important difference: the counts obtained from a particular transcript in the RNAseq dataset must take splice junctions into account, such that any alternative transcripts produced from the same pre-mRNA are counted and mapped separately. There are numerous approaches available, however, rather than aligning whole transcripts, all sQTL approaches involve searching for splice junctions, then aligning them to a reference genome sequence to determine which exons of the gene are included in or excluded from the transcript. The most common endpoint of sQTL data is to report a given exon’s frequency of inclusion, or “percent spliced in” (PSI) (247). PSI represents the percentage of mRNA transcripts that include a specific exon or splice site, quantitative data that can be treated as a trait and tested for association with genotypes.
Aberrant splicing is frequently the cause of numerous rare and common human genetic diseases (70, 128, 247, 345), including cardiometabolic diseases such as T2D (87). In addition to human subjects, sQTL mapping has been recently applied to species such as pig (186), cow (174), and chicken (138) in efforts to ultimately increase commercially valuable traits such as body growth, food intake, and muscle and fat content.
Although the causal role of splicing variation in monogenic disease is straightforward, the mechanisms by which RNA splicing variations directly contribute to pathogenesis of complex disease warrants further study. In Ma, et al., the authors selected six tissues (subcutaneous fat, tibial artery, blood, left ventricle, skeletal muscle and thyroid) from the GTEx database of splicing QTLs (51) that they deemed important for identifying genes associated with adipose phenotypes (194). Using RNA from subcutaneous adipose tissue and GWAS data on subcutaneous adipose tissue volume, they found a SNP within an intron of the gene FTO that was significantly associated with FTO splicing events, as well as the splicing of a nearby gene, AKTIP, or Akt-interacting protein in the tibial artery and thyroid, demonstrating how associated SNPs do not necessarily need to be within the genes they regulate, and alternative transcripts may be tissue-specific (194). Most sQTLs do not affect overall gene expression, but the majority do affect protein function (179). These variants are mostly located near splice sites and when located in an exon, can be missense or synonymous variants that change splice sites (179). Much like eQTL SNPs, variants involved in splicing control may also be in cis- or in trans- with the genes they regulate (194).
sQTL Resources
The GTEx database currently is the largest repository of human sQTL data, an area of the transcriptome which is often overlooked (270). Exon inclusion levels within this dataset determine a variant’s effect on splicing events, which may include signals from splice junctions, exons, and transcripts, and estimates their relative proportions to each other as PSI, or percent spliced in (51). sQTL from these data are available for nine tissues (subcutaneous adipose, tibial artery, whole blood, left ventricle, skeletal muscle, tibial nerve, sun-exposed skin and thyroid) and were identified by two methods: Altrans (238) and sQTLSeekeR (215). Altrans was primarily used to identify variants associated with exon skipping, while sQTLSeekeR is best suited for more complex alternative splicing, such as mutually exclusive exons (51). Many research groups have developed their own computational strategies for analyzing and calling sQTLs from RNAseq data within their model organism of choice (66, 137, 247, 331, 367). A substantial minority of the sQTLs identified in the GTEx dataset were previously predicted to be eQTLs, thus the majority of sQTLs were novel, suggesting sQTL mapping is better powered to detect subtle changes to the transcriptome caused by alternative splicing (51). When selecting a computational method for sQTL analysis, it is important to consider the following: 1) how much prior knowledge and annotation of the data is needed; 2) are there particular alternative splicing mechanisms the method does not detect, and 3) can the method distinguish between splicing due to different alleles.
Epigenomics and QTLs
Epigenomics refers to a combination of regulatory processes that confer heritable changes to the transcriptome without affecting DNA sequence, such as histone modifications, long-distance chromatin interactions, and DNA methylation. Most known risk loci for T2D (164) and other MetS features reside in non-coding regions of the genome, complicating the process of determining their functional significance (86). These areas are usually thought to serve a regulatory function, and more than 60% of gene regulatory variants affect chromatin-level phenotypes, directly affecting transcription and temporal and spatial control of protein expression, rather than protein functions (179). For instance, the peak SNPs in the gene body of FTO are regulatory elements for another gene, IRX3, which is located approximately 0.5 Mb away (72, 168, 341). Cis-eQTLs such as those are significantly more likely to overlap with promoter and enhancer histone marks than randomly selected control SNPs matched for LD, MAF, gene density and distance to nearest gene (33). Furthermore, variants in promoters tend to exert more influence over nearby gene expression than enhancer variants (262).
In contrast to eQTL, DNA polymorphisms that lead to histone modifications (hQTL) or chromatin changes (chrQTL) physically overlap the peak SNPs that mark the QTL (35). When QTL discoveries map to such a region, they likely are influencing the activity of gene promoters, enhancers, silencers, insulators, mediators, transcription factor binding sites, or disrupting histone positioning and modifications, and they do not always impact the genes nearest to them (67, 86). Some hQTL and chrQTL induce changes to the regulatory superstructure of DNA, by affecting the accessibility of the sequence containing the gene to transcriptional machinery, or by interfering with binding sites for proteins that carry out this task (Figure 6). hQTL and chrQTL tend to have smaller effect sizes than eQTL (151). Small changes, such as single SNPs, can influence chromatin accessibility, DNA folding and gene expression (206).
Figure 6: Genetic Variants Contribute to Gene Expression Changes by Altering Chromatin Organization.
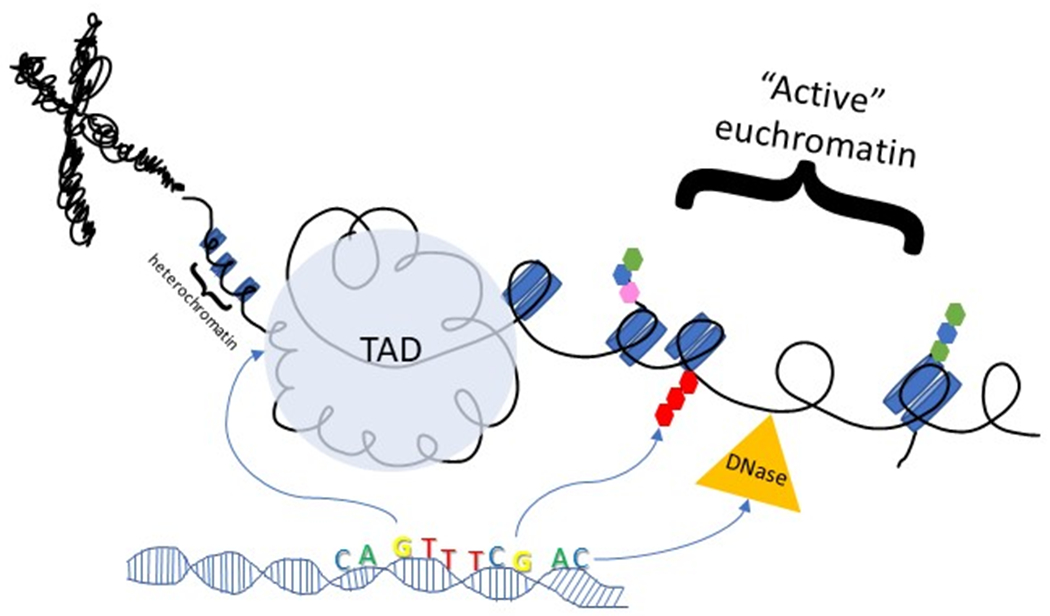
Stretched end to end, each cell contains nearly 2 meters of DNA. The only way DNA can fit within the confines of the nucleus is by extensive compaction into chromosomes, however, DNA is not uniformly compacted. Areas containing genes that are undergoing active transcription (heterochromatin) are more loosely organized to allow access to various DNA-binding proteins and RNA polymerases. These open areas are not protected by any histone proteins and are vulnerable to enzymatic digestion by DNases. As with most proteins, histones contain posttranslational modifications, which change their function to indicate a promotor or enhancer site, or to mark areas of closed chromatin. Long-range chromatin interactions, such as Topologically-Associate Domains (TADs) are indicated by specific patterns of histone marks, allowing them to form a cluster of chromatin loops that bring linearly distant loci close together in three-dimensional space. All of these features display heterogeneity at the sequence level, causing quantitative changes to the transcriptome.
Basics of chromatin organization
The mass of DNA in a eukaryotic cell is only able to fit in the nucleus by extensive compaction and winding around histone protein complexes, or nucleosomes, which together form structures known as chromatin (177). All chromatin, or DNA associated with histones, exists in one of two states: the ‘accessible’ euchromatin, which is uncoiled and transcriptionally active, and transcriptionally silent heterochromatin, which is tightly condensed and is usually extensively methylated (35).
Chromatin is arranged to further compact the genome and facilitate long-range interactions through enhancer looping (160). Enhancers are short stretches of DNA sequence that harbor several transcription factor binding sites (TFBS) to recruit both the transcription factor proteins as well as any other accessory proteins (160). Enhancer loops are regulatory modules, increasing the local concentration of TFBS to recruit transcription factor proteins (TFs) and elicit transcription of nearby genes (224). Enhancers can be modified by SNP changes that change the sequences of TFBS, such that the site is lost, or a new site is gained (160). For example, a risk variant associated with cholesterol and myocardial infarction generates a new TFBS in the SORT1 enhancer, driving its expression (224).
In addition to chromatin’s spatial organization, DNA is bound by a myriad of proteins with regulatory roles, such as histone complexes and transcription factors. DNA strands that are not being actively transcribed are tightly coiled and wound around the histone proteins with various posttranslational modifications, which can either promote or repress transcription. Areas that have acquired numerous activating histone marks are actively transcribed, and the chromatin in these areas is decondensed and looped on itself to bring trans-associated genes together to promote transcription (35).
Like many other proteins, histones may have posttranslational modifications that affect their functionality (364) , and have measurable and quantitative effects on gene expression (265). Histone QTL or hQTL are indicated by allele-specific imbalances in the proportions of histone marks at a particular locus (252). Histone modifications may denote enhancers, silencers, TFBS, open or closed chromatin (117), and studying these is useful for identifying novel transcriptional regulators of a cardiometabolic phenotype (265). There are numerous histone modifications, but the most studied are modifications to histone 3: H3K4me3, H3K4me1, and H3K27ac, respectively denoting active promoters, enhancers, or both. Heterochromatin also has histone marks that signify transcriptional repression, H3K27me3 and H3K9me3 (280, 364).
Methods for hQTL and chrQTL mapping
Chromatin accessibility to chemical or enzymatic digestion is a common marker of open regions (242), and when these are small, can be used to infer binding of proteins such as individual transcription factors in a process called “footprinting” (164). Footprinting methods such as DNase I digestion and sequencing (DNase-seq) and the more modern assay for transposase-accessible chromatin sequencing (ATAC-seq) are used to determine where regulatory elements are binding to DNA, and to generate chromatin maps that may be associated with a chrQTL, or a chromatin level QTL, when there are allele-specific imbalances in chromatin accessibility, or between two DNA interactions (164). These methods can tell whether a protein is bound to the DNA, but they cannot identify that protein, nor can they functionally validate its relevance to gene expression (164).
At the heart of all hQTL and chrQTL mapping experiments are the basic techniques of chromatin immunoprecipitation sequencing, or ChIP-seq, and chromatin conformation capture, or 3C (160, 281). These basic methods are the foundation of the field of histone QTL research, as the methods of most studies as based on these, but with additional complexity to either increase the scale of data generated, or to answer more agnostic questions (177). The specific details of these methods are reviewed elsewhere (177, 281), however, with both methods, DNA is crosslinked to interacting proteins (such as histones or TFs) or sequences, and the DNA binding partners are directly assessed with PCR or sequencing (281) after reversal of crosslinks. Samples can be immunoprecipitated with antibodies to a TF or specific histone modification (281). ChIP-seq was used in the RI rat BXH/HXB panel to identify a large hQTL hotspot in heart, overlapping with mediator complex subunit 22 (Med22) controlling almost 900 different H3K4me3 histone marks (265).
For the purposes of this review, however, we will focus on methods that are amenable to QTL mapping. Circular chromosome conformation capture (4C) sequencing and Capture-C approaches are used to identify all DNA contacts with a sequence of interest, such as an enhancer, or the DNA sequence in contact with a disease-associated SNP (27, 160). 4C was used on kidney endothelial cells to find the target genes interacting with 39 chronic kidney disease-associated susceptibility loci and identify putative candidate genes for chronic kidney disease (27). Capture-C is a more scalable version of 4C, in which biotinylated probes are hybridized to promoters, pulled down and sequenced to detect functional enhancer-promoter pairs (108). This method was recently used to identify a genetically regulated enhancer mark (H3K27ac) in human liver, underlying GWAS associations with LDL cholesterol, triglycerides, and total cholesterol levels (33).
Genome-wide Hi-C is a high throughput technique to test all possible pairwise DNA interactions (117, 160), that potentially allows all chromatin contacts to be studied at once (195). Hi-C has been used to identify novel loci associated with heart failure (309), T2D (116, 210), adiposity (74, 244) , and other cardiometabolic disease traits (85, 216). Integrating these techniques with published datasets, aka “fine-mapping” provides insight into functional roles of novel variants of uncertain significance and as evidence of refinement in putatively trait-relevant gene, regulatory element, and variant identification in any individual GWAS locus for a complex disease.
meQTL-methylation patterns as a quantitative trait
DNA methylation is another type of epigenetic change that typically serves as a transcriptional repressor. Though cytosines are typically methylated by DNA methyltransferases (DNMTs) (140), vertebrates have an exception to this: the CpG island (348). CpG dinucleotides are the functional unit of DNA methylation, and in CpG islands near promoters—which are G+C-rich sequences longer than 200bp—cytosines are typically demethylated (348). This promotes transcription, particularly when found close to a gene that is actively transcribed. The patterns of methylated CpGs and locations of CpG islands produced are a quantitative trait which may be mapped to identify novel disease associations affecting transcriptional repression. meQTLs are changes to the methylation status of CpG islands which can be genetically influenced, accumulate with aging, or be altered by environmental exposures (112, 129, 359).
CpGs can serve as biomarkers of disease (59, 140), and epigenome-wide association studies (EWAS) have found differentially methylated CpG that are associated with disease states, but not necessarily the genetic code, per se (129). Since the methylome is responsive to numerous lifestyle stressors and aging, results from EWAS may arise due to the disease state, rather than some genetic causal role (129). meQTLs, however, are caused specifically by heritable DNA changes, such as SNPs, and while their actual methylation profiles are highly tissue-specific and sensitive to environmental changes, the DNA sequences themselves will not (140). This lends additional complexity to interpretation of methylome data, as the same SNPs may not lead to the same DNA changes, due to some underlying confounder with the subjects’ current or past environments. As with any study of molecular QTL, selecting well-matched test subjects and accessible, disease-relevant tissues can be challenging (140).
Finally, meQTLs may be responsible for differences in the symptoms, pathogenesis, and outcomes in MetS across populations (12). For instance, not all individuals who are defined as obese according to BMI have other MetS traits, nor does everyone with MetS develop cardiovascular disease (78). Visceral adipose tissue from severely obese men with and without MetS was examined for differential methylation, and meQTL were mapped (118). These experiments revealed 2182 meQTLs that controlled methylation at 174 CpG sites, including 2 in the gene COL11A2, which also showed association with fasting plasma glucose levels (118). Other genes that have been implicated using meQTL mapping include KLF13 (156) and MCR4 with childhood obesity (310), CDH13 with low-density lipoprotein and diastolic blood pressure (254), CRTC1 with food and alcohol consumption behavior (267), and TOMM20 (65) and ARPC3 (64) with hypertriglyceridemia.
Methods for meQTL mapping and EWAS
The majority of GWAS catalog index SNPs are found in cis-meQTLs, many of which are also associated with individual MetS traits, such as obesity (36, 321), T2D (149), coronary artery disease (318), or in combination (326, 334). Differential DNA methylation has been found on hundreds of genes in conjunction with MetS phenotypes in humans using epigenome-wide association studies (EWAS) (213). Epigenetic quantitative traits, such as allele-specific methylation patterns can be mapped using meQTL methods, namely genome-wide sodium bisulfite sequencing, which is comparatively easy and cost effective. Briefly, DNA is treated with bisulfite to deaminate unmethylated cytosines, thereby converting them to uracil, however, because most cytosines are naturally methylated (mC), they will still be read by the sequencer as a cytosine. On the other hand, cytosines in CpG islands are not methylated, thus are unprotected from deamination and are converted to uracil, then thymine (319). For the analysis, one simply counts the instances of C to T conversions. For comprehensive reviews of this process and protocols, see (319, 348).
An important conceptual difference to bear in mind when interpreting meQTL data is that methylated DNA is highly dynamic and fluctuates in response to numerous environmental factors (256). Despite their identical genomes, even monozygotic twins do not have identical epigenomes, suggesting that subtle differences in their environments play a large role in gene expression and genetic regulation (256). There is ample evidence suggesting that in utero and early childhood environment can affect the epigenome, and impact disease risk for several complex diseases, including MetS and T2D (256). In addition to epigenetic modifications increasing disease burden, epigenetic variation can also arise because of disease, and this is an important distinction when evaluating any potential markers associated with a differential methylation. For instance, blood from children enrolled in the UK Avon Longitudinal study of Parents and Children (ALSPAC) was sampled serially in early childhood and late adolescence and assessed for CpG methylation to look for associations between methylation patterns and bodyweight from birth through their first birthday (266). They found 2 CpG sites (cg0013791 and cg11531579) which were associated with rapid weight gain in infancy, and methylation at cg11531579 was also associated with obesity in adolescence (266). Because no blood was taken from the children as infants, it is impossible to know whether the methylation associated with rapid weight gain was causal or consequential when the children were first examined years later (Robinson). With that major caveat in mind, it is unsurprising that attempts to assess causality are often unsuccessful (162).
Resources for hQTL, chrQTL, and meQTL
Alterations to energy metabolism are a recognized cause of hypertension, obesity and other adverse cardiac events that contribute to cardiometabolic disease (CMD). It is generally understood that the development of disease states will involve differences in gene expression, protein, and metabolite levels. In complex diseases, however, the relationship between gene expression and disease is not always straightforward. Particularly because most SNP associations are in regulatory regions of the genome, information about the three-dimensional context of that SNP can be informative. There are several epigenome resources useful for curation, analysis, and interpretation of these SNPs (Table 4). The ENCODE Project has human and mouse data on chromatin structure, accessibility, interactions, chromatin modifications for analysis of the methylome and transcriptome, and is a source for identifying how a given genomic position might function in a regulatory context (49). Other resources that are similar are the International Human Epigenome Consortium (IHEC) Data Portal (30) and 3D SNP (190). All three are useful to find out whether non-coding SNPs might be in a regulatory element, and if so, if they are particularly important in some tissues, however, none of them are strictly designed to search for hQTL, chrQTL or meQTL. The EWAS Catalog (14) and the Functional mapping and annotation (FUMA) of GWAS (337) source have been developed to accommodate mapping of molecular QTLs. The EWAS Catalog is specifically a database of DNA methylations, so it is particularly good for CpG-trait associations (14). FUMA is a bit more versatile and is designed to take more of a systemic approach, but much of the data requires an account to access (337).
Table 4:
Epigenomic Resources for QTL mapping
| Encyclopedia of DNA Elements (ENCODE) | Contains experimental information from ChIP-seq, ATAC-seq, Hi-C, and whole genome bisulfite sequencing data for human and mouse; data is integrated with USCS Genome Browser for visualization (62, 191) | https://www.encodeproject.org/ |
| Functional Mapping and Annotation (FUMA) of GWAS | Standardized toolset to prioritize candidate genes from GWAS data inputs, using 18 data repositories and tools; output includes predicted SNP functions, chromatin states and 3D interactions (337) | https://fuma.ctglab.nl/ |
| MRC-IEU EWAS (Epigenome-Wide Association Study) Catalog | Contains SNPs influencing epigenetic QTL extracted from EWAS literature, performed 41 EWAS on SNPs in the GEO database (14) | http://www.ewascatalog.org/ |
| International Human Epigenome Consortium | Produces reference epigenome maps from curated datasets in >600 tissues. Contains contributions from ENCODE with a portal of several additional analysis tools to search by tissue source or assay type (30) | https://epigenomesportal.ca/ihec/ |
| 3DSNP Database | Database containing 3D and local chromatin interaction data from 3C-based high throughput methods. Useful for predictions on the effects of putative regulatory SNPs based on chromatin structural information (190) | http://cbportal.org/3dsnp/ |
Resources containing published human and animal epigenetic data, designed for use in QTL mapping, or in silico predictions of candidate genes
QTLs that modify proteomes
In complex diseases, the relationship between gene expression and disease is not often straightforward. Alterations to energy metabolism are a recognized cause of hypertension, obesity and other adverse cardiac events that contribute to CMD. It is generally understood that the development of disease states will involve differences in gene expression, protein, and metabolite levels, but the precise order and timing of these is not clear. Even in end stages when one might suppose that biomarkers would be more homogenous, this is usually not the case. While GWAS are a powerful tool to discover novel loci in the context of complex disease, they fall short on teasing apart the nuances involved in these relationships. Although alterations to the transcriptome are important genetic underpinnings of disease, investigations of dysregulated metabolites and proteins often have more direct functional relevance. These are often easier to access than disease-relevant tissues from human subjects, as up to 15% of all proteins are thought to be secreted into the circulation (81). Various regulatory processes spatially and temporally control every aspect of protein synthesis, as well as their abundance and functionality. The dispensation of metabolites, specifically their absorption, distribution, metabolism, and excretion, are all under some degree of genetic control. Levels of a biomarker such as a circulating protein or metabolite are quantitative traits under some degree of genetic control, and the genes relevant to them can be identified and mapped through large scale genomics and high throughput proteomics and metabolomics. Thus, study of these molecular and mechanistic QTLs is not only relevant to basic scientists and geneticists, but to clinicians and clinical researchers as well.
pQTL-protein levels as a quantitative trait
DNA sequence variants can exert genetic control on protein expression to produce an allelic imbalance, and this is due to the same mechanistic changes that alter that genes’ transcription, with additional levels of regulation that are specific to the protein itself, such as those involved in translational regulation, protein stability, structure, and localization (45). Consequently, there is often poor correlation between a transcript’s expression and the abundance of the resultant protein. In fact, most protein-locus associations explain up to two-thirds of the observed variability, indicating that protein levels are best interpreted in their genetic context (366). A recent study by Benson, et al, performed GWAS and exome array analysis on the Framingham Offspring participants, specifically looking for genetic associations with levels of all 156 proteins that contribute to Cardiovascular Disease Risk Score (18). Most of their associations had not been previously identified, and collectively explained as much as three times more inter-individual variability than other common clinical parameters, such as sex, diabetes status, obesity, or diet (18).
Protein QTL, or pQTL, may be local or distant from the protein they regulate. Local pQTL are generally variants that contribute to splicing differences or nonsynonymous amino acid changes, whereas distant pQTL are thought to be master regulators of post-transcriptional mechanisms (45). Genes with an overlapping eQTL and pQTL have a higher concordance between gene expression and protein levels in vivo—in fact, many eQTL SNPs identified may also be a pQTL (45, 355). On the other hand, distant pQTL usually act on numerous genetically distant proteins, but are rarer than local pQTL, and usually do not overlap with known eQTL, and are thought to affect post-transcriptional mechanisms (45).
With MetS and other non-communicable inflammatory diseases, genetics and environmental triggers drive phenotype expression in a population. The high fat/high sucrose “Western diet” is an environmental stressor that has numerous consequences to homeostasis, such as deleterious immune responses (153). Several proteomics studies have leveraged this diet using large DO mouse cohorts to discover changes in protein expression due to diet and successfully mapped pQTL for numerous traits, including insulin sensitivity and secretion (153) and fat and cholesterol metabolism (45).
To study pQTL, one must have a sufficiently high-throughput assays and analysis for comprehensive identification of both entire proteomes and entire genomes (358). The main methods to do this are essentially split between aptamer-based technologies and mass spectrometry. Mass spectrometry measures proteins (or any other particle) by ionizing them and accelerating the mixture through an electric or magnetic field (289). The particles travel to a detector, moving based on the ratio of mass and charge, and this output is subsequently matched to known proteins using computational analysis (289). This method is extremely successful for quantifying specific proteins and is best used when identifying novel pQTL for a small number of known proteins, or metabolites (91). Mass spectrometry can be used as a more unbiased tool, but sensitivity and precision will suffer, and it is not well-suited to detect novel particles. Aptamer-based proteomics are another method of high-throughput protein quantification that is designed to be unbiased and handles novel substrates easily. Aptamers are affinity reagents, akin to antibodies except aptamers are nucleic acid based (18, 289). Much like antibodies, aptamers can fold into complex shapes to interact with a specific target, are highly stable and specific, and have uniquely identified over 4000 individual human proteins (18, 81). Much of the data generated in pQTL or proteomics studies are available in public repositories (Table 5) (303).
Table 5:
Available Proteomics/Metabolomics resources
| Proteome Xchange | Standardization and dissemination of mass spectrometry proteomics datasets for several species, tissues, and experimental conditions (69) | proteomexchange.org |
| UniProt | Contains proteomics data for tens of thousands of species with fully sequenced genomes (312) | uniprot.org |
| Biological General Repository for Interaction Datasets (BioGRID) | Curated resource of experimentally supported protein-protein and genetic interactions, includes themed projects related to cardiovascular disease and diabetes (241) | thebiogrid.org |
| Search Tool for the Retrieval of Interacting Genes/Proteins (STRING) | Resource for predicted protein interactions as well as published data, provides confidence scores for biological relevance of predicted interactions (302) | string-db.org |
| METLIN | Tandem mass spectrometry (MS/MS) database, helps identify known and unknown metabolites, includes lipids, amino acids, nucleotides, carbohydrates, toxicants, drugs and drug metabolites (217) | metlin.scripps.edu |
| MetaboLights | Cross-species database of metabolomics studies, experimental data and metadata (122) | ebi.ac.uk/metabolights/ |
| Human Metabolome Database | Comprehensive human metabolomic database, including information on biological role, physiological concentration, disease associations, pathways and reference spectra from MS/MS, GC-MS and NMR (342) | hmdb.ca |
Databases containing human and animal metabolomic and proteomic datasets
mQTL-levels of metabolites as a quantitative trait
Metabolites are a diverse array of small molecules that include amino acids, carbohydrates, nucleosides, and lipids and represents the downstream effects of alterations to the genome, transcriptome and/or proteome (60, 336). Direct measurement of all manner of these is routine in clinical practice, using methods such as nuclear magnetic resonance (NMR) and liquid or gas chromatography coupled with mass spectrometry (LC-MS or GC-MS, respectively) to assess the metabolome (8, 39). The nuances of LC-MS, GC-MS, and NMR methodology have been extensively reviewed (8) and thus will not be covered here. In general terms, however, both LC-MS and GC-MS rely on complex instrumentation that both ionizes and fragments components of a sample to separate those components based on mass and charge (53), while NMR uses magnetic fields to spin nuclei in characteristic ways that are modified by their local environments (82). Although NMR can be used to detect several different atomic spins, virtually every metabolite contains at least 1 hydrogen atom, so 1H-NMR is most often used (82). Because preparation does not destroy samples, NMR is the only method that can be used for longitudinal studies or living samples. For samples where this is not a concern, LC-MS or GC-MS are favored, as they are more sensitive than conventional NMR.
The Catheterization Genetics, or CATHGEN study, utilized systems genetics to identify novel metabolite markers of cardiovascular health. CATHGEN study subjects were recruited based on high risk for adverse cardiac events, and all underwent cardiac catheterization, and yearly follow-ups, as well as collection of DNA and plasma for genotyping and mQTL mapping (158). In subsequent studies, Kraus et al. found that levels of certain carnitine derivatives were heritable and powerful predictors of cardiac events, despite no clinically significant atherosclerosis at the time of their procedure (159). They also discovered significant associations between a SNP in HERC1, an E3 ubiquitin ligase, and levels of short chain dicarboxylacylcarnitine levels, and observed increased mortality from CVD events in carriers of the minor, G allele (159). Most of the other identified genes were also involved in the ubiquitin proteasome arm of the endoplasmic reticulum or ER, stress response, implicating these mechanisms in the pathogenesis of CVD.
Not all metabolites of interest to cardiometabolic disease circulate in the body, but these are difficult to assess in humans, since many human tissues are not readily available in disease states and are especially difficult to obtain from healthy controls. Animal research into metabolomics can fill this gap, and species utilized for phenotypes related or analogous to cardiometabolic disease are leveraged to great effect. The work of Dumas, et al 2016 on Type 2 diabetes mellitus (T2D) is an excellent case study in how metabolomics can be integrated with conventional QTL mapping to uncover novel genes or to prioritize a subset of a long list of candidate genes or variants (76). This study employed a congenic panel of 12 substrains derived from regions of spontaneously type 2 diabetic Goto-Kakizaki (GK) rat chromosome 1 introgressed onto the background of normotensive Brown Norway (BN) (76), and measured a variety of metabolites of interest. They discovered a significant QTL containing Asns, which synthesizes asparagine via the hydrolysis of glutamine, a TCA-cycle replenishing substrate. This systems genetics approach implicated the importance of Asns in the context of metabolic dysfunction in Type 2 diabetes and by combining adipose tissue expression data with this analysis, the authors were able to effectively prioritize candidate genes to construct a novel molecular network.
While circulating metabolite levels are beneficial for predicting cardiovascular disease outcomes, some metabolite concentrations are very tightly regulated in the blood, and thus have little detectable variation. The kidney is a major excretory organ of metabolites, as well as the most important regulator of their reabsorption, which allows the kidney to control the concentration of these metabolites (157, 178). Unlike blood, urine components can vary widely in concentration; these levels can be assessed quantitatively, and associations can be genetically mapped. Due to the high incidence of hypertension in the general adult population and the subsequent damage that is inflicted on the kidneys, it is unsurprising that approximately 10% of adults have chronic kidney disease. A study by Schlosser, et al measured over 500 metabolites that are excreted in urine, using a biobank of approximately 1000 urinary samples from human GCKD study subjects with poor kidney function (279). One of their goals for this dataset was to assess how genetic variants would affect the weakened kidney’s ability to metabolize and excrete the drugs that are commonly given to manage this disease. These data were then leveraged to replicate 80 QTL that had previously been associated with CKD, as well as identifying 160 novel loci (279).
In addition to drug metabolism variation inherent to a disease state, a large proportion of the adult population carries genetic variants that are associated with significant levels of one or several metabolites (311). Perhaps the most directly translational application of metabolomic QTL is in the context of personalized medicine, or pharmacogenomics, which is the union of clinical pharmacology and genomics. Current pharmacotherapies for cardiometabolic diseases employ drugs such as metformin for T2D (94), beta-blockers for hypertension (71, 249) and statins for coronary artery disease (209). The genetic variance is such that no drug works optimally for everyone (94), and many of these drugs are ineffective or even toxic to a subset of people. As with all complex diseases, numerous loci in an individual contribute to an additive polygenic risk score (PRS) (193), which provides meaningful predictions for drug responses, especially when integrated with routine lab work of circulating biomarkers (209, 311). The metabolism and excretion of drugs is heavily influenced by genetic variation, and integration of these approaches has the potential to strengthen clinical trials and aid in drug development (75).
For CMD, metabolites of interest such as lipids, amino acids, and their organic derivatives in cells, tissues, or biofluids often serve as measures of organ and organismal health in humans, as collection is minimally invasive (167). Furthermore, the metabolome is more labile than the genome or transcriptome, and in the age of genetically personalized medicine, changes in the metabolome may be more amenable to predictions of disease risk, pathogenesis, and drug response. Thus, mapping mQTL or metabolite QTL to genomic positions that influence these features is understudied, but critically important to illuminate new mechanisms of disease pathogenesis, as well as therapeutic targets.
What to do once you have a QTL?
QTL mapping projects provide correlations to a trait or disease but are not designed to prove a locus is causal for its associated quantitative trait. Single QTL investigations are also limited in that they only can identify variants related to the single quantitative trait under investigation, largely ignoring all others. In contrast, multi-omic (xQTL) or systems genomics approaches converge on suspected causal genes using multiple lines of inquiry (222). This type of QTL may be regarded as mapping pathway enrichment as a phenotype, and may be better able to guide future experiments into productive downstream research and clinical applications (283). For complex diseases such as MetS, multi-omic analyses that consider the additive effects of multiple traits, such as metabolites and gene expression, are often better powered to detect variants of small effect size and frequently leverage model organisms (356).
The process of identifying causal genes from an association can be broken down into three general techniques: in-silico methods to find variants and prioritize candidate genes, breeding animals with reduced genetic complexity or fixed genomes to assess the functions of the candidate genes in their genomic context, and then finally, mechanistic studies of a putative locus with targeted genome editing. These steps will be discussed below.
In-silico methods to prioritize candidate genes
The prioritization of candidate genes from a QTL is a complex process that depends entirely on the size of the QTL and how it was identified. QTL may be broadly sorted by size into 2 categories: small QTL less than 1 Mb that contain 1 or only a handful of genes, and large QTL >1Mb that contain tens, hundreds, or thousands of genes. QTL have been identified using basic crosses, and mapping populations, such as F2s for most of the history of QTL mapping in rodents. These groups are well powered to detect associations, but resultant QTL are enormous, usually spanning tens of megabases of genome and possibly thousands of genes. However, it is impractical to generate tens or hundreds of mutant cell lines or animals to evaluate a QTL in a biological context without further prioritization. In these cases, the investigator may choose to increase the resolution of the QTL with additional n, or to generate another type of cross that reduces the size of the QTL. The incorporation of additional molecular QTL, such as gene expression or protein QTL, may also be used. These options are substantial investments in both time and cost, so an alternative approach may to utilize the available computational tools to help reduce the size of the QTL or the list of candidate genes to a more manageable level (277). These approaches are inexpensive and relatively quick to conduct but cannot prove or disprove a hypothesis without evaluation in vivo.
Highly outbred populations such as humans, or carefully outbred rodents usually produce small QTL, however, the majority of rodent QTL are larger than 1Mb. For sufficiently large human GWAS or rodent datasets, any identified QTL will be small (1Mb or less), but 1Mb of DNA can still contain many genes. When the number of genes in the QTL is small, candidates for further analysis are generally prioritized by proximity to the lead SNP (i.e. the gene body closest to or containing that SNP is the prime candidate). Sometimes, lead SNPs lie within the causal gene, such as the SNPs in FURIN (362) and JCAD (141) that are associated with coronary artery disease. These instances are comparatively rare, however. Oftentimes, the causal variant is quite far from the associated gene body, as is the case with the LDL-cholesterol associated SORT1 locus (333).
Rodent QTL datasets have enormous potential for replication and validation, as essentially any tissue is accessible, but they currently cannot match the scope of available human datasets. Human molecular QTL datasets that span many tissue types are useful, but not all tissues are available. Despite the wealth of human molecular QTL data that has been collected so far, any identified loci may not replicate in tissues of interest, because QTL and the underlying molecular mechanisms are generally tissue-specific (314).
Breeding strategies for fine-mapping QTL
Large QTL originally identified from backcrosses or F2 intercrosses might span entire arms of chromosomes, making the causative variant difficult to identify from lists of thousands of genes, or variants. Genetic manipulation immediately following these types of crosses is simply not practical without additional filtering and prioritization. When single variants with small genetic effect sizes are suspected to be the cause of a phenotype or disease risk, most of the time the phenotype is observed in the discovery population because the linked locus is the result of several linked variants working in concert to confer disease risk. Computational approaches are useful for narrowing down and prioritizing candidate genes within these regions, but in the long run, all candidates must be evaluated in a biological context. When the causal variants interact with environmental factors or other genomic loci, there are two basic approaches to prioritize candidates: decreasing genomic complexity to target specific QTL, or increasing mapping resolution (123).
To target specific QTL, one may wish to produce “knock in” animals using a congenic or consomic approach (54, 163, 257, 268), where the genomic region (congenic) or the chromosome (consomic) containing the QTL is selectively bred into a different genetic background using iterative backcrosses. In a generation, backcrosses tend to have 10-15 recombinations, distributed throughout the genome (341). When no recombination occurs within the chromosome of interest, the donor chromosome can be fixed in the genetic background of the recipient by sibling mating to produce a consomic line, which is an inbred strain. As animals are subsequently backcrossed, introgressions of donor chromosomes get progressively smaller as they are broken up by recombination, allowing for fine mapping of the QTL. If the phenotype of interest was lost between one backcross and the next, this suggests the recombination has maximally shortened the donor locus, and QTL is refined to the minimum length the retains the phenotype. Once this has taken place, the strain can be maintained by brother-sister mating, or intercrosses, to fix the genomes and remove any residual heterozygosity, establishing a congenic line to refine the QTL identified by the backcross. This process can be sped up with marker-assisted breeding but is still quite slow and requires multiple generations of backcrosses to fix the genomic background, then multiple generations of intercrosses to produce homozygous congenics. Further efforts to shorten these QTL can be accomplished with additional periods of backcrosses and intercrosses to make subcongenics. Congenic and subcongenic strains are useful for follow-up studies of a QTL, as they are inbred and reproducible, and can always be further backcrossed for additional fine mapping. Congenic mapping approaches have been used extensively to map QTL and identify genes related to lean body mass (181), obesity (212), T2D traits (76, 130, 278, 324), hypertension (55-57). For an excellent review on mapping with consomics, congenics, and subcongenics, see (54, 257)
Another strategy for fine-mapping QTL is to perform a reduced complexity cross, in which nearly isogenic animals with divergent phenotypes are crossed to facilitate gene discovery, such as between two substrains (29). When animals have limited genetic diversity, there are fewer segregating loci to genotype for increased resolution, which increases QTL size. However, the large QTL that are generated will have fewer candidate genes and variants, sometimes by orders of magnitude (29). For example, C57Bl6 mouse substrains differ from each other by about 10,000 SNVs (234), yet consistently display significant differences in susceptibility and propensity to strokes (363), diet-induced obesity (134), and glucose tolerance (95, 134).
With outbred animal models or human populations, QTL are usually much smaller than those identified by F2, RI, AIL, or other animal breeding methods. The disadvantage is there is no inbred animal to use for further functional validation of single genes or variants. For QTL identified in outbred animal models, the best practice would be to turn to available inbred founder genomes and identify ancestral haplotypes that confer risk. These types of followup studies are beneficial to isolate the effects of QTL on single chromosomes, since all mapping populations have genome-wide diversity, and may have QTL on other chromosomes that interact in unpredictable ways with the locus of interest.
Molecular and genome-editing strategies for validating causative loci
Although thousands of loci have been discovered in traits relevant to MetS, very few are replicated or validated due to perceived lack of impact. If individual loci only contribute modestly to a disease phenotype, a simple knock out experiment involving only the most plausible candidate gene may not yield physiologically significant results. Indeed, when a locus has a very small effect, the effect can be easily hidden within the range of normal phenotype variation, and may still require large sample sizes and careful control of all other genetic and environmental elements to be detectable. There are several options for how to do this: reporter assays to test putative regulatory elements, positional cloning to test the function of candidate nucleotides, and genetic manipulation of genes in cells or animals.
Reporter assays are used to test the function of putative promotor or enhancer variants. Sequences that contain the suspected regulatory element are cloned into a cell type of interest, and some sort of reporter (typically fluorescence) is used to quantify the strength of that element and is directly comparable to its effect on gene expression. This approach works well for validation of cis eQTL but may fail if the complete element is extremely large or some additional endogenous and epigenomic context is necessary (183). The approach does not work for validation of splicing QTL, nor histone or chromatin QTL, as this highly artificial system lacks splicing signals as well as epigenomic chromatin information.
Induced pluripotent stem cells (IPSCs) have greatly expanded the toolbox of genotype-phenotype interactions and what is possible to test. IPSCs are cells that are harvested from humans (typically with a blood sample or skin biopsy) and are treated to return to a primordial, undifferentiated state. These cells can be used as is, or redifferentiated into theoretically any cell type. In contrast to most commercially available immortalized cell lines with abnormal genetic architecture, IPSCs retain the genome of the donor. These are a renewable resource which can be used to functionally test human cell types of interest that may normally be difficult to obtain (172). IPSCs can also be genetically modified and have been used to show that eQTL mapping for lipid expression traits (335) or insulin sensitivity (38) is possible in large cohorts. These have also been used for functional analysis in cell cultures as a surrogate to inbred animal models. IPSC-based experiments are mainly useful for functional validation of molecular phenotypes, and not for broader, organism-level phenotypes such as body weight or blood pressure.
Finally, the use of knockdown, overexpression and knockout experiments are perhaps the most useful modes of validation, as they are the most translational and have the best chance to validate all types of QTL and/or GWAS loci. In cells, this has been done using siRNA to silence or remove transcripts of choice in cells to investigate physiological changes when genes in the QTL are absent, and to measure relevant outputs, such as insulin secretion (278), and leptin expression and secretion in response to insulin (37). Another approach is to use site-directed mutagenesis to interrogate the function of candidate nucleotides. These methods are suitable when validating the function of single SNPs directly (such as if a SNP is in a putative splicing QTL) by making both alleles and then measure the splicing and comparing the proportions of alternative transcripts.
Arguably, the best method to functionally validate a GWAS locus would be to generate a mutant, inbred animal to study a candidate gene’s physiological role, but this is hardly ever done for several reasons. The theoretical limit of detection in a mapping experiment is roughly 100kb, which is a large enough area to contain several genes in LD (257), and possibly multiple SNPs that may all influence the overall phenotypic variance (93). This was elegantly demonstrated by Flister, et al, who used ZFNs to target all six genes within a rat blood pressure locus and found that three of them increased hypertension susceptibility, while two others decreased risk (93). Targeting of individual genes to validate a MetS-related QTL has been conducted in genetically-modified mouse embryonic stem cells, and have confirmed roles for atherosclerosis loci (120), body composition and weight gain (68). Now that usage of the CRISPR-Cas9 system has made widespread genome-editing possible, many will increasingly turn to inbred, genetically-modified animals to validate their QTL findings. This was demonstrated recently in Keller, et al; where the Ptpn18 locus was identified as a high priority candidate from a screen of non-diabetic DO mice, and the CRISPR-mediated mouse knockout of Ptpn18 has catalytically inactive protein and improved insulin sensitivity (153).
Concluding remarks
Most of the genome is comprised of intergenic regions, or the space between genes, thus most identified QTLs overlap with these areas, where the effect of the variant on disease etiology is not obvious (160). Intergenic DNA is thought to serve a regulatory function (164), dictating when, where and how a protein is expressed, so it cannot be entirely ignored. In addition, many of the protein-coding genes in the genome have been associated with disease in some human GWAS study, however, only about 5-10% of these are ever studied further (283). Considering that most of the heritable variation of complex traits and diseases is still not fully accounted for, it follows that many important genes and intergenic variants that regulate them may not be studied enough (298). Knowing how these understudied genes affect complex phenotypes and diseases such as MetS will be vital to helping prevent MetS, and deaths due to complications of CVD, stroke, or type 2 diabetes. There is a wealth of phenotypic and molecular data available to be studied in animal models and humans that can be leveraged as outlined in this review. Integrating these multi-omic QTL data for complex diseases such as MetS provides a means to unravel the pathways and mechanisms leading to complex disease and promise for novel treatments.
Didactic Synopsis:
Major teaching points:
1: Complex diseases result from the action and interaction of multiple genetics factors and environmental stressors, where the actions of single genes are insufficient to cause a phenotype.
2: Quantitative traits are continuous measurements (such as body mass index, or systolic blood pressure), and these can physically map to a portion of the genome that controls the variation in that phenotype, and these areas are known as quantitative trait loci (QTL).
3: Genome-wide association studies (GWAS) are used to identify genetic markers associated with complex traits or disease susceptibility. In animal populations, QTL are typically mapped using experimental crosses or in outbred populations.
4: Quantitative traits include organismal phenotypes such as body weight, or subcellular and molecular traits, such as the expression level of a gene or the abundance of a circulating metabolite.
5: Systems approaches are well suited for identifying the genetic regulation of MetS, and there are numerous resources that can be applied to characterize the pathways and mechanisms that contribute to MetS.
References:
- 1.eQTL Analysis. Springer; US. [Google Scholar]
- 2.Abu-Toamih Atamni HJ, Ziner Y, Mott R, Wolf L, and Iraqi FA. Glucose tolerance female-specific QTL mapped in collaborative cross mice. Mamm Genome 28: 20–30, 2017. [DOI] [PubMed] [Google Scholar]
- 3.Aguilar-Salinas CA, and Viveros-Ruiz T. Recent advances in managing/understanding the metabolic syndrome. F1000Res 8: 2019. [DOI] [PMC free article] [PubMed] [Google Scholar]
- 4.Aitman T, Dhillon P, and Geurts AM. A RATional choice for translational research? Dis Model Mech 9: 1069–1072, 2016. [DOI] [PMC free article] [PubMed] [Google Scholar]
- 5.Albert FW, and Kruglyak L. The role of regulatory variation in complex traits and disease. Nat Rev Genet 16: 197–212, 2015. [DOI] [PubMed] [Google Scholar]
- 6.All of Us Research Program I, Denny JC, Rutter JL, Goldstein DB, Philippakis A, Smoller JW, Jenkins G, and Dishman E. The “All of Us” Research Program. N Engl J Med 381: 668–676, 2019. [DOI] [PMC free article] [PubMed] [Google Scholar]
- 7.Allen NE, Sudlow C, Peakman T, Collins R, and Biobank UK. UK biobank data: come and get it. Sci Transl Med 6: 224ed224, 2014. [DOI] [PubMed] [Google Scholar]
- 8.Amberg A, Riefke B, Schlotterbeck G, Ross A, Senn H, Dieterle F, and Keck M. NMR and MS Methods for Metabolomics. Methods Mol Biol 1641: 229–258, 2017. [DOI] [PubMed] [Google Scholar]
- 9.Amberger JS, and Hamosh A. Searching Online Mendelian Inheritance in Man (OMIM): A Knowledgebase of Human Genes and Genetic Phenotypes. Curr Protoc Bioinformatics 58: 1 2 1–1 2 12, 2017. [DOI] [PMC free article] [PubMed] [Google Scholar]
- 10.Aten JE, Fuller TF, Lusis AJ, and Horvath S. Using genetic markers to orient the edges in quantitative trait networks: the NEO software. BMC Syst Biol 2: 34, 2008. [DOI] [PMC free article] [PubMed] [Google Scholar]
- 11.Baker CL, Walker M, Arat S, Ananda G, Petkova P, Powers NR, Tian H, Spruce C, Ji B, Rausch D, Choi K, Petkov PM, Carter GW, and Paigen K. Tissue-Specific Trans Regulation of the Mouse Epigenome. Genetics 211: 831–845, 2019. [DOI] [PMC free article] [PubMed] [Google Scholar]
- 12.Barajas-Olmos F, Centeno-Cruz F, Zerrweck C, Imaz-Rosshandler I, Martinez-Hernandez A, Cordova EJ, Rangel-Escareno C, Galvez F, Castillo A, Maydon H, Campos F, Maldonado-Pintado DG, and Orozco L. Altered DNA methylation in liver and adipose tissues derived from individuals with obesity and type 2 diabetes. BMC Med Genet 19: 28, 2018. [DOI] [PMC free article] [PubMed] [Google Scholar]
- 13.Barrett T, Wilhite SE, Ledoux P, Evangelista C, Kim IF, Tomashevsky M, Marshall KA, Phillippy KH, Sherman PM, Holko M, Yefanov A, Lee H, Zhang N, Robertson CL, Serova N, Davis S, and Soboleva A. NCBI GEO: archive for functional genomics data sets--update. Nucleic Acids Res 41: D991–995, 2013. [DOI] [PMC free article] [PubMed] [Google Scholar]
- 14.Battram T, Paul Yousefi, Gemma Crawford, Claire Prince, Mahsa S. Babei, Gemma Sharp, Charlie Hatcher. The EWAS Catalog: a database of epigenome-wide association studies. OSF Preprints 2021. [DOI] [PMC free article] [PubMed] [Google Scholar]
- 15.Becirovic-Agic M, Jonsson S, and Hultstrom M. Quantitative trait loci associated with angiotensin II and high-salt diet induced acute decompensated heart failure in Balb/CJ mice. Physiol Genomics 51: 279–289, 2019. [DOI] [PubMed] [Google Scholar]
- 16.Bennett B, Saba LM, Hornbaker CK, Kechris KJ, Hoffman P, and Tabakoff B. Genetical genomic analysis of complex phenotypes using the PhenoGen website. Behav Genet 41: 625–628, 2011. [DOI] [PMC free article] [PubMed] [Google Scholar]
- 17.Bennett BJ, Davis RC, Civelek M, Orozco L, Wu J, Qi H, Pan C, Packard RR, Eskin E, Yan M, Kirchgessner T, Wang Z, Li X, Gregory JC, Hazen SL, Gargalovic PS, and Lusis AJ. Genetic Architecture of Atherosclerosis in Mice: A Systems Genetics Analysis of Common Inbred Strains. PLoS Genet 11: e1005711, 2015. [DOI] [PMC free article] [PubMed] [Google Scholar]
- 18.Benson MD, Yang Q, Ngo D, Zhu Y, Shen D, Farrell LA, Sinha S, Keyes MJ, Vasan RS, Larson MG, Smith JG, Wang TJ, and Gerszten RE. Genetic Architecture of the Cardiovascular Risk Proteome. Circulation 137: 1158–1172, 2018. [DOI] [PMC free article] [PubMed] [Google Scholar]
- 19.Bien SA, Pankow JS, Haessler J, Lu Y, Pankratz N, Rohde RR, Tamuno A, Carlson CS, Schumacher FR, Buzkova P, Daviglus ML, Lim U, Fornage M, Fernandez-Rhodes L, Aviles-Santa L, Buyske S, Gross MD, Graff M, Isasi CR, Kuller LH, Manson JE, Matise TC, Prentice RL, Wilkens LR, Yoneyama S, Loos RJF, Hindorff LA, Le Marchand L, North KE, Haiman CA, Peters U, and Kooperberg C. Transethnic insight into the genetics of glycaemic traits: fine-mapping results from the Population Architecture using Genomics and Epidemiology (PAGE) consortium. Diabetologia 60: 2384–2398, 2017. [DOI] [PMC free article] [PubMed] [Google Scholar]
- 20.Bien SA, Wojcik GL, Hodonsky CJ, Gignoux CR, Cheng I, Matise TC, Peters U, Kenny EE, and North KE. The Future of Genomic Studies Must Be Globally Representative: Perspectives from PAGE. Annu Rev Genomics Hum Genet 20: 181–200, 2019. [DOI] [PMC free article] [PubMed] [Google Scholar]
- 21.Bilusic M, Bataillard A, Tschannen MR, Gao L, Barreto NE, Vincent M, Wang T, Jacob HJ, Sassard J, and Kwitek AE. Mapping the genetic determinants of hypertension, metabolic diseases, and related phenotypes in the lyon hypertensive rat. Hypertension 44: 695–701, 2004. [DOI] [PubMed] [Google Scholar]
- 22.Bimber BN, Raboin MJ, Letaw J, Nevonen KA, Spindel JE, McCouch SR, Cervera-Juanes R, Spindel E, Carbone L, Ferguson B, and Vinson A. Whole-genome characterization in pedigreed non-human primates using genotyping-by-sequencing (GBS) and imputation. BMC Genomics 17: 676, 2016. [DOI] [PMC free article] [PubMed] [Google Scholar]
- 23.Binenbaum I, Atamni HA, Fotakis G, Kontogianni G, Koutsandreas T, Pilalis E, Mott R, Himmelbauer H, Iraqi FA, and Chatziioannou AA. Container-aided integrative QTL and RNA-seq analysis of Collaborative Cross mice supports distinct sex-oriented molecular modes of response in obesity. BMC Genomics 21: 761, 2020. [DOI] [PMC free article] [PubMed] [Google Scholar]
- 24.Bogue MA, Philip VM, Walton DO, Grubb SC, Dunn MH, Kolishovski G, Emerson J, Mukherjee G, Stearns T, He H, Sinha V, Kadakkuzha B, Kunde-Ramamoorthy G, and Chesler EJ. Mouse Phenome Database: a data repository and analysis suite for curated primary mouse phenotype data. Nucleic Acids Res 48: D716–D723, 2020. [DOI] [PMC free article] [PubMed] [Google Scholar]
- 25.Bomba L, Walter K, and Soranzo N. The impact of rare and low-frequency genetic variants in common disease. Genome Biol 18: 77, 2017. [DOI] [PMC free article] [PubMed] [Google Scholar]
- 26.Boyle EA, Li YI, and Pritchard JK. An Expanded View of Complex Traits: From Polygenic to Omnigenic. Cell 169: 1177–1186, 2017. [DOI] [PMC free article] [PubMed] [Google Scholar]
- 27.Brandt MM, Meddens CA, Louzao-Martinez L, van den Dungen NAM, Lansu NR, Nieuwenhuis EES, Duncker DJ, Verhaar MC, Joles JA, Mokry M, and Cheng C. Chromatin Conformation Links Distal Target Genes to CKD Loci. J Am Soc Nephrol 29: 462–476, 2018. [DOI] [PMC free article] [PubMed] [Google Scholar]
- 28.Brinster R, Kottgen A, Tayo BO, Schumacher M, Sekula P, and Consortium CK. Control procedures and estimators of the false discovery rate and their application in low-dimensional settings: an empirical investigation. BMC Bioinformatics 19: 78, 2018. [DOI] [PMC free article] [PubMed] [Google Scholar]
- 29.Bryant CD, Smith DJ, Kantak KM, Nowak TS Jr., Williams RW, Damaj MI, Redei EE, Chen H, and Mulligan MK. Facilitating Complex Trait Analysis via Reduced Complexity Crosses. Trends Genet 36: 549–562, 2020. [DOI] [PMC free article] [PubMed] [Google Scholar]
- 30.Bujold D, Morais DAL, Gauthier C, Cote C, Caron M, Kwan T, Chen KC, Laperle J, Markovits AN, Pastinen T, Caron B, Veilleux A, Jacques PE, and Bourque G. The International Human Epigenome Consortium Data Portal. Cell Syst 3: 496–499 e492, 2016. [DOI] [PubMed] [Google Scholar]
- 31.Bycroft C, Freeman C, Petkova D, Band G, Elliott LT, Sharp K, Motyer A, Vukcevic D, Delaneau O, O’Connell J, Cortes A, Welsh S, Young A, Effingham M, McVean G, Leslie S, Allen N, Donnelly P, and Marchini J. The UK Biobank resource with deep phenotyping and genomic data. Nature 562: 203–209, 2018. [DOI] [PMC free article] [PubMed] [Google Scholar]
- 32.Cabrera CP, Ng FL, Nicholls HL, Gupta A, Barnes MR, Munroe PB, and Caulfield MJ. Over 1000 genetic loci influencing blood pressure with multiple systems and tissues implicated. Hum Mol Genet 28: R151–R161, 2019. [DOI] [PMC free article] [PubMed] [Google Scholar]
- 33.Caliskan M, Manduchi E, Rao HS, Segert JA, Beltrame MH, Trizzino M, Park Y, Baker SW, Chesi A, Johnson ME, Hodge KM, Leonard ME, Loza B, Xin D, Berrido AM, Hand NJ, Bauer RC, Wells AD, Olthoff KM, Shaked A, Rader DJ, Grant SFA, and Brown CD. Genetic and Epigenetic Fine Mapping of Complex Trait Associated Loci in the Human Liver. Am J Hum Genet 105: 89–107, 2019. [DOI] [PMC free article] [PubMed] [Google Scholar]
- 34.Cannon ME, and Mohlke KL. Deciphering the Emerging Complexities of Molecular Mechanisms at GWAS Loci. Am J Hum Genet 103: 637–653, 2018. [DOI] [PMC free article] [PubMed] [Google Scholar]
- 35.Cano-Gamez E, and Trynka G. From GWAS to Function: Using Functional Genomics to Identify the Mechanisms Underlying Complex Diseases. Front Genet 11: 424, 2020. [DOI] [PMC free article] [PubMed] [Google Scholar]
- 36.Cao-Lei L, Elgbeili G, Szyf M, Laplante DP, and King S. Differential genome-wide DNA methylation patterns in childhood obesity. BMC Res Notes 12: 174, 2019. [DOI] [PMC free article] [PubMed] [Google Scholar]
- 37.Carayol J, Chabert C, Di Cara A, Armenise C, Lefebvre G, Langin D, Viguerie N, Metairon S, Saris WHM, Astrup A, Descombes P, Valsesia A, and Hager J. Protein quantitative trait locus study in obesity during weight-loss identifies a leptin regulator. Nat Commun 8: 2084, 2017. [DOI] [PMC free article] [PubMed] [Google Scholar]
- 38.Carcamo-Orive I, Henrion MYR, Zhu K, Beckmann ND, Cundiff P, Moein S, Zhang Z, Alamprese M, D’Souza SL, Wabitsch M, Schadt EE, Quertermous T, Knowles JW, and Chang R. Predictive network modeling in human induced pluripotent stem cells identifies key driver genes for insulin responsiveness. PLoS Comput Biol 16: e1008491, 2020. [DOI] [PMC free article] [PubMed] [Google Scholar]
- 39.Carneiro G, Radcenco AL, Evaristo J, and Monnerat G. Novel strategies for clinical investigation and biomarker discovery: a guide to applied metabolomics. Horm Mol Biol Clin Investig 38: 2019. [DOI] [PubMed] [Google Scholar]
- 40.Cecelja M, Keehn L, Ye L, Spector TD, Hughes AD, and Chowienczyk P. Genetic aetiology of blood pressure relates to aortic stiffness with bi-directional causality: evidence from heritability, blood pressure polymorphisms, and Mendelian randomization. Eur Heart J 2020. [DOI] [PMC free article] [PubMed] [Google Scholar]
- 41.Chen D, Zhao X, Sui Z, Niu H, Chen L, Hu C, Xuan Q, Hou X, Zhang R, Zhou L, Li Y, Yuan H, Zhang Y, Wu J, Zhang L, Wu R, Piao HL, Xu G, and Jia W. A multi-omics investigation of the molecular characteristics and classification of six metabolic syndrome relevant diseases. Theranostics 10: 2029–2046, 2020. [DOI] [PMC free article] [PubMed] [Google Scholar]
- 42.Chen Z, Chen J, Collins R, Guo Y, Peto R, Wu F, Li L, and China Kadoorie Biobank collaborative g. China Kadoorie Biobank of 0.5 million people: survey methods, baseline characteristics and long-term follow-up. Int J Epidemiol 40: 1652–1666, 2011. [DOI] [PMC free article] [PubMed] [Google Scholar]
- 43.Cheng R, Lim JE, Samocha KE, Sokoloff G, Abney M, Skol AD, and Palmer AA. Genome-wide association studies and the problem of relatedness among advanced intercross lines and other highly recombinant populations. Genetics 185: 1033–1044, 2010. [DOI] [PMC free article] [PubMed] [Google Scholar]
- 44.Cherny SS, Freidin MB, Williams FMK, and Livshits G. The analysis of causal relationships between blood lipid levels and BMD. PLoS One 14: e0212464, 2019. [DOI] [PMC free article] [PubMed] [Google Scholar]
- 45.Chick JM, Munger SC, Simecek P, Huttlin EL, Choi K, Gatti DM, Raghupathy N, Svenson KL, Churchill GA, and Gygi SP. Defining the consequences of genetic variation on a proteome-wide scale. Nature 534: 500–505, 2016. [DOI] [PMC free article] [PubMed] [Google Scholar]
- 46.Chitre AS, Polesskaya O, Holl K, Gao J, Cheng R, Bimschleger H, Garcia Martinez A, George T, Gileta AF, Han W, Horvath A, Hughson A, Ishiwari K, King CP, Lamparelli A, Versaggi CL, Martin C, St Pierre CL, Tripi JA, Wang T, Chen H, Flagel SB, Meyer P, Richards J, Robinson TE, Palmer AA, and Solberg Woods LC. Genome-Wide Association Study in 3,173 Outbred Rats Identifies Multiple Loci for Body Weight, Adiposity, and Fasting Glucose. Obesity (Silver Spring) 28: 1964–1973, 2020. [DOI] [PMC free article] [PubMed] [Google Scholar]
- 47.Civelek M, Wu Y, Pan C, Raulerson CK, Ko A, He A, Tilford C, Saleem NK, Stancakova A, Scott LJ, Fuchsberger C, Stringham HM, Jackson AU, Narisu N, Chines PS, Small KS, Kuusisto J, Parks BW, Pajukanta P, Kirchgessner T, Collins FS, Gargalovic PS, Boehnke M, Laakso M, Mohlke KL, and Lusis AJ. Genetic Regulation of Adipose Gene Expression and Cardio-Metabolic Traits. Am J Hum Genet 100: 428–443, 2017. [DOI] [PMC free article] [PubMed] [Google Scholar]
- 48.Coffey AR, Kanke M, Smallwood TL, Albright J, Pitman W, Gharaibeh RZ, Hua K, Gertz E, Biddinger SB, Temel RE, Pomp D, Sethupathy P, and Bennett BJ. microRNA-146a-5p association with the cardiometabolic disease risk factor TMAO. Physiol Genomics 51: 59–71, 2019. [DOI] [PMC free article] [PubMed] [Google Scholar]
- 49.Consortium EP, Moore JE, Purcaro MJ, Pratt HE, Epstein CB, Shoresh N, Adrian J, Kawli T, Davis CA, Dobin A, Kaul R, Halow J, Van Nostrand EL, Freese P, Gorkin DU, Shen Y, He Y, Mackiewicz M, Pauli-Behn F, Williams BA, Mortazavi A, Keller CA, Zhang XO, Elhajjajy SI, Huey J, Dickel DE, Snetkova V, Wei X, Wang X, Rivera-Mulia JC, Rozowsky J, Zhang J, Chhetri SB, Zhang J, Victorsen A, White KP, Visel A, Yeo GW, Burge CB, Lecuyer E, Gilbert DM, Dekker J, Rinn J, Mendenhall EM, Ecker JR, Kellis M, Klein RJ, Noble WS, Kundaje A, Guigo R, Farnham PJ, Cherry JM, Myers RM, Ren B, Graveley BR, Gerstein MB, Pennacchio LA, Snyder MP, Bernstein BE, Wold B, Hardison RC, Gingeras TR, Stamatoyannopoulos JA, and Weng Z. Expanded encyclopaedias of DNA elements in the human and mouse genomes. Nature 583: 699–710, 2020. [DOI] [PMC free article] [PubMed] [Google Scholar]
- 50.Consortium GT. The Genotype-Tissue Expression (GTEx) project. Nat Genet 45: 580–585, 2013. [DOI] [PMC free article] [PubMed] [Google Scholar]
- 51.Consortium GT. Human genomics. The Genotype-Tissue Expression (GTEx) pilot analysis: multitissue gene regulation in humans. Science 348: 648–660, 2015. [DOI] [PMC free article] [PubMed] [Google Scholar]
- 52.Consortium GT, Laboratory DA, Coordinating Center -Analysis Working G, Statistical Methods groups-Analysis Working G, Enhancing Gg, Fund NIHC, Nih/Nci, Nih/Nhgri, Nih/Nimh, Nih/Nida, Biospecimen Collection Source Site N, Biospecimen Collection Source Site R, Biospecimen Core Resource V, Brain Bank Repository-University of Miami Brain Endowment B, Leidos Biomedical-Project M, Study E, Genome Browser Data I, Visualization EBI, Genome Browser Data I, Visualization-Ucsc Genomics Institute UoCSC, Lead a, Laboratory DA, Coordinating C, management NIHp, Biospecimen c, Pathology, e QTLmwg, Battle A, Brown CD, Engelhardt BE, and Montgomery SB. Genetic effects on gene expression across human tissues. Nature 550: 204–213, 2017.29022597 [Google Scholar]
- 53.Corcuff JB, Ducint D, and Brossaud J. What do you need to know about mass spectrometry? A brief guide for endocrinologists. Ann Endocrinol (Paris) 81: 118–123, 2020. [DOI] [PubMed] [Google Scholar]
- 54.Cowley AW Jr., and Dwinell MR. Chromosomal Substitution Strategies to Localize Genomic Regions Related to Complex Traits. Compr Physiol 10: 365–388, 2020. [DOI] [PubMed] [Google Scholar]
- 55.Cowley AW Jr., Moreno C, Jacob HJ, Peterson CB, Stingo FC, Ahn KW, Liu P, Vannucci M, Laud PW, Reddy P, Lazar J, Evans L, Yang C, Kurth T, and Liang M. Characterization of biological pathways associated with a 1.37 Mbp genomic region protective of hypertension in Dahl S rats. Physiol Genomics 46: 398–410, 2014. [DOI] [PMC free article] [PubMed] [Google Scholar]
- 56.Cowley AW Jr., Yang C, Kumar V, Lazar J, Jacob H, Geurts AM, Liu P, Dayton A, Kurth T, and Liang M. Pappa2 is linked to salt-sensitive hypertension in Dahl S rats. Physiol Genomics 48: 62–72, 2016. [DOI] [PMC free article] [PubMed] [Google Scholar]
- 57.Crespo K, Menard A, and Deng AY. Hypertension Suppression, Not a Cumulative Thrust of Quantitative Trait Loci, Predisposes Blood Pressure Homeostasis to Normotension. Circ Cardiovasc Genet 8: 610–617, 2015. [DOI] [PubMed] [Google Scholar]
- 58.Crouch DJM, and Bodmer WF. Polygenic inheritance, GWAS, polygenic risk scores, and the search for functional variants. Proc Natl Acad Sci U S A 117: 18924–18933, 2020. [DOI] [PMC free article] [PubMed] [Google Scholar]
- 59.Crujeiras AB, Diaz-Lagares A, Moreno-Navarrete JM, Sandoval J, Hervas D, Gomez A, Ricart W, Casanueva FF, Esteller M, and Fernandez-Real JM. Genome-wide DNA methylation pattern in visceral adipose tissue differentiates insulin-resistant from insulin-sensitive obese subjects. Transl Res 178: 13–24 e15, 2016. [DOI] [PubMed] [Google Scholar]
- 60.Cui L, Lu H, and Lee YH. Challenges and emergent solutions for LC-MS/MS based untargeted metabolomics in diseases. Mass Spectrom Rev 37: 772–792, 2018. [DOI] [PubMed] [Google Scholar]
- 61.Darvasi A, and Soller M. Advanced intercross lines, an experimental population for fine genetic mapping. Genetics 141: 1199–1207, 1995. [DOI] [PMC free article] [PubMed] [Google Scholar]
- 62.Davis CA, Hitz BC, Sloan CA, Chan ET, Davidson JM, Gabdank I, Hilton JA, Jain K, Baymuradov UK, Narayanan AK, Onate KC, Graham K, Miyasato SR, Dreszer TR, Strattan JS, Jolanki O, Tanaka FY, and Cherry JM. The Encyclopedia of DNA elements (ENCODE): data portal update. Nucleic Acids Res 46: D794–D801, 2018. [DOI] [PMC free article] [PubMed] [Google Scholar]
- 63.Davis JP, Huyghe JR, Locke AE, Jackson AU, Sim X, Stringham HM, Teslovich TM, Welch RP, Fuchsberger C, Narisu N, Chines PS, Kangas AJ, Soininen P, Ala-Korpela M, Kuusisto J, Collins FS, Laakso M, Boehnke M, and Mohlke KL. Common, low-frequency, and rare genetic variants associated with lipoprotein subclasses and triglyceride measures in Finnish men from the METSIM study. PLoS Genet 13: e1007079, 2017. [DOI] [PMC free article] [PubMed] [Google Scholar]
- 64.de Toro-Martin J, Guenard F, Tchernof A, Deshaies Y, Perusse L, Biron S, Lescelleur O, Biertho L, Marceau S, and Vohl MC. A CpG-SNP Located within the ARPC3 Gene Promoter Is Associated with Hypertriglyceridemia in Severely Obese Patients. Ann Nutr Metab 68: 203–212, 2016. [DOI] [PubMed] [Google Scholar]
- 65.de Toro-Martin J, Guenard F, Tchernof A, Deshaies Y, Perusse L, Hould FS, Lebel S, Marceau P, and Vohl MC. Methylation quantitative trait loci within the TOMM20 gene are associated with metabolic syndrome-related lipid alterations in severely obese subjects. Diabetol Metab Syndr 8: 55, 2016. [DOI] [PMC free article] [PubMed] [Google Scholar]
- 66.Demirdjian L, Xu Y, Bahrami-Samani E, Pan Y, Stein S, Xie Z, Park E, Wu YN, and Xing Y. Detecting Allele-Specific Alternative Splicing from Population-Scale RNA-Seq Data. Am J Hum Genet 107: 461–472, 2020. [DOI] [PMC free article] [PubMed] [Google Scholar]
- 67.Denker A, and de Laat W. A Long-Distance Chromatin Affair. Cell 162: 942–943, 2015. [DOI] [PubMed] [Google Scholar]
- 68.Derry JM, Zhong H, Molony C, MacNeil D, Guhathakurta D, Zhang B, Mudgett J, Small K, El Fertak L, Guimond A, Selloum M, Zhao W, Champy MF, Monassier L, Vogt T, Cully D, Kasarskis A, and Schadt EE. Identification of genes and networks driving cardiovascular and metabolic phenotypes in a mouse F2 intercross. PLoS One 5: e14319, 2010. [DOI] [PMC free article] [PubMed] [Google Scholar]
- 69.Deutsch EW, Bandeira N, Sharma V, Perez-Riverol Y, Carver JJ, Kundu DJ, Garcia-Seisdedos D, Jarnuczak AF, Hewapathirana S, Pullman BS, Wertz J, Sun Z, Kawano S, Okuda S, Watanabe Y, Hermjakob H, MacLean B, MacCoss MJ, Zhu Y, Ishihama Y, and Vizcaino JA. The ProteomeXchange consortium in 2020: enabling ‘big data’ approaches in proteomics. Nucleic Acids Res 48: D1145–D1152, 2020. [DOI] [PMC free article] [PubMed] [Google Scholar]
- 70.Dlamini Z, Hull R, Makhafola TJ, and Mbele M. Regulation of alternative splicing in obesity-induced hypertension. Diabetes Metab Syndr Obes 12: 1597–1615, 2019. [DOI] [PMC free article] [PubMed] [Google Scholar]
- 71.Do AN, Lynch AI, Claas SA, Boerwinkle E, Davis BR, Ford CE, Eckfeldt JH, Tiwari HK, Arnett DK, and Irvin MR. The effects of genes implicated in cardiovascular disease on blood pressure response to treatment among treatment-naive hypertensive African Americans in the GenHAT study. J Hum Hypertens 30: 549–554, 2016. [DOI] [PMC free article] [PubMed] [Google Scholar]
- 72.Doaei S, Kalantari N, Izadi P, Salonurmi T, Mosavi Jarrahi A, Rafieifar S, Azizi Tabesh G, Rahimzadeh G, Gholamalizadeh M, and Goodarzi MO. Changes in FTO and IRX3 gene expression in obese and overweight male adolescents undergoing an intensive lifestyle intervention and the role of FTO genotype in this interaction. J Transl Med 17: 176, 2019. [DOI] [PMC free article] [PubMed] [Google Scholar]
- 73.Dodoo SN, and Benjamin IJ. Genomic Approaches to Hypertension. Cardiol Clin 35: 185–196, 2017. [DOI] [PubMed] [Google Scholar]
- 74.Dong SS, Yao S, Chen YX, Guo Y, Zhang YJ, Niu HM, Hao RH, Shen H, Tian Q, Deng HW, and Yang TL. Detecting epistasis within chromatin regulatory circuitry reveals CAND2 as a novel susceptibility gene for obesity. Int J Obes (Lond) 43: 450–456, 2019. [DOI] [PMC free article] [PubMed] [Google Scholar]
- 75.Dube MP, de Denus S, and Tardif JC. Pharmacogenomics to Revive Drug Development in Cardiovascular Disease. Cardiovasc Drugs Ther 30: 59–64, 2016. [DOI] [PubMed] [Google Scholar]
- 76.Dumas ME, Domange C, Calderari S, Martinez AR, Ayala R, Wilder SP, Suarez-Zamorano N, Collins SC, Wallis RH, Gu Q, Wang Y, Hue C, Otto GW, Argoud K, Navratil V, Mitchell SC, Lindon JC, Holmes E, Cazier JB, Nicholson JK, and Gauguier D. Topological analysis of metabolic networks integrating co-segregating transcriptomes and metabolomes in type 2 diabetic rat congenic series. Genome Med 8: 101, 2016. [DOI] [PMC free article] [PubMed] [Google Scholar]
- 77.e MCEaabe, and e MC. Harmonizing Clinical Sequencing and Interpretation for the eMERGE III Network. Am J Hum Genet 105: 588–605, 2019. [DOI] [PMC free article] [PubMed] [Google Scholar]
- 78.Elagizi A, Kachur S, Lavie CJ, Carbone S, Pandey A, Ortega FB, and Milani RV. An Overview and Update on Obesity and the Obesity Paradox in Cardiovascular Diseases. Prog Cardiovasc Dis 61: 142–150, 2018. [DOI] [PubMed] [Google Scholar]
- 79.Ellegren H, and Galtier N. Determinants of genetic diversity. Nat Rev Genet 17: 422–433, 2016. [DOI] [PubMed] [Google Scholar]
- 80.Emdin CA, Khera AV, Natarajan P, Klarin D, Zekavat SM, Hsiao AJ, and Kathiresan S. Genetic Association of Waist-to-Hip Ratio With Cardiometabolic Traits, Type 2 Diabetes, and Coronary Heart Disease. JAMA 317: 626–634, 2017. [DOI] [PMC free article] [PubMed] [Google Scholar]
- 81.Emilsson V, Ilkov M, Lamb JR, Finkel N, Gudmundsson EF, Pitts R, Hoover H, Gudmundsdottir V, Horman SR, Aspelund T, Shu L, Trifonov V, Sigurdsson S, Manolescu A, Zhu J, Olafsson O, Jakobsdottir J, Lesley SA, To J, Zhang J, Harris TB, Launer LJ, Zhang B, Eiriksdottir G, Yang X, Orth AP, Jennings LL, and Gudnason V. Co-regulatory networks of human serum proteins link genetics to disease. Science 361: 769–773, 2018. [DOI] [PMC free article] [PubMed] [Google Scholar]
- 82.Emwas AH, Roy R, McKay RT, Tenori L, Saccenti E, Gowda GAN, Raftery D, Alahmari F, Jaremko L, Jaremko M, and Wishart DS. NMR Spectroscopy for Metabolomics Research. Metabolites 9: 2019. [DOI] [PMC free article] [PubMed] [Google Scholar]
- 83.Eppig JT. Mouse Genome Informatics (MGI) Resource: Genetic, Genomic, and Biological Knowledgebase for the Laboratory Mouse. ILAR J 58: 17–41, 2017. [DOI] [PMC free article] [PubMed] [Google Scholar]
- 84.Evangelou E, Warren HR, Mosen-Ansorena D, Mifsud B, Pazoki R, Gao H, Ntritsos G, Dimou N, Cabrera CP, Karaman I, Ng FL, Evangelou M, Witkowska K, Tzanis E, Hellwege JN, Giri A, Velez Edwards DR, Sun YV, Cho K, Gaziano JM, Wilson PWF, Tsao PS, Kovesdy CP, Esko T, Magi R, Milani L, Almgren P, Boutin T, Debette S, Ding J, Giulianini F, Holliday EG, Jackson AU, Li-Gao R, Lin WY, Luan J, Mangino M, Oldmeadow C, Prins BP, Qian Y, Sargurupremraj M, Shah N, Surendran P, Theriault S, Verweij N, Willems SM, Zhao JH, Amouyel P, Connell J, de Mutsert R, Doney ASF, Farrall M, Menni C, Morris AD, Noordam R, Pare G, Poulter NR, Shields DC, Stanton A, Thom S, Abecasis G, Amin N, Arking DE, Ayers KL, Barbieri CM, Batini C, Bis JC, Blake T, Bochud M, Boehnke M, Boerwinkle E, Boomsma DI, Bottinger EP, Braund PS, Brumat M, Campbell A, Campbell H, Chakravarti A, Chambers JC, Chauhan G, Ciullo M, Cocca M, Collins F, Cordell HJ, Davies G, de Borst MH, de Geus EJ, Deary IJ, Deelen J, Del Greco MF, Demirkale CY, Dorr M, Ehret GB, Elosua R, Enroth S, Erzurumluoglu AM, Ferreira T, Franberg M, Franco OH, Gandin I, Gasparini P, Giedraitis V, Gieger C, Girotto G, Goel A, Gow AJ, Gudnason V, Guo X, Gyllensten U, Hamsten A, Harris TB, Harris SE, Hartman CA, Havulinna AS, Hicks AA, Hofer E, Hofman A, Hottenga JJ, Huffman JE, Hwang SJ, Ingelsson E, James A, Jansen R, Jarvelin MR, Joehanes R, Johansson A, Johnson AD, Joshi PK, Jousilahti P, Jukema JW, Jula A, Kahonen M, Kathiresan S, Keavney BD, Khaw KT, Knekt P, Knight J, Kolcic I, Kooner JS, Koskinen S, Kristiansson K, Kutalik Z, Laan M, Larson M, Launer LJ, Lehne B, Lehtimaki T, Liewald DCM, Lin L, Lind L, Lindgren CM, Liu Y, Loos RJF, Lopez LM, Lu Y, Lyytikainen LP, Mahajan A, Mamasoula C, Marrugat J, Marten J, Milaneschi Y, Morgan A, Morris AP, Morrison AC, Munson PJ, Nalls MA, Nandakumar P, Nelson CP, Niiranen T, Nolte IM, Nutile T, Oldehinkel AJ, Oostra BA, O’Reilly PF, Org E, Padmanabhan S, Palmas W, Palotie A, Pattie A, Penninx B, Perola M, Peters A, Polasek O, Pramstaller PP, Nguyen QT, Raitakari OT, Ren M, Rettig R, Rice K, Ridker PM, Ried JS, Riese H, Ripatti S, Robino A, Rose LM, Rotter JI, Rudan I, Ruggiero D, Saba Y, Sala CF, Salomaa V, Samani NJ, Sarin AP, Schmidt R, Schmidt H, Shrine N, Siscovick D, Smith AV, Snieder H, Sober S, Sorice R, Starr JM, Stott DJ, Strachan DP, Strawbridge RJ, Sundstrom J, Swertz MA, Taylor KD, Teumer A, Tobin MD, Tomaszewski M, Toniolo D, Traglia M, Trompet S, Tuomilehto J, Tzourio C, Uitterlinden AG, Vaez A, van der Most PJ, van Duijn CM, Vergnaud AC, Verwoert GC, Vitart V, Volker U, Vollenweider P, Vuckovic D, Watkins H, Wild SH, Willemsen G, Wilson JF, Wright AF, Yao J, Zemunik T, Zhang W, Attia JR, Butterworth AS, Chasman DI, Conen D, Cucca F, Danesh J, Hayward C, Howson JMM, Laakso M, Lakatta EG, Langenberg C, Melander O, Mook-Kanamori DO, Palmer CNA, Risch L, Scott RA, Scott RJ, Sever P, Spector TD, van der Harst P, Wareham NJ, Zeggini E, Levy D, Munroe PB, Newton-Cheh C, Brown MJ, Metspalu A, Hung AM, O’Donnell CJ, Edwards TL, Psaty BM, Tzoulaki I, Barnes MR, Wain LV, Elliott P, Caulfield MJ, and Million Veteran P. Genetic analysis of over 1 million people identifies 535 new loci associated with blood pressure traits. Nat Genet 50: 1412–1425, 2018. [DOI] [PMC free article] [PubMed] [Google Scholar]
- 85.Fadason T, Ekblad C, Ingram JR, Schierding WS, and O’Sullivan JM. Physical Interactions and Expression Quantitative Traits Loci Identify Regulatory Connections for Obesity and Type 2 Diabetes Associated SNPs. Front Genet 8: 150, 2017. [DOI] [PMC free article] [PubMed] [Google Scholar]
- 86.Fadason T, Schierding W, Lumley T, and O’Sullivan JM. Chromatin interactions and expression quantitative trait loci reveal genetic drivers of multimorbidities. Nat Commun 9: 5198, 2018. [DOI] [PMC free article] [PubMed] [Google Scholar]
- 87.Fadista J, Vikman P, Laakso EO, Mollet IG, Esguerra JL, Taneera J, Storm P, Osmark P, Ladenvall C, Prasad RB, Hansson KB, Finotello F, Uvebrant K, Ofori JK, Di Camillo B, Krus U, Cilio CM, Hansson O, Eliasson L, Rosengren AH, Renstrom E, Wollheim CB, and Groop L. Global genomic and transcriptomic analysis of human pancreatic islets reveals novel genes influencing glucose metabolism. Proc Natl Acad Sci U S A 111: 13924–13929, 2014. [DOI] [PMC free article] [PubMed] [Google Scholar]
- 88.Fang G, Wang W, Paunic V, Heydari H, Costanzo M, Liu X, Liu X, VanderSluis B, Oately B, Steinbach M, Van Ness B, Schadt EE, Pankratz ND, Boone C, Kumar V, and Myers CL. Discovering genetic interactions bridging pathways in genome-wide association studies. Nat Commun 10: 4274, 2019. [DOI] [PMC free article] [PubMed] [Google Scholar]
- 89.Faulkner JL, and Belin de Chantemele EJ. Sex hormones, aging and cardiometabolic syndrome. Biol Sex Differ 10: 30, 2019. [DOI] [PMC free article] [PubMed] [Google Scholar]
- 90.Fernandez-Rhodes L, Gong J, Haessler J, Franceschini N, Graff M, Nishimura KK, Wang Y, Highland HM, Yoneyama S, Bush WS, Goodloe R, Ritchie MD, Crawford D, Gross M, Fornage M, Buzkova P, Tao R, Isasi C, Aviles-Santa L, Daviglus M, Mackey RH, Houston D, Gu CC, Ehret G, Nguyen KH, Lewis CE, Leppert M, Irvin MR, Lim U, Haiman CA, Le Marchand L, Schumacher F, Wilkens L, Lu Y, Bottinger EP, Loos RJL, Sheu WH, Guo X, Lee WJ, Hai Y, Hung YJ, Absher D, Wu IC, Taylor KD, Lee IT, Liu Y, Wang TD, Quertermous T, Juang JJ, Rotter JI, Assimes T, Hsiung CA, Chen YI, Prentice R, Kuller LH, Manson JE, Kooperberg C, Smokowski P, Robinson WR, Gordon-Larsen P, Li R, Hindorff L, Buyske S, Matise TC, Peters U, and North KE. Trans-ethnic fine-mapping of genetic loci for body mass index in the diverse ancestral populations of the Population Architecture using Genomics and Epidemiology (PAGE) Study reveals evidence for multiple signals at established loci. Hum Genet 136: 771–800, 2017. [DOI] [PMC free article] [PubMed] [Google Scholar]
- 91.Fert-Bober J, Murray CI, Parker SJ, and Van Eyk JE. Precision Profiling of the Cardiovascular Post-Translationally Modified Proteome: Where There Is a Will, There Is a Way. Circ Res 122: 1221–1237, 2018. [DOI] [PMC free article] [PubMed] [Google Scholar]
- 92.Finlay C, Argoud K, Wilder SP, Ouali F, Ktorza A, Kaisaki PJ, and Gauguier D. Chromosomal mapping of pancreatic islet morphological features and regulatory hormones in the spontaneously diabetic (Type 2) Goto-Kakizaki rat. Mamm Genome 21: 499–508, 2010. [DOI] [PMC free article] [PubMed] [Google Scholar]
- 93.Flister MJ, Tsaih SW, O’Meara CC, Endres B, Hoffman MJ, Geurts AM, Dwinell MR, Lazar J, Jacob HJ, and Moreno C. Identifying multiple causative genes at a single GWAS locus. Genome Res 23: 1996–2002, 2013. [DOI] [PMC free article] [PubMed] [Google Scholar]
- 94.Florez JC. The pharmacogenetics of metformin. Diabetologia 60: 1648–1655, 2017. [DOI] [PMC free article] [PubMed] [Google Scholar]
- 95.Fontaine DA, and Davis DB. Attention to Background Strain Is Essential for Metabolic Research: C57BL/6 and the International Knockout Mouse Consortium. Diabetes 65: 25–33, 2016. [DOI] [PMC free article] [PubMed] [Google Scholar]
- 96.Gallagher MD, and Chen-Plotkin AS. The Post-GWAS Era: From Association to Function. Am J Hum Genet 102: 717–730, 2018. [DOI] [PMC free article] [PubMed] [Google Scholar]
- 97.Gallois A, Mefford J, Ko A, Vaysse A, Julienne H, Ala-Korpela M, Laakso M, Zaitlen N, Pajukanta P, and Aschard H. A comprehensive study of metabolite genetics reveals strong pleiotropy and heterogeneity across time and context. Nat Commun 10: 4788, 2019. [DOI] [PMC free article] [PubMed] [Google Scholar]
- 98.Gamazon ER, Wheeler HE, Shah KP, Mozaffari SV, Aquino-Michaels K, Carroll RJ, Eyler AE, Denny JC, Consortium GT, Nicolae DL, Cox NJ, and Im HK. A gene-based association method for mapping traits using reference transcriptome data. Nat Genet 47: 1091–1098, 2015. [DOI] [PMC free article] [PubMed] [Google Scholar]
- 99.Garrett MR, Joe B, Dene H, and Rapp JP. Identification of blood pressure quantitative trait loci that differentiate two hypertensive strains. J Hypertens 20: 2399–2406, 2002. [DOI] [PubMed] [Google Scholar]
- 100.Garrett MR, Saad Y, Dene H, and Rapp JP. Blood pressure QTL that differentiate Dahl salt-sensitive and spontaneously hypertensive rats. Physiol Genomics 3: 33–38, 2000. [DOI] [PubMed] [Google Scholar]
- 101.Gaziano JM, Concato J, Brophy M, Fiore L, Pyarajan S, Breeling J, Whitbourne S, Deen J, Shannon C, Humphries D, Guarino P, Aslan M, Anderson D, LaFleur R, Hammond T, Schaa K, Moser J, Huang G, Muralidhar S, Przygodzki R, and O’Leary TJ. Million Veteran Program: A mega-biobank to study genetic influences on health and disease. J Clin Epidemiol 70: 214–223, 2016. [DOI] [PubMed] [Google Scholar]
- 102.Genomes Project C, Auton A, Brooks LD, Durbin RM, Garrison EP, Kang HM, Korbel JO, Marchini JL, McCarthy S, McVean GA, and Abecasis GR. A global reference for human genetic variation. Nature 526: 68–74, 2015. [DOI] [PMC free article] [PubMed] [Google Scholar]
- 103.George G, Gan S, Huang Y, Appleby P, Nar AS, Venkatesan R, Mohan V, Palmer CNA, and Doney ASF. PheGWAS: a new dimension to visualize GWAS across multiple phenotypes. Bioinformatics 36: 2500–2505, 2020. [DOI] [PMC free article] [PubMed] [Google Scholar]
- 104.Ghazalpour A, Bennett BJ, Shih D, Che N, Orozco L, Pan C, Hagopian R, He A, Kayne P, Yang WP, Kirchgessner T, and Lusis AJ. Genetic regulation of mouse liver metabolite levels. Mol Syst Biol 10: 730, 2014. [DOI] [PMC free article] [PubMed] [Google Scholar]
- 105.Giri A, Hellwege JN, Keaton JM, Park J, Qiu C, Warren HR, Torstenson ES, Kovesdy CP, Sun YV, Wilson OD, Robinson-Cohen C, Roumie CL, Chung CP, Birdwell KA, Damrauer SM, DuVall SL, Klarin D, Cho K, Wang Y, Evangelou E, Cabrera CP, Wain LV, Shrestha R, Mautz BS, Akwo EA, Sargurupremraj M, Debette S, Boehnke M, Scott LJ, Luan J, Zhao JH, Willems SM, Theriault S, Shah N, Oldmeadow C, Almgren P, Li-Gao R, Verweij N, Boutin TS, Mangino M, Ntalla I, Feofanova E, Surendran P, Cook JP, Karthikeyan S, Lahrouchi N, Liu C, Sepulveda N, Richardson TG, Kraja A, Amouyel P, Farrall M, Poulter NR, Understanding Society Scientific G, International Consortium for Blood P, Blood Pressure-International Consortium of Exome Chip S, Laakso M, Zeggini E, Sever P, Scott RA, Langenberg C, Wareham NJ, Conen D, Palmer CNA, Attia J, Chasman DI, Ridker PM, Melander O, Mook-Kanamori DO, Harst PV, Cucca F, Schlessinger D, Hayward C, Spector TD, Jarvelin MR, Hennig BJ, Timpson NJ, Wei WQ, Smith JC, Xu Y, Matheny ME, Siew EE, Lindgren C, Herzig KH, Dedoussis G, Denny JC, Psaty BM, Howson JMM, Munroe PB, Newton-Cheh C, Caulfield MJ, Elliott P, Gaziano JM, Concato J, Wilson PWF, Tsao PS, Velez Edwards DR, Susztak K, Million Veteran P, O’Donnell CJ, Hung AM, and Edwards TL. Trans-ethnic association study of blood pressure determinants in over 750,000 individuals. Nat Genet 51: 51–62, 2019. [DOI] [PMC free article] [PubMed] [Google Scholar]
- 106.Glastonbury CA, Couto Alves A, El-Sayed Moustafa JS, and Small KS. Cell-Type Heterogeneity in Adipose Tissue Is Associated with Complex Traits and Reveals Disease-Relevant Cell-Specific eQTLs. Am J Hum Genet 104: 1013–1024, 2019. [DOI] [PMC free article] [PubMed] [Google Scholar]
- 107.Goldansaz SA, Guo AC, Sajed T, Steele MA, Plastow GS, and Wishart DS. Livestock metabolomics and the livestock metabolome: A systematic review. PLoS One 12: e0177675, 2017. [DOI] [PMC free article] [PubMed] [Google Scholar]
- 108.Golov AK, Abashkin DA, Kondratyev NV, Razin SV, Gavrilov AA, and Golimbet VE. A modified protocol of Capture-C allows affordable and flexible high-resolution promoter interactome analysis. Sci Rep 10: 15491, 2020. [DOI] [PMC free article] [PubMed] [Google Scholar]
- 109.Gong J, Nishimura KK, Fernandez-Rhodes L, Haessler J, Bien S, Graff M, Lim U, Lu Y, Gross M, Fornage M, Yoneyama S, Isasi CR, Buzkova P, Daviglus M, Lin DY, Tao R, Goodloe R, Bush WS, Farber-Eger E, Boston J, Dilks HH, Ehret G, Gu CC, Lewis CE, Nguyen KH, Cooper R, Leppert M, Irvin MR, Bottinger EP, Wilkens LR, Haiman CA, Park L, Monroe KR, Cheng I, Stram DO, Carlson CS, Jackson R, Kuller L, Houston D, Kooperberg C, Buyske S, Hindorff LA, Crawford DC, Loos RJF, Le Marchand L, Matise TC, North KE, and Peters U. Trans-ethnic analysis of metabochip data identifies two new loci associated with BMI. Int J Obes (Lond) 42: 384–390, 2018. [DOI] [PMC free article] [PubMed] [Google Scholar]
- 110.Gonzales NM, and Palmer AA. Fine-mapping QTLs in advanced intercross lines and other outbred populations. Mamm Genome 25: 271–292, 2014. [DOI] [PMC free article] [PubMed] [Google Scholar]
- 111.Gonzales NM, Seo J, Hernandez Cordero AI, St Pierre CL, Gregory JS, Distler MG, Abney M, Canzar S, Lionikas A, and Palmer AA. Genome wide association analysis in a mouse advanced intercross line. Nat Commun 9: 5162, 2018. [DOI] [PMC free article] [PubMed] [Google Scholar]
- 112.Gopalan S, Carja O, Fagny M, Patin E, Myrick JW, McEwen LM, Mah SM, Kobor MS, Froment A, Feldman MW, Quintana-Murci L, and Henn BM. Trends in DNA Methylation with Age Replicate Across Diverse Human Populations. Genetics 206: 1659–1674, 2017. [DOI] [PMC free article] [PubMed] [Google Scholar]
- 113.Grabowski K, Koplin G, Aliu B, Schulte L, Schulz A, and Kreutz R. Mapping and confirmation of a major left ventricular mass QTL on rat chromosome 1 by contrasting SHRSP and F344 rats. Physiol Genomics 45: 827–833, 2013. [DOI] [PubMed] [Google Scholar]
- 114.Grainger AT, Jones MB, Chen MH, and Shi W. Polygenic Control of Carotid Atherosclerosis in a BALB/cJ x SM/J Intercross and a Combined Cross Involving Multiple Mouse Strains. G3 (Bethesda) 7: 731–739, 2017. [DOI] [PMC free article] [PubMed] [Google Scholar]
- 115.Grasby KL, Verweij KJH, Mosing MA, Zietsch BP, and Medland SE. Estimating Heritability from Twin Studies. Methods Mol Biol 1666: 171–194, 2017. [DOI] [PubMed] [Google Scholar]
- 116.Greenwald WW, Chiou J, Yan J, Qiu Y, Dai N, Wang A, Nariai N, Aylward A, Han JY, Kadakia N, Regue L, Okino ML, Drees F, Kramer D, Vinckier N, Minichiello L, Gorkin D, Avruch J, Frazer KA, Sander M, Ren B, and Gaulton KJ. Pancreatic islet chromatin accessibility and conformation reveals distal enhancer networks of type 2 diabetes risk. Nat Commun 10: 2078, 2019. [DOI] [PMC free article] [PubMed] [Google Scholar]
- 117.Grubert F, Zaugg JB, Kasowski M, Ursu O, Spacek DV, Martin AR, Greenside P, Srivas R, Phanstiel DH, Pekowska A, Heidari N, Euskirchen G, Huber W, Pritchard JK, Bustamante CD, Steinmetz LM, Kundaje A, and Snyder M. Genetic Control of Chromatin States in Humans Involves Local and Distal Chromosomal Interactions. Cell 162: 1051–1065, 2015. [DOI] [PMC free article] [PubMed] [Google Scholar]
- 118.Guenard F, Tchernof A, Deshaies Y, Biron S, Lescelleur O, Biertho L, Marceau S, Perusse L, and Vohl MC. Genetic regulation of differentially methylated genes in visceral adipose tissue of severely obese men discordant for the metabolic syndrome. Transl Res 184: 1–11 e12, 2017. [DOI] [PubMed] [Google Scholar]
- 119.Guo Y, Chung W, Zhu Z, Shan Z, Li J, Liu S, and Liang L. Genome-Wide Assessment for Resting Heart Rate and Shared Genetics With Cardiometabolic Traits and Type 2 Diabetes. J Am Coll Cardiol 74: 2162–2174, 2019. [DOI] [PubMed] [Google Scholar]
- 120.Han J, Robinet P, Ritchey B, Andro H, and Smith JD. Confirmation of Ath26 locus on chromosome 17 and identification of Cyp4f13 as an atherosclerosis modifying gene. Atherosclerosis 286: 71–78, 2019. [DOI] [PMC free article] [PubMed] [Google Scholar]
- 121.Hasin Y, Seldin M, and Lusis A. Multi-omics approaches to disease. Genome Biol 18: 83, 2017. [DOI] [PMC free article] [PubMed] [Google Scholar]
- 122.Haug K, Cochrane K, Nainala VC, Williams M, Chang J, Jayaseelan KV, and O’Donovan C. MetaboLights: a resource evolving in response to the needs of its scientific community. Nucleic Acids Res 48: D440–D444, 2020. [DOI] [PMC free article] [PubMed] [Google Scholar]
- 123.Heifetz EM, and Soller M. Targeted Recombinant Progeny: a design for ultra-high resolution mapping of Quantitative Trait Loci in crosses between inbred or pure lines. BMC Genet 16: 76, 2015. [DOI] [PMC free article] [PubMed] [Google Scholar]
- 124.Hellwege JN, Keaton JM, Giri A, Gao X, Velez Edwards DR, and Edwards TL. Population Stratification in Genetic Association Studies. Curr Protoc Hum Genet 95: 1 22 21–21 22 23, 2017. [DOI] [PMC free article] [PubMed] [Google Scholar]
- 125.Hodge SE, and Greenberg DA. How Can We Explain Very Low Odds Ratios in GWAS? I. Polygenic Models. Hum Hered 81: 173–180, 2016. [DOI] [PubMed] [Google Scholar]
- 126.Hoffmann TJ, Choquet H, Yin J, Banda Y, Kvale MN, Glymour M, Schaefer C, Risch N, and Jorgenson E. A Large Multiethnic Genome-Wide Association Study of Adult Body Mass Index Identifies Novel Loci. Genetics 210: 499–515, 2018. [DOI] [PMC free article] [PubMed] [Google Scholar]
- 127.Hu Y, Graff M, Haessler J, Buyske S, Bien SA, Tao R, Highland HM, Nishimura KK, Zubair N, Lu Y, Verbanck M, Hilliard AT, Klarin D, Damrauer SM, Ho YL, Program VAMV, Wilson PWF, Chang KM, Tsao PS, Cho K, O’Donnell CJ, Assimes TL, Petty LE, Below JE, Dikilitas O, Schaid DJ, Kosel ML, Kullo IJ, Rasmussen-Torvik LJ, Jarvik GP, Feng Q, Wei WQ, Larson EB, Mentch FD, Almoguera B, Sleiman PM, Raffield LM, Correa A, Martin LW, Daviglus M, Matise TC, Ambite JL, Carlson CS, Do R, Loos RJF, Wilkens LR, Le Marchand L, Haiman C, Stram DO, Hindorff LA, North KE, Kooperberg C, Cheng I, and Peters U. Minority-centric meta-analyses of blood lipid levels identify novel loci in the Population Architecture using Genomics and Epidemiology (PAGE) study. PLoS Genet 16: e1008684, 2020. [DOI] [PMC free article] [PubMed] [Google Scholar]
- 128.Hu Z, Liang MC, and Soong TW. Alternative Splicing of L-type CaV1.2 Calcium Channels: Implications in Cardiovascular Diseases. Genes (Basel) 8: 2017. [DOI] [PMC free article] [PubMed] [Google Scholar]
- 129.Huan T, Joehanes R, Song C, Peng F, Guo Y, Mendelson M, Yao C, Liu C, Ma J, Richard M, Agha G, Guan W, Almli LM, Conneely KN, Keefe J, Hwang SJ, Johnson AD, Fornage M, Liang L, and Levy D. Genome-wide identification of DNA methylation QTLs in whole blood highlights pathways for cardiovascular disease. Nat Commun 10: 4267, 2019. [DOI] [PMC free article] [PubMed] [Google Scholar]
- 130.Huang L, Tepaamorndech S, Kirschke CP, Cai Y, Zhao J, Cao X, and Rao A. Subcongenic analysis of a quantitative trait locus affecting body weight and glucose metabolism in zinc transporter 7 (znt7)-knockout mice. BMC Genet 20: 19, 2019. [DOI] [PMC free article] [PubMed] [Google Scholar]
- 131.Huang QQ, Ritchie SC, Brozynska M, and Inouye M. Power, false discovery rate and Winner’s Curse in eQTL studies. Nucleic Acids Res 46: e133, 2018. [DOI] [PMC free article] [PubMed] [Google Scholar]
- 132.Hubner N, Wallace CA, Zimdahl H, Petretto E, Schulz H, Maciver F, Mueller M, Hummel O, Monti J, Zidek V, Musilova A, Kren V, Causton H, Game L, Born G, Schmidt S, Muller A, Cook SA, Kurtz TW, Whittaker J, Pravenec M, and Aitman TJ. Integrated transcriptional profiling and linkage analysis for identification of genes underlying disease. Nat Genet 37: 243–253, 2005. [DOI] [PubMed] [Google Scholar]
- 133.Hui ST, Parks BW, Org E, Norheim F, Che N, Pan C, Castellani LW, Charugundla S, Dirks DL, Psychogios N, Neuhaus I, Gerszten RE, Kirchgessner T, Gargalovic PS, and Lusis AJ. The genetic architecture of NAFLD among inbred strains of mice. Elife 4: e05607, 2015. [DOI] [PMC free article] [PubMed] [Google Scholar]
- 134.Hull RL, Willard JR, Struck MD, Barrow BM, Brar GS, Andrikopoulos S, and Zraika S. High fat feeding unmasks variable insulin responses in male C57BL/6 mouse substrains. J Endocrinol 233: 53–64, 2017. [DOI] [PMC free article] [PubMed] [Google Scholar]
- 135.Huvenne H, Dubern B, Clement K, and Poitou C. Rare Genetic Forms of Obesity: Clinical Approach and Current Treatments in 2016. Obes Facts 9: 158–173, 2016. [DOI] [PMC free article] [PubMed] [Google Scholar]
- 136.Ingelsson E, and McCarthy MI. Human Genetics of Obesity and Type 2 Diabetes Mellitus: Past, Present, and Future. Circ Genom Precis Med 11: e002090, 2018. [DOI] [PMC free article] [PubMed] [Google Scholar]
- 137.Ji X, Li P, Fuscoe JC, Chen G, Xiao W, Shi L, Ning B, Liu Z, Hong H, Wu J, Liu J, Guo L, Kreil DP, Labaj PP, Zhong L, Bao W, Huang Y, He J, Zhao Y, Tong W, and Shi T. A comprehensive rat transcriptome built from large scale RNA-seq-based annotation. Nucleic Acids Res 48: 8320–8331, 2020. [DOI] [PMC free article] [PubMed] [Google Scholar]
- 138.Jia X, Lin H, Nie Q, Zhang X, and Lamont SJ. A short insertion mutation disrupts genesis of miR-16 and causes increased body weight in domesticated chicken. Sci Rep 6: 36433, 2016. [DOI] [PMC free article] [PubMed] [Google Scholar]
- 139.Jiao M, Li J, Zhang Q, Xu X, Li R, Dong P, Meng C, Li Y, Wang L, Qi W, Kang K, Wang H, and Wang T. Identification of Four Potential Biomarkers Associated With Coronary Artery Disease in Non-diabetic Patients by Gene Co-expression Network Analysis. Front Genet 11: 542, 2020. [DOI] [PMC free article] [PubMed] [Google Scholar]
- 140.Jin Z, and Liu Y. DNA methylation in human diseases. Genes Dis 5: 1–8, 2018. [DOI] [PMC free article] [PubMed] [Google Scholar]
- 141.Jones PD, Kaiser MA, Ghaderi Najafabadi M, Koplev S, Zhao Y, Douglas G, Kyriakou T, Andrews S, Rajmohan R, Watkins H, Channon KM, Ye S, Yang X, Bjorkegren JLM, Samani NJ, and Webb TR. JCAD, a Gene at the 10p11 Coronary Artery Disease Locus, Regulates Hippo Signaling in Endothelial Cells. Arterioscler Thromb Vasc Biol 38: 1711–1722, 2018. [DOI] [PMC free article] [PubMed] [Google Scholar]
- 142.Justice AE, Winkler TW, Feitosa MF, Graff M, Fisher VA, Young K, Barata L, Deng X, Czajkowski J, Hadley D, Ngwa JS, Ahluwalia TS, Chu AY, Heard-Costa NL, Lim E, Perez J, Eicher JD, Kutalik Z, Xue L, Mahajan A, Renstrom F, Wu J, Qi Q, Ahmad S, Alfred T, Amin N, Bielak LF, Bonnefond A, Bragg J, Cadby G, Chittani M, Coggeshall S, Corre T, Direk N, Eriksson J, Fischer K, Gorski M, Neergaard Harder M, Horikoshi M, Huang T, Huffman JE, Jackson AU, Justesen JM, Kanoni S, Kinnunen L, Kleber ME, Komulainen P, Kumari M, Lim U, Luan J, Lyytikainen LP, Mangino M, Manichaikul A, Marten J, Middelberg RPS, Muller-Nurasyid M, Navarro P, Perusse L, Pervjakova N, Sarti C, Smith AV, Smith JA, Stancakova A, Strawbridge RJ, Stringham HM, Sung YJ, Tanaka T, Teumer A, Trompet S, van der Laan SW, van der Most PJ, Van Vliet-Ostaptchouk JV, Vedantam SL, Verweij N, Vink JM, Vitart V, Wu Y, Yengo L, Zhang W, Hua Zhao J, Zimmermann ME, Zubair N, Abecasis GR, Adair LS, Afaq S, Afzal U, Bakker SJL, Bartz TM, Beilby J, Bergman RN, Bergmann S, Biffar R, Blangero J, Boerwinkle E, Bonnycastle LL, Bottinger E, Braga D, Buckley BM, Buyske S, Campbell H, Chambers JC, Collins FS, Curran JE, de Borst GJ, de Craen AJM, de Geus EJC, Dedoussis G, Delgado GE, den Ruijter HM, Eiriksdottir G, Eriksson AL, Esko T, Faul JD, Ford I, Forrester T, Gertow K, Gigante B, Glorioso N, Gong J, Grallert H, Grammer TB, Grarup N, Haitjema S, Hallmans G, Hamsten A, Hansen T, Harris TB, Hartman CA, Hassinen M, Hastie ND, Heath AC, Hernandez D, Hindorff L, Hocking LJ, Hollensted M, Holmen OL, Homuth G, Jan Hottenga J, Huang J, Hung J, Hutri-Kahonen N, Ingelsson E, James AL, Jansson JO, Jarvelin MR, Jhun MA, Jorgensen ME, Juonala M, Kahonen M, Karlsson M, Koistinen HA, Kolcic I, Kolovou G, Kooperberg C, Kramer BK, Kuusisto J, Kvaloy K, Lakka TA, Langenberg C, Launer LJ, Leander K, Lee NR, Lind L, Lindgren CM, Linneberg A, Lobbens S, Loh M, Lorentzon M, Luben R, Lubke G, Ludolph-Donislawski A, Lupoli S, Madden PAF, Mannikko R, Marques-Vidal P, Martin NG, McKenzie CA, McKnight B, Mellstrom D, Menni C, Montgomery GW, Musk AB, Narisu N, Nauck M, Nolte IM, Oldehinkel AJ, Olden M, Ong KK, Padmanabhan S, Peyser PA, Pisinger C, Porteous DJ, Raitakari OT, Rankinen T, Rao DC, Rasmussen-Torvik LJ, Rawal R, Rice T, Ridker PM, Rose LM, Bien SA, Rudan I, Sanna S, Sarzynski MA, Sattar N, Savonen K, Schlessinger D, Scholtens S, Schurmann C, Scott RA, Sennblad B, Siemelink MA, Silbernagel G, Slagboom PE, Snieder H, Staessen JA, Stott DJ, Swertz MA, Swift AJ, Taylor KD, Tayo BO, Thorand B, Thuillier D, Tuomilehto J, Uitterlinden AG, Vandenput L, Vohl MC, Volzke H, Vonk JM, Waeber G, Waldenberger M, Westendorp RGJ, Wild S, Willemsen G, Wolffenbuttel BHR, Wong A, Wright AF, Zhao W, Zillikens MC, Baldassarre D, Balkau B, Bandinelli S, Boger CA, Boomsma DI, Bouchard C, Bruinenberg M, Chasman DI, Chen YD, Chines PS, Cooper RS, Cucca F, Cusi D, Faire U, Ferrucci L, Franks PW, Froguel P, Gordon-Larsen P, Grabe HJ, Gudnason V, Haiman CA, Hayward C, Hveem K, Johnson AD, Wouter Jukema J, Kardia SLR, Kivimaki M, Kooner JS, Kuh D, Laakso M, Lehtimaki T, Marchand LL, Marz W, McCarthy MI, Metspalu A, Morris AP, Ohlsson C, Palmer LJ, Pasterkamp G, Pedersen O, Peters A, Peters U, Polasek O, Psaty BM, Qi L, Rauramaa R, Smith BH, Sorensen TIA, Strauch K, Tiemeier H, Tremoli E, van der Harst P, Vestergaard H, Vollenweider P, Wareham NJ, Weir DR, Whitfield JB, Wilson JF, Tyrrell J, Frayling TM, Barroso I, Boehnke M, Deloukas P, Fox CS, Hirschhorn JN, Hunter DJ, Spector TD, Strachan DP, van Duijn CM, Heid IM, Mohlke KL, Marchini J, Loos RJF, Kilpelainen TO, Liu CT, Borecki IB, North KE, and Cupples LA. Genome-wide meta-analysis of 241,258 adults accounting for smoking behaviour identifies novel loci for obesity traits. Nat Commun 8: 14977, 2017. [DOI] [PMC free article] [PubMed] [Google Scholar]
- 143.Kalashikam RR, Battula KK, Kirlampalli V, Friedman JM, and Nappanveettil G. Obese locus in WNIN/obese rat maps on chromosome 5 upstream of leptin receptor. PLoS One 8: e77679, 2013. [DOI] [PMC free article] [PubMed] [Google Scholar]
- 144.Karlsson T, Rask-Andersen M, Pan G, Hoglund J, Wadelius C, Ek WE, and Johansson A. Contribution of genetics to visceral adiposity and its relation to cardiovascular and metabolic disease. Nat Med 25: 1390–1395, 2019. [DOI] [PubMed] [Google Scholar]
- 145.Kato N, Tamada T, Nabika T, Ueno K, Gotoda T, Matsumoto C, Mashimo T, Sawamura M, Ikeda K, Nara Y, and Yamori Y. Identification of quantitative trait loci for serum cholesterol levels in stroke-prone spontaneously hypertensive rats. Arterioscler Thromb Vasc Biol 20: 223–229, 2000. [DOI] [PubMed] [Google Scholar]
- 146.Kaur Y, Wang DX, Liu HY, and Meyre D. Comprehensive identification of pleiotropic loci for body fat distribution using the NHGRI-EBI Catalog of published genome-wide association studies. Obes Rev 20: 385–406, 2019. [DOI] [PubMed] [Google Scholar]
- 147.Kayashima Y, Tomita H, Zhilicheva S, Kim S, Kim HS, Bennett BJ, and Maeda N. Quantitative trait loci affecting atherosclerosis at the aortic root identified in an intercross between DBA2J and 129S6 apolipoprotein E-null mice. PLoS One 9: e88274, 2014. [DOI] [PMC free article] [PubMed] [Google Scholar]
- 148.Kazakov A, Hall RA, Werner C, Meier T, Trouvain A, Rodionycheva S, Nickel A, Lammert F, Maack C, Bohm M, and Laufs U. Raf kinase inhibitor protein mediates myocardial fibrosis under conditions of enhanced myocardial oxidative stress. Basic Res Cardiol 113: 42, 2018. [DOI] [PMC free article] [PubMed] [Google Scholar]
- 149.Keaton JM, Hellwege JN, Ng MC, Palmer ND, Pankow JS, Fornage M, Wilson JG, Correa A, Rasmussen-Torvik LJ, Rotter JI, Chen YD, Taylor KD, Rich SS, Wagenknecht LE, Freedman BI, and Bowden DW. Genome-Wide Interaction with Insulin Secretion Loci Reveals Novel Loci for Type 2 Diabetes in African Americans. PLoS One 11: e0159977, 2016. [DOI] [PMC free article] [PubMed] [Google Scholar]
- 150.Keele GR, Crouse WL, Kelada SNP, and Valdar W. Determinants of QTL Mapping Power in the Realized Collaborative Cross. G3 (Bethesda) 9: 1707–1727, 2019. [DOI] [PMC free article] [PubMed] [Google Scholar]
- 151.Keele GR, Prokop JW, He H, Holl K, Littrell J, Deal A, Francic S, Cui L, Gatti DM, Broman KW, Tschannen M, Tsaih SW, Zagloul M, Kim Y, Baur B, Fox J, Robinson M, Levy S, Flister MJ, Mott R, Valdar W, and Solberg Woods LC. Genetic Fine-Mapping and Identification of Candidate Genes and Variants for Adiposity Traits in Outbred Rats. Obesity (Silver Spring) 26: 213–222, 2018. [DOI] [PMC free article] [PubMed] [Google Scholar]
- 152.Keele GR, Quach BC, Israel JW, Chappell GA, Lewis L, Safi A, Simon JM, Cotney P, Crawford GE, Valdar W, Rusyn I, and Furey TS. Integrative QTL analysis of gene expression and chromatin accessibility identifies multi-tissue patterns of genetic regulation. PLoS Genet 16: e1008537, 2020. [DOI] [PMC free article] [PubMed] [Google Scholar]
- 153.Keller MP, Rabaglia ME, Schueler KL, Stapleton DS, Gatti DM, Vincent M, Mitok KA, Wang Z, Ishimura T, Simonett SP, Emfinger CH, Das R, Beck T, Kendziorski C, Broman KW, Yandell BS, Churchill GA, and Attie AD. Gene loci associated with insulin secretion in islets from non-diabetic mice. J Clin Invest 129: 4419–4432, 2019. [DOI] [PMC free article] [PubMed] [Google Scholar]
- 154.Klarin D, Damrauer SM, Cho K, Sun YV, Teslovich TM, Honerlaw J, Gagnon DR, DuVall SL, Li J, Peloso GM, Chaffin M, Small AM, Huang J, Tang H, Lynch JA, Ho YL, Liu DJ, Emdin CA, Li AH, Huffman JE, Lee JS, Natarajan P, Chowdhury R, Saleheen D, Vujkovic M, Baras A, Pyarajan S, Di Angelantonio E, Neale BM, Naheed A, Khera AV, Danesh J, Chang KM, Abecasis G, Willer C, Dewey FE, Carey DJ, Global Lipids Genetics C, Myocardial Infarction Genetics C, Geisinger-Regeneron Discov EHRC, Program VAMV, Concato J, Gaziano JM, O’Donnell CJ, Tsao PS, Kathiresan S, Rader DJ, Wilson PWF, and Assimes TL. Genetics of blood lipids among ~300,000 multi-ethnic participants of the Million Veteran Program. Nat Genet 50: 1514–1523, 2018. [DOI] [PMC free article] [PubMed] [Google Scholar]
- 155.Klarin D, Lynch J, Aragam K, Chaffin M, Assimes TL, Huang J, Lee KM, Shao Q, Huffman JE, Natarajan P, Arya S, Small A, Sun YV, Vujkovic M, Freiberg MS, Wang L, Chen J, Saleheen D, Lee JS, Miller DR, Reaven P, Alba PR, Patterson OV, DuVall SL, Boden WE, Beckman JA, Gaziano JM, Concato J, Rader DJ, Cho K, Chang KM, Wilson PWF, O’Donnell CJ, Kathiresan S, Program VAMV, Tsao PS, and Damrauer SM. Genome-wide association study of peripheral artery disease in the Million Veteran Program. Nat Med 25: 1274–1279, 2019. [DOI] [PMC free article] [PubMed] [Google Scholar]
- 156.Koh IU, Lee HJ, Hwang JY, Choi NH, and Lee S. Obesity-related CpG Methylation (cg07814318) of Kruppel-like Factor-13 (KLF13) Gene with Childhood Obesity and its cis-Methylation Quantitative Loci. Sci Rep 7: 45368, 2017. [DOI] [PMC free article] [PubMed] [Google Scholar]
- 157.Kottgen A, Raffler J, Sekula P, and Kastenmuller G. Genome-Wide Association Studies of Metabolite Concentrations (mGWAS): Relevance for Nephrology. Semin Nephrol 38: 151–174, 2018. [DOI] [PubMed] [Google Scholar]
- 158.Kraus WE, Granger CB, Sketch MH Jr., Donahue MP, Ginsburg GS, Hauser ER, Haynes C, Newby LK, Hurdle M, Dowdy ZE, and Shah SH. A Guide for a Cardiovascular Genomics Biorepository: the CATHGEN Experience. J Cardiovasc Transl Res 8: 449–457, 2015. [DOI] [PMC free article] [PubMed] [Google Scholar]
- 159.Kraus WE, Muoio DM, Stevens R, Craig D, Bain JR, Grass E, Haynes C, Kwee L, Qin X, Slentz DH, Krupp D, Muehlbauer M, Hauser ER, Gregory SG, Newgard CB, and Shah SH. Metabolomic Quantitative Trait Loci (mQTL) Mapping Implicates the Ubiquitin Proteasome System in Cardiovascular Disease Pathogenesis. PLoS Genet 11: e1005553, 2015. [DOI] [PMC free article] [PubMed] [Google Scholar]
- 160.Krijger PH, and de Laat W. Regulation of disease-associated gene expression in the 3D genome. Nat Rev Mol Cell Biol 17: 771–782, 2016. [DOI] [PubMed] [Google Scholar]
- 161.Kumazawa M, Kobayashi M, Io F, Kawai T, Nishimura M, Ohno T, and Horio F. Searching for genetic factors of fatty liver in SMXA-5 mice by quantitative trait loci analysis under a high-fat diet. J Lipid Res 48: 2039–2046, 2007. [DOI] [PubMed] [Google Scholar]
- 162.Kupers LK, Monnereau C, Sharp GC, Yousefi P, Salas LA, Ghantous A, Page CM, Reese SE, Wilcox AJ, Czamara D, Starling AP, Novoloaca A, Lent S, Roy R, Hoyo C, Breton CV, Allard C, Just AC, Bakulski KM, Holloway JW, Everson TM, Xu CJ, Huang RC, van der Plaat DA, Wielscher M, Merid SK, Ullemar V, Rezwan FI, Lahti J, van Dongen J, Langie SAS, Richardson TG, Magnus MC, Nohr EA, Xu Z, Duijts L, Zhao S, Zhang W, Plusquin M, DeMeo DL, Solomon O, Heimovaara JH, Jima DD, Gao L, Bustamante M, Perron P, Wright RO, Hertz-Picciotto I, Zhang H, Karagas MR, Gehring U, Marsit CJ, Beilin LJ, Vonk JM, Jarvelin MR, Bergstrom A, Ortqvist AK, Ewart S, Villa PM, Moore SE, Willemsen G, Standaert ARL, Haberg SE, Sorensen TIA, Taylor JA, Raikkonen K, Yang IV, Kechris K, Nawrot TS, Silver MJ, Gong YY, Richiardi L, Kogevinas M, Litonjua AA, Eskenazi B, Huen K, Mbarek H, Maguire RL, Dwyer T, Vrijheid M, Bouchard L, Baccarelli AA, Croen LA, Karmaus W, Anderson D, de Vries M, Sebert S, Kere J, Karlsson R, Arshad SH, Hamalainen E, Routledge MN, Boomsma DI, Feinberg AP, Newschaffer CJ, Govarts E, Moisse M, Fallin MD, Melen E, Prentice AM, Kajantie E, Almqvist C, Oken E, Dabelea D, Boezen HM, Melton PE, Wright RJ, Koppelman GH, Trevisi L, Hivert MF, Sunyer J, Munthe-Kaas MC, Murphy SK, Corpeleijn E, Wiemels J, Holland N, Herceg Z, Binder EB, Davey Smith G, Jaddoe VWV, Lie RT, Nystad W, London SJ, Lawlor DA, Relton CL, Snieder H, and Felix JF. Meta-analysis of epigenome-wide association studies in neonates reveals widespread differential DNA methylation associated with birthweight. Nat Commun 10: 1893, 2019. [DOI] [PMC free article] [PubMed] [Google Scholar]
- 163.Kwitek-Black AE, and Jacob HJ. The use of designer rats in the genetic dissection of hypertension. Curr Hypertens Rep 3: 12–18, 2001. [DOI] [PubMed] [Google Scholar]
- 164.Kyono Y, Kitzman JO, and Parker SCJ. Genomic annotation of disease-associated variants reveals shared functional contexts. Diabetologia 62: 735–743, 2019. [DOI] [PMC free article] [PubMed] [Google Scholar]
- 165.Laakso M, Kuusisto J, Stancakova A, Kuulasmaa T, Pajukanta P, Lusis AJ, Collins FS, Mohlke KL, and Boehnke M. The Metabolic Syndrome in Men study: a resource for studies of metabolic and cardiovascular diseases. J Lipid Res 58: 481–493, 2017. [DOI] [PMC free article] [PubMed] [Google Scholar]
- 166.Ladha FA, Stitzel ML, and Hinson JT. From GWAS Association to Function: Candidate Gene Screening Within Insulin Resistance-Associated Genomic Loci Using a Preadipocyte Differentiation Model. Circ Res 126: 347–349, 2020. [DOI] [PMC free article] [PubMed] [Google Scholar]
- 167.Lam SM, Wang Y, Li B, Du J, and Shui G. Metabolomics through the lens of precision cardiovascular medicine. J Genet Genomics 44: 127–138, 2017. [DOI] [PubMed] [Google Scholar]
- 168.Landgraf K, Scholz M, Kovacs P, Kiess W, and Korner A. FTO Obesity Risk Variants Are Linked to Adipocyte IRX3 Expression and BMI of Children - Relevance of FTO Variants to Defend Body Weight in Lean Children? PLoS One 11: e0161739, 2016. [DOI] [PMC free article] [PubMed] [Google Scholar]
- 169.Langfelder P, and Horvath S. WGCNA: an R package for weighted correlation network analysis. BMC Bioinformatics 9: 559, 2008. [DOI] [PMC free article] [PubMed] [Google Scholar]
- 170.Lappalainen T, Scott AJ, Brandt M, and Hall IM. Genomic Analysis in the Age of Human Genome Sequencing. Cell 177: 70–84, 2019. [DOI] [PMC free article] [PubMed] [Google Scholar]
- 171.Larson NB, Decker PA, Wassel CL, Pankow JS, Tang W, Hanson NQ, Tsai MY, and Bielinski SJ. Blood group antigen loci demonstrate multivariate genetic associations with circulating cellular adhesion protein levels in the Multi-Ethnic Study of Atherosclerosis. Hum Genet 135: 415–423, 2016. [DOI] [PMC free article] [PubMed] [Google Scholar]
- 172.Lau E, Paik DT, and Wu JC. Systems-Wide Approaches in Induced Pluripotent Stem Cell Models. Annu Rev Pathol 14: 395–419, 2019. [DOI] [PMC free article] [PubMed] [Google Scholar]
- 173.Law M, and Shaw DR. Mouse Genome Informatics (MGI) Is the International Resource for Information on the Laboratory Mouse. Methods Mol Biol 1757: 141–161, 2018. [DOI] [PubMed] [Google Scholar]
- 174.Leal-Gutierrez JD, Elzo MA, and Mateescu RG. Identification of eQTLs and sQTLs associated with meat quality in beef. BMC Genomics 21: 104, 2020. [DOI] [PMC free article] [PubMed] [Google Scholar]
- 175.Lewis CM, and Vassos E. Polygenic risk scores: from research tools to clinical instruments. Genome Med 12: 44, 2020. [DOI] [PMC free article] [PubMed] [Google Scholar]
- 176.Li H, Khor CC, Fan J, Lv J, Yu C, Guo Y, Bian Z, Yang L, Millwood IY, Walters RG, Chen Y, Yuan JM, Yang Y, Hu C, Chen J, Chen Z, Koh WP, Huang T, and Li L. Genetic risk, adherence to a healthy lifestyle, and type 2 diabetes risk among 550,000 Chinese adults: results from 2 independent Asian cohorts. Am J Clin Nutr 111: 698–707, 2020. [DOI] [PMC free article] [PubMed] [Google Scholar]
- 177.Li Y, Hu M, and Shen Y. Gene regulation in the 3D genome. Hum Mol Genet 27: R228–R233, 2018. [DOI] [PMC free article] [PubMed] [Google Scholar]
- 178.Li Y, Sekula P, Wuttke M, Wahrheit J, Hausknecht B, Schultheiss UT, Gronwald W, Schlosser P, Tucci S, Ekici AB, Spiekerkoetter U, Kronenberg F, Eckardt KU, Oefner PJ, Kottgen A, and Investigators G. Genome-Wide Association Studies of Metabolites in Patients with CKD Identify Multiple Loci and Illuminate Tubular Transport Mechanisms. J Am Soc Nephrol 29: 1513–1524, 2018. [DOI] [PMC free article] [PubMed] [Google Scholar]
- 179.Li YI, van de Geijn B, Raj A, Knowles DA, Petti AA, Golan D, Gilad Y, and Pritchard JK. RNA splicing is a primary link between genetic variation and disease. Science 352: 600–604, 2016. [DOI] [PMC free article] [PubMed] [Google Scholar]
- 180.Li Z, Votava JA, Zajac GJM, Nguyen JN, Leyva Jaimes FB, Ly SM, Brinkman JA, De Giorgi M, Kaul S, Green CL, St Clair SL, Belisle SL, Rios JM, Nelson DW, Sorci-Thomas MG, Lagor WR, Lamming DW, Eric Yen CL, and Parks BW. Integrating Mouse and Human Genetic Data to Move beyond GWAS and Identify Causal Genes in Cholesterol Metabolism. Cell Metab 31: 741–754 e745, 2020. [DOI] [PMC free article] [PubMed] [Google Scholar]
- 181.Lin C, Fesi BD, Marquis M, Bosak NP, Lysenko A, Koshnevisan MA, Duke FF, Theodorides ML, Nelson TM, McDaniel AH, Avigdor M, Arayata CJ, Shaw L, Bachmanov AA, and Reed DR. Burly1 is a mouse QTL for lean body mass that maps to a 0.8-Mb region of chromosome 2. Mamm Genome 29: 325–343, 2018. [DOI] [PubMed] [Google Scholar]
- 182.Lin H, Mueller-Nurasyid M, Smith AV, Arking DE, Barnard J, Bartz TM, Lunetta KL, Lohman K, Kleber ME, Lubitz SA, Geelhoed B, Trompet S, Niemeijer MN, Kacprowski T, Chasman DI, Klarin D, Sinner MF, Waldenberger M, Meitinger T, Harris TB, Launer LJ, Soliman EZ, Chen LY, Smith JD, Van Wagoner DR, Rotter JI, Psaty BM, Xie Z, Hendricks AE, Ding J, Delgado GE, Verweij N, van der Harst P, Macfarlane PW, Ford I, Hofman A, Uitterlinden A, Heeringa J, Franco OH, Kors JA, Weiss S, Volzke H, Rose LM, Natarajan P, Kathiresan S, Kaab S, Gudnason V, Alonso A, Chung MK, Heckbert SR, Benjamin EJ, Liu Y, Marz W, Rienstra M, Jukema JW, Stricker BH, Dorr M, Albert CM, and Ellinor PT. Gene-gene Interaction Analyses for Atrial Fibrillation. Sci Rep 6: 35371, 2016. [DOI] [PMC free article] [PubMed] [Google Scholar]
- 183.Lin J, and Musunuru K. From Genotype to Phenotype: A Primer on the Functional Follow-up of Genome-Wide Association Studies in Cardiovascular Disease. Circ Genom Precis Med 11: 2018. [PMC free article] [PubMed] [Google Scholar]
- 184.Lind L. Genome-Wide Association Study of the Metabolic Syndrome in UK Biobank. Metab Syndr Relat Disord 17: 505–511, 2019. [DOI] [PubMed] [Google Scholar]
- 185.Liu DJ, Peloso GM, Yu H, Butterworth AS, Wang X, Mahajan A, Saleheen D, Emdin C, Alam D, Alves AC, Amouyel P, Di Angelantonio E, Arveiler D, Assimes TL, Auer PL, Baber U, Ballantyne CM, Bang LE, Benn M, Bis JC, Boehnke M, Boerwinkle E, Bork-Jensen J, Bottinger EP, Brandslund I, Brown M, Busonero F, Caulfield MJ, Chambers JC, Chasman DI, Chen YE, Chen YI, Chowdhury R, Christensen C, Chu AY, Connell JM, Cucca F, Cupples LA, Damrauer SM, Davies G, Deary IJ, Dedoussis G, Denny JC, Dominiczak A, Dube MP, Ebeling T, Eiriksdottir G, Esko T, Farmaki AE, Feitosa MF, Ferrario M, Ferrieres J, Ford I, Fornage M, Franks PW, Frayling TM, Frikke-Schmidt R, Fritsche LG, Frossard P, Fuster V, Ganesh SK, Gao W, Garcia ME, Gieger C, Giulianini F, Goodarzi MO, Grallert H, Grarup N, Groop L, Grove ML, Gudnason V, Hansen T, Harris TB, Hayward C, Hirschhorn JN, Holmen OL, Huffman J, Huo Y, Hveem K, Jabeen S, Jackson AU, Jakobsdottir J, Jarvelin MR, Jensen GB, Jorgensen ME, Jukema JW, Justesen JM, Kamstrup PR, Kanoni S, Karpe F, Kee F, Khera AV, Klarin D, Koistinen HA, Kooner JS, Kooperberg C, Kuulasmaa K, Kuusisto J, Laakso M, Lakka T, Langenberg C, Langsted A, Launer LJ, Lauritzen T, Liewald DCM, Lin LA, Linneberg A, Loos RJF, Lu Y, Lu X, Magi R, Malarstig A, Manichaikul A, Manning AK, Mantyselka P, Marouli E, Masca NGD, Maschio A, Meigs JB, Melander O, Metspalu A, Morris AP, Morrison AC, Mulas A, Muller-Nurasyid M, Munroe PB, Neville MJ, Nielsen JB, Nielsen SF, Nordestgaard BG, Ordovas JM, Mehran R, O’Donnell CJ, Orho-Melander M, Molony CM, Muntendam P, Padmanabhan S, Palmer CNA, Pasko D, Patel AP, Pedersen O, Perola M, Peters A, Pisinger C, Pistis G, Polasek O, Poulter N, Psaty BM, Rader DJ, Rasheed A, Rauramaa R, Reilly DF, Reiner AP, Renstrom F, Rich SS, Ridker PM, Rioux JD, Robertson NR, Roden DM, Rotter JI, Rudan I, Salomaa V, Samani NJ, Sanna S, Sattar N, Schmidt EM, Scott RA, Sever P, Sevilla RS, Shaffer CM, Sim X, Sivapalaratnam S, Small KS, Smith AV, Smith BH, Somayajula S, Southam L, Spector TD, Speliotes EK, Starr JM, Stirrups KE, Stitziel N, Strauch K, Stringham HM, Surendran P, Tada H, Tall AR, Tang H, Tardif JC, Taylor KD, Trompet S, Tsao PS, Tuomilehto J, Tybjaerg-Hansen A, van Zuydam NR, Varbo A, Varga TV, Virtamo J, Waldenberger M, Wang N, Wareham NJ, Warren HR, Weeke PE, Weinstock J, Wessel J, Wilson JG, Wilson PWF, Xu M, Yaghootkar H, Young R, Zeggini E, Zhang H, Zheng NS, Zhang W, Zhang Y, Zhou W, Zhou Y, Zoledziewska M, Charge Diabetes Working G, Consortium EP-I, Consortium E-C, Consortium G, Program VAMV, Howson JMM, Danesh J, McCarthy MI, Cowan CA, Abecasis G, Deloukas P, Musunuru K, Willer CJ, and Kathiresan S.Exome-wide association study of plasma lipids in >300,000 individuals. Nat Genet 49: 1758–1766, 2017. [DOI] [PMC free article] [PubMed] [Google Scholar]
- 186.Liu X, and Klein PS. Glycogen synthase kinase-3 and alternative splicing. Wiley Interdiscip Rev RNA 9: e1501, 2018. [DOI] [PMC free article] [PubMed] [Google Scholar]
- 187.Liu Y, Huang J, Urbanowicz RJ, Chen K, Manduchi E, Greene CS, Moore JH, Scheet P, and Chen Y. Embracing study heterogeneity for finding genetic interactions in large-scale research consortia. Genet Epidemiol 44: 52–66, 2020. [DOI] [PMC free article] [PubMed] [Google Scholar]
- 188.Locke AE, Steinberg KM, Chiang CWK, Service SK, Havulinna AS, Stell L, Pirinen M, Abel HJ, Chiang CC, Fulton RS, Jackson AU, Kang CJ, Kanchi KL, Koboldt DC, Larson DE, Nelson J, Nicholas TJ, Pietila A, Ramensky V, Ray D, Scott LJ, Stringham HM, Vangipurapu J, Welch R, Yajnik P, Yin X, Eriksson JG, Ala-Korpela M, Jarvelin MR, Mannikko M, Laivuori H, FinnGen P, Dutcher SK, Stitziel NO, Wilson RK, Hall IM, Sabatti C, Palotie A, Salomaa V, Laakso M, Ripatti S, Boehnke M, and Freimer NB. Exome sequencing of Finnish isolates enhances rare-variant association power. Nature 572: 323–328, 2019. [DOI] [PMC free article] [PubMed] [Google Scholar]
- 189.Lopez-Cortegano E, and Caballero A. Inferring the Nature of Missing Heritability in Human Traits Using Data from the GWAS Catalog. Genetics 212: 891–904, 2019. [DOI] [PMC free article] [PubMed] [Google Scholar]
- 190.Lu Y, Quan C, Chen H, Bo X, and Zhang C. 3DSNP: a database for linking human noncoding SNPs to their three-dimensional interacting genes. Nucleic Acids Res 45: D643–D649, 2017. [DOI] [PMC free article] [PubMed] [Google Scholar]
- 191.Luo Y, Hitz BC, Gabdank I, Hilton JA, Kagda MS, Lam B, Myers Z, Sud P, Jou J, Lin K, Baymuradov UK, Graham K, Litton C, Miyasato SR, Strattan JS, Jolanki O, Lee JW, Tanaka FY, Adenekan P, O’Neill E, and Cherry JM. New developments on the Encyclopedia of DNA Elements (ENCODE) data portal. Nucleic Acids Res 48: D882–D889, 2020. [DOI] [PMC free article] [PubMed] [Google Scholar]
- 192.Lusis AJ, Seldin MM, Allayee H, Bennett BJ, Civelek M, Davis RC, Eskin E, Farber CR, Hui S, Mehrabian M, Norheim F, Pan C, Parks B, Rau CD, Smith DJ, Vallim T, Wang Y, and Wang J. The Hybrid Mouse Diversity Panel: a resource for systems genetics analyses of metabolic and cardiovascular traits. J Lipid Res 57: 925–942, 2016. [DOI] [PMC free article] [PubMed] [Google Scholar]
- 193.Luzum JA, and Lanfear DE. Pharmacogenetic Risk Scores for Perindopril Clinical and Cost Effectiveness in Stable Coronary Artery Disease: When Are We Ready to Implement? J Am Heart Assoc 5: e003440, 2016. [DOI] [PMC free article] [PubMed] [Google Scholar]
- 194.Ma L, Jia P, and Zhao Z. Splicing QTL of human adipose-related traits. Sci Rep 8: 318, 2018. [DOI] [PMC free article] [PubMed] [Google Scholar]
- 195.Ma X, Ezer D, Adryan B, and Stevens TJ. Canonical and single-cell Hi-C reveal distinct chromatin interaction sub-networks of mammalian transcription factors. Genome Biol 19: 174, 2018. [DOI] [PMC free article] [PubMed] [Google Scholar]
- 196.MacArthur J, Bowler E, Cerezo M, Gil L, Hall P, Hastings E, Junkins H, McMahon A, Milano A, Morales J, Pendlington ZM, Welter D, Burdett T, Hindorff L, Flicek P, Cunningham F, and Parkinson H. The new NHGRI-EBI Catalog of published genome-wide association studies (GWAS Catalog). Nucleic Acids Res 45: D896–D901, 2017. [DOI] [PMC free article] [PubMed] [Google Scholar]
- 197.Malinowski J, Goodloe R, Brown-Gentry K, and Crawford DC. Cryptic relatedness in epidemiologic collections accessed for genetic association studies: experiences from the Epidemiologic Architecture for Genes Linked to Environment (EAGLE) study and the National Health and Nutrition Examination Surveys (NHANES). Front Genet 6: 317, 2015. [DOI] [PMC free article] [PubMed] [Google Scholar]
- 198.Mani A Local Ancestry Association, Admixture Mapping, and Ongoing Challenges. Circ Cardiovasc Genet 10: 2017. [DOI] [PMC free article] [PubMed] [Google Scholar]
- 199.Manzoni C, Kia DA, Vandrovcova J, Hardy J, Wood NW, Lewis PA, and Ferrari R. Genome, transcriptome and proteome: the rise of omics data and their integration in biomedical sciences. Brief Bioinform 19: 286–302, 2018. [DOI] [PMC free article] [PubMed] [Google Scholar]
- 200.Marigorta UM, Rodriguez JA, Gibson G, and Navarro A. Replicability and Prediction: Lessons and Challenges from GWAS. Trends Genet 34: 504–517, 2018. [DOI] [PMC free article] [PubMed] [Google Scholar]
- 201.Marnetto D, Parna K, Lall K, Molinaro L, Montinaro F, Haller T, Metspalu M, Magi R, Fischer K, and Pagani L. Ancestry deconvolution and partial polygenic score can improve susceptibility predictions in recently admixed individuals. Nat Commun 11: 1628, 2020. [DOI] [PMC free article] [PubMed] [Google Scholar]
- 202.Marston NA, Patel PN, Kamanu FK, Nordio F, Melloni GM, Roselli C, Gurmu Y, Weng LC, Bonaca MP, Giugliano RP, Scirica BM, O’Donoghue ML, Cannon CP, Anderson CD, Bhatt DL, Gabriel Steg P, Cohen M, Storey RF, Sever P, Keech AC, Raz I, Mosenzon O, Antman EM, Braunwald E, Ellinor PT, Lubitz SA, Sabatine MS, and Ruff CT. Clinical Application of a Novel Genetic Risk Score for Ischemic Stroke in Patients With Cardiometabolic Disease. Circulation 143: 470–478, 2021. [DOI] [PMC free article] [PubMed] [Google Scholar]
- 203.Mashimo T, Ogawa H, Cui ZH, Harada Y, Kawakami K, Masuda J, Yamori Y, and Nabika T. Comprehensive QTL analysis of serum cholesterol levels before and after a high-cholesterol diet in SHRSP. Physiol Genomics 30: 95–101, 2007. [DOI] [PubMed] [Google Scholar]
- 204.Matise TC, Ambite JL, Buyske S, Carlson CS, Cole SA, Crawford DC, Haiman CA, Heiss G, Kooperberg C, Marchand LL, Manolio TA, North KE, Peters U, Ritchie MD, Hindorff LA, Haines JL, and Study P. The Next PAGE in understanding complex traits: design for the analysis of Population Architecture Using Genetics and Epidemiology (PAGE) Study. Am J Epidemiol 174: 849–859, 2011. [DOI] [PMC free article] [PubMed] [Google Scholar]
- 205.Meek S, Mashimo T, and Burdon T. From engineering to editing the rat genome. Mamm Genome 28: 302–314, 2017. [DOI] [PMC free article] [PubMed] [Google Scholar]
- 206.Mehra P, and Kalani A. What’s in the “fold”? Life Sci 211: 118–125, 2018. [DOI] [PubMed] [Google Scholar]
- 207.Menni C, Hernandez MM, Vital M, Mohney RP, Spector TD, and Valdes AM. Circulating levels of the anti-oxidant indoleproprionic acid are associated with higher gut microbiome diversity. Gut Microbes 10: 688–695, 2019. [DOI] [PMC free article] [PubMed] [Google Scholar]
- 208.Menni C, Zhu J, Le Roy CI, Mompeo O, Young K, Rebholz CM, Selvin E, North KE, Mohney RP, Bell JT, Boerwinkle E, Spector TD, Mangino M, Yu B, and Valdes AM. Serum metabolites reflecting gut microbiome alpha diversity predict type 2 diabetes. Gut Microbes 11: 1632–1642, 2020. [DOI] [PMC free article] [PubMed] [Google Scholar]
- 209.Messas N, Dube MP, and Tardif JC. Pharmacogenetics of Lipid-Lowering Agents: an Update Review on Genotype-Dependent Effects of HDL-Targetingand Statin Therapies. Curr Atheroscler Rep 19: 43, 2017. [DOI] [PubMed] [Google Scholar]
- 210.Miguel-Escalada I, Bonas-Guarch S, Cebola I, Ponsa-Cobas J, Mendieta-Esteban J, Atla G, Javierre BM, Rolando DMY, Farabella I, Morgan CC, Garcia-Hurtado J, Beucher A, Moran I, Pasquali L, Ramos-Rodriguez M, Appel EVR, Linneberg A, Gjesing AP, Witte DR, Pedersen O, Grarup N, Ravassard P, Torrents D, Mercader JM, Piemonti L, Berney T, de Koning EJP, Kerr-Conte J, Pattou F, Fedko IO, Groop L, Prokopenko I, Hansen T, Marti-Renom MA, Fraser P, and Ferrer J. Human pancreatic islet three-dimensional chromatin architecture provides insights into the genetics of type 2 diabetes. Nat Genet 51: 1137–1148, 2019. [DOI] [PMC free article] [PubMed] [Google Scholar]
- 211.Mikhaylova AV, and Thornton TA. Accuracy of Gene Expression Prediction From Genotype Data With PrediXcan Varies Across and Within Continental Populations. Front Genet 10: 261, 2019. [DOI] [PMC free article] [PubMed] [Google Scholar]
- 212.Miller AK, Chen A, Bartlett J, Wang L, Williams SM, and Buchner DA. A Novel Mapping Strategy Utilizing Mouse Chromosome Substitution Strains Identifies Multiple Epistatic Interactions That Regulate Complex Traits. G3 (Bethesda) 10: 4553–4563, 2020. [DOI] [PMC free article] [PubMed] [Google Scholar]
- 213.Mittelstrass K, and Waldenberger M. DNA methylation in human lipid metabolism and related diseases. Curr Opin Lipidol 29: 116–124, 2018. [DOI] [PMC free article] [PubMed] [Google Scholar]
- 214.Moayyeri A, Hammond CJ, Hart DJ, and Spector TD. The UK Adult Twin Registry (TwinsUK Resource). Twin Res Hum Genet 16: 144–149, 2013. [DOI] [PMC free article] [PubMed] [Google Scholar]
- 215.Monlong J, Calvo M, Ferreira PG, and Guigo R. Identification of genetic variants associated with alternative splicing using sQTLseekeR. Nat Commun 5: 4698, 2014. [DOI] [PMC free article] [PubMed] [Google Scholar]
- 216.Montefiori LE, Sobreira DR, Sakabe NJ, Aneas I, Joslin AC, Hansen GT, Bozek G, Moskowitz IP, McNally EM, and Nobrega MA. A promoter interaction map for cardiovascular disease genetics. Elife 7: 2018. [DOI] [PMC free article] [PubMed] [Google Scholar]
- 217.Montenegro-Burke JR, Guijas C, and Siuzdak G. METLIN: A Tandem Mass Spectral Library of Standards. Methods Mol Biol 2104: 149–163, 2020. [DOI] [PMC free article] [PubMed] [Google Scholar]
- 218.Moreno-Moral A, and Petretto E. From integrative genomics to systems genetics in the rat to link genotypes to phenotypes. Dis Model Mech 9: 1097–1110, 2016. [DOI] [PMC free article] [PubMed] [Google Scholar]
- 219.Moreno C, Dumas P, Kaldunski ML, Tonellato PJ, Greene AS, Roman RJ, Cheng Q, Wang Z, Jacob HJ, and Cowley AW Jr. Genomic map of cardiovascular phenotypes of hypertension in female Dahl S rats. Physiol Genomics 15: 243–257, 2003. [DOI] [PubMed] [Google Scholar]
- 220.Morgan AP, Fu CP, Kao CY, Welsh CE, Didion JP, Yadgary L, Hyacinth L, Ferris MT, Bell TA, Miller DR, Giusti-Rodriguez P, Nonneman RJ, Cook KD, Whitmire JK, Gralinski LE, Keller M, Attie AD, Churchill GA, Petkov P, Sullivan PF, Brennan JR, McMillan L, and Pardo-Manuel de Villena F. The Mouse Universal Genotyping Array: From Substrains to Subspecies. G3 (Bethesda) 6: 263–279, 2015. [DOI] [PMC free article] [PubMed] [Google Scholar]
- 221.Mouresan EF, Gonzalez-Rodriguez A, Canas-Alvarez JJ, Munilla S, Altarriba J, Diaz C, Baro JA, Molina A, Lopez-Buesa P, Piedrafita J, and Varona L. Mapping Recombination Rate on the Autosomal Chromosomes Based on the Persistency of Linkage Disequilibrium Phase Among Autochthonous Beef Cattle Populations in Spain. Front Genet 10: 1170, 2019. [DOI] [PMC free article] [PubMed] [Google Scholar]
- 222.Mulligan MK, Mozhui K, Prins P, and Williams RW. GeneNetwork: A Toolbox for Systems Genetics. Methods Mol Biol 1488: 75–120, 2017. [DOI] [PMC free article] [PubMed] [Google Scholar]
- 223.Musunuru K, Arora P, Cooke JP, Ferguson JF, Hershberger RE, Hickey KT, Lee JM, Lima JAC, Loscalzo J, Pereira NL, Russell MW, Shah SH, Sheikh F, Wang TJ, MacRae CA, American Heart Association Council on G, Precision M, Council on Cardiovascular Disease in the Y, Council on C, Stroke N, Council on Cardiovascular R, Intervention, Council on Peripheral Vascular D, Council on Quality of C, Outcomes R, and Stroke C. Interdisciplinary Models for Research and Clinical Endeavors in Genomic Medicine: A Scientific Statement From the American Heart Association. Circ Genom Precis Med 11: e000046, 2018. [DOI] [PMC free article] [PubMed] [Google Scholar]
- 224.Musunuru K, Strong A, Frank-Kamenetsky M, Lee NE, Ahfeldt T, Sachs KV, Li X, Li H, Kuperwasser N, Ruda VM, Pirruccello JP, Muchmore B, Prokunina-Olsson L, Hall JL, Schadt EE, Morales CR, Lund-Katz S, Phillips MC, Wong J, Cantley W, Racie T, Ejebe KG, Orho-Melander M, Melander O, Koteliansky V, Fitzgerald K, Krauss RM, Cowan CA, Kathiresan S, and Rader DJ. From noncoding variant to phenotype via SORT1 at the 1p13 cholesterol locus. Nature 466: 714–719, 2010. [DOI] [PMC free article] [PubMed] [Google Scholar]
- 225.Nag A, Kurushima Y, Bowyer RCE, Wells PM, Weiss S, Pietzner M, Kocher T, Raffler J, Volker U, Mangino M, Spector TD, Milburn MV, Kastenmuller G, Mohney RP, Suhre K, Menni C, and Steves CJ. Genome-wide scan identifies novel genetic loci regulating salivary metabolite levels. Hum Mol Genet 29: 864–875, 2020. [DOI] [PMC free article] [PubMed] [Google Scholar]
- 226.National Heart L, and Blood Institute, National Institutes of Health, U.S. Department of Health and Human Services. The NHLBI BioData Catalyst. Zenodo; 2020. [Google Scholar]
- 227.Nelson CP, Goel A, Butterworth AS, Kanoni S, Webb TR, Marouli E, Zeng L, Ntalla I, Lai FY, Hopewell JC, Giannakopoulou O, Jiang T, Hamby SE, Di Angelantonio E, Assimes TL, Bottinger EP, Chambers JC, Clarke R, Palmer CNA, Cubbon RM, Ellinor P, Ermel R, Evangelou E, Franks PW, Grace C, Gu D, Hingorani AD, Howson JMM, Ingelsson E, Kastrati A, Kessler T, Kyriakou T, Lehtimaki T, Lu X, Lu Y, Marz W, McPherson R, Metspalu A, Pujades-Rodriguez M, Ruusalepp A, Schadt EE, Schmidt AF, Sweeting MJ, Zalloua PA, AlGhalayini K, Keavney BD, Kooner JS, Loos RJF, Patel RS, Rutter MK, Tomaszewski M, Tzoulaki I, Zeggini E, Erdmann J, Dedoussis G, Bjorkegren JLM, Consortium E-C, CardioGramplusC4D, group UKBCCCw, Schunkert H, Farrall M, Danesh J, Samani NJ, Watkins H, and Deloukas P. Association analyses based on false discovery rate implicate new loci for coronary artery disease. Nat Genet 49: 1385–1391, 2017. [DOI] [PubMed] [Google Scholar]
- 228.Nettleton JA, Follis JL, Ngwa JS, Smith CE, Ahmad S, Tanaka T, Wojczynski MK, Voortman T, Lemaitre RN, Kristiansson K, Nuotio ML, Houston DK, Perala MM, Qi Q, Sonestedt E, Manichaikul A, Kanoni S, Ganna A, Mikkila V, North KE, Siscovick DS, Harald K, McKeown NM, Johansson I, Rissanen H, Liu Y, Lahti J, Hu FB, Bandinelli S, Rukh G, Rich S, Booij L, Dmitriou M, Ax E, Raitakari O, Mukamal K, Mannisto S, Hallmans G, Jula A, Ericson U, Jacobs DR Jr., Van Rooij FJ, Deloukas P, Sjogren P, Kahonen M, Djousse L, Perola M, Barroso I, Hofman A, Stirrups K, Viikari J, Uitterlinden AG, Kalafati IP, Franco OH, Mozaffarian D, Salomaa V, Borecki IB, Knekt P, Kritchevsky SB, Eriksson JG, Dedoussis GV, Qi L, Ferrucci L, Orho-Melander M, Zillikens MC, Ingelsson E, Lehtimaki T, Renstrom F, Cupples LA, Loos RJ, and Franks PW. Gene x dietary pattern interactions in obesity: analysis of up to 68 317 adults of European ancestry. Hum Mol Genet 24: 4728–4738, 2015. [DOI] [PMC free article] [PubMed] [Google Scholar]
- 229.Nishi A, Alexander M, Fowler JH, and Christakis NA. Assortative mating at loci under recent natural selection in humans. Biosystems 187: 104040, 2020. [DOI] [PMC free article] [PubMed] [Google Scholar]
- 230.Nishihara E, Tsaih SW, Tsukahara C, Langley S, Sheehan S, DiPetrillo K, Kunita S, Yagami K, Churchill GA, Paigen B, and Sugiyama F. Quantitative trait loci associated with blood pressure of metabolic syndrome in the progeny of NZO/HILtJxC3H/HeJ intercrosses. Mamm Genome 18: 573–583, 2007. [DOI] [PubMed] [Google Scholar]
- 231.Niu X, Zhang J, Zhang L, Hou Y, Pu S, Chu A, Bai M, and Zhang Z. Weighted Gene Co-Expression Network Analysis Identifies Critical Genes in the Development of Heart Failure After Acute Myocardial Infarction. Front Genet 10: 1214, 2019. [DOI] [PMC free article] [PubMed] [Google Scholar]
- 232.Noll KE, Ferris MT, and Heise MT. The Collaborative Cross: A Systems Genetics Resource for Studying Host-Pathogen Interactions. Cell Host Microbe 25: 484–498, 2019. [DOI] [PMC free article] [PubMed] [Google Scholar]
- 233.Norheim F, Chella Krishnan K, Bjellaas T, Vergnes L, Pan C, Parks BW, Meng Y, Lang J, Ward JA, Reue K, Mehrabian M, Gundersen TE, Peterfy M, Dalen KT, Drevon CA, Hui ST, Lusis AJ, and Seldin MM. Genetic regulation of liver lipids in a mouse model of insulin resistance and hepatic steatosis. Mol Syst Biol 17: e9684, 2021. [DOI] [PMC free article] [PubMed] [Google Scholar]
- 234.Nowak TS Jr., and Mulligan MK. Impact of C57BL/6 substrain on sex-dependent differences in mouse stroke models. Neurochem Int 127: 12–21, 2019. [DOI] [PubMed] [Google Scholar]
- 235.Nsengimana J, and Bishop DT. Design Considerations for Genetic Linkage and Association Studies. Methods Mol Biol 1666: 257–281, 2017. [DOI] [PubMed] [Google Scholar]
- 236.Oh SS, Galanter J, Thakur N, Pino-Yanes M, Barcelo NE, White MJ, de Bruin DM, Greenblatt RM, Bibbins-Domingo K, Wu AH, Borrell LN, Gunter C, Powe NR, and Burchard EG. Diversity in Clinical and Biomedical Research: A Promise Yet to Be Fulfilled. PLoS Med 12: e1001918, 2015. [DOI] [PMC free article] [PubMed] [Google Scholar]
- 237.Oishi Y, and Manabe I. Organ System Crosstalk in Cardiometabolic Disease in the Age of Multimorbidity. Front Cardiovasc Med 7: 64, 2020. [DOI] [PMC free article] [PubMed] [Google Scholar]
- 238.Ongen H, and Dermitzakis ET. Alternative Splicing QTLs in European and African Populations. Am J Hum Genet 97: 567–575, 2015. [DOI] [PMC free article] [PubMed] [Google Scholar]
- 239.Orozco LD, Farrell C, Hale C, Rubbi L, Rinaldi A, Civelek M, Pan C, Lam L, Montoya D, Edillor C, Seldin M, Boehnke M, Mohlke KL, Jacobsen S, Kuusisto J, Laakso M, Lusis AJ, and Pellegrini M. Epigenome-wide association in adipose tissue from the METSIM cohort. Hum Mol Genet 27: 2586, 2018. [DOI] [PMC free article] [PubMed] [Google Scholar]
- 240.Ott J, Wang J, and Leal SM. Genetic linkage analysis in the age of whole-genome sequencing. Nat Rev Genet 16: 275–284, 2015. [DOI] [PMC free article] [PubMed] [Google Scholar]
- 241.Oughtred R, Stark C, Breitkreutz BJ, Rust J, Boucher L, Chang C, Kolas N, O’Donnell L, Leung G, McAdam R, Zhang F, Dolma S, Willems A, Coulombe-Huntington J, Chatr-Aryamontri A, Dolinski K, and Tyers M. The BioGRID interaction database: 2019 update. Nucleic Acids Res 47: D529–D541, 2019. [DOI] [PMC free article] [PubMed] [Google Scholar]
- 242.Pai AA, Pritchard JK, and Gilad Y. The genetic and mechanistic basis for variation in gene regulation. PLoS Genet 11: e1004857, 2015. [DOI] [PMC free article] [PubMed] [Google Scholar]
- 243.Pamir N, Pan C, Plubell DL, Hutchins PM, Tang C, Wimberger J, Irwin A, Vallim TQA, Heinecke JW, and Lusis AJ. Genetic control of the mouse HDL proteome defines HDL traits, function, and heterogeneity. J Lipid Res 60: 594–608, 2019. [DOI] [PMC free article] [PubMed] [Google Scholar]
- 244.Pan DZ, Garske KM, Alvarez M, Bhagat YV, Boocock J, Nikkola E, Miao Z, Raulerson CK, Cantor RM, Civelek M, Glastonbury CA, Small KS, Boehnke M, Lusis AJ, Sinsheimer JS, Mohlke KL, Laakso M, Pajukanta P, and Ko A. Integration of human adipocyte chromosomal interactions with adipose gene expression prioritizes obesity-related genes from GWAS. Nat Commun 9: 1512, 2018. [DOI] [PMC free article] [PubMed] [Google Scholar]
- 245.Panoutsopoulou K, and Wheeler E. Key Concepts in Genetic Epidemiology. Methods Mol Biol 1793: 7–24, 2018. [DOI] [PubMed] [Google Scholar]
- 246.Papatheodorou I, Moreno P, Manning J, Fuentes AM, George N, Fexova S, Fonseca NA, Fullgrabe A, Green M, Huang N, Huerta L, Iqbal H, Jianu M, Mohammed S, Zhao L, Jarnuczak AF, Jupp S, Marioni J, Meyer K, Petryszak R, Prada Medina CA, Talavera-Lopez C, Teichmann S, Vizcaino JA, and Brazma A. Expression Atlas update: from tissues to single cells. Nucleic Acids Res 48: D77–D83, 2020. [DOI] [PMC free article] [PubMed] [Google Scholar]
- 247.Park E, Pan Z, Zhang Z, Lin L, and Xing Y. The Expanding Landscape of Alternative Splicing Variation in Human Populations. Am J Hum Genet 102: 11–26, 2018. [DOI] [PMC free article] [PubMed] [Google Scholar]
- 248.Park JH, Wacholder S, Gail MH, Peters U, Jacobs KB, Chanock SJ, and Chatterjee N. Estimation of effect size distribution from genome-wide association studies and implications for future discoveries. Nat Genet 42: 570–575, 2010. [DOI] [PMC free article] [PubMed] [Google Scholar]
- 249.Parker BM, Rogers SL, and Lymperopoulos A. Clinical pharmacogenomics of carvedilol: the stereo-selective metabolism angle. Pharmacogenomics 19: 1089–1093, 2018. [DOI] [PubMed] [Google Scholar]
- 250.Parks BW, Nam E, Org E, Kostem E, Norheim F, Hui ST, Pan C, Civelek M, Rau CD, Bennett BJ, Mehrabian M, Ursell LK, He A, Castellani LW, Zinker B, Kirby M, Drake TA, Drevon CA, Knight R, Gargalovic P, Kirchgessner T, Eskin E, and Lusis AJ. Genetic control of obesity and gut microbiota composition in response to high-fat, high-sucrose diet in mice. Cell Metab 17: 141–152, 2013. [DOI] [PMC free article] [PubMed] [Google Scholar]
- 251.Parks BW, Sallam T, Mehrabian M, Psychogios N, Hui ST, Norheim F, Castellani LW, Rau CD, Pan C, Phun J, Zhou Z, Yang WP, Neuhaus I, Gargalovic PS, Kirchgessner TG, Graham M, Lee R, Tontonoz P, Gerszten RE, Hevener AL, and Lusis AJ. Genetic architecture of insulin resistance in the mouse. Cell Metab 21: 334–347, 2015. [DOI] [PMC free article] [PubMed] [Google Scholar]
- 252.Pelikan RC, Kelly JA, Fu Y, Lareau CA, Tessneer KL, Wiley GB, Wiley MM, Glenn SB, Harley JB, Guthridge JM, James JA, Aryee MJ, Montgomery C, and Gaffney PM. Enhancer histone-QTLs are enriched on autoimmune risk haplotypes and influence gene expression within chromatin networks. Nat Commun 9: 2905, 2018. [DOI] [PMC free article] [PubMed] [Google Scholar]
- 253.Popejoy AB, and Fullerton SM. Genomics is failing on diversity. Nature 538: 161–164, 2016. [DOI] [PMC free article] [PubMed] [Google Scholar]
- 254.Putku M, Kals M, Inno R, Kasela S, Org E, Kozich V, Milani L, and Laan M. CDH13 promoter SNPs with pleiotropic effect on cardiometabolic parameters represent methylation QTLs. Hum Genet 134: 291–303, 2015. [DOI] [PMC free article] [PubMed] [Google Scholar]
- 255.Raina R, Krishnappa V, Das A, Amin H, Radhakrishnan Y, Nair NR, and Kusumi K. Overview of Monogenic or Mendelian Forms of Hypertension. Front Pediatr 7: 263, 2019. [DOI] [PMC free article] [PubMed] [Google Scholar]
- 256.Rakyan VK, Down TA, Balding DJ, and Beck S. Epigenome-wide association studies for common human diseases. Nat Rev Genet 12: 529–541, 2011. [DOI] [PMC free article] [PubMed] [Google Scholar]
- 257.Rapp JP, and Joe B. Dissecting Epistatic QTL for Blood Pressure in Rats: Congenic Strains versus Heterogeneous Stocks, a Reality Check. Compr Physiol 9: 1305–1337, 2019. [DOI] [PubMed] [Google Scholar]
- 258.Rapp JP, and Joe B. Use of contiguous congenic strains in analyzing compound QTLs. Physiol Genomics 44: 117–120, 2012. [DOI] [PMC free article] [PubMed] [Google Scholar]
- 259.Rask-Andersen M, Karlsson T, Ek WE, and Johansson A. Genome-wide association study of body fat distribution identifies adiposity loci and sex-specific genetic effects. Nat Commun 10: 339, 2019. [DOI] [PMC free article] [PubMed] [Google Scholar]
- 260.Rau CD, Romay MC, Tuteryan M, Wang JJ, Santolini M, Ren S, Karma A, Weiss JN, Wang Y, and Lusis AJ. Systems Genetics Approach Identifies Gene Pathways and Adamts2 as Drivers of Isoproterenol-Induced Cardiac Hypertrophy and Cardiomyopathy in Mice. Cell Syst 4: 121–128 e124, 2017. [DOI] [PMC free article] [PubMed] [Google Scholar]
- 261.Rau CD, Wang J, Avetisyan R, Romay MC, Martin L, Ren S, Wang Y, and Lusis AJ. Mapping genetic contributions to cardiac pathology induced by Beta-adrenergic stimulation in mice. Circ Cardiovasc Genet 8: 40–49, 2015. [DOI] [PMC free article] [PubMed] [Google Scholar]
- 262.Raulerson CK, Ko A, Kidd JC, Currin KW, Brotman SM, Cannon ME, Wu Y, Spracklen CN, Jackson AU, Stringham HM, Welch RP, Fuchsberger C, Locke AE, Narisu N, Lusis AJ, Civelek M, Furey TS, Kuusisto J, Collins FS, Boehnke M, Scott LJ, Lin DY, Love MI, Laakso M, Pajukanta P, and Mohlke KL. Adipose Tissue Gene Expression Associations Reveal Hundreds of Candidate Genes for Cardiometabolic Traits. Am J Hum Genet 105: 773–787, 2019. [DOI] [PMC free article] [PubMed] [Google Scholar]
- 263.Ren YY, Overmyer KA, Qi NR, Treutelaar MK, Heckenkamp L, Kalahar M, Koch LG, Britton SL, Burant CF, and Li JZ. Genetic analysis of a rat model of aerobic capacity and metabolic fitness. PLoS One 8: e77588, 2013. [DOI] [PMC free article] [PubMed] [Google Scholar]
- 264.Richardson TG, Sanderson E, Palmer TM, Ala-Korpela M, Ference BA, Davey Smith G, and Holmes MV. Evaluating the relationship between circulating lipoprotein lipids and apolipoproteins with risk of coronary heart disease: A multivariable Mendelian randomisation analysis. PLoS Med 17: e1003062, 2020. [DOI] [PMC free article] [PubMed] [Google Scholar]
- 265.Rintisch C, Heinig M, Bauerfeind A, Schafer S, Mieth C, Patone G, Hummel O, Chen W, Cook S, Cuppen E, Colome-Tatche M, Johannes F, Jansen RC, Neil H, Werner M, Pravenec M, Vingron M, and Hubner N. Natural variation of histone modification and its impact on gene expression in the rat genome. Genome Res 24: 942–953, 2014. [DOI] [PMC free article] [PubMed] [Google Scholar]
- 266.Robinson N, Brown H, Antoun E, Godfrey KM, Hanson MA, Lillycrop KA, Crozier SR, Murray R, Pearce MS, Relton CL, Albani V, and McKay JA. Childhood DNA methylation as a marker of early life rapid weight gain and subsequent overweight. Clin Epigenetics 13: 8, 2021. [DOI] [PMC free article] [PubMed] [Google Scholar]
- 267.Rohde K, Keller M, la Cour Poulsen L, Ronningen T, Stumvoll M, Tonjes A, Kovacs P, Horstmann A, Villringer A, Bluher M, and Bottcher Y. (Epi)genetic regulation of CRTC1 in human eating behaviour and fat distribution. EBioMedicine 44: 476–488, 2019. [DOI] [PMC free article] [PubMed] [Google Scholar]
- 268.Roman RJ, Cowley AW Jr., Greene A, Kwitek AE, Tonellato PJ, and Jacob HJ. Consomic rats for the identification of genes and pathways underlying cardiovascular disease. Cold Spring Harb Symp Quant Biol 67: 309–315, 2002. [DOI] [PubMed] [Google Scholar]
- 269.Rowlan JS, Li Q, Manichaikul A, Wang Q, Matsumoto AH, and Shi W. Atherosclerosis susceptibility Loci identified in an extremely atherosclerosis-resistant mouse strain. J Am Heart Assoc 2: e000260, 2013. [DOI] [PMC free article] [PubMed] [Google Scholar]
- 270.Saha A, Kim Y, Gewirtz ADH, Jo B, Gao C, McDowell IC, Consortium GT, Engelhardt BE, and Battle A. Co-expression networks reveal the tissue-specific regulation of transcription and splicing. Genome Res 27: 1843–1858, 2017. [DOI] [PMC free article] [PubMed] [Google Scholar]
- 271.Saklayen MG. The Global Epidemic of the Metabolic Syndrome. Curr Hypertens Rep 20: 12, 2018. [DOI] [PMC free article] [PubMed] [Google Scholar]
- 272.Salzberg SL. Open questions: How many genes do we have? BMC Biol 16: 94, 2018. [DOI] [PMC free article] [PubMed] [Google Scholar]
- 273.Sanchez-Pozos K, and Menjivar M. Genetic Component of Type 2 Diabetes in a Mexican Population. Arch Med Res 47: 496–505, 2016. [DOI] [PubMed] [Google Scholar]
- 274.Santolini M, Romay MC, Yukhtman CL, Rau CD, Ren S, Saucerman JJ, Wang JJ, Weiss JN, Wang Y, Lusis AJ, and Karma A. A personalized, multiomics approach identifies genes involved in cardiac hypertrophy and heart failure. NPJ Syst Biol Appl 4: 12, 2018. [DOI] [PMC free article] [PubMed] [Google Scholar]
- 275.Saul MC, Philip VM, Reinholdt LG, Center for Systems Neurogenetics of A, and Chesler EJ. High-Diversity Mouse Populations for Complex Traits. Trends Genet 35: 501–514, 2019. [DOI] [PMC free article] [PubMed] [Google Scholar]
- 276.Scally A Global clues to the nature of genomic mutations in humans. Elife 6: 2017. [DOI] [PMC free article] [PubMed] [Google Scholar]
- 277.Schaid DJ, Chen W, and Larson NB. From genome-wide associations to candidate causal variants by statistical fine-mapping. Nat Rev Genet 19: 491–504, 2018. [DOI] [PMC free article] [PubMed] [Google Scholar]
- 278.Schallschmidt T, Lebek S, Altenhofen D, Damen M, Schulte Y, Knebel B, Herwig R, Rasche A, Stermann T, Kamitz A, Hallahan N, Jahnert M, Vogel H, Schurmann A, Chadt A, and Al-Hasani H. Two Novel Candidate Genes for Insulin Secretion Identified by Comparative Genomics of Multiple Backcross Mouse Populations. Genetics 210: 1527–1542, 2018. [DOI] [PMC free article] [PubMed] [Google Scholar]
- 279.Schlosser P, Li Y, Sekula P, Raffler J, Grundner-Culemann F, Pietzner M, Cheng Y, Wuttke M, Steinbrenner I, Schultheiss UT, Kotsis F, Kacprowski T, Forer L, Hausknecht B, Ekici AB, Nauck M, Volker U, Investigators G, Walz G, Oefner PJ, Kronenberg F, Mohney RP, Kottgen M, Suhre K, Eckardt KU, Kastenmuller G, and Kottgen A. Genetic studies of urinary metabolites illuminate mechanisms of detoxification and excretion in humans. Nat Genet 52: 167–176, 2020. [DOI] [PMC free article] [PubMed] [Google Scholar]
- 280.Schmitt AD, Hu M, Jung I, Xu Z, Qiu Y, Tan CL, Li Y, Lin S, Lin Y, Barr CL, and Ren B. A Compendium of Chromatin Contact Maps Reveals Spatially Active Regions in the Human Genome. Cell Rep 17: 2042–2059, 2016. [DOI] [PMC free article] [PubMed] [Google Scholar]
- 281.Schmitt AD, Hu M, and Ren B. Genome-wide mapping and analysis of chromosome architecture. Nat Rev Mol Cell Biol 17: 743–755, 2016. [DOI] [PMC free article] [PubMed] [Google Scholar]
- 282.Scotti MM, and Swanson MS. RNA mis-splicing in disease. Nat Rev Genet 17: 19–32, 2016. [DOI] [PMC free article] [PubMed] [Google Scholar]
- 283.Seldin M, Yang X, and Lusis AJ. Systems genetics applications in metabolism research. Nat Metab 1: 1038–1050, 2019. [DOI] [PMC free article] [PubMed] [Google Scholar]
- 284.Seldin MM, Kim ED, Romay MC, Li S, Rau CD, Wang JJ, Krishnan KC, Wang Y, Deb A, and Lusis AJ. A systems genetics approach identifies Trp53inp2 as a link between cardiomyocyte glucose utilization and hypertrophic response. Am J Physiol Heart Circ Physiol 312: H728–H741, 2017. [DOI] [PMC free article] [PubMed] [Google Scholar]
- 285.Shi W, Wang Q, Choi W, and Li J. Mapping and Congenic Dissection of Genetic Loci Contributing to Hyperglycemia and Dyslipidemia in Mice. PLoS One 11: e0148462, 2016. [DOI] [PMC free article] [PubMed] [Google Scholar]
- 286.Shimoyama M, Smith JR, Bryda E, Kuramoto T, Saba L, and Dwinell M. Rat Genome and Model Resources. ILAR J 58: 42–58, 2017. [DOI] [PMC free article] [PubMed] [Google Scholar]
- 287.Sirugo G, Williams SM, and Tishkoff SA. The Missing Diversity in Human Genetic Studies. Cell 177: 1080, 2019. [DOI] [PMC free article] [PubMed] [Google Scholar]
- 288.Smallwood TL, Gatti DM, Quizon P, Weinstock GM, Jung KC, Zhao L, Hua K, Pomp D, and Bennett BJ. High-resolution genetic mapping in the diversity outbred mouse population identifies Apobec1 as a candidate gene for atherosclerosis. G3 (Bethesda) 4: 2353–2363, 2014. [DOI] [PMC free article] [PubMed] [Google Scholar]
- 289.Smith JG, and Gerszten RE. Emerging Affinity-Based Proteomic Technologies for Large-Scale Plasma Profiling in Cardiovascular Disease. Circulation 135: 1651–1664, 2017. [DOI] [PMC free article] [PubMed] [Google Scholar]
- 290.Smith JR, Hayman GT, Wang SJ, Laulederkind SJF, Hoffman MJ, Kaldunski ML, Tutaj M, Thota J, Nalabolu HS, Ellanki SLR, Tutaj MA, De Pons JL, Kwitek AE, Dwinell MR, and Shimoyama ME. The Year of the Rat: The Rat Genome Database at 20: a multi-species knowledgebase and analysis platform. Nucleic Acids Res 48: D731–D742, 2020. [DOI] [PMC free article] [PubMed] [Google Scholar]
- 291.Sofer T, Baier LJ, Browning SR, Thornton TA, Talavera GA, Wassertheil-Smoller S, Daviglus ML, Hanson R, Kobes S, Cooper RS, Cai J, Levy D, Reiner AP, and Franceschini N. Admixture mapping in the Hispanic Community Health Study/Study of Latinos reveals regions of genetic associations with blood pressure traits. PLoS One 12: e0188400, 2017. [DOI] [PMC free article] [PubMed] [Google Scholar]
- 292.Soko ND, Masimirembwa C, and Dandara C. Rosuvastatin pharmacogenetics in African populations. Pharmacogenomics 19: 1373–1375, 2018. [DOI] [PubMed] [Google Scholar]
- 293.Solberg Woods LC. QTL mapping in outbred populations: successes and challenges. Physiol Genomics 46: 81–90, 2014. [DOI] [PMC free article] [PubMed] [Google Scholar]
- 294.Solberg Woods LC, Holl K, Tschannen M, and Valdar W. Fine-mapping a locus for glucose tolerance using heterogeneous stock rats. Physiol Genomics 41: 102–108, 2010. [DOI] [PMC free article] [PubMed] [Google Scholar]
- 295.Solberg Woods LC, Holl KL, Oreper D, Xie Y, Tsaih SW, and Valdar W. Fine-mapping diabetes-related traits, including insulin resistance, in heterogeneous stock rats. Physiol Genomics 44: 1013–1026, 2012. [DOI] [PMC free article] [PubMed] [Google Scholar]
- 296.Srivastava A, Morgan AP, Najarian ML, Sarsani VK, Sigmon JS, Shorter JR, Kashfeen A, McMullan RC, Williams LH, Giusti-Rodriguez P, Ferris MT, Sullivan P, Hock P, Miller DR, Bell TA, McMillan L, Churchill GA, and de Villena FP. Genomes of the Mouse Collaborative Cross. Genetics 206: 537–556, 2017. [DOI] [PMC free article] [PubMed] [Google Scholar]
- 297.Stewart TP, Kim HY, Saxton AM, and Kim JH. Genetic and genomic analysis of hyperlipidemia, obesity and diabetes using (C57BL/6J x TALLYHO/JngJ) F2 mice. BMC Genomics 11: 713, 2010. [DOI] [PMC free article] [PubMed] [Google Scholar]
- 298.Stoeger T, Gerlach M, Morimoto RI, and Nunes Amaral LA. Large-scale investigation of the reasons why potentially important genes are ignored. PLoS Biol 16: e2006643, 2018. [DOI] [PMC free article] [PubMed] [Google Scholar]
- 299.Sun YV, Damrauer SM, Hui Q, Assimes TL, Ho YL, Natarajan P, Klarin D, Huang J, Lynch J, DuVall SL, Pyarajan S, Honerlaw JP, Gaziano JM, Cho K, Rader DJ, O’Donnell CJ, Tsao PS, and Wilson PWF. Effects of Genetic Variants Associated with Familial Hypercholesterolemia on Low-Density Lipoprotein-Cholesterol Levels and Cardiovascular Outcomes in the Million Veteran Program. Circ Genom Precis Med 11: 2018. [DOI] [PMC free article] [PubMed] [Google Scholar]
- 300.Sung YJ, Winkler TW, de Las Fuentes L, Bentley AR, Brown MR, Kraja AT, Schwander K, Ntalla I, Guo X, Franceschini N, Lu Y, Cheng CY, Sim X, Vojinovic D, Marten J, Musani SK, Li C, Feitosa MF, Kilpelainen TO, Richard MA, Noordam R, Aslibekyan S, Aschard H, Bartz TM, Dorajoo R, Liu Y, Manning AK, Rankinen T, Smith AV, Tajuddin SM, Tayo BO, Warren HR, Zhao W, Zhou Y, Matoba N, Sofer T, Alver M, Amini M, Boissel M, Chai JF, Chen X, Divers J, Gandin I, Gao C, Giulianini F, Goel A, Harris SE, Hartwig FP, Horimoto A, Hsu FC, Jackson AU, Kahonen M, Kasturiratne A, Kuhnel B, Leander K, Lee WJ, Lin KH, an Luan J, McKenzie CA, Meian H, Nelson CP, Rauramaa R, Schupf N, Scott RA, Sheu WHH, Stancakova A, Takeuchi F, van der Most PJ, Varga TV, Wang H, Wang Y, Ware EB, Weiss S, Wen W, Yanek LR, Zhang W, Zhao JH, Afaq S, Alfred T, Amin N, Arking D, Aung T, Barr RG, Bielak LF, Boerwinkle E, Bottinger EP, Braund PS, Brody JA, Broeckel U, Cabrera CP, Cade B, Caizheng Y, Campbell A, Canouil M, Chakravarti A, Group CNW, Chauhan G, Christensen K, Cocca M, Consortium CO-K, Collins FS, Connell JM, de Mutsert R, de Silva HJ, Debette S, Dorr M, Duan Q, Eaton CB, Ehret G, Evangelou E, Faul JD, Fisher VA, Forouhi NG, Franco OH, Friedlander Y, Gao H, Consortium G, Gigante B, Graff M, Gu CC, Gu D, Gupta P, Hagenaars SP, Harris TB, He J, Heikkinen S, Heng CK, Hirata M, Hofman A, Howard BV, Hunt S, Irvin MR, Jia Y, Joehanes R, Justice AE, Katsuya T, Kaufman J, Kerrison ND, Khor CC, Koh WP, Koistinen HA, Komulainen P, Kooperberg C, Krieger JE, Kubo M, Kuusisto J, Langefeld CD, Langenberg C, Launer LJ, Lehne B, Lewis CE, Li Y, Lifelines Cohort S, Lim SH, Lin S, Liu CT, Liu J, Liu J, Liu K, Liu Y, Loh M, Lohman KK, Long J, Louie T, Magi R, Mahajan A, Meitinger T, Metspalu A, Milani L, Momozawa Y, Morris AP, Mosley TH Jr., Munson P, Murray AD, Nalls MA, Nasri U, Norris JM, North K, Ogunniyi A, Padmanabhan S, Palmas WR, Palmer ND, Pankow JS, Pedersen NL, Peters A, Peyser PA, Polasek O, Raitakari OT, Renstrom F, Rice TK, Ridker PM, Robino A, Robinson JG, Rose LM, Rudan I, Sabanayagam C, Salako BL, Sandow K, Schmidt CO, Schreiner PJ, Scott WR, Seshadri S, Sever P, Sitlani CM, Smith JA, Snieder H, Starr JM, Strauch K, Tang H, Taylor KD, Teo YY, Tham YC, Uitterlinden AG, Waldenberger M, Wang L, Wang YX, Wei WB, Williams C, Wilson G, Wojczynski MK, Yao J, Yuan JM, Zonderman AB, Becker DM, Boehnke M, Bowden DW, Chambers JC, Chen YI, de Faire U, Deary IJ, Esko T, Farrall M, Forrester T, Franks PW, Freedman BI, Froguel P, Gasparini P, Gieger C, Horta BL, Hung YJ, Jonas JB, Kato N, Kooner JS, Laakso M, Lehtimaki T, Liang KW, Magnusson PKE, Newman AB, Oldehinkel AJ, Pereira AC, Redline S, Rettig R, Samani NJ, Scott J, Shu XO, van der Harst P, Wagenknecht LE, Wareham NJ, Watkins H, Weir DR, Wickremasinghe AR, Wu T, Zheng W, Kamatani Y, Laurie CC, Bouchard C, Cooper RS, Evans MK, Gudnason V, Kardia SLR, Kritchevsky SB, Levy D, O’Connell JR, Psaty BM, van Dam RM, Sims M, Arnett DK, Mook-Kanamori DO, Kelly TN, Fox ER, Hayward C, Fornage M, Rotimi CN, Province MA, van Duijn CM, Tai ES, Wong TY, Loos RJF, Reiner AP, Rotter JI, Zhu X, Bierut LJ, Gauderman WJ, Caulfield MJ, Elliott P, Rice K, Munroe PB, Morrison AC, Cupples LA, Rao DC, and Chasman DI. A Large-Scale Multi-ancestry Genome-wide Study Accounting for Smoking Behavior Identifies Multiple Significant Loci for Blood Pressure. Am J Hum Genet 102: 375–400, 2018. [DOI] [PMC free article] [PubMed] [Google Scholar]
- 301.Suto J, and Sekikawa K. Quantitative trait locus analysis of plasma cholesterol and triglyceride levels in KK x RR F2 mice. Biochem Genet 41: 325–341, 2003. [DOI] [PubMed] [Google Scholar]
- 302.Szklarczyk D, Gable AL, Nastou KC, Lyon D, Kirsch R, Pyysalo S, Doncheva NT, Legeay M, Fang T, Bork P, Jensen LJ, and von Mering C. The STRING database in 2021: customizable protein-protein networks, and functional characterization of user-uploaded gene/measurement sets. Nucleic Acids Res 2020. [DOI] [PMC free article] [PubMed] [Google Scholar]
- 303.Szklarczyk D, and Jensen LJ. Protein-protein interaction databases. Methods Mol Biol 1278: 39–56, 2015. [DOI] [PubMed] [Google Scholar]
- 304.Tabakoff B, Smith H, Vanderlinden LA, Hoffman PL, and Saba LM. Networking in Biology: The Hybrid Rat Diversity Panel. Methods Mol Biol 2018: 213–231, 2019. [DOI] [PubMed] [Google Scholar]
- 305.Tada H, Kawashiri MA, and Yamagishi M. Clinical Perspectives of Genetic Analyses on Dyslipidemia and Coronary Artery Disease. J Atheroscler Thromb 24: 452–461, 2017. [DOI] [PMC free article] [PubMed] [Google Scholar]
- 306.Taliun D, Harris DN, Kessler MD, Carlson J, Szpiech ZA, Torres R, Taliun SAG, Corvelo A, Gogarten SM, Kang HM, Pitsillides AN, LeFaive J, Lee SB, Tian X, Browning BL, Das S, Emde AK, Clarke WE, Loesch DP, Shetty AC, Blackwell TW, Smith AV, Wong Q, Liu X, Conomos MP, Bobo DM, Aguet F, Albert C, Alonso A, Ardlie KG, Arking DE, Aslibekyan S, Auer PL, Barnard J, Barr RG, Barwick L, Becker LC, Beer RL, Benjamin EJ, Bielak LF, Blangero J, Boehnke M, Bowden DW, Brody JA, Burchard EG, Cade BE, Casella JF, Chalazan B, Chasman DI, Chen YI, Cho MH, Choi SH, Chung MK, Clish CB, Correa A, Curran JE, Custer B, Darbar D, Daya M, de Andrade M, DeMeo DL, Dutcher SK, Ellinor PT, Emery LS, Eng C, Fatkin D, Fingerlin T, Forer L, Fornage M, Franceschini N, Fuchsberger C, Fullerton SM, Germer S, Gladwin MT, Gottlieb DJ, Guo X, Hall ME, He J, Heard-Costa NL, Heckbert SR, Irvin MR, Johnsen JM, Johnson AD, Kaplan R, Kardia SLR, Kelly T, Kelly S, Kenny EE, Kiel DP, Klemmer R, Konkle BA, Kooperberg C, Kottgen A, Lange LA, Lasky-Su J, Levy D, Lin X, Lin KH, Liu C, Loos RJF, Garman L, Gerszten R, Lubitz SA, Lunetta KL, Mak ACY, Manichaikul A, Manning AK, Mathias RA, McManus DD, McGarvey ST, Meigs JB, Meyers DA, Mikulla JL, Minear MA, Mitchell BD, Mohanty S, Montasser ME, Montgomery C, Morrison AC, Murabito JM, Natale A, Natarajan P, Nelson SC, North KE, O’Connell JR, Palmer ND, Pankratz N, Peloso GM, Peyser PA, Pleiness J, Post WS, Psaty BM, Rao DC, Redline S, Reiner AP, Roden D, Rotter JI, Ruczinski I, Sarnowski C, Schoenherr S, Schwartz DA, Seo JS, Seshadri S, Sheehan VA, Sheu WH, Shoemaker MB, Smith NL, Smith JA, Sotoodehnia N, Stilp AM, Tang W, Taylor KD, Telen M, Thornton TA, Tracy RP, Van Den Berg DJ, Vasan RS, Viaud-Martinez KA, Vrieze S, Weeks DE, Weir BS, Weiss ST, Weng LC, Wilier CJ, Zhang Y, Zhao X, Arnett DK, Ashley-Koch AE, Barnes kC, Boerwinkle E, Gabriel S, Gibbs R, Rice KM, Rich SS, Silverman EK, Qasba P, Gan W, Consortium NT-Of PM, Papanicolaou GJ, Nickerson DA, Browning SR, Zody MC, Zollner S, Wilson JG, Cupples LA, Laurie CC, Jaquish CE, Hernandez RD, O’Connor TD, and Abecasis GR. Sequencing of 53,831 diverse genomes from the NHLBI TOPMed Program. Nature 590: 290–299, 2021. [DOI] [PMC free article] [PubMed] [Google Scholar]
- 307.Tam V, Patel N, Turcotte M, Bosse Y, Pare G, and Meyre D. Benefits and limitations of genome-wide association studies. Nat Rev Genet 20: 467–484, 2019. [DOI] [PubMed] [Google Scholar]
- 308.Tam V, Turcotte M, and Meyre D. Established and emerging strategies to crack the genetic code of obesity. Obes Rev 20: 212–240, 2019. [DOI] [PubMed] [Google Scholar]
- 309.Tan WLW, Anene-Nzelu CG, Wong E, Lee CJM, Tan HS, Tang SJ, Perrin A, Wu KX, Zheng W, Ashburn RJ, Pan B, Lee MY, Autio MI, Morley MP, Tam WL, Cheung C, Margulies KB, Chen L, Cappola TP, Loh M, Chambers J, Prabhakar S, Foo RSY, and Charge-Heart Failure Working Group C-EC. Epigenomes of Human Hearts Reveal New Genetic Variants Relevant for Cardiac Disease and Phenotype. Circ Res 127: 761–777, 2020. [DOI] [PMC free article] [PubMed] [Google Scholar]
- 310.Tang Y, Jin B, Zhou L, and Lu W. MeQTL analysis of childhood obesity links epigenetics with a risk SNP rs17782313 near MC4R from meta-analysis. Oncotarget 8: 2800–2806, 2017. [DOI] [PMC free article] [PubMed] [Google Scholar]
- 311.Telenti A Integrating metabolomics with genomics. Pharmacogenomics 19: 1377–1381, 2018. [DOI] [PubMed] [Google Scholar]
- 312.The UniProt C. UniProt: the universal protein knowledgebase. Nucleic Acids Res 45: D158–D169, 2017. [DOI] [PMC free article] [PubMed] [Google Scholar]
- 313.Thomson R, and McWhirter R. Adjusting for Familial Relatedness in the Analysis of GWAS Data. Methods Mol Biol 1526: 175–190, 2017. [DOI] [PubMed] [Google Scholar]
- 314.Torres JM, Abdalla M, Payne A, Fernandez-Tajes J, Thurner M, Nylander V, Gloyn AL, Mahajan A, and McCarthy MI. A Multi-omic Integrative Scheme Characterizes Tissues of Action at Loci Associated with Type 2 Diabetes. Am J Hum Genet 107: 1011–1028, 2020. [DOI] [PMC free article] [PubMed] [Google Scholar]
- 315.Tsaih SW, Holl K, Jia S, Kaldunski M, Tschannen M, He H, Andrae JW, Li SH, Stoddard A, Wiederhold A, Parrington J, Ruas da Silva M, Galione A, Meigs J, MetaAnalyses of G, Insulin-Related Traits Consortium I, Hoffmann RG, Simpson P, Jacob H, Hessner M, and Solberg Woods LC. Identification of a novel gene for diabetic traits in rats, mice, and humans. Genetics 198: 17–29, 2014. [DOI] [PMC free article] [PubMed] [Google Scholar]
- 316.Ueno T, Tremblay J, Kunes J, Zicha J, Dobesova Z, Pausova Z, Deng AY, Sun YL, Jacob HJ, and Hamet P. Resolving the composite trait of hypertension into its pharmacogenetic determinants by acute pharmacological modulation of blood pressure regulatory systems. J Mol Med (Berl) 81: 51–60, 2003. [DOI] [PubMed] [Google Scholar]
- 317.Valdar W, Solberg LC, Gauguier D, Burnett S, Klenerman P, Cookson WO, Taylor MS, Rawlins JN, Mott R, and Flint J. Genome-wide genetic association of complex traits in heterogeneous stock mice. Nat Genet 38: 879–887, 2006. [DOI] [PubMed] [Google Scholar]
- 318.van der Harst P, and Verweij N. Identification of 64 Novel Genetic Loci Provides an Expanded View on the Genetic Architecture of Coronary Artery Disease. Circ Res 122: 433–443, 2018. [DOI] [PMC free article] [PubMed] [Google Scholar]
- 319.Vargas-Landin DB, Pfluger J, and Lister R. Generation of Whole Genome Bisulfite Sequencing Libraries for Comprehensive DNA Methylome Analysis. Methods Mol Biol 1767: 291–298, 2018. [DOI] [PubMed] [Google Scholar]
- 320.Vaura F, Kauko A, Suvila K, Havulinna AS, Mars N, Salomaa V, FinnGen, Cheng S, and Niiranen T. Polygenic Risk Scores Predict Hypertension Onset and Cardiovascular Risk. Hypertension HYPERTENSIONAHA12016471, 2021. [DOI] [PMC free article] [PubMed] [Google Scholar]
- 321.Vehmeijer FOL, Kupers LK, Sharp GC, Salas LA, Lent S, Jima DD, Tindula G, Reese S, Qi C, Gruzieva O, Page C, Rezwan FI, Melton PE, Nohr E, Escaramis G, Rzehak P, Heiskala A, Gong T, Gao L, Ross JP, Starling AP, Holloway JW, Yousefi P, Aasvang GM, Beilin LJ, Bergstrom A, Binder E, Chatzi L, Corpeleijn E, Czamara D, Eskenazi B, Ewart S, Ferre N, Grote V, Gruszfeld D, Haberg SE, Hoyo C, Huen K, Karlsson R, Kull I, Langhendries JP, Lepeule J, Magnus MC, Maguire RL, Molloy PL, Monnereau C, Mori TA, Oken E, Raikkonen K, Rifas-Shiman S, Ruiz-Arenas C, Sebert S, Ullemar V, Verduci E, Vonk JM, Xu CJ, Yang IV, Zhang H, Zhang W, Karmaus W, Dabelea D, Muhlhausler BS, Breton CV, Lahti J, Almqvist C, Jarvelin MR, Koletzko B, Vrijheid M, Sorensen TIA, Huang RC, Arshad SH, Nystad W, Melen E, Koppelman GH, London SJ, Holland N, Bustamante M, Murphy SK, Hivert MF, Baccarelli A, Relton CL, Snieder H, Jaddoe VWV, and Felix JF. DNA methylation and body mass index from birth to adolescence: meta-analyses of epigenome-wide association studies. Genome Med 12: 105, 2020. [DOI] [PMC free article] [PubMed] [Google Scholar]
- 322.Vijay J, Gauthier MF, Biswell RL, Louiselle DA, Johnston JJ, Cheung WA, Belden B, Pramatarova A, Biertho L, Gibson M, Simon MM, Djambazian H, Multiple Tissue Human Expression Resource C, Staffa A, Bourque G, Laitinen A, Nystedt J, Vohl MC, Fraser JD, Pastinen T, Tchernof A, and Grundberg E. Single-cell analysis of human adipose tissue identifies depot and disease specific cell types. Nat Metab 2: 97–109, 2020. [DOI] [PMC free article] [PubMed] [Google Scholar]
- 323.Visscher PM, Wray NR, Zhang Q, Sklar P, McCarthy MI, Brown MA, and Yang J. 10 Years of GWAS Discovery: Biology, Function, and Translation. Am J Hum Genet 101: 5–22, 2017. [DOI] [PMC free article] [PubMed] [Google Scholar]
- 324.Vogel H, Kamitz A, Hallahan N, Lebek S, Schallschmidt T, Jonas W, Jahnert M, Gottmann P, Zellner L, Kanzleiter T, Damen M, Altenhofen D, Burkhardt R, Renner S, Dahlhoff M, Wolf E, Muller TD, Bluher M, Joost HG, Chadt A, Al-Hasani H, and Schurmann A. A collective diabetes cross in combination with a computational framework to dissect the genetics of human obesity and Type 2 diabetes. Hum Mol Genet 27: 3099–3112, 2018. [DOI] [PMC free article] [PubMed] [Google Scholar]
- 325.Vogel H, Nestler M, Ruschendorf F, Block MD, Tischer S, Kluge R, Schurmann A, Joost HG, and Scherneck S. Characterization of Nob3, a major quantitative trait locus for obesity and hyperglycemia on mouse chromosome 1. Physiol Genomics 38: 226–232, 2009. [DOI] [PMC free article] [PubMed] [Google Scholar]
- 326.Volkov P, Olsson AH, Gillberg L, Jorgensen SW, Brons C, Eriksson KF, Groop L, Jansson PA, Nilsson E, Ronn T, Vaag A, and Ling C. A Genome-Wide mQTL Analysis in Human Adipose Tissue Identifies Genetic Variants Associated with DNA Methylation, Gene Expression and Metabolic Traits. PLoS One 11: e0157776, 2016. [DOI] [PMC free article] [PubMed] [Google Scholar]
- 327.Vujkovic M, Keaton JM, Lynch JA, Miller DR, Zhou J, Tcheandjieu C, Huffman JE, Assimes TL, Lorenz K, Zhu X, Hilliard AT, Judy RL, Huang J, Lee KM, Klarin D, Pyarajan S, Danesh J, Melander O, Rasheed A, Mallick NH, Hameed S, Qureshi IH, Afzal MN, Malik U, Jalal A, Abbas S, Sheng X, Gao L, Kaestner KH, Susztak K, Sun YV, DuVall SL, Cho K, Lee JS, Gaziano JM, Phillips LS, Meigs JB, Reaven PD, Wilson PW, Edwards TL, Rader DJ, Damrauer SM, O’Donnell CJ, Tsao PS, Consortium H, Regeneron Genetics C, Program VAMV, Chang KM, Voight BF, and Saleheen D. Discovery of 318 new risk loci for type 2 diabetes and related vascular outcomes among 1.4 million participants in a multi-ancestry meta-analysis. Nat Genet 52: 680–691, 2020. [DOI] [PMC free article] [PubMed] [Google Scholar]
- 328.Wand H, Knowles JW, and Clarke SL. The need for polygenic score reporting standards in evidence-based practice: lipid genetics use case. Curr Opin Lipidol 32: 89–95, 2021. [DOI] [PMC free article] [PubMed] [Google Scholar]
- 329.Wang HH, Lee DK, Liu M, Portincasa P, and Wang DQ. Novel Insights into the Pathogenesis and Management of the Metabolic Syndrome. Pediatr Gastroenterol Hepatol Nutr 23: 189–230, 2020. [DOI] [PMC free article] [PubMed] [Google Scholar]
- 330.Wang J, Ma MC, Mennie AK, Pettus JM, Xu Y, Lin L, Traxler MG, Jakoubek J, Atanur SS, Aitman TJ, Xing Y, and Kwitek AE. Systems biology with high-throughput sequencing reveals genetic mechanisms underlying the metabolic syndrome in the Lyon hypertensive rat. Circ Cardiovasc Genet 8: 316–326, 2015. [DOI] [PMC free article] [PubMed] [Google Scholar]
- 331.Wang J, Ye Z, Huang TH, Shi H, and Jin VX. Computational Methods and Correlation of Exon-skipping Events with Splicing, Transcription, and Epigenetic Factors. Methods Mol Biol 1513: 163–170, 2017. [DOI] [PMC free article] [PubMed] [Google Scholar]
- 332.Wang M, and Xu S. Statistical power in genome-wide association studies and quantitative trait locus mapping. Heredity (Edinb) 123: 287–306, 2019. [DOI] [PMC free article] [PubMed] [Google Scholar]
- 333.Wang X, Raghavan A, Peters DT, Pashos EE, Rader DJ, and Musunuru K. Interrogation of the Atherosclerosis-Associated SORT1 (Sortilin 1) Locus With Primary Human Hepatocytes, Induced Pluripotent Stem Cell-Hepatocytes, and Locus-Humanized Mice. Arterioscler Thromb Vasc Biol 38: 76–82, 2018. [DOI] [PMC free article] [PubMed] [Google Scholar]
- 334.Wang Z, Qiu C, Lin X, Zhao LJ, Liu Y, Wu X, Wang Q, Liu W, Li K, Deng HW, Tang SY, and Shen H. Identification of novel functional CpG-SNPs associated with type 2 diabetes and coronary artery disease. Mol Genet Genomics 295: 607–619, 2020. [DOI] [PMC free article] [PubMed] [Google Scholar]
- 335.Warren CR, O’Sullivan JF, Friesen M, Becker CE, Zhang X, Liu P, Wakabayashi Y, Morningstar JE, Shi X, Choi J, Xia F, Peters DT, Florido MHC, Tsankov AM, Duberow E, Comisar L, Shay J, Jiang X, Meissner A, Musunuru K, Kathiresan S, Daheron L, Zhu J, Gerszten RE, Deo RC, Vasan RS, O’Donnell CJ, and Cowan CA. Induced Pluripotent Stem Cell Differentiation Enables Functional Validation of GWAS Variants in Metabolic Disease. Cell Stem Cell 20: 547–557 e547, 2017. [DOI] [PubMed] [Google Scholar]
- 336.Warren HR, Evangelou E, Cabrera CP, Gao H, Ren M, Mifsud B, Ntalla I, Surendran P, Liu C, Cook JP, Kraja AT, Drenos F, Loh M, Verweij N, Marten J, Karaman I, Lepe MP, O’Reilly PF, Knight J, Snieder H, Kato N, He J, Tai ES, Said MA, Porteous D, Alver M, Poulter N, Farrall M, Gansevoort RT, Padmanabhan S, Magi R, Stanton A, Connell J, Bakker SJ, Metspalu A, Shields DC, Thom S, Brown M, Sever P, Esko T, Hayward C, van der Harst P, Saleheen D, Chowdhury R, Chambers JC, Chasman DI, Chakravarti A, Newton-Cheh C, Lindgren CM, Levy D, Kooner JS, Keavney B, Tomaszewski M, Samani NJ, Howson JM, Tobin MD, Munroe PB, Ehret GB, Wain LV, International Consortium of Blood Pressure GA, Consortium B, Lifelines Cohort S, Understanding Society Scientific g, Consortium CHDE, Exome BPC, Consortium TDG, Go TDC, Cohorts for H, Ageing Research in Genome Epidemiology BPEC, International Genomics of Blood Pressure C, and group UKBCCBw. Genome-wide association analysis identifies novel blood pressure loci and offers biological insights into cardiovascular risk. Nat Genet 49: 403–415, 2017. [DOI] [PMC free article] [PubMed] [Google Scholar]
- 337.Watanabe K, Taskesen E, van Bochoven A, and Posthuma D. Functional mapping and annotation of genetic associations with FUMA. Nat Commun 8: 1826, 2017. [DOI] [PMC free article] [PubMed] [Google Scholar]
- 338.Welter D, MacArthur J, Morales J, Burdett T, Hall P, Junkins H, Klemm A, Flicek P, Manolio T, Hindorff L, and Parkinson H. The NHGRI GWAS Catalog, a curated resource of SNP-trait associations. Nucleic Acids Res 42: D1001–1006, 2014. [DOI] [PMC free article] [PubMed] [Google Scholar]
- 339.Weng LC, Lunetta KL, Muller-Nurasyid M, Smith AV, Theriault S, Weeke PE, Barnard J, Bis JC, Lyytikainen LP, Kleber ME, Martinsson A, Lin HJ, Rienstra M, Trompet S, Krijthe BP, Dorr M, Klarin D, Chasman DI, Sinner MF, Waldenberger M, Launer LJ, Harris TB, Soliman EZ, Alonso A, Pare G, Teixeira PL, Denny JC, Shoemaker MB, Van Wagoner DR, Smith JD, Psaty BM, Sotoodehnia N, Taylor KD, Kahonen M, Nikus K, Delgado GE, Melander O, Engstrom G, Yao J, Guo X, Christophersen IE, Ellinor PT, Geelhoed B, Verweij N, Macfarlane P, Ford I, Heeringa J, Franco OH, Uitterlinden AG, Volker U, Teumer A, Rose LM, Kaab S, Gudnason V, Arking DE, Conen D, Roden DM, Chung MK, Heckbert SR, Benjamin EJ, Lehtimaki T, Marz W, Smith JG, Rotter JI, van der Harst P, Jukema JW, Stricker BH, Felix SB, Albert Cm, and Lubitz SA. Genetic Interactions with Age, Sex, Body Mass Index, and Hypertension in Relation to Atrial Fibrillation: The AFGen Consortium. Sci Rep 7: 11303, 2017. [DOI] [PMC free article] [PubMed] [Google Scholar]
- 340.Wiesner GL, Kulchak Rahm A, Appelbaum P, Aufox S, Bland ST, Blout CL, Christensen KD, Chung WK, Clayton EW, Green RC, Harr MH, Henrikson N, Hoell C, Holm IA, Jarvik GP, Kullo IJ, Lammers PE, Larson EB, Lindor NM, Marasa M, M FM, Peterson JF, Prows CA, Ralston JD, Milo Rasouly H, Sharp RR, Smith ME, Van Driest SL, Williams JL, Williams MS, Wynn J, and Leppig KA. Returning Results in the Genomic Era: Initial Experiences of the eMERGE Network. J Pers Med 10: 2020. [DOI] [PMC free article] [PubMed] [Google Scholar]
- 341.Williams RW, and Williams EG. Resources for Systems Genetics. Methods Mol Biol 1488: 3–29, 2017. [DOI] [PubMed] [Google Scholar]
- 342.Wishart DS, Feunang YD, Marcu A, Guo AC, Liang K, Vazquez-Fresno R, Sajed T, Johnson D, Li C, Karu N, Sayeeda Z, Lo E, Assempour N, Berjanskii M, Singhal S, Arndt D, Liang Y, Badran H, Grant J, Serra-Cayuela A, Liu Y, Mandal R, Neveu V, Pon A, Knox C, Wilson M, Manach C, and Scalbert A. HMDB 4.0: the human metabolome database for 2018. Nucleic Acids Res 46: D608–D617, 2018. [DOI] [PMC free article] [PubMed] [Google Scholar]
- 343.Wojcik GL, Fuchsberger C, Taliun D, Welch R, Martin AR, Shringarpure S, Carlson CS, Abecasis G, Kang HM, Boehnke M, Bustamante CD, Gignoux CR, and Kenny EE. Imputation-Aware Tag SNP Selection To Improve Power for Large-Scale, Multi-ethnic Association Studies. G3 (Bethesda) 8: 3255–3267, 2018. [DOI] [PMC free article] [PubMed] [Google Scholar]
- 344.Wojcik GL, Graff M, Nishimura KK, Tao R, Haessler J, Gignoux CR, Highland HM, Patel YM, Sorokin EP, Avery CL, Belbin GM, Bien SA, Cheng I, Cullina S, Hodonsky CJ, Hu Y, Huckins LM, Jeff J, Justice AE, Kocarnik JM, Lim U, Lin BM, Lu Y, Nelson SC, Park SL, Poisner H, Preuss MH, Richard MA, Schurmann C, Setiawan VW, Sockell A, Vahi K, Verbanck M, Vishnu A, Walker RW, Young KL, Zubair N, Acuna-Alonso V, Ambite JL, Barnes KC, Boerwinkle E, Bottinger EP, Bustamante CD, Caberto C, Canizales-Quinteros S, Conomos MP, Deelman E, Do R, Doheny K, Fernandez-Rhodes L, Fornage M, Hailu B, Heiss G, Henn BM, Hindorff LA, Jackson RD, Laurie CA, Laurie CC, Li Y, Lin DY, Moreno-Estrada A, Nadkarni G, Norman PJ, Pooler LC, Reiner AP, Romm J, Sabatti C, Sandoval K, Sheng X, Stahl EA, Stram DO, Thornton TA, Wassel CL, Wilkens LR, Winkler CA, Yoneyama S, Buyske S, Haiman CA, Kooperberg C, Le Marchand L, Loos RJF, Matise TC, North KE, Peters U, Kenny EE, and Carlson CS. Genetic analyses of diverse populations improves discovery for complex traits. Nature 570: 514–518, 2019. [DOI] [PMC free article] [PubMed] [Google Scholar]
- 345.Wong CM, Xu L, and Yau MY. Alternative mRNA Splicing in the Pathogenesis of Obesity. Int J Mol Sci 19: 2018. [DOI] [PMC free article] [PubMed] [Google Scholar]
- 346.Wong KM, Langlais K, Tobias GS, Fletcher-Hoppe C, Krasnewich D, Leeds HS, Rodriguez LL, Godynskiy G, Schneider VA, Ramos EM, and Sherry ST. The dbGaP data browser: a new tool for browsing dbGaP controlled-access genomic data. Nucleic Acids Res 45: D819–D826, 2017. [DOI] [PMC free article] [PubMed] [Google Scholar]
- 347.Woods LC, and Mott R. Heterogeneous Stock Populations for Analysis of Complex Traits. Methods Mol Biol 1488: 31–44, 2017. [DOI] [PMC free article] [PubMed] [Google Scholar]
- 348.Wreczycka K, Gosdschan A, Yusuf D, Gruning B, Assenov Y, and Akalin A. Strategies for analyzing bisulfite sequencing data. J Biotechnol 261: 105–115, 2017. [DOI] [PubMed] [Google Scholar]
- 349.Wu Y, Broadaway KA, Raulerson CK, Scott LJ, Pan C, Ko A, He A, Tilford C, Fuchsberger C, Locke AE, Stringham HM, Jackson AU, Narisu N, Kuusisto J, Pajukanta P, Collins FS, Boehnke M, Laakso M, Lusis AJ, Civelek M, and Mohlke KL. Colocalization of GWAS and eQTL signals at loci with multiple signals identifies additional candidate genes for body fat distribution. Hum Mol Genet 28: 4161–4172, 2019. [DOI] [PMC free article] [PubMed] [Google Scholar]
- 350.Yang CH, Mangiafico SP, Waibel M, Loudovaris T, Loh K, Thomas HE, Morahan G, and Andrikopoulos S. E2f8 and Dlg2 genes have independent effects on impaired insulin secretion associated with hyperglycaemia. Diabetologia 63: 1333–1348, 2020. [DOI] [PubMed] [Google Scholar]
- 351.Yang J, Bakshi A, Zhu Z, Hemani G, Vinkhuyzen AA, Lee SH, Robinson MR, Perry JR, Nolte IM, van Vliet-Ostaptchouk JV, Snieder H, LifeLines Cohort S, Esko T, Milani L, Magi R, Metspalu A, Hamsten A, Magnusson PK, Pedersen NL, Ingelsson E, Soranzo N, Keller MC, Wray NR, Goddard ME, and Visscher PM. Genetic variance estimation with imputed variants finds negligible missing heritability for human height and body mass index. Nat Genet 47: 1114–1120, 2015. [DOI] [PMC free article] [PubMed] [Google Scholar]
- 352.Yang Q, and Civelek M. Transcription Factor KLF14 and Metabolic Syndrome. Front Cardiovasc Med 7: 91, 2020. [DOI] [PMC free article] [PubMed] [Google Scholar]
- 353.Yang X, Lee WP, Ye K, and Lee C. One reference genome is not enough. Genome Biol 20: 104, 2019. [DOI] [PMC free article] [PubMed] [Google Scholar]
- 354.Yang Y, and Chan L. Monogenic Diabetes: What It Teaches Us on the Common Forms of Type 1 and Type 2 Diabetes. Endocr Rev 37: 190–222, 2016. [DOI] [PMC free article] [PubMed] [Google Scholar]
- 355.Yao C, Chen G, Song C, Keefe J, Mendelson M, Huan T, Sun BB, Laser A, Maranville JC, Wu H, Ho JE, Courchesne P, Lyass A, Larson MG, Gieger C, Graumann J, Johnson AD, Danesh J, Runz H, Hwang SJ, Liu C, Butterworth AS, Suhre K, and Levy D. Genome-wide mapping of plasma protein QTLs identifies putatively causal genes and pathways for cardiovascular disease. Nat Commun 9: 3268, 2018. [DOI] [PMC free article] [PubMed] [Google Scholar]
- 356.Yazdani A, Yazdani A, Elsea SH, Schaid DJ, Kosorok MR, Dangol G, and Samiei A. Genome analysis and pleiotropy assessment using causal networks with loss of function mutation and metabolomics. BMC Genomics 20: 395, 2019. [DOI] [PMC free article] [PubMed] [Google Scholar]
- 357.Yoneyama S, Yao J, Guo X, Fernandez-Rhodes L, Lim U, Boston J, Buzkova P, Carlson CS, Cheng I, Cochran B, Cooper R, Ehret G, Fornage M, Gong J, Gross M, Gu CC, Haessler J, Haiman CA, Henderson B, Hindorff LA, Houston D, Irvin MR, Jackson R, Kuller L, Leppert M, Lewis CE, Li R, Le Marchand L, Matise TC, Nguyen KD, Chakravarti A, Pankow JS, Pankratz N, Pooler L, Ritchie MD, Bien SA, Wassel CL, Chen YI, Taylor KD, Allison M, Rotter JI, Schreiner PJ, Schumacher F, Wilkens L, Boerwinkle E, Kooperberg C, Peters U, Buyske S, Graff M, and North KE. Generalization and fine mapping of European ancestry-based central adiposity variants in African ancestry populations. Int J Obes (Lond) 41: 324–331, 2017. [DOI] [PMC free article] [PubMed] [Google Scholar]
- 358.Yu H, Wang F, Lin L, Cao W, Liu Y, Qin L, Lu H, He F, Shen H, and Yang P. Mapping and analyzing the human liver proteome: progress and potential. Expert Rev Proteomics 13: 833–843, 2016. [DOI] [PubMed] [Google Scholar]
- 359.Zaghlool SB, Mook-Kanamori DO, Kader S, Stephan N, Halama A, Engelke R, Sarwath H, Al-Dous EK, Mohamoud YA, Roemisch-Margl W, Adamski J, Kastenmuller G, Friedrich N, Visconti A, Tsai PC, Spector T, Bell JT, Falchi M, Wahl A, Waldenberger M, Peters A, Gieger C, Pezer M, Lauc G, Graumann J, Malek JA, and Suhre K. Deep molecular phenotypes link complex disorders and physiological insult to CpG methylation. Hum Mol Genet 27: 1106–1121, 2018. [DOI] [PMC free article] [PubMed] [Google Scholar]
- 360.Zaitlen N, Huntsman S, Hu D, Spear M, Eng C, Oh SS, White MJ, Mak A, Davis A, Meade K, Brigino-Buenaventura E, LeNoir MA, Bibbins-Domingo K, Burchard EG, and Halperin E. The Effects of Migration and Assortative Mating on Admixture Linkage Disequilibrium. Genetics 205: 375–383, 2017. [DOI] [PMC free article] [PubMed] [Google Scholar]
- 361.Zhang H, De T, Zhong Y, and Perera MA. The Advantages and Challenges of Diversity in Pharmacogenomics: Can Minority Populations Bring Us Closer to Implementation? Clin Pharmacol Ther 106: 338–349, 2019. [DOI] [PMC free article] [PubMed] [Google Scholar]
- 362.Zhao G, Yang W, Wu J, Chen B, Yang X, Chen J, McVey DG, Andreadi C, Gong P, Webb TR, Samani NJ, and Ye S. Influence of a Coronary Artery Disease-Associated Genetic Variant on FURIN Expression and Effect of Furin on Macrophage Behavior. Arterioscler Thromb Vasc Biol 38: 1837–1844, 2018. [DOI] [PMC free article] [PubMed] [Google Scholar]
- 363.Zhao L, Mulligan MK, and Nowak TS Jr. Substrain- and sex-dependent differences in stroke vulnerability in C57BL/6 mice. J Cereb Blood Flow Metab 39: 426–438, 2019. [DOI] [PMC free article] [PubMed] [Google Scholar]
- 364.Zhao Y, and Garcia BA. Comprehensive Catalog of Currently Documented Histone Modifications. Cold Spring Harb Perspect Biol 7: a025064, 2015. [DOI] [PMC free article] [PubMed] [Google Scholar]
- 365.Zheng Z, Huang D, Wang J, Zhao K, Zhou Y, Guo Z, Zhai S, Xu H, Cui H, Yao H, Wang Z, Yi X, Zhang S, Sham PC, and Li MJ. QTLbase: an integrative resource for quantitative trait loci across multiple human molecular phenotypes. Nucleic Acids Res 48: D983–D991, 2020. [DOI] [PMC free article] [PubMed] [Google Scholar]
- 366.Zhong W, Gummesson A, Tebani A, Karlsson MJ, Hong MG, Schwenk JM, Edfors F, Bergstrom G, Fagerberg L, and Uhlen M. Whole-genome sequence association analysis of blood proteins in a longitudinal wellness cohort. Genome Med 12: 53, 2020. [DOI] [PMC free article] [PubMed] [Google Scholar]
- 367.Zhou J, Ma S, Wang D, Zeng J, and Jiang T. FreePSI: an alignment-free approach to estimating exon-inclusion ratios without a reference transcriptome. Nucleic Acids Res 46: e11, 2018. [DOI] [PMC free article] [PubMed] [Google Scholar]
- 368.Zhou X, St Pierre CL, Gonzales NM, Zou J, Cheng R, Chitre AS, Sokoloff G, and Palmer AA. Genome-Wide Association Study in Two Cohorts from a Multi-generational Mouse Advanced Intercross Line Highlights the Difficulty of Replication Due to Study-Specific Heterogeneity. G3 (Bethesda) 10: 951–965, 2020. [DOI] [PMC free article] [PubMed] [Google Scholar]