

Abstract
Background:
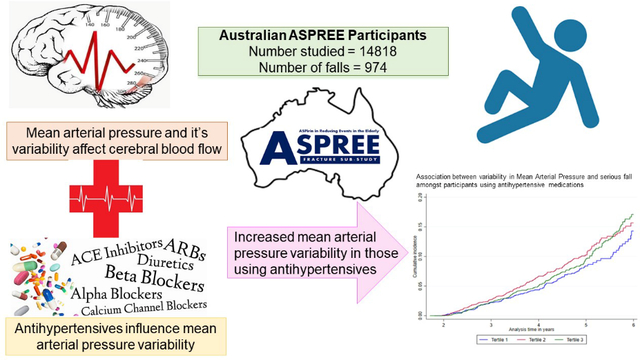
Impaired cerebral blood flow has been associated with an increased risk of falls. Mean arterial pressure (MAP) and variability in MAP have been reported to affect cerebral blood flow but their relationships to the risk of falls has not previously been reported.
Methods:
Utilising data from the ASPirin in Reducing Events in the Elderly trial participants, we estimated MAP and variability in MAP, defined as within-individual Standard Deviation of MAP from baseline and first two annual visits. The relationship with MAP was studied in 16,703 participants amongst whom 1,539 falls were recorded over 7.3 years. Variability in MAP was studied in 14,818 of these participants who experienced 974 falls over 4.1 years. Falls were confined to those involving hospital presentation. Cox regression was used to calculate hazard ratio (HR) and 95% confidence interval (CI) for associations with falls.
Results:
MAP variability was not associated with falls except amongst frail or prefrail participants using antihypertensive medications. Within this group each five mmHg increase in MAP variability increased the risk of falls by 16% (HR1.16, 95% CI 1.02–1.33). Amongst the antihypertensive drugs studied, beta-blocker monotherapy (HR1.93, 95% CI 1.17–3.18) was associated with an increased risk of falls compared with calcium channel blockers
Conclusions:
Higher levels of MAP variability increase the risk of serious falls in older frail and prefrail individuals taking antihypertensive medications. The observation that the relationship was limited to frail and prefrail individuals might explain some of the variability of previous studies linking blood pressure indices and falls.
Keywords: Mean arterial pressure, mean arterial pressure variability, falls, older adults, frailty, prefrailty
Graphical Abstract
Background
Falls are a leading cause of injuries, hospital utilisation and death in older adults. As a result of population ageing, the frequency of fall-related injuries will continue to increase1. The causes of falls in the older population are complex and multifactorial, with factors such as hearing impairment, visual impairment, cognitive decline, orthostatic hypotension and frailty increasing the risk2.
Earlier studies of the relationship between blood pressure (BP) and falls have provided inconsistent results. Several randomized controlled trials and cohort studies have reported that neither systolic blood pressure (SBP) nor diastolic blood pressure (DBP) is associated with an increased risk of falls3–10. For example, in the ‘Reasons for Geographic and Racial Difference in Stroke’ (REGARDS) study, neither SBP or DBP, nor the number of prescribed antihypertensive medication classes were associated with increased risk of falls9. Additionally, a recent systematic review found no relationship between the use of antihypertensive medications and falls11. By contrast, other studies conducted within community-based older adults, have reported that antihypertensive medication use was associated with an increase in the risk of both falls12 and fractures13. The reason for the variation in findings is unclear.
Other blood pressure indices have been studied in relation to fall risk. The ‘Systolic Blood Pressure Intervention Trial’ (SPRINT) reported that a wider pulse pressure (PP), and the combination of wider PP and intensive BP treatment, were both associated with a composite adverse event outcome which included falls14.
Mean arterial pressure (MAP) is calculated from SBP and DBP. MAP has been reported to be more closely related to organ perfusion than SBP and is directly related to cerebral blood flow in healthy adults15, such that an increase in MAP is associated with an increase in cerebral blood flow and vice versa15, 16. In healthy older adults, long-term variability in MAP (MAP variability) has also been shown to influence cerebral blood flow and individuals treated with antihypertensive medications have been reported to demonstrate increased BP variability17, 18. In the MOBILIZE Boston Study, impaired cerebral blood flow was associated with an increased risk of falls19. On this basis we examined the hypothesis that both the level of MAP along with its variability increase the risk of falls in generally healthy older individuals, and also explored whether any association was influenced by specific classes of antihypertensive medications.
Methods
Study design and setting
In this post-hoc analysis of data from the Aspirin in Reducing Events in the Elderly (ASPREE) and the ASPREE-Fracture sub-study, we used the detailed information on falls available from Australian participants.
The ASPREE trial recruited 19,114 older, community-dwelling adults from Australia (aged at least 70 years) and the United States (aged at least 65 years). The detailed methods of ASPREE, its recruitment and primary outcomes have been previously reported20, 21. ASPREE participants were recruited from March 2010 to December 2014 and were randomised to receive aspirin 100 mg daily or matching placebo20–22. They had no prior cardiovascular disease (CVD) events, dementia, physical disability, or chronic illness expected to limit survival to less than 5 years. Individuals with uncontrolled high BP (SBP ≥180 mmHg and DBP ≥105 mmHg) were also excluded from enrolment.
Standard Assessments
After study recruitment and randomisation, all ASPREE participants were contacted quarterly by telephone, and seen in-person annually. At these annual visits, anthropometric and laboratory measurements were taken, and data regarding medical comorbidities, lifestyle and socio-demographic factors, prescription medications, and other related health parameters were collected. Modified Fried’s frailty phenotype, which defines frailty as the presence of weakness, slowness, exhaustion, low physical activity, and weight loss, was used to categorise frailty status. Anyone with one or two criteria was categorised as prefrail, and three or more criteria was categorised as frail23, 24. We combined prefrail and frail to improve statistical precision. In the MAP analysis 6101 participants were prefrail and 310 were frail and in the MAP variability analysis 5276 participants were prefrail and 232 participants were frail.
Participants’ BP was measured in the seated position, after at least 5 minutes of rest, using an automated oscillometric device (OMRON HEM-7203, 7121, and 7130 models) with an occluding cuff of appropriate size for the upper arm circumference (according to American Heart Association (AHA) guidelines)25. At each annual visit, three separate and consecutive BP readings one minute apart were taken with the mean of these measurements recorded as the BP.
Assessment of MAP and long-term MAP variability
We calculated MAP as DBP plus one-third of PP (the difference between SBP and DBP) according to the 2017 American guidelines26. The MAP calculated from baseline data at baseline was used for the analyses of MAP and falls occurring after recruitment. The MAP variability was defined using the within-individual standard deviation (SD) of the baseline, first and second year MAP. In addition to SD, we also calculated the coefficient of variation and variation independent of the mean, as alternate estimates of MAP variability. We observed high correlations of these different indices with SD in our sample (Table S1). Since using the SD is the simplest measure therefore, we used SD in our primary analysis. For the analysis of MAP variability and falls, falls occurring after the annual visit 2 were used. Sensitivity analyses assessed the robustness of the findings (see under statistical analysis).
Antihypertensive Medication status
Prescribed antihypertensive medications were recorded at each ASPREE annual visit27. In this study, ASPREE participants were classified as either using, or not using, antihypertensive medications based on this data. Antihypertensive medications were classified as monotherapy or combination therapies with two or more antihypertensive medications. Specific antihypertensive medications were classified according to the World Health Organization (WHO) Anatomical Therapeutic Chemical (ATC) Classification System and included: antiadrenergic (C02), diuretics (C03), beta-blocking agents (C07), calcium channel blockers (C08), and agents acting on the renin-angiotensin system (C09).
Falls Resulting in Hospital Presentation
A sub-study of ASPREE, the ASPREE-Fracture sub-study, collected data on all fractures or hospital presentations due to a fall that occurred post-randomisation. Fall was defined as an event which resulted in a person coming to rest inadvertently on the ground or floor or other lower level28. During the trial period, fall-related hospital presentation data in the previous 6 months were collected after questioning participants during the annual visit and bi-annual telephone follow-up. Notification of a potential fall triggered the collection of relevant information from hospital, general practice and specialist medical records. For an average of two years after the trial period, ASPREE also collected evidence of hospitalizations, including hospitalization for a fall that required hospitalization lasting for 24 hours or more.
The fall-related hospital presentation and fall event date were confirmed by evidence from hospital admission notes, hospital discharge summaries, medical imaging reports (x-ray, magnetic resonance imaging, computer tomography and bone scans), emergency department (ED) progress notes and death certificates. All potential outcomes were adjudicated by an endpoint adjudication committee, consisting of clinicians and research personnel blinded to ASPREE treatment group allocation. In the present study, a fall-related hospital presentation included either an emergency department presentation or hospital admission due to a fall. The present study analysed the first fall that occurred after recruitment when examining the associations between MAP and falls. However, when examining the association between falls and MAP variability, the first fall occurring after the period of measurement of MAP variability i.e. after the second annual visit was studied.
Statistical analysis
Cox proportional hazards regression was used to calculate the hazard ratios (HR) and 95% confidence interval (CI) from the time of randomisation to the first hospital presentation for a fall that occurred during the ASPREE follow-up period following the MAP variability estimate period.
The distributions of MAP and MAP variability are shown in Figure S1. Initially, MAP and MAP variability were treated as continuous variables. Thereafter, MAP was categorised according to quintiles of standard deviation (MAP was normally distributed): Q1 (lowest 20%), Q2-Q4 (middle 60%), and Q5 (highest 20%), where the lowest quintile (Q1) was used as the reference. Since the MAP variability data was positively skewed, MAP variability was categorised according to tertiles rather than quintiles.
Further analyses were used to examine the association between MAP and falls, adjusting for: age, sex, baseline SBP (Model 1); age, sex, baseline DBP (Model 2); age, sex, frailty status and use of Aspirin (Model 3); and age, sex, frailty status, use of Aspirin, alcohol consumption, diabetes, and chronic kidney disease (Model 4). In the analyses used to examine the association between MAP variability and falls, the adjustments were for: age, sex (Model 1); age, sex, baseline MAP (Model 2); age, sex, baseline MAP, frailty status and use of Aspirin (Model 3); and age, sex, baseline MAP, frailty status, use of Aspirin, alcohol consumption, diabetes, chronic kidney disease, and CVD (myocardial infarction and ischaemic stroke) and hospitalisation for heart failure occurring before second annual visit (Model 4).
Stratified analyses were used to examine whether the relationship between MAP and MAP variability and the risk of hospital presentation for falls was modified by baseline antihypertensive medication use (antihypertensive: no vs yes) since there was an interaction between MAP variability and antihypertensive using status. The p value for interaction between antihypertensive use and MAP variability tertile 2 was 0.02 and the p value for interaction between antihypertensive use and MAP variability tertile 3 was 0.07. We also stratified the MAP and MAP variability analyses according to the presence or absence of prefrailty/frailty status.
Sensitivity analysis were conducted using MAP measurements from four visits (baseline, first annual visit, second annual visit, and third annual visit) to estimate MAP variability and its association with first hospital presentation for a fall occurring after third annual visit until the end of follow-up. Additionally, we have examined the associations between average MAP at baseline through to annual visit 2 and falls that occurred after annual visit 2. We also repeated our analyses, excluding the participants who experienced a CVD event or died after MAP variability calculation and have also restricted our analysis to those who has a baseline BP ≥120 mmHg.
Whether the use of any subclass of antihypertensive medications was associated with an increased risk of falls was examined using calcium channel blockers as a reference and adjusted for age, sex, frailty status and use of Aspirin. This category of medications was used as a reference because it showed the least MAP variability in our ASPREE population and in previous studies, these agents were associated with least visit-to-visit BP variability29, 30. For this analysis, we restricted our analysis of antihypertensive medication use and falls to participants who were on monotherapy.
We repeated the analyses of MAP and MAP variability after stratification by sex, since females had higher numbers of falls than men. We also examined if SBP variability has any role in this association. Statistical analyses were performed using Stata MP version 17 for Windows (StataCorp LP, College Station, TX).
Results
Of 16,703 Australian ASPREE participants who were included for MAP calculation, we observed 1,539 participants with at least one serious fall resulting in hospital presentation over an average of 7.3 years of follow-up (interquartile range, IQR 0.03, 7.1). For the analysis of MAP variability and falls resulting in hospital presentation, 14,818 participants who attended baseline, first and second annual visit were included. Of these, 974 participants with at least one serious fall were observed over 4.1 years (IQR 1.8, 7.1). A schematic diagram of the participants included is shown in Figure S2.
ASPREE participants who reported an incident fall were older and more likely to be female, prefrail/frail, with CVD or chronic renal insufficiency and to be using specific antihypertensive medications, especially diuretics (35.7% vs 31.1%) or beta-blockers (10.9% vs 8.1%) (Table 1). Similar results were observed when these analyses were repeated for the 14,818 participants included in MAP variability and falls (after second annual visit) analysis (Table S2).
Table 1.
Baseline characteristics of ASPREE participants for whom MAP was calculated: Overall, and by serious fall that resulted in hospital presentation over the follow-up period
| Characteristic, n | Total ASPREE population (n=16703) | Participants not experiencing a fall (n=15164) | Participants experiencing an incident (first) fall (n=1539) |
|---|---|---|---|
| Age, years | 75.3 (4.4) | 75.1 (4.2) | 77.2 (5.0) |
| Women, n (%) | 9179 (55.0) | 8139 (53.7) | 1040 (67.6) |
| SBP, mmHg | 139.8 (16.3) | 139.8 (16.3) | 139.8 (17.0) |
| DBP, mmHg | 77.2 (10.0) | 77.3 (10.0) | 76.7 (10.1) |
| Alcohol use, n (%) | |||
| Never/Former | 3520 (21.1) | 3159 (20.8) | 361 (23.5) |
| Current | 13183 (78.9) | 12,005 (79.2) | 1178 (76.5) |
| Frailty status | |||
| Not prefrail/frail | 10,292 (61.6) | 9536 (62.9) | 756 (49.2) |
| Prefrail/frail | 6,411 (38.4) | 5628 (37.1) | 783 (50.9) |
| Using antihypertensive medication | 8748 (54.8) | 7876 (54.5) | 872 (58.1) |
| Co-morbidities | |||
| Diabetes | 1644 (9.8) | 1486 (9.8) | 158 (10.3) |
| Chronic renal insufficiency | 2955 (18.2) | 2640 (17.9) | 315 (20.9) |
| Cardiovascular disease* | 488 (3.1) | 393 (2.7) | 95 (6.6) |
| Hospitalisation for heart failure* | 101 (0.6) | 75 (0.5) | 26 (1.7) |
| On Trial medication (Aspirin) | 8322 (49.8) | 7529 (49.7) | 739 (51.5) |
| MAP, mmHg | 98.1 (10.6) | 98.1 (10.6) | 97.7 (10.8) |
| MAP category | |||
| Q1 | 3431 (20.5) | 3105 (20.5) | 326 (21.2) |
| Q2-Q4 | 9994 (59.8) | 9077 (59.9) | 917 (59.6) |
| Q5 | 3278 (19.6) | 2982 (19.7) | 296 (19.2) |
| MAP variability, mmHg (n=14818) | 6.7 (3.9) | 6.7 (3.9) | 7.2 (4.2) |
| MAP variability category (n=14,818) | |||
| T1 | 4948 (33.4) | 4550 (33.7) | 398 (29.9) |
| T2 | 4932 (33.3) | 4490 (33.3) | 442 (33.3) |
| T3 | 4938 (33.3) | 4448 (33.0) | 490 (36.8) |
| Types of antihypertensive medication (n=8748) | |||
| Antiadrenergic | 506 (5.8) | 463 (5.9) | 43 (4.9) |
| Diuretics | 2764 (31.6) | 2453 (31.1) | 311 (35.7) |
| Beta blockers | 734 (8.4) | 639 (8.1) | 95 (10.9) |
| Calcium channel blockers | 1605 (18.4) | 1454 (18.5) | 151 (17.3) |
| Renin angiotensin system inhibitors | 3139 (35.9) | 2867 (36.4) | 272 (31.2) |
Before annual visit 2
SBP=Systolic blood pressure, DBP=Diastolic blood pressure, MAP= Mean arterial pressure, Q1=Bottom 20%, Q2-Q4=Middle 60%, Q5=Top 20%, T1=Bottom 33.3%, T2=Middle 33.3%, T3=Top 33.3%
Mean arterial pressure and falls risk:
No association between MAP measured at baseline and falls requiring hospital presentation was evident when MAP was analysed either in quintiles or as a continuous variable, or after controlling for age, sex and other variables that may potentially increase the risk of falls (Table S3). Similarly, no association between MAP and falls were seen either in sex stratified analysis or an analysis based on frailty status. Furthermore, no association was seen between MAP and falls after stratification into those using or not using antihypertensive medications (Table S4).
MAP variability and falls risk:
Participants in the highest quintile of MAP had the highest MAP variability (Figure 1A). MAP variability was also higher among those who were using antihypertensive medications compared to those who were not using antihypertensive medications (Figure 1B).
Figure 1.
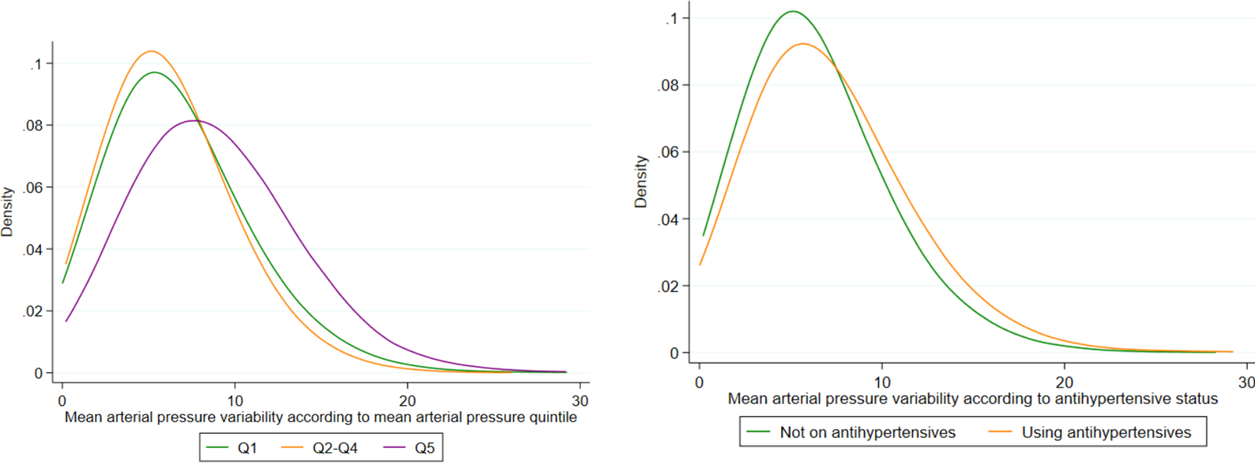
Distribution of MAP variability
No association was seen between overall MAP variability and falls requiring hospital presentation when MAP variability was analysed either as a continuous variable or in tertiles, or after controlling for age, sex and other variables that may potentially increase the risk of falls (Table 2). Similarly, no association between MAP variability and falls were observed in either in the sex stratified analysis or the analysis based on frailty status.
Table 2:
Association between long-term variability in MAP (Within individual SD) and serious fall that resulted in hospital presentation in ASPREE participants occurring after the second annual visit (HR, 95% CI)
| Serious fall | Variability in MAP continuous (linear) | MAP variability tertiles | ||
|---|---|---|---|---|
| T1 (reference) | T2 | T3 | ||
| All* | ||||
| N | 14,818 | 4948 | 4932 | 4938 |
| No of at least 1 fall | 974 | 291 | 334 | 349 |
| Model 1 | 1.02 (0.94, 1.10) | 1 | 1.04 (0.89, 1.21) | 1.00 (0.85, 1.16) |
| Model 2 | 1.04 (0.96, 1.13) | 1 | 1.05 (0.90, 1.23) | 1.04 (0.88, 1.22) |
| Model 3 | 1.04 (0.96, 1.12) | 1 | 1.05 (0.90, 1.23) | 1.03 (0.88, 1.21) |
| Model 4 | 1.03 (0.95, 1.12) | 1 | 1.04 (0.89, 1.22) | 1.01 (0.86, 1.19) |
| Analyses stratified by sex† | ||||
| Females | ||||
| N | 8056 | 2593 | 2653 | 2810 |
| No of at least 1 fall | 656 | 191 | 226 | 239 |
| Model 1 | 1.00 (0.92, 1.10) | 1 | 1.06 (0.87, 1.28) | 0.99 (0.82, 1.20) |
| Model 2 | 1.03 (0.93, 1.13) | 1 | 1.07 (0.88, 1.30) | 1.03 (0.84, 1.25) |
| Model 3 | 1.03 (0.93, 1.13) | 1 | 1.08 (0.89, 1.31) | 1.02 (0.84, 1.25) |
| Model 4 | 1.02 (0.93, 1.13) | 1 | 1.05 (0.86, 1.28) | 1.01 (0.83, 1.23) |
| Males | ||||
| N | 6762 | 2355 | 2279 | 2128 |
| No of at least 1 fall | 318 | 100 | 108 | 110 |
| Model 1 | 1.02 (0.89, 1.18) | 1 | 1.00 (0.76, 1.31) | 1.00 (0.76, 1.32) |
| Model 2 | 1.06 (0.91, 1.22) | 1 | 1.01 (0.78, 1.32) | 1.05 (0.80, 1.39) |
| Model 3 | 1.05 (0.91, 1.21) | 1 | 1.00 (0.76, 1.31) | 1.03 (0.78, 1.36) |
| Model 4 | 1.03 (0.89, 1.20) | 1 | 1.00 (0.76, 1.32) | 1.01 (0.76, 1.34) |
| Analyses stratified by prefrailty/frailty status‡ | ||||
| Not prefrail/frail | ||||
| N | 9310 | 3261 | 3083 | 2966 |
| No of at least 1 fall | 489 | 160 | 172 | 157 |
| Model 1 | 0.94 (0.84, 1.06) | 1 | 0.98 (0.79, 1.21) | 0.88 (0.70, 1.09) |
| Model 2 | 0.95 (0.85, 1.07) | 1 | 0.98(0.79, 1.22) | 0.89 (0.71, 1.12) |
| Model 3 | 0.95 (0.85, 1.07) | 1 | 0.98 (0.79, 1.22) | 0.89 (0.71, 1.12) |
| Model 4 | 0.93 (0.83, 1.06) | 1 | 0.95 (0.76, 1.18) | 0.85 (0.68, 1.07) |
| Prefrail/frail | ||||
| N | 5508 | 1687 | 1849 | 1972 |
| No of at least 1 fall | 485 | 131 | 162 | 192 |
| Model 1 | 1.07 (0.96, 1.19) | 1 | 1.09 (0.87, 1.38) | 1.11 (0.88, 1.38) |
| Model 2 | 1.11 (0.99, 1.23) | 1 | 1.12 (0.89, 1.41) | 1.17 (0.93, 1.47) |
| Model 3 | 1.11 (0.99, 1.24) | 1 | 1.12 (0.89, 1.42) | 1.18 (0.94, 1.48) |
| Model 4 | 1.11 (1.00, 1.25) | 1 | 1.14 (0.90, 1.44) | 1.20 (0.95, 1.52) |
MAP= Mean arterial pressure, T1=Bottom 33.3%, T2=Middle 33.3%, T3=Top 33.3%
Adjusted for Model 1: age, sex, Model 2: age, sex, baseline mean arterial pressure, Model 3: age, sex, mean arterial pressure, frailty status and Aspirin, Model 4: age, sex, mean arterial pressure, frailty status, Aspirin, alcohol consumption, diabetes, chronic kidney disease, cardiovascular disease before annual visit 2 and hospitalization for heart failure before annual visit 2
Adjusted for Model 1: age, Model 2: age, baseline mean arterial pressure, Model 3: age, mean arterial pressure, frailty status and Aspirin, Model 4: age, mean arterial pressure, frailty status, Aspirin, alcohol consumption, diabetes, chronic kidney disease, cardiovascular disease before annual visit 2 and hospitalization for heart failure before annual visit 2
Adjusted for Model 1: age, sex, Model 2: age, sex, baseline mean arterial pressure, Model 3: age, sex, mean arterial pressure, and Aspirin, Model 4: age, sex, mean arterial pressure, Aspirin, alcohol consumption, diabetes, chronic kidney disease, cardiovascular disease before annual visit 2 and hospitalization for heart failure before annual visit 2
However, amongst the subgroup of participants who were using antihypertensive medications, each five mmHg increase in MAP variability increased the risk of falls requiring hospital presentation (occurring after the second annual visit) by 7% (HR 1.07, 95% CI 1.01, 1.16) (Table 3). These results remained significant after adjustment for potential confounders. Similarly, when MAP variability amongst those on antihypertensives was analysed in tertiles of SD, participants in the middle (HR 1.22, 95% CI 1.02, 1.53) and highest tertile (HR 1.10, 95% CI 1.01, 1.37) had a significantly increased risk of serious falls compared with those in the lowest tertile (Figure 2). The association appeared to be principally confined to males and to those classified as frail or prefrail. No similar association was observed in those who were not prefrail/frail.
Table 3:
Association between long-term variability in MAP (Within individual SD) and serious fall that resulted in hospital presentation in ASPREE participants occurring after the second annual visit, stratified by antihypertensive use status (n=14818, falls=979) (HR, 95% CI)
| Serious fall | Not on antihypertensive | On antihypertensive | ||||||
|---|---|---|---|---|---|---|---|---|
| All (linear) | T1 | T2 | T3 | All (linear) | T1 | T2 | T3 | |
| All* | ||||||||
| N | 6436 | 2379 | 2178 | 1879 | 7688 | 2284 | 2503 | 2901 |
| Observed falls | 420 | 156 | 139 | 125 | 529 | 128 | 186 | 215 |
| Model 1 | 0.93 (0.82, 1.06) | 1 | 0.86 (0.68, 1.08) | 0.84 (0.67, 1.07) | 1.07 (1.01, 1.16) | 1 | 1.22 (1.02, 1.53) | 1.10 (1.01, 1.37) |
| Model 2 | 0.92 (0.80, 1.06) | 1 | 0.85 (0.68, 1.07) | 0.83 (0.65, 1.06) | 1.10 (1.02, 1.21) | 1 | 1.25 (1.02, 1.56) | 1.19 (1.02, 1.49) |
| Model 3 | 0.92 (0.81, 1.06) | 1 | 0.85 (0.72, 1.08) | 0.83 (0.65, 1.06) | 1.09 (1.02, 1.20) | 1 | 1.24 (1.03, 1.55) | 1.17 (1.02, 1.46) |
| Model 4 | 0.89 (0.77, 1.02) | 1 | 0.82 (0.65, 1.04) | 0.78 (0.61, 1.01) | 1.10 (1.01, 1.22) | 1 | 1.24 (1.03, 1.57) | 1.19 (1.03, 1.49) |
| Analyses stratified by sex† | ||||||||
| Females | ||||||||
| N | 3384 | 1215 | 1141 | 1028 | 4402 | 1280 | 1407 | 1715 |
| Observed falls | 270 | 94 | 93 | 83 | 374 | 94 | 130 | 150 |
| Model 1 | 0.98 (0.84, 1.15) | 1 | 0.91 (0.68, 1.22) | 0.88 (0.65, 1.19) | 1.00 (0.89, 1.13) | 1 | 1.18 (0.91, 1.54) | 1.04 (0.80, 1.34) |
| Model 2 | 0.97 (0.82, 1.15) | 1 | 0.90 (0.68, 1.21) | 0.86 (0.63, 1.17) | 1.04 (0.92, 1.17) | 1 | 1.20 (0.93, 1.57) | 1.11 (0.85, 1.45) |
| Model 3 | 0.97 (0.82, 1.15) | 1 | 0.91 (0.68, 1.21) | 0.86 (0.63, 1.17) | 1.04 (0.92, 1.17) | 1 | 1.21 (0.93, 1.58) | 1.11 (0.85, 1.44) |
| Model 4 | 0.92 (0.78, 1.10) | 1 | 0.84 (0.63, 1.14) | 0.80 (0.59, 1.12) | 1.05 (0.93, 1.19) | 1 | 1.20 (0.91, 1.57) | 1.12 (0.86, 1.47) |
| Male | ||||||||
| N | 3052 | 1164 | 1037 | 851 | 3286 | 1004 | 1096 | 1186 |
| Observed falls | 150 | 62 | 46 | 42 | 155 | 34 | 56 | 65 |
| Model 1 | 0.83 (0.65, 1.05) | 1 | 0.76 (0.52, 1.11) | 0.78 (0.53, 1.16) | 1.15 (0.96, 1.38) | 1 | 1.30 (0.87, 1.99) | 1.25 (0.99, 1.90) |
| Model 2 | 0.82 (0.65, 1.05) | 1 | 0.75 (0.52, 1.11) | 0.78 (0.52, 1.16) | 1.23 (1.02, 1.48) | 1 | 1.32 (0.88, 2.02) | 1.39 (1.01, 2.12) |
| Model 3 | 0.83 (0.65, 1.05) | 1 | 0.75 (0.52, 1.17) | 0.78 (0.52, 1.17) | 1.21 (1.01, 1.46) | 1 | 1.28 (0.86, 2.23) | 1.32 (1.00, 2.03) |
| Model 4 | 0.80 (0.62, 1.03) | 1 | 0.76 (0.51, 1.13) | 0.75 (0.50, 1.14) | 1.20 (1.01, 1.46) | 1 | 1.33 (0.89, 2.07) | 1.32 (1.01, 2.04) |
| Analyses stratified by prefrailty/frailty status‡ | ||||||||
| Not prefrail/frail | ||||||||
| N | 4194 | 1609 | 1412 | 1173 | 4590 | 1426 | 1487 | 1677 |
| Observed falls | 229 | 84 | 86 | 59 | 243 | 70 | 82 | 91 |
| Model 1 | 0.86 (0.71, 1.03) | 1 | 0.97 (0.72, 1.32) | 0.76 (0.55, 1.32) | 0.99 (0.85, 1.15) | 1 | 1.00 (0.73, 1.38) | 0.93 (0.68, 1.27) |
| Model 2 | 0.85 (0.70, 1.03) | 1 | 0.97 (0.72, 1.31) | 0.75 (0.53, 1.06) | 1.02 (0.87, 1.20) | 1 | 1.01 (0.74, 1.39) | 0.99 (0.72, 1.36) |
| Model 3 | 0.85 (0.70, 1.03) | 1 | 0.97 (0.72, 1.31) | 0.75 (0.53, 1.06) | 1.02 (0.87, 1.20) | 1 | 1.01 (0.73, 1.38) | 0.98 (0.71, 1.35) |
| Model 4 | 0.80 (0.66. 0.98) | 1 | 0.89 (0.66, 1.22) | 0.68 (0.48, 0.98) | 1.02 (0.87, 1.20) | 1 | 1.01 (0.73, 1.40) | 0.97 (0.70, 1.35) |
| Prefrail/frail | ||||||||
| N | 2242 | 770 | 766 | 706 | 3098 | 858 | 1016 | 1224 |
| Observed falls | 191 | 72 | 53 | 66 | 286 | 58 | 104 | 124 |
| Model 1 | 1.01 (0.84, 1.23) | 1 | 0.71 (0.50, 1.01) | 0.93 (0.66, 1.30) | 1.08 (1.00, 1.23) | 1 | 1.46 (1.06, 2.02) | 1.28 (1.00, 1.75) |
| Model 2 | 1.01 (0.82, 1.23) | 1 | 0.70 (0.49, 1.01) | 0.90 (0.64, 1.28) | 1.13 (0.99, 1.30) | 1 | 1.51 (1.09, 2.08) | 1.39 (1.01, 1.91) |
| Model 3 | 1.01 (0.83, 1.23) | 1 | 0.70 (0.49, 1.00) | 0.90 (0.64, 1.28) | 1.14 (1.00, 1.30) | 1 | 1.51 (1.10, 2.09) | 1.40 (1.02, 1.93) |
| Model 4 | 0.99 (0.81, 1.21) | 1 | 0.72 (0.50, 1.03) | 0.90 (0.63, 1.29) | 1.16 (1.02, 1.33) | 1 | 1.52 (1.10, 2.12) | 1.46 (1.06, 2.02) |
MAP= Mean arterial pressure; SD=standard deviation; %, T1=Bottom 33.3%, T2=Middle 33.3%, T3=Top 33.3%
Adjusted for Model 1: age, sex, Model 2: age, sex, baseline mean arterial pressure, Model 3: age, sex, mean arterial pressure, frailty status and Aspirin, Model 4: age, sex, mean arterial pressure, frailty status, Aspirin, alcohol consumption, diabetes, chronic kidney disease, cardiovascular disease before annual visit 2 and hospitalization for heart failure before annual visit 2
Adjusted for Model 1: age, Model 2: age, baseline mean arterial pressure, Model 3: age, mean arterial pressure, frailty status and Aspirin, Model 4: age, mean arterial pressure, frailty status, Aspirin, alcohol consumption, diabetes, chronic kidney disease, cardiovascular disease before annual visit 2 and hospitalization for heart failure before annual visit 2
Adjusted for Model 1: age, sex, Model 2: age, sex, baseline mean arterial pressure, Model 3: age, sex, mean arterial pressure, and Aspirin, Model 4: age, sex, mean arterial pressure, Aspirin, alcohol consumption, diabetes, chronic kidney disease, cardiovascular disease before annual visit 2 and hospitalization for heart failure before annual visit 2
Figure 2:
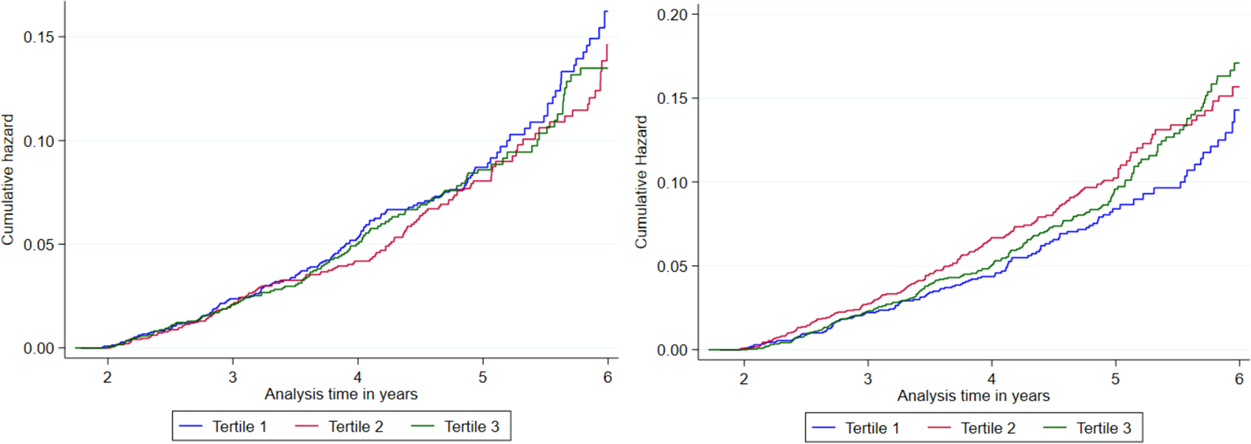
Association between long-term MAP variability (Within individual SD) and serious fall in ASPREE participants occurring after the second annual visit, stratified by antihypertensive use status
Antihypertensive medication use and falls risk:
The associations between categories of antihypertensive drug use (monotherapy only) and falls requiring hospital presentation are shown in Table S5. Compared with calcium channel blocker monotherapy (participants on calcium channel blockers had the lowest MAP variability), beta-blocker monotherapy (HR 1.93, 95% CI 1.17, 3.18) increased the risk of falls after adjusting for age, sex, prefrailty/frailty status and use of Aspirin. These results persisted when we excluded participants who had developed heart failure during the two years after randomisation (HR 1.91, 95% CI 1.15, 3.18).
Sensitivity analysis:
We have examined the associations between average MAP at baseline through to annual visit 2 and falls that occurred after annual visit 2, however our results remained the same (Tables S6 and S7). Using longer-term MAP variability from baseline to the third annual visit (within individual SD) did not change the association between MAP variability and falls requiring hospital presentation (occurring after third annual visit) (Table S8). Similarly, using MAP variability from baseline to third annual visit according to antihypertensive medication use, the results remained consistent with the main findings, showing an increased risk of incident falls (occurring after third annual visit) in the higher MAP variability tertiles (Table S9). Excluding the participants who experienced a CVD event or died after MAP variability calculation did not change our observation (Tables S10 and S11). Restricting our analysis to those who has a baseline BP ≥120 mmHg, showed the similar effect of MAP variability on falls risk (Tables S12 and S13). SBP variability in this cohort did not predict falls (Tables S14 and S15) whereas, MAP variability did in prefrail/frail participants on antihypertensive medications.
Discussion
The principal finding of the study was that increased levels of variability in MAP predicted an increase in the risk of serious falls requiring hospital presentation in an older population, but the risk was confined to frail and prefrail participants receiving treatment with antihypertensive medications. Males appeared to be more at risk than females. The relationship with falls persisted after adjusting for age, sex, frailty status, SBP, DBP and other potential confounders suggesting that the extent of variability itself is likely to be the main factor increasing the risk of a fall. In keeping with reports from other studies mean levels of blood pressure themselves were not related to the risk of falls3–10, 12–14, 31, 32 (Table S16).
MAP variability was measured as the SD of three MAP readings measured over the first two years of the study. Previous studies have not determined the impact of MAP variability amongst frail or prefrail individuals although the REGARDS study, alluded to the fact that falls were more common among the individuals having exhaustion, one of the criteria of frailty9. Our study extends by showing the effect of MAP variability is confined largely to prefrail/frail participants.
The finding that MAP variability increased the risk of falls principally amongst older frail individuals receiving antihypertensive medications raises the possibility that antihypertensive induced hypotension may underlie the occurrence of falls in this age group33. Previous studies showed that, visit-to-visit BP variability is more common in hypertensive individuals and people with comorbidities17. Variable compliance with antihypertensive medications may also contribute. The lesser risk amongst females may reflect more consistent compliance but is also compatible with reports that females are better able to maintain cerebral flow velocities during postural changes than men34.
Although the adherence to antihypertensive medication was not examined in ASPREE, our findings are compatible with a previous report from the Antihypertensive and Lipid-Lowering Treatment to Prevent Heart Attack (ALLHAT) trial which showed that poor medication adherence was associated with an increased rate of injurious falls35. Other studies in community dwelling older adults have reported similar findings36, 37. The increased risk of falls amongst prefrail/frail participants on antihypertensive treatment indicates the importance of identifying people with prefrailty/frailty and monitoring their antihypertensive treatment. Prior studies reporting the risk of falls with the use of different classes of antihypertensives, have been inconsistent7, 38–43. In this study a higher risk of falls was associated with the use of beta-blocker monotherapy in comparison with calcium channel blocker monotherapy but as an exploratory analysis based on small numbers this suggestion is highly tentative. The association of beta-blocker medications and falls is consistent with the finding from the Women’s Health Initiative trial7, the Rotterdam study42, the B-vitamins in the PRevention Of Osteoporotic Fractures (B-PROOF) study42, and The Irish Longitudinal Study on Ageing (TILDA)43. In each of these, the risk of falls was greater amongst those treated with beta-blockers than amongst those receiving other antihypertensive medication classes. Beta-blockers have been associated with greater visit-to-visit BP variability17, and orthostatic hypotension than other antihypertensive classes, possibly as a result of bradycardia and inability to mount a reflex increase in heart rate and cardiac output on standing44, 45.
As worldwide populations age, the population being treated with antihypertensive medications will continue to increase and falls are a major contributor to morbidity and mortality in older adults. Small increases in falls risks associated with using a medication as widely used as antihypertensives might substantially increase the associated burden to the health system. Clinician awareness that significant MAP variability from one visit to the next might signify erratic compliance with antihypertensive medication and an increased risk of falls might reduce this burden. Although further studies are needed to confirm a higher risk of falls when using beta-blocker medications, it may be prudent to consider reviewing this risk-benefit profile carefully in each individual patient. It is notable both the American College of Cardiology (ACC)/the American Heart Association (AHA) and the European Society of Hypertension (ESH)/the European Society of Cardiology (ESC) guideline suggest restricting of the use of beta-blockers to patients with comorbidities or compelling indications requiring their use46.
The strength of our study includes its large sample size, intensive data collection from in-person visits, telephone assessments, rigorous collection of relevant ancillary information, and standardized BP assessments. Exploration of MAP and MAP variability in the same cohort allowed us to recognise the relative predictive value of each. Falls were verified via clinical record audits that were then adjudicated to ensure robust case ascertainment. For the MAP variability analysis, falls occurring after the period (after second annual visit) during which MAP variability was estimated were analysed, which minimized immortal time bias but potentially reduces the precision around effect size estimates since it excludes events occurring early in the study. Furthermore, the detailed antihypertensive medication data provides deeper insights into the mechanism of effect of MAP, MAP variability and falls.
Our results need to be considered within the study’s limitations. This is a post-hoc sub-group analysis of a clinical trial; thus, its findings may have arisen by chance although the internal consistency of the findings makes this less likely. Participants who had very high SBP or DBP were not included and we did not capture medication nonadherence or changes in antihypertensive medication regimens which might increase or influence MAP variability35. Furthermore, we did not have any measure of examining postural blood pressure change that could have predisposed to falls. The definition of falls required a hospital presentation in the present study and this may underestimate the total number of serious falls occurring. The observed findings must also be interpreted in the context of multiple testing but also with an appreciation of prior reports concerning frailty, hypertension, antihypertensive treatments and the risk of falls in older people. One previous study in the community setting showed that indicators of frailty such as low body mass index, cognitive impairment, depressive symptoms, exhaustion, impaired mobility, was associated with increased risk for serious fall injuries among older adults taking antihypertensive medication9. Similarly, among the participants in home care residence older adults who were both frail and had impaired orthostatic blood pressure control had a high risk of falling47. Thus, our finding that increased levels of MAP variability predicted an increase in the risk of serious falls in frail and prefrail participants receiving treatment with antihypertensive medications is in keeping with a preponderance of related literature.
Conclusions
Frail and prefrail community-dwelling older individuals on treatment with antihypertensive medications having a higher visit-to-visit MAP variability are at increased risk of serious falls resulting in hospital presentation. Clinicians treating such individuals treated with antihypertensive medications should be aware of the potential to increase falls risk. Further studies are needed to explore the mechanism as to how and why variability in MAP might contribute to falls and to confirm whether a higher risk of falls exists during treatment with beta-blockers.
Perspectives
In this post hoc analysis of the ASPREE trial, long-term visit-to-visit MAP variability estimated using MAP measures taken from baseline through the second annual visit was associated with increased risk of falls during follow-up among frail and prefrail individuals taking antihypertensive medications. These findings persisted after controlling for a large number of covariates, including age, sex, frailty status, MAP and other potential confounders, and across several sensitivity analyses. While controlling blood pressure remains the most proven strategy to reduce CVD risk, our findings suggests that frail or prefrail older adults on antihypertensive medications should be alert to their increased risk of falls.
Supplementary Material
NOVELTY AND RELEVANCE.
What Is New?
Inconsistent results have been reported from a range of studies examining the relationship of individual blood pressure parameters (including systolic and diastolic BP) and the risk of falls in older populations. Mean arterial pressure is the parameter most closely related to cerebral blood flow in healthy adults, but relationship between mean arterial pressure and its long-term variability with falls in older adults has not been reported. In a large methodologically rigorous study we have shown that increased long-term variability in mean arterial pressure, but not mean arterial pressure itself, increase the risk of serious falls in older frail and prefrail individuals taking antihypertensive medications.
What Is Relevant?
As worldwide populations age, the population of frail elderly people being treated with antihypertensive medications will increase substantially. Falls in this age group are a major cause of morbidity and even moderate increases in falls risks increase the burden to the health system.
Clinical/Pathophysiological Implications?
Variation in mean arterial pressure from visit to visit is easily recognised in a clinical setting. When recognised in frail or prefrail individuals on antihypertensive medications it will signify an increased falls risk. Clinicians recognising this risk should review medication compliance and the choice of antihypertensive medications, as well as advising individuals about how to reduce other risk factors for falls
Acknowledgements
A. G. Bayer provided aspirin and matching placebo for ASPREE but had no other role in the study.
Sources of Funding
The ASPirin in Reducing Events in the Elderly (ASPREE) study was supported by grants from the National Institute on Aging and the National Cancer Institute at the National Institutes of Health (U01AG029824); the National Health and Medical Research Council in Australia (334037 and 1127060); Monash University (Melbourne, VIC, Australia); and the Victorian Cancer Agency (Australia).
Nonstandard Abbreviations and Acronyms
- BP
blood pressure
- SBP
systolic blood pressure
- DBP
diastolic blood pressure
- MAP
Mean arterial pressure
- MAP variability
long term variability in MAP
- PP
American Heart Association
- REGARDS
Reasons for Geographic and Racial Difference in Stroke
- SPRINT
Systolic Blood Pressure Intervention Trial
- ASPREE
Aspirin in Reducing Events in the Elderly
- CVD
cardiovascular disease
- AHA
American Heart Association
- WHO
World Health Organization
- AV
Annual visit
- SD
standard deviation
- ATC
Anatomical Therapeutic Chemical
- ED
emergency department
- HR
hazard ratios
- CI
confidence interval
- IQR
interquartile range
- ALLHAT
Antihypertensive and Lipid-Lowering Treatment to Prevent Heart Attack Trial
- B-PROOF
B-vitamins in the PRevention Of Osteoporotic Fractures
- TILDA
The Irish Longitudinal Study on Ageing
- ACC
American College of Cardiology
- ESH
European Society of Hypertension
- ESC
European Society of Cardiology
Footnotes
Conflict of Interest
SMH is the recipient of National Health and Medical Research Council (NHMRC) Early Career Fellowship (APP1142198), ALB was supported by a NHMRC Career Development Fellowship (APP1067236), CMR has a NHMRC Principal research Fellowship (APP1136372), JGT is an NHMRC-ARC Dementia Research Development Fellow (APP1107476), and J.MCN is supported through an NHMRC Leadership Fellowship (IG 1173690). No other disclosures are reported by the other authors.
Reference
- 1.James SL, Lucchesi LR, Bisignano C, Castle CD, Dingels ZV, Fox JT, Hamilton EB, Henry NJ, Krohn KJ, Liu Z, et al. The global burden of falls: global, regional and national estimates of morbidity and mortality from the Global Burden of Disease Study 2017. Inj Prev. 2020; 26(Supp 1):i3–i11. doi: 10.1136/injuryprev-2019-043286. [DOI] [PMC free article] [PubMed] [Google Scholar]
- 2.Deandrea S, Lucenteforte E, Bravi F, Foschi R, La Vecchia C, Negri E. Risk factors for falls in community-dwelling older people: a systematic review and meta-analysis. Epidemiology. 2010; 21:658–668. doi: 10.1097/EDE.0b013e3181e89905. [DOI] [PubMed] [Google Scholar]
- 3.Lewis CE, Fine LJ, Beddhu S, Cheung AK, Cushman WC, Cutler JA, Evans GW, Johnson KC, Kitzman DW, Oparil S, et al. ; SPRINT Research Group. Final report of a trial of intensive versus standard blood-pressure control. N Engl J Med. 2021; 384:1921–1930. doi: 10.1056/NEJMoa1901281. [DOI] [PMC free article] [PubMed] [Google Scholar]
- 4.Pajewski NM, Berlowitz DR, Bress AP, Callahan KE, Cheung AK, Fine LJ, Gaussoin SA, Johnson KC, King J, Kitzman DW, et al. Intensive vs standard blood pressure control in adults 80 years or older: A secondary analysis of the systolic blood pressure intervention trial. J Am Geriatr Soc. 2020; 68:496–504. doi: 10.1111/jgs.16272. [DOI] [PMC free article] [PubMed] [Google Scholar]
- 5.Williamson JD, Supiano MA, Applegate WB, Berlowitz DR, Campbell RC, Chertow GM, Fine LJ, Haley WE, Hawfield AT, Ix JH, et al. ; SPRINT Research Group. Intensive vs standard blood pressure control and cardiovascular disease outcomes in adults aged ≥75 years: A randomized clinical trial. JAMA. 2016; 315:2673–2682. doi: 10.1001/jama.2016.7050. [DOI] [PMC free article] [PubMed] [Google Scholar]
- 6.Wright JT Jr, Williamson JD, Whelton PK, Snyder JK, Sink KM, Rocco MV, Reboussin DM, Rahman M, Oparil S, Lewis CE, et al. ; SPRINT Research Group. A randomized trial of intensive versus standard blood-pressure control. N Engl J Med. 2015; 373(22):2103–16. doi: 10.1056/NEJMoa1511939. [DOI] [PMC free article] [PubMed] [Google Scholar]
- 7.Margolis KL, Buchner DM, LaMonte MJ, Zhang Y, Di C, Rillamas-Sun E, Hunt J, Ikramuddin F, Li W, Marshall S, et al. Hypertension treatment and control and risk of falls in older women. J Am Geriatr Soc. 2019; 67(4):726–733. doi: 10.1111/jgs.15732. [DOI] [PMC free article] [PubMed] [Google Scholar]
- 8.Sagawa N, Marcum ZA, Boudreau RM, Hanlon JT, Albert SM, O’Hare C, Satterfield S, Schwartz AV, Vinik AI, Cauley JA, et al. ; Health Aging Body Composition Study. Low blood pressure levels for fall injuries in older adults: the Health, Aging and Body Composition Study. Eur J Ageing. 2018; 15:321–330. doi: 10.1007/s10433-017-0449-9. [DOI] [PMC free article] [PubMed] [Google Scholar]
- 9.Bromfield SG, Ngameni CA, Colantonio LD, Bowling CB, Shimbo D, Reynolds K, Safford MM, Banach M, Toth PP, Muntner P. Blood pressure, antihypertensive polypharmacy, frailty, and risk for serious fall injuries among older treated adults with hypertension. Hypertension. 2017; 70:259–266. doi: 10.1161/HYPERTENSIONAHA.116.09390. [DOI] [PMC free article] [PubMed] [Google Scholar]
- 10.Margolis KL, Palermo L, Vittinghoff E, Evans GW, Atkinson HH, Hamilton BP, Josse RG, O’Connor PJ, Simmons DL, Tiktin M, Schwartz AV. Intensive blood pressure control, falls, and fractures in patients with type 2 diabetes: the ACCORD trial. J Gen Intern Med. 2014; 29:1599–1606. doi: 10.1007/s11606-014-2961-3. [DOI] [PMC free article] [PubMed] [Google Scholar]
- 11.Albasri A, Hattle M, Koshiaris C, Dunnigan A, Paxton B, Fox SE, Smith M, Archer L, Levis B, Payne RA, et al. ; STRATIFY investigators. Association between antihypertensive treatment and adverse events: systematic review and meta-analysis. BMJ. 2021; 372:n189. doi: 10.1136/bmj.n189 [DOI] [PMC free article] [PubMed] [Google Scholar]
- 12.Butt DA, Mamdani M, Austin PC, Tu K, Gomes T, Glazier RH. The risk of falls on initiation of antihypertensive drugs in the elderly. Osteoporos Int. 2013; 24:2649–2657. doi: 10.1007/s00198-013-2369-7. [DOI] [PubMed] [Google Scholar]
- 13.Butt DA, Mamdani M, Austin PC, Tu K, Gomes T, Glazier RH. The risk of hip fracture after initiating antihypertensive drugs in the elderly. Arch Intern Med. 2012; 172:1739–1744. doi: 10.1001/2013.jamainternmed.469. [DOI] [PubMed] [Google Scholar]
- 14.Krishnaswami A, Kim DH, McCulloch CE, Forman DE, Maurer MS, Alexander KP, Rich MW. Individual and Joint Effects of Pulse Pressure and Blood Pressure Treatment Intensity on Serious Adverse Events in the SPRINT Trial. Am J Med. 2018; 131:1220–1227.e1. doi: 10.1016/j.amjmed.2018.05.027. [DOI] [PubMed] [Google Scholar]
- 15.Lucas SJ, Tzeng YC, Galvin SD, Thomas KN, Ogoh S, Ainslie PN. Influence of changes in blood pressure on cerebral perfusion and oxygenation. Hypertension. 2010; 55:698–705. doi: 10.1161/HYPERTENSIONAHA.109.146290. [DOI] [PubMed] [Google Scholar]
- 16.Smirl JD, Hoffman K, Tzeng YC, Hansen A, Ainslie PN. Relationship between blood pressure and cerebral blood flow during supine cycling: influence of aging. J Appl Physiol (1985). 2016; 120:552–563. doi: 10.1152/japplphysiol.00667.2015. [DOI] [PMC free article] [PubMed] [Google Scholar]
- 17.McAlister FA, Lethebe BC, Leung AA, Padwal RS, Williamson T. Visit-to-visit blood pressure variability is common in primary care patients: Retrospective cohort study of 221,803 adults. PLoS One. 2021; 16:e0248362. doi: 10.1371/journal.pone.0248362. [DOI] [PMC free article] [PubMed] [Google Scholar]
- 18.Deverdun J, Akbaraly TN, Charroud C, Abdennour M, Brickman AM, Chemouny S, Steffener J, Portet F, Bonafe A, Stern Y, et al. Mean arterial pressure change associated with cerebral blood flow in healthy older adults. Neurobiol Aging. 2016; 46:49–57. doi: 10.1016/j.neurobiolaging.2016.05.012. [DOI] [PubMed] [Google Scholar]
- 19.Sorond FA, Galica A, Serrador JM, Kiely DK, Iloputaife I, Cupples LA, Lipsitz LA. Cerebrovascular hemodynamics, gait, and falls in an elderly population: MOBILIZE Boston Study. Neurology. 2010; 74:1627–33. doi: 10.1212/WNL.0b013e3181df0982. [DOI] [PMC free article] [PubMed] [Google Scholar]
- 20.McNeil JJ, Woods RL, Nelson MR, Reid CM, Kirpach B, Wolfe R, Storey E, Shah RC, Lockery JE, Tonkin AM, et al. ; ASPREE Investigator Group. Effect of aspirin on disability-free survival in the healthy elderly. N Engl J Med. 2018; 379:1499–1508. doi: 10.1056/NEJMoa1800722. [DOI] [PMC free article] [PubMed] [Google Scholar]
- 21.ASPREE Investigator Group. Study design of ASPirin in Reducing Events in the Elderly (ASPREE): a randomized, controlled trial. Contemp Clin Trials. 2013; 36:555–64. doi: 10.1016/j.cct.2013.09.014. [DOI] [PMC free article] [PubMed] [Google Scholar]
- 22.McNeil JJ, Nelson MR, Woods RL, Lockery JE, Wolfe R, Reid CM, Kirpach B, Shah RC, Ives DG, Storey E, et al. ; ASPREE Investigator Group. Effect of aspirin on all-cause mortality in the healthy elderly. N Engl J Med. 2018; 379:1519–1528. doi: 10.1056/NEJMoa1803955. [DOI] [PMC free article] [PubMed] [Google Scholar]
- 23.Fried LP, Tangen CM, Walston J, Newman AB, Hirsch C, Gottdiener J, Seeman T, Tracy R, Kop WJ, Burke G, et al. ; Frailty in older adults: Evidence for a phenotype. J Gerontol A Biol Sci Med Sci. 2001;56:M146–56. doi: 10.1093/gerona/56.3.m146. [DOI] [PubMed] [Google Scholar]
- 24.Wolfe R, Murray AM, Woods RL, Kirpach B, Gilbertson D, Shah RC, Nelson MR, Reid CM, Ernst ME, Lockery J, Donnan GA, Williamson J, McNeil JJ. The aspirin in reducing events in the elderly trial: Statistical analysis plan. Int J Stroke. 2018;13:335–338. doi: 10.1177/1747493017741383. [DOI] [PMC free article] [PubMed] [Google Scholar]
- 25.Pickering TG, Hall JE, Appel LJ, Falkner BE, Graves J, Hill MN, Jones DW, Kurtz T, Sheps SG, Roccella EJ. Recommendations for blood pressure measurement in humans and experimental animals: part 1: blood pressure measurement in humans: a statement for professionals from the Subcommittee of Professional and Public Education of the American Heart Association Council on High Blood Pressure Research. Circulation. 2005; 111:697–716. doi: 10.1161/01.CIR.0000154900.76284.F6. [DOI] [PubMed] [Google Scholar]
- 26.Whelton PK, Carey RM, Aronow WS, Casey DE Jr, Collins KJ, Dennison Himmelfarb C, DePalma SM, Gidding S, Jamerson KA, Jones DW, et al. 2017 ACC/AHA/AAPA/ABC/ACPM/AGS/APhA/ASH/ASPC/NMA/PCNA Guideline for the prevention, detection, evaluation, and management of high blood pressure in adults: A report of the American College of Cardiology/American Heart Association Task Force on clinical practice guidelines. J Am Coll Cardiol. 2018; 71:e127–e248. doi: 10.1016/j.jacc.2017.11.006. [DOI] [PubMed] [Google Scholar]
- 27.Ernst ME, Chowdhury EK, Beilin LJ, Margolis KL, Nelson MR, Wolfe R, Tonkin AM, Ryan J, Woods RL, McNeil JJ, Reid CM; ASPREE Investigator Group. Long-term blood pressure variability and risk of cardiovascular disease events among community-dwelling elderly. Hypertension. 2020; 76:1945–1952. doi: 10.1161/HYPERTENSIONAHA.120.16209. [DOI] [PMC free article] [PubMed] [Google Scholar]
- 28.Barker AL, McNeil JJ, Seeman E, Ward SA, Sanders KM, Khosla S, Cumming RG, Pasco JA, Bohensky MA, Ebeling PR, et al. ; ASPREE Investigator Group. A randomised controlled trial of low-dose aspirin for the prevention of fractures in healthy older people: protocol for the ASPREE-Fracture substudy. Inj Prev. 2016; 22:297–301. doi: 10.1136/injuryprev-2015-041655. [DOI] [PMC free article] [PubMed] [Google Scholar]
- 29.de Havenon A, Petersen N, Wolcott Z, Goldstein E, Delic A, Sheibani N, Anadani M, Sheth KN, Lansberg M, Turan T, Prabhakaran S. Effect of dihydropyridine calcium channel blockers on blood pressure variability in the sprint trial: A treatment effects approach. J Hypertens. 2022;40:462–469. doi: 10.1097/HJH.0000000000003033. [DOI] [PMC free article] [PubMed] [Google Scholar]
- 30.Webb AJ, Rothwell PM. Effect of dose and combination of antihypertensives on interindividual blood pressure variability: A systematic review. Stroke. 2011;42:2860–2865 doi: 10.1161/STROKEAHA.110.611566. Epub 2011 Aug 4. [DOI] [PubMed] [Google Scholar]
- 31.Shimbo D, Barrett Bowling C, Levitan EB, Deng L, Sim JJ, Huang L, Reynolds K, Muntner P. Short-term risk of serious fall injuries in older adults initiating and intensifying treatment with antihypertensive medication. Circ Cardiovasc Qual Outcomes. 2016; 9:222–9. doi: 10.1161/CIRCOUTCOMES.115.002524. [DOI] [PMC free article] [PubMed] [Google Scholar]
- 32.Peters R, Beckett N, Burch L, de Vernejoul MC, Liu L, Duggan J, Swift C, Gil-Extremera B, Fletcher A, Bulpitt C. The effect of treatment based on a diuretic (indapamide) +/− ACE inhibitor (perindopril) on fractures in the Hypertension in the Very Elderly Trial (HYVET). Age and Ageing. 2010, 39:609–616. doi: 10.1093/ageing/afq071. [DOI] [PubMed] [Google Scholar]
- 33.Rivasi G, Rafanelli M, Mossello E, Brignole M, Ungar A. Drug-related orthostatic hypotension: Beyond anti-hypertensive medications. Drugs Aging. 2020; 37:725–738. doi: 10.1007/s40266-020-00796-5. [DOI] [PMC free article] [PubMed] [Google Scholar]
- 34.Deegan BM, Sorond FA, Galica A, Lipsitz LA, O’Laighin G, Serrador JM. Elderly women regulate brain blood flow better than men do. Stroke. 2011; 42:1988–93. doi: 10.1161/STROKEAHA.110.605618. [DOI] [PMC free article] [PubMed] [Google Scholar]
- 35.Kronish IM, Lynch AI, Oparil S, Whittle J, Davis BR, Simpson LM, Krousel-Wood M, Cushman WC, Chang TI, Muntner P. The association between antihypertensive medication nonadherence and visit-to-visit variability of blood pressure: Findings from the Antihypertensive and Lipid-Lowering Treatment to Prevent Heart Attack Trial. Hypertension. 2016; 68:39–45. doi: 10.1161/HYPERTENSIONAHA.115.06960. [DOI] [PMC free article] [PubMed] [Google Scholar]
- 36.Berry SD, Quach L, Procter-Gray E, Kiel DP, Li W, Samelson EJ, Lipsitz LA, Kelsey JL. Poor adherence to medications may be associated with falls. J Gerontol A Biol Sci Med Sci. 2010; 65(5):553–8. doi: 10.1093/gerona/glq027. [DOI] [PMC free article] [PubMed] [Google Scholar]
- 37.Dillon P, Smith SM, Gallagher PJ, Cousins G. Association between gaps in antihypertensive medication adherence and injurious falls in older community-dwelling adults: A prospective cohort study. BMJ Open 2019; 9:e022927. doi: 10.1136/bmjopen-2018-022927 [DOI] [PMC free article] [PubMed] [Google Scholar]
- 38.de Vries M, Seppala LJ, Daams JG, van de Glind EMM, Masud T, van der Velde N. Fall-risk-increasing drugs: A systematic review and meta-analysis: I. Cardiovascular drugs. J Am Med Dir Assoc. 2018;19(4):371.e1–371.e9. doi: 10.1016/j.jamda.2017.12.013. [DOI] [PubMed] [Google Scholar]
- 39.Kahlaee HR, Latt MD, Schneider CR. Association between chronic or acute use of antihypertensive class of medications and falls in older adults. A systematic review and meta-analysis. Am J Hypertens. 2018. Mar 10;31(4):467–479. doi: 10.1093/ajh/hpx189. [DOI] [PubMed] [Google Scholar]
- 40.Ang HT, Lim KK, Kwan YH, Tan PS, Yap KZ, Banu Z, Tan CS, Fong W, Thumboo J, Ostbye T, et al. ; A systematic review and meta-analyses of the association between anti-hypertensive classes and the risk of falls among older adults. Drugs & aging. 2018;35:625–635. doi: 10.1007/s40266-018-0561-3. [DOI] [PubMed] [Google Scholar]
- 41.Juraschek SP, Simpson LM, Davis BR, Beach JL, Ishak A, Mukamal KJ. Effects of antihypertensive class on falls, syncope, and orthostatic hypotension in older adults: The allhat trial. Hypertension. 2019. Oct;74(4):1033–1040. doi: 10.1161/HYPERTENSIONAHA.119.13445. [DOI] [PMC free article] [PubMed] [Google Scholar]
- 42.Ham AC, van Dijk SC, Swart KMA, Enneman AW, van der Zwaluw NL, Brouwer-Brolsma EM, van Schoor NM, Zillikens MC, Lips P, de Groot LCPGM, et al. Beta-blocker use and fall risk in older individuals: Original results from two studies with meta-analysis. Br J Clin Pharmacol. 2017; 83(10):2292–2302. doi: 10.1111/bcp.13328. [DOI] [PMC free article] [PubMed] [Google Scholar]
- 43.Canney M, O’Connell MD, Murphy CM, O’Leary N, Little MA, O’Seaghdha CM, Kenny RA. Single Agent Antihypertensive Therapy and Orthostatic Blood Pressure Behaviour in Older Adults Using Beat-to-Beat Measurements: The Irish Longitudinal Study on Ageing. PLoS One. 2016; 11(1):e0146156. doi: 10.1371/journal.pone.0146156. [DOI] [PMC free article] [PubMed] [Google Scholar]
- 44.Judd E, Calhoun DA. Hypertension and orthostatic hypotension in older patients. J Hypertens. 2012; 30:38–39. doi: 10.1097/HJH.0b013e32834ed663 [DOI] [PMC free article] [PubMed] [Google Scholar]
- 45.Mol A, Bui Hoang PTS, Sharmin S, Reijnierse EM, van Wezel RJA, Meskers CGM, Maier AB. Orthostatic hypotension and falls in older adults: A systematic review and meta-analysis. J Am Med Dir Assoc. 2019; 20:589–597.e5. doi: 10.1016/j.jamda.2018.11.003. [DOI] [PubMed] [Google Scholar]
- 46.Bakris G, Ali W, Parati G. ACC/AHA versus ESC/ESH on hypertension guidelines: JACC guideline comparison. J Am Coll Cardiol. 2019; 73:3018–3026. doi: 10.1016/j.jacc.2019.03.507. [DOI] [PubMed] [Google Scholar]
- 47.Shaw BH, Borrel D, Sabbaghan K, Kum C, Yang Y, Robinovitch SN, Claydon VE. Relationships between orthostatic hypotension, frailty, falling and mortality in elderly care home residents. BMC geriatrics. 2019;19:80. doi: 10.1186/s12877-019-1082-6. [DOI] [PMC free article] [PubMed] [Google Scholar]
Associated Data
This section collects any data citations, data availability statements, or supplementary materials included in this article.