

Abstract
Background
Dietary fibre may reduce the risk of allergy. Our aim was to investigate the association between fibre intake in childhood, asthma, allergic rhinitis and IgE sensitization up to adulthood.
Methods
The individual fibre intake of 2285 participants from the Swedish population‐based birth cohort BAMSE was estimated between 98‐ and 107‐item food frequency questionnaires at ages 8 and 16 years, respectively. At 8, 16 and 24 years, asthma and allergic rhinitis symptoms were assessed by questionnaires, and sensitization to common allergens by serum IgE. Longitudinal associations were analysed by generalized estimating equations, adjusting for potential confounders.
Results
An inverse overall association was indicated between fibre intake at 8 years and allergic rhinitis symptoms up to 24 years (OR per 5 g/d 0.86; 95% CI 0.77–0.96), particularly in combination with airborne (0.74; 0.62–0.89) and food (0.69; 0.54–0.88) allergen sensitization. Higher fibre intake was also associated with specific allergen sensitization, for example, birch (0.77; 0.67–0.88) and soy (0.68; 0.53–0.87). No association was observed with asthma. Regarding sources, fruit (0.79; 0.67–0.94) and other (potatoes, chips/popcorn, legumes, and nuts, 0.71; 0.50–0.99), but not cereal or vegetable fibre were associated with allergic rhinitis. In additional analyses, including long‐term fibre intake at 8 and 16 years, excluding participants with food‐related allergic symptoms to examine reverse causation, as well as adjusting for antioxidant intake, associations were attenuated and became non‐significant.
Conclusion
Higher fibre intake in mid‐childhood may be inversely associated with allergic rhinitis and sensitization to specific allergens up to adulthood. However, avoidance of food triggers of allergic symptoms in allergic rhinitis patients may contribute to the protective associations.
Keywords: allergic rhinitis, asthma, cohort, dietary fibre, sensitization
1. INTRODUCTION
Epidemiological studies have shown that a high intake of dietary fibre is associated with a reduced risk of several chronic diseases, such as cardiovascular diseases, type 2 diabetes and cancer. 1 , 2 , 3 , 4 Fibre‐rich foods, including grains, fruits, vegetables and nuts, may also influence the development of allergic diseases, for example, by modulating the gut immunologic response, through the anti‐inflammatory effects of whole grains, and increased bio‐accessibility of antioxidants. 5 , 6 , 7 In this respect, dietary fibre has been described to stimulate the growth of beneficial bacterial species and enhance the bacterial synthesis of immune‐modulating compounds, such as short chain fatty acids (SCFAs), that contribute to a healthy colonic microbiota ecosystem. 8
However, a recent systematic review has shown that the epidemiological evidence for an association between fibre intake, asthma and allergic rhinitis is limited and inconclusive. 9 Moreover, most of the results come from cross‐sectional studies in adult populations, while studies in children are scarce. 10 In the aforementioned systematic review, two cross‐sectional studies on asthma among children were identified with inconsistent findings; one study from the US National Health and Nutrition Survey (NHANES) reporting inverse associations between fibre intake and asthma among children aged 2–11 years, 11 and one Australian study reporting no association between fibre intake and self‐reported wheeze among adolescents. 12 To our knowledge, there are no prospective studies on fibre intake in childhood or adolescence and subsequent development of allergic diseases.
Therefore, our aim was to investigate the association between dietary fibre intake in childhood and asthma, allergic rhinitis and IgE sensitization up to young adulthood, using repeated assessments in a prospective cohort study.
2. METHODS
2.1. Study design
The study was conducted within the prospective birth cohort BAMSE. 13 In the BAMSE study, 4089 infants aged on average 2 months from predefined areas of Stockholm, Sweden were recruited (1994–1996). The children were subsequently followed with repeated questionnaires on lifestyle factors, selected exposures, and symptoms of allergic diseases up to age 24 years. At ages 4, 8, 16 and 24 years, participants were invited to clinical examinations, which included blood sampling using standardized methods. Sera have been analysed for specific IgE to common airborne (Phadiatop®) and food allergens (fx5®), using the ImmunoCAP System (Thermo Fisher Scientific, Uppsala, SE). 14 In total, 3064 (75% of original cohort) young adults answered the questionnaire and 2234 (55%) provided blood samples at the 24‐year follow‐up. The study was approved by the Ethics Committee of Karolinska Institutet, Stockholm, Sweden (approval number 2016/1380‐31/2), and written informed consent was obtained.
2.2. Dietary fibre intake assessment
Diet at age 8 years was assessed using a food frequency questionnaire (FFQ) including 98 foods and beverages frequently consumed in Sweden, answered by a parent (57%), a parent together with the child (40%), or by another person (e.g., a grandparent). Participants were asked how often, on average, they had consumed each type of food or beverage during the past 12 months using 10 pre‐specified response categories ranging from “never” to “≥ three times/day” (FFQ in the Online Appendix). 15 At age 16 years, the adolescents themselves answered a web‐based FFQ (TeenMeal‐Q) including 107 food items, which was designed for this age group. 16 Similar FFQs as the ones used at 8 and 16 years have been validated in adults and have shown good validity with correlation coefficients for fibre intake of 0.71 and 0.65, respectively. 17 , 18 , 19
For each FFQ, the frequency of consumption of the food items was converted into average daily consumption. The individual fibre intake was assessed by multiplying the frequency of consumption of each food item by its fibre content per serving, using composition values obtained from the Swedish Food Composition Database and summarized over foods and beverages. 20 Total energy intake was summarized over the whole diet and calculated using food composition data from the Swedish Food Agency. 20 Fibre intake was adjusted for energy intake using the residuals method and is presented per mean total energy intake (1900 kcal/day). 21 Food items used in the calculation of fibre intake at 8 years are presented in Table S1 in the supplement.
2.3. Assessment of outcomes
Asthma and symptoms of allergic rhinitis (AR) were assessed based on questionnaires (parental reports at 8 years and self‐reports at 16 and 24 years). Participants were considered to have asthma if they had at least two of the following three criteria: ever doctor's diagnosis of asthma, at least one episode of wheeze and/or breathing difficulties, and/or asthma medication use in the last 12 months. 22 AR symptoms were defined as symptoms from eyes or nose after exposure to furred pets or pollen (without having a flu) in the last 12 months. 22 Sensitization to airborne allergens was defined as a positive Phadiatop®, and sensitization to food allergens as a positive fx5® result (IgE ≥ 0.35 kUA/l). 13 Sera that scored positive for a mix were further analysed for the single allergens included in the mix (Phadiatop®: birch, timothy, mugwort, cat, dog, horse, house dust mite, mold; fx5®: milk, egg, soy, peanut, cod fish, wheat), as previously described. 13 Sensitization to single allergens was defined as IgE ≥ 0.35 kUA/l. All samples were analysed at the Department of Clinical Immunology, Karolinska University Hospital Solna, Stockholm, Sweden.
To elucidate associations with asthma and symptoms of AR in combination with IgE sensitization, categorical variables were created. Participants were categorized as no asthma and no sensitization, no asthma but sensitization, no sensitization but asthma, asthma and sensitization, and corresponding categories were created for AR.
Prevalence refers to the total number of participants with the outcome at a specific follow‐up. Incidence refers to the number of participants with the outcome at a specific follow‐up, without fulfilling the definition of the outcome at the previous follow‐up.
2.4. Statistical analyses
Spearman rank correlation was used to describe the correlation between energy‐adjusted total and specific fibre intake at 8 years, as well as between energy‐adjusted total intakes at 8 and 16 years. Differences in selected characteristics of study participants were analyzed in relation to average fibre intake at 8 and 16 years by chi 2 and t‐test, as appropriate.
Associations between total fibre intake at 8 years, as well as fibre sources, and asthma, AR symptoms and IgE sensitization to airborne and food allergens up to 24 years were analyzed by generalized estimating equations (GEE) with a binomial family, a logit link function, and an unstructured correlation matrix. Prevalence and incidence of outcomes were examined in separate models. GEE models take the correlation between repeated measurements on the same individual into account. “Overall associations” combine a within‐subject relationship with a between‐subjects relationship, resulting in one single regression coefficient, while an interaction between time and exposure is used to estimate “age‐specific associations”. 23 Analyses were stratified by sex and tested for interaction. Associations were presented per 5 g/day increments. For comparison, an ordinary sized apple or orange contains 3–3.5 g of fibre. Linear associations were tested by the Wald test. Associations for which there was evidence of non‐linearity were further flexibly modelled using restricted cubic splines with three knots.
Associations between fibre intake, asthma and symptoms of AR in combination with IgE sensitization were analyzed using multinomial GEE.
To use the repeated exposure assessment, associations with long‐term fibre intake as an updated lagged exposure were analyzed by GEE, that is, fibre at 8 years was modelled against outcomes at 8 and 16 years and fibre at 16 years was modelled against outcomes at 24 years 24
We identified potential confounding factors from previous literature and then refined our selection by using a directed acyclic graph (DAG) approach (Figure S1). 25 , 26 In the multivariable model, we adjusted for sex, total energy intake (kcal/day) at 8 years, parental education (elementary school, high school, university), parental ethnicity (born in or outside of Scandinavia), parental history of atopic disease (yes/no) and maternal smoking in pregnancy and/or infancy (yes/no). The covariates described in the supplement were tested but did not affect the estimates. Fibre sources were mutually adjusted by inclusion in the same model.
Associations were further tested after exclusion of participants with reported allergic symptoms related to fruits or vegetables, and/or avoidance of any of these due to allergic symptoms, to investigate potential disease‐related modification of exposure, 27 and after adjustment for dietary total antioxidant capacity (TAC, described in the supplement), to investigate confounding by antioxidants. 16
Participants with baseline questionnaire data, data on fibre intake at ages 8 and 16 years with a mean energy intake within ±3 log SD and completed questionnaires at 8, 16 and/or 24 years were included in the study population (n = 2285); participants with available specific IgE to common allergens at 8, 16 and/or 24 years were included in sensitization analyses (n = 2026). The flow chart of the study is shown in Figure S2. For statistical analyses, STATA V.16 (StataCorp TX, USA) and R V.4.1.2 (R Core Team, 2021) were used.
3. RESULTS
The study population (n = 2285) was generally comparable to the original cohort (n = 4089) with regards to distribution of selected characteristics (Table S2).
The median energy‐adjusted total fibre intake at age 8 years was 18.0 g/day (females 18.3 vs. males 17.6, p < 0.001), and at 16 years 17.1 g/day (females 18.2 vs. males 16.3, p < 0.001). The Spearman correlation coefficients between total energy‐adjusted fibre and cereal, fruit, vegetable and other (including potatoes, chips/popcorn, legumes, and nuts) fibre at 8 years were 0.44, 0.64, 0.53 and 0.19, respectively. The correlation between total intakes at 8 and 16 years was 0.21 (p < 0.001). Cereal, fruit, vegetable and other sources contributed 40%, 24%, 12% and 16% of the total at 8 years, and 43%, 11%, 13% and 21% of the total at 16 years, respectively.
Participants with high fibre intake (≥median) at ages 8 and 16 years were more likely females and had higher socioeconomic status (in terms of living area at birth, parental work and education, maternal age, smoking during pregnancy and/or infancy) compared to those with low intake (Table 1). Additionally, they had a lower energy intake but were more likely overweight or obese at 8 years, had a high level of physical activity and were less likely to smoke at 16 years (all p < 0.05).
TABLE 1.
Distribution of demographic and lifestyle characteristics of study participants (n = 2285) by average fibre intake at ages 8 and 16 years
| Average fibre intake at 8 and 16 years | |||
|---|---|---|---|
| <17.7 g/d | ≥17.7 g/d | ||
| N = 1142 | N = 1143 | ||
| n (%) | n (%) | p value a | |
| Male sex | 664 (58.1) | 480 (42.0) | <0.001 |
| Living area at birth b | |||
| Urban | 327 (28.7) | 396 (34.9) | |
| Suburban | 811 (71.3) | 738 (65.1) | 0.002 |
| Maternal age <26 years | 93 (8.1) | 64 (5.6) | 0.016 |
| Parental allergic disease | 372 (32.7) | 339 (30.0) | 0.163 |
| Parent white collar worker | 948 (83.8) | 983 (87.1) | 0.029 |
| Parent with university education | 572 (50.1) | 682 (59.7) | <0.001 |
| Parent born out of Scandinavia | 159 (14.0) | 192 (16.9) | 0.053 |
| Maternal smoking in pregnancy and/or infancy | 167 (14.6) | 119 (10.4) | 0.002 |
| Breastfeeding ≥4 m | 894 (79.7) | 924 (82.3) | 0.116 |
| Older siblings | 553 (48.4) | 519 (45.4) | 0.148 |
| Day nursery at age 2 years | 818 (72.8) | 845 (75.0) | 0.248 |
| 8 years | |||
| Overweight or obesity | 199 (17.4) | 258 (22.6) | 0.002 |
| Physical activity >2 times/w | 185 (16.2) | 162 (14.2) | 0.180 |
| Allergy to fruits and vegetables c | 115 (10.9) | 111 (10.6) | 0.825 |
| Use of multivitamins | 476 (42.2) | 482 (42.8) | 0.798 |
| Energy intake, Kcal/d, mean (SD) | 1927 (460) | 1889 (462) | 0.049 |
| 16 years | |||
| Overweight or obesity | 181 (17.7) | 155 (14.9) | 0.081 |
| High physical activity d | 716 (66.7) | 762 (69.8) | 0.003 |
| Allergy to fruits and vegetables c | 140 (15.7) | 173 (19.1) | 0.053 |
| Smoking | 143 (12.5) | 110 (9.6) | 0.027 |
| Energy intake, Kcal/d, mean (SD) | 1934 (777) | 1905 (755) | 0.370 |
| 24 years | |||
| Overweight or obesity | 196 (24.8) | 171 (21.4) | 0.101 |
| High physical activity d | 445 (56.7) | 480 (58.4) | 0.196 |
| Smoking | 214 (21.5) | 186 (18.7) | 0.115 |
p‐values were calculated with the chi 2 test for categorical variables and t‐test for continuous variables.
Urban: central parts of Stockholm (Norrmalm); suburban: northwestern parts of Stockholm (municipalities Järfälla, Solna or Sundbyberg).
Allergic symptoms related to fruits and/or vegetables, or avoidance of any fruit or vegetable due to allergic symptoms.
Levels of physical activity according to IPAQ guidelines: High: ≥7 h/week of moderate to vigorous activity or ≥3.5 h/week of vigorous activity.
The prevalence of asthma increased between the ages of 8 (10.8%) and 16 years (14.8%), and the rate was not much different at age 24 years (14.6%). There was also a rise in the prevalence of AR, and this trend continued throughout the study (14.2% at 8, 25.5% at 16, 30.9% at 24 years). The prevalence of airborne allergen sensitization increased from 8 (26.2%) to 16 years (44.6%) and remained relatively stable at 24 years (44.9%), while food allergen sensitization prevalence decreased (20.3% at 8, 13.7% at 16, 10.4% at 24 years; Table S3). Prevalence of single allergen sensitization is shown in Table S4. Among participants with asthma at ages 8, 16 and 24 years, 60.9%, 72.5% and 76.3% were sensitized to airborne, and 43.6%, 28.5% and 27.2% to food allergens, while among those with AR symptoms at respective ages, 86.0%, 89.0% and 81.0% were sensitized to airborne, and 45.8%, 27.4% and 18.5% to food allergens, respectively.
3.1. Associations between fibre intake at 8 years and asthma, AR symptoms and IgE sensitization up to 24 years
A higher fibre intake at 8 years was associated with reduced odds of prevalent AR symptoms up to 24 years (OR per 5 g/d 0.86; 95% CI 0.77–0.96; Table 2). In contrast, no association was observed with asthma. Regarding fibre sources, higher fruit and other fibre intakes were inversely associated with AR symptoms up to 24 years (OR 0.79; 95% CI 0.67–0.94 and OR 0.71; 95% CI 0.50–0.99, respectively), while no association was observed with cereal or vegetable fibre intakes (Table 2). No interaction between fibre intake and gender regarding the association with the outcomes was observed (data not shown).
TABLE 2.
Overall associations between fibre intake at age 8 years, asthma, allergic rhinitis symptoms and IgE sensitization from 8 up to 24 years
| Fibre intake at 8 years OR per 5 g/day (95% CI) | ||
|---|---|---|
| Prevalence | Incidence | |
| Asthma | ||
| Total fibre | 0.94 (0.82–1.08) | 0.97 (0.82–1.15) |
| Cereal fibre | 1.02 (0.82–1.26) | 1.24 (0.95–1.62) |
| Fruit fibre | 0.85 (0.68–1.05) | 0.86 (0.66–1.12) |
| Vegetable fibre | 1.03 (0.72–1.47) | 0.83 (0.52–1.30) |
| Other fibre | 1.20 (0.80–1.79) | 1.40 (0.85–2.30) |
| Allergic rhinitis symptoms | ||
| Total fibre | 0.86 (0.77–0.96) | 0.98 (0.86–1.11) |
| Cereal fibre | 0.93 (0.77–1.11) | 0.90 (0.73–1.11) |
| Fruit fibre | 0.79 (0.67–0.94) | 0.98 (0.81–1.17) |
| Vegetable fibre | 1.03 (0.77–1.38) | 1.09 (0.79–1.51) |
| Other fibre | 0.71 (0.50–0.99) | 0.80 (0.54–1.18) |
| Sensitization to airborne allergens | ||
| Total fibre | 0.93 (0.83–1.04) | 0.91 (0.79–1.06) |
| Cereal fibre | 0.89 (0.74–1.07) | 0.82 (0.64–1.04) |
| Fruit fibre | 0.93 (0.79–1.10) | 0.98 (0.78–1.23) |
| Vegetable fibre | 1.00 (0.75–1.35) | 0.99 (0.67–1.46) |
| Other fibre | 0.93 (0.65–1.31) | 0.87 (0.54–1.41) |
| Sensitization to food allergens | ||
| Total fibre | 0.91 (0.79–1.04) | 0.83 (0.63–1.09) |
| Cereal fibre | 1.08 (0.87–1.35) | 0.87 (0.56–1.36) |
| Fruit fibre | 0.89 (0.72–1.09) | 0.81 (0.53–1.24) |
| Vegetable fibre | 0.72 (0.50–1.05) | 0.94 (0.46–1.90) |
| Other fibre | 0.96 (0.63–1.47) | 0.43 (0.17–1.07) |
Note: Generalized estimating equations (GEE) models adjusted for sex, total energy intake, parental education, ethnicity, history of atopic disease, and smoking in pregnancy and/or infancy. OR (95% CI): odds ratio (95% confidence interval).
In age‐specific analyses, we observed inverse associations between a higher total fibre intake at 8 years and AR symptoms at 8 years (OR 0.76; 95% CI 0.65–0.89), a higher fruit fibre intake and AR symptoms at 8 (OR 0.66; 95% CI 0.50–0.86) and 16 years (OR 0.77; 95% CI 0.64–0.94), and the observed ORs moved towards unity with increasing age. In contrast, the association between other fibre intake and AR symptoms was significant at 24 years (OR 0.64; 95% CI 0.43–0.97; Table S5).
In an analysis of single allergens, a higher fibre intake at 8 years was inversely associated with sensitisation to a number of allergens, including birch, mugwort, horse, soy, and peanut up to the age of 24 years (Table 3). For birch and soy, there were also comparable associations at 16 and 24 years (Table S6).
TABLE 3.
Overall associations between fibre intake at age 8 years and IgE sensitization to specific airborne and food allergens from 8 up to 24 years
| Fibre intake at 8 years | |
|---|---|
| OR per 5 g/day (95% CI) | |
| Sensitization to airborne allergens | |
| Birch | 0.77 (0.67–0.88) |
| Timothy | 0.96 (0.84–1.09) |
| Mugwort | 0.78 (0.66–0.93) |
| Cat | 0.92 (0.79–1.06) |
| Dog | 0.90 (0.78–1.03) |
| Horse | 0.77 (0.64–0.93) |
| Mite | 1.05 (0.90–1.24) |
| Mold | 0.76 (0.52–1.11) |
| Sensitization to food allergens | |
| Milk | 1.01 (0.84–1.21) |
| Egg | 0.93 (0.74–1.17) |
| Soy | 0.68 (0.53–0.87) |
| Peanut | 0.74 (0.60–0.91) |
| Fish | 1.43 (0.71–2.89) |
| Wheat | 0.80 (0.65–1.00) |
Note: Generalized estimating equations (GEE) models adjusted for sex, total energy intake, parental education, ethnicity, history of atopic disease, and smoking in pregnancy and/or infancy. OR (95% CI): odds ratio (95% confidence interval).
Evidence for non‐linearity (p < 0.05) was observed for the association between fibre intake, AR symptoms and IgE sensitization, and the shape of the associations was explored using restricted cubic splines (Figure S3). Upon visual inspection of the splines, we did not observe considerable deviation from linearity, and therefore associations were assumed to be linear.
3.2. Associations between fibre intake at 8 years, asthma and AR symptoms in combination with IgE sensitization up to 24 years
An inverse association with total fibre intake at 8 years was observed among participants with AR who were sensitized to airborne (OR 0.74; 95% CI 0.62–0.89), and food allergens (OR 0.69; 95% CI 0.54–0.88) up to 24 years (Figure 1A).
FIGURE 1.
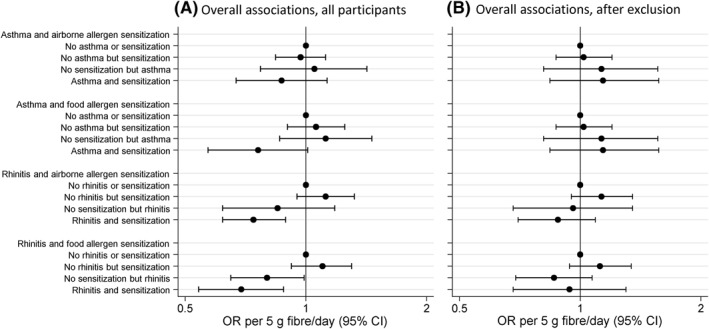
Overall associations between total fibre intake at 8 years, asthma and allergic rhinitis symptoms in combination with IgE sensitization from 8 up to 24 years, (A) all participants, (B) after exclusion of participants with food‐related allergic symptoms. Multinomial generalized estimating equations (GEE) analyses adjusted for sex, total energy intake, parental education, ethnicity, history of atopic disease, and smoking in pregnancy and/or infancy. OR (95% CI): odds ratio (95% confidence interval)
3.3. Associations between long‐term fibre intake and asthma, AR symptoms and IgE sensitization up to 24 years
The updated lagged exposure model showed non‐significant overall tendencies consistent with the 8‐year fibre model (Table 4). In single allergen sensitization analyses, a similar pattern to the 8‐year model was observed, but with no significant associations at age 24 years (Table S7).
TABLE 4.
Longitudinal overall associations between long‐term fibre at 8 and 16 years, asthma, allergic rhinitis symptoms and IgE sensitization from 8 up to 24 years
| Long‐term fibre intake at 8 and 16 years | |
|---|---|
| OR per 5 g/day (95% CI) | |
| Asthma | |
| Prevalence | 0.99 (0.92–1.08) |
| Incidence | 0.90 (0.77–1.04) |
| Allergic rhinitis symptoms | |
| Prevalence | 0.96 (0.90–1.03) |
| Incidence | 0.99 (0.89–1.10) |
| Sensitization to airborne allergens | |
| Prevalence | 0.95 (0.90–1.00) |
| Incidence | 0.90 (0.78–1.03) |
| Sensitization to food allergens | |
| Prevalence | 0.95 (0.87–1.04) |
| Incidence | 0.94 (0.74–1.20) |
Note: Generalized estimating equations (GEE) models adjusted for sex, total energy intake, parental education, ethnicity, history of atopic disease, and smoking in pregnancy and/or infancy. Total fibre intake at 8 years was modelled against outcomes at 8 and 16 years, and total fibre intake at 16 years was modelled against outcomes at 24 years, while total energy intake was handled similarly. OR (95% CI): odds ratio (95% confidence interval).
3.4. Sensitivity analyses
After exclusion of participants with allergy to fruits or vegetables, and/or avoidance of any of these due to allergic symptoms at 8 years (n = 226), the associations moved towards the null and became non‐significant (Table S8, Figure 1B).
Birch pollen‐sensitized children frequently develop hypersensitivity reactions to specific food items, which may lead to avoidance of these items. 28 In our study, after exclusion of birch pollen‐sensitized children at 8 years (n = 315, 16% of participants) who reported food‐related allergic symptoms (n = 111), associations disappeared (data not shown).
Nevertheless, when we tested the associations with single allergens included in Phadiatop® and fx5® after exclusion of participants with food‐related allergic symptoms, the association between total fibre intake at 8 years, birch (OR 0.86; 95% CI 0.74–1.00) and soy (OR 0.73; 95% CI 0.54–0.99) allergen sensitization up to 24 years remained (Table S9).
Adjustment of analyses with dietary TAC at 8 years attenuated the associations, which became non‐significant, for example, total fibre intake at 8 years and AR symptoms up to 24 years OR 0.92; 95% CI 0.79–1.08.
4. DISCUSSION
In our study of 2285 young adults from the population‐based birth cohort BAMSE, higher dietary fibre intake at 8 years was associated with reduced odds of AR up to 24 years. Additionally, a higher total fibre intake was associated with reduced odds of sensitization to specific airborne and food allergens, for example, birch and soy. No consistent association with asthma was observed. After exclusion of participants with food‐related allergic symptoms, associations became non‐significant, indicating that disease‐related modification of consumption may have contributed to the results; the inverse association with birch and soy allergen sensitization though remained.
To the best of our knowledge, our study is the first to examine the association between fibre intake, asthma, AR and IgE sensitization from childhood up to adulthood. Moreover, we examined disease‐related modification of exposure, which constitutes an important methodological challenge in studies of diet and allergy. 15 Children may avoid foods or eat them less often if they induce immediate symptoms, which might result in an apparent protective association of these foods with allergic disease. Pollen‐food allergy syndrome, caused by IgE directed at cross‐reacting allergens found in pollens and plant foods, such as fruits, vegetables and nuts, often coexists with AR symptoms. 29 The pattern of cross‐reactivity differs between countries. 30 In Sweden, the most common cross‐reactivity is found between birch tree pollen and apple, stone fruit, and carrot. 31 In our study, 35% of birch pollen‐sensitized children reported food‐related allergic symptoms, and by excluding these, the protective association between fibre intake and AR symptoms disappeared. Although disease‐related modification of exposure is likely to be a greater problem in cross‐sectional studies, it may also be of importance in prospective studies. In our study, the fact that an association was observed with prevalent, but not incident, AR may further indicate this.
Epidemiological studies have reported inverse associations between fibre intake and asthma among adults. In the US NHANES population, a low fibre diet was associated with increased odds of wheeze, 32 and in the Korean NHANES population a higher fibre intake was associated with reduced odds of asthma. 33 Fewer asthma symptoms and greater asthma control among adults with higher dietary fibre intake were observed in cross‐sectional analyses of a large French cohort. 34 Epidemiological evidence on the protective role of fibre on allergic asthma development is reinforced by animal studies, as well as clinical studies of fibre supplementation. 35 In a mouse model, a high‐fibre diet led to a marked suppression of allergic airways disease, which was also transmitted to the offspring generation. 36 Additionally, epidemiological studies on diets rich in fruits and vegetables have reported inverse associations with asthma. 37 However, these studies have not focused on fibre per se, and thus the beneficial effect might have been attributed to other constituents of the diet with anti‐inflammatory or antioxidant properties. In our study, we did not observe a significant association between fibre intake and asthma, while adjustment by dietary TAC indicated that antioxidants, or a better diet quality in general, might have contributed to the results.
Although few studies have examined dietary fibre in relation to AR or IgE sensitization, a high adherence to the Mediterranean diet has been associated with protection against AR among children in a cross‐sectional study from Greece. 38 In adults, a cross‐sectional study in the Korean NHANES population reported lower prevalence of AR symptoms, such as watery rhinorrhoea, and dog allergen sensitization among males with higher fibre intake, but not among females, 33 while a cross‐sectional study of women from the Osaka Maternal and Child Health Study reported no association between fibre intake and AR. 39 Very few publications describe fibre sources as compared with total fibre intake, in which stronger associations between grains and some health outcomes have been described. 40 , 41 In our study, total, fruit, and other fibre intake were inversely associated with AR symptoms, while no association was observed with cereal or vegetable fibre intake. Gender‐specific associations between fibre intake and health outcomes have also been reported. 42 In our study, total fibre intake was higher among females, but no effect modification by gender was observed. Associations were attenuated when we evaluated long‐term fibre intake instead of fibre intake at 8 years, which could be attributed to the different exposure window or the different FFQ design at 16 years.
An association between fibre intake, AR, and IgE sensitization to specific allergens is biologically plausible. High dietary fibre has been associated with lower concentration of systemic inflammation markers, such as CRP and IL‐6. 43 , 44 A plant‐based, high fibre diet has been shown to promote the growth of beneficial bacterial species in the gut, leading to increased local and systemic levels of SCFAs, which can influence inflammatory responses and epigenetically modify DNA. 5 , 45 Upper and lower airways share common pathological mechanisms, and a high fibre intake in a murine model attenuated allergic symptoms of nasal rubbing and sneezing. 46 Further research is needed on the interplay between airway and gut microbiota, and the mechanisms of potentially differential effects of dietary fibre on specific allergens. 47 , 48
Major strengths of our study include the population‐based prospective longitudinal design, long follow‐up time with limited loss to follow‐up. Repeated data on exposure and outcomes made it possible to study prevalence and incidence of outcomes and account for disease‐related modification of exposure, while the longitudinal analysis made it possible to study both overall, taking into account the correlation between repeated assessments on the same individual into account, and age‐specific associations. Additionally, we were able to explore the association with IgE sensitization to specific airborne and food allergens. The individual fibre intake was calculated using information from validated FFQs and our results are in line with other Swedish studies. 49 , 50 The recommended daily intake of dietary fibre is 10–40 g for children and adolescents, depending on age, sex and energy intake. 40 , 51 In Sweden, the recommended intake is 2–3 g/MJ, with an increasing intake from school age up to adolescence. 52 Although absolute intake may not be accurately estimated by FFQs, and different FFQ designs were used at 8 and 16 years, it is still possible to rank the participants according to their intake, while repeated dietary assessment may better capture long‐term intake and reduce exposure misclassification. 53 We were also able to consider many confounders, using a DAG approach. Despite this, residual confounding cannot be completely ruled out.
Regarding limitations, selection bias should not be an important problem, as there were small differences in the distribution of characteristics of the study population compared to the total cohort. Although asthma and symptoms of AR were assessed through questionnaires, which could lead to some misclassification, probably non‐differential with regards to fibre intake, well‐established definitions (MeDALL) were used. In addition, most children in the study also provided a blood sample for IgE analyses at age 4 years and parents were informed about the results. Thus, the possibility that this knowledge influenced subsequent food choices cannot be excluded.
In conclusion, in this prospective cohort we observed that a higher fibre intake in mid‐childhood was associated with reduced odds of AR and sensitization to specific airborne and food allergens up to adulthood, although avoidance of food triggers of allergic symptoms in allergic rhinitis patients may contribute to the protective associations. Therefore, further studies on childhood dietary fibre intake in relation to subsequent allergic disease are needed, taking disease‐related exposure modification into account. Furthermore, since the prevalence of pollen‐food allergy syndrome is expected to rise, 28 increased awareness is required among clinicians and patients, so that excluded foods are replaced with tolerated ones, and thus the recommended dietary fibre intake can be attained.
AUTHOR CONTRIBUTIONS
Emmanouela Sdona: Conceptualization (Equal); Formal analysis (Lead); Methodology (Lead); Project administration (Lead); Visualization (Lead); Writing – original draft (Lead). Sandra Ekstrom: Validation (Equal); Writing – review & editing (Equal). Niklas Andersson: Software (Equal); Visualization (Equal); Writing – review & editing (Equal). Niclas Hakansson: Software (Equal); Writing – review & editing (Equal). Alicja Wolk: Writing – review & editing (Equal); Marit Westman: Writing – review & editing (Equal). Marianne van Hage: Formal analysis (Equal); Writing – review & editing (Equal). Inger Kull: Data curation (Equal); Writing – review & editing (Equal). Erik Melen: Data curation (Equal); Writing – review & editing (Equal). Anna Bergstrom: Conceptualization (Equal); Data curation (Equal); Funding acquisition (Lead); Investigation (Lead); Resources (Lead); Supervision (Lead). Writing – review & editing (Equal).
CONFLICT OF INTEREST
The authors have no conflicts of interest to disclose.
Supporting information
Supplementary Material 1
Supplementary Material 2
ACKNOWLEDGMENTS
We would like to thank all participants in the BAMSE cohort and all staff involved in the study through the years. We would also like to thank Simon Kebede Merid for providing excellent statistical support. This study was supported by grants from the Swedish Research Council (grant agreement 2018‐02524), the Swedish Research Council for Health, Working Life and Welfare (grant agreement 2017‐00526), Formas (grant agreement 2016‐01646), the Swedish Heart‐Lung Foundation, the Swedish Asthma and Allergy research foundation, the Cancer and Allergy Foundation, the Hesselman Foundation the King Gustaf V 80th Birthday Foundation the European Research Council (TRIBAL, grant agreement 757919), the European Union's Horizon 2020(Imptox (RIA 965,173 [MvH]), and Region Stockholm (ALF project, and for cohort and database maintenance). Thermo Fisher Scientific kindly provided reagents for IgE analyses. None of the funding sources had a role in the study design, conduct, analysis, interpretation of data or reporting.
Sdona E, Ekström S, Andersson N, et al. Dietary fibre in relation to asthma, allergic rhinitis and sensitization from childhood up to adulthood. Clin Transl Allergy. 2022;e12188. 10.1002/clt2.12188
REFERENCES
- 1. Reynolds A, Mann J, Cummings J, Winter N, Mete E, Te Morenga L. Carbohydrate quality and human health: a series of systematic reviews and meta‐analyses. Lancet. 2019;393(10170):434‐445. [DOI] [PubMed] [Google Scholar]
- 2. Veronese N, Solmi M, Caruso M, et al. Dietary fiber and health outcomes: an umbrella review of systematic reviews and meta‐analyses. Am J Clin Nutr. 2018;107(3):436‐444. [DOI] [PubMed] [Google Scholar]
- 3. Park Y, Subar A, Hollenbeck A, Schatzkin A. Dietary fiber intake and mortality in the NIH‐AARP diet and health study. Arch Intern Med. 2011;171(12):1061‐1068. [DOI] [PMC free article] [PubMed] [Google Scholar]
- 4. Chuang S, Norat T, Murphy N, et al. Fiber intake and total and cause‐specific mortality in the European Prospective Investigation into Cancer and Nutrition cohort. Am J Clin Nutr. 2012;96(1):164‐174. [DOI] [PubMed] [Google Scholar]
- 5. McKenzie C, Tan J, Macia L, Mackay C. The nutrition‐gut microbiome‐physiology axis and allergic diseases. Immunol Rev. 2017;278(1):177‐295. [DOI] [PubMed] [Google Scholar]
- 6. Alwarith J, Kahleova H, Crosby L, et al. The role of nutrition in asthma prevention and treatment. Nutr Rev. 2020;78(11):928‐938. [DOI] [PMC free article] [PubMed] [Google Scholar]
- 7. Palafox‐Carlos H, Ayala‐Zavala J, González‐Aguilar G. The role of dietary fiber in the bioaccessibility and bioavailability of fruit and vegetable antioxidants. J Food Sci. 2011;76(1):R6‐R15. [DOI] [PMC free article] [PubMed] [Google Scholar]
- 8. Dreher M, Whole F, Fiber F. Emerging health effects. Nutrients. 2018;10(12):1833 [DOI] [PMC free article] [PubMed] [Google Scholar]
- 9. Sdona E, Georgakou A, Ekström S, Bergström A. Dietary fibre intake in relation to asthma, rhinitis and lung function impairment – a systematic review of observational studies. Nutrients. 2021;13(10):3594 [DOI] [PMC free article] [PubMed] [Google Scholar]
- 10. Reynolds A, Diep Pham H, Montez J, Mann J. Dietary fibre intake in childhood or adolescence and subsequent health outcomes: a systematic review of prospective observational studies. Diabetes Obes Metab. 2020;22(12):2460‐2467. [DOI] [PMC free article] [PubMed] [Google Scholar]
- 11. Vaccaro J, Niego J, Huffman F. Dietary factors, body weight, and screen time in U.S. children with and without asthma. Child Health Care. 2016;45(1):22‐38. [Google Scholar]
- 12. Wood L, Lagleva M, Shah S, et al. Dietary changes in migrant adolescents with increasing length of stay in Australia and associated risk of wheeze–a retrospective, cross sectional study. BMC Pediatr. 2015;15:102 [DOI] [PMC free article] [PubMed] [Google Scholar]
- 13. Melén E, Bergström A, Kull I, et al. Male sex is strongly associated with IgE‐sensitization to airborne but not food allergens: results up to age 24 years from the BAMSE birth cohort. Clin Transl Allergy. 2020;10:15. [DOI] [PMC free article] [PubMed] [Google Scholar]
- 14. Ballardini N, Bergström A, Kull I, et al. Resolved allergen‐specific IgE sensitization among females and early poly‐sensitization among males impact IgE sensitization up to age 24 years. Clin Exp Allergy. 2021;51(6):849‐852. [DOI] [PubMed] [Google Scholar]
- 15. Rosenlund H, Kull I, Pershagen G, Wolk A, Wickman M, Bergström A. Fruit and vegetable consumption in relation to allergy: disease‐related modification of consumption? J Allergy Clin Immunol. 2011;127(5):1219‐1225. [DOI] [PubMed] [Google Scholar]
- 16. Sdona E, Ekström S, Andersson N, et al. Fruit, vegetable and dietary antioxidant intake in school age, respiratory health up to young adulthood. Clin Exp All. 2022;52(1):104‐114. [DOI] [PubMed] [Google Scholar]
- 17. Messerer M, Johansson S, Wolk A. The validity of questionnaire‐based micronutrient intake estimates is increased by including dietary supplement use in Swedish men. J Nutr. 2004;134(7):1800‐1805. [DOI] [PubMed] [Google Scholar]
- 18. Christensen S, Möller E, Bonn S, et al. Two new meal‐ and web‐based interactive food frequency questionnaires: validation of energy and macronutrient intake. J Med Internet Res. 2013;15(6):e109. [DOI] [PMC free article] [PubMed] [Google Scholar]
- 19. Christensen S, Möller E, Bonn S, et al. Relative validity of micronutrient and fiber intake assessed with two new interactive meal‐ and web‐based food frequency questionnaires. J Med Internet Res. 2014;16(2):e59. [DOI] [PMC free article] [PubMed] [Google Scholar]
- 20. Bergström L, Kylberg E, Hagman U, Eriksson H, Bruce A. The food composition database KOST: the National Administration's information system for nutritive values of food. Vår Föda. 1991;43:439‐447. [Google Scholar]
- 21. Willett W, Howe G, Kushi L. Adjustment for total energy intake in epidemiologic studies. Am J Clin Nutr. 1997;65(4 Suppl l):1220S‐1228S. [DOI] [PubMed] [Google Scholar]
- 22. Pinart M, Benet M, Annesi‐Maesano I, et al. Comorbidity of eczema, rhinitis, and asthma in IgE‐sensitised and non‐IgE‐sensitised children in MeDALL: a population‐based cohort study. Lancet Respir Med. 2014;2(2):131‐140. [DOI] [PubMed] [Google Scholar]
- 23. Twisk JWR. Applied Longitudinal Data Analysis for Epidemiology: A Practical Guide. 2nd ed. Cambridge University Press; 2013:321. [Google Scholar]
- 24. Ekström S, Sdona E, Klevebro S, et al. Dietary and plasma levels of polyunsaturated fatty acids in childhood and adolescence in relation to asthma and lung function up to adulthood. Am J Clin Nutr. 2022;115(3):886‐896. [DOI] [PMC free article] [PubMed] [Google Scholar]
- 25. Nurmatov U, Nwaru B, Devereux G, Sheikh A. Confounding and effect modification in studies of diet and childhood asthma and allergies. Allergy. 2012;67(8):1041‐1059. [DOI] [PubMed] [Google Scholar]
- 26. Textor J, van der Zander B, Gilthorpe M, Liskiewicz M, Ellison G. Robust causal inference using directed acyclic graphs: the R package ‘dagitty’. Int J Epidemiol. 2016;45(6):1887‐1894. [DOI] [PubMed] [Google Scholar]
- 27. Rosenlund H, Magnusson J, Kull I, et al. Antioxidant intake and allergic disease in children. Clin Exp Allergy. 2012;42(10):1491‐1500. [DOI] [PubMed] [Google Scholar]
- 28. Biedermann T, Winther L, Till SJ, Panzner P, Knulst A, Valovirta E. Birch pollen allergy in Europe. Allergy. 2019;74(7):1237‐1248. [DOI] [PubMed] [Google Scholar]
- 29. Carlson G, Coop C. Pollen food allergy syndrome (PFAS): a review of current available literature. Ann Allergy Asthma Immunol. 2019;123(4):359‐365. [DOI] [PubMed] [Google Scholar]
- 30. Andersen M, Hall S, Dragsted L. Identification of European allergy patterns to the allergen families PR‐10, LTP, and profilin from Rosaceae fruits. Clin Rev Aller Immunol. 2011;41(1):4‐19. [DOI] [PubMed] [Google Scholar]
- 31. Eriksson N, Formgren H, Svenonius E. Food hypersensitivity in patients with pollen allergy. Allergy. 1982;37:437‐443. [DOI] [PubMed] [Google Scholar]
- 32. Saeed M, Gribben K, Alam M, Lyden E, Hanson C, LeVan T. Association of dietary fiber on asthma, respiratory symptoms and inflammation in the adult NHANES population. Ann Am Thorac Soc. 2020;17(9):1062‐1068. [DOI] [PubMed] [Google Scholar]
- 33. Lee H, Lee K, Son S, et al. Association of allergic diseases and related conditions with dietary fiber intake in Korean adults. Int J Environ Res Public Health. 2021;18(6):2889 [DOI] [PMC free article] [PubMed] [Google Scholar]
- 34. Andrianasolo R, Hercberg S, Kesse‐Guyot E, et al. Association between dietary fibre intake and asthma (symptoms and control): results from the French national e‐cohort NutriNet‐Santé. Br J Nutr. 2019;122(9):1040‐1051. [DOI] [PubMed] [Google Scholar]
- 35. Verstegen REM, Kostadinova AI, Merenciana Z, et al. Dietary fibers: effects, underlying mechanisms and possible role in allergic asthma Management. Nutrients. 2021;13(11):4153 [DOI] [PMC free article] [PubMed] [Google Scholar]
- 36. Thorburn A, McKenzie C, Shen S, et al. Evidence that asthma is a developmental origin disease influenced by maternal diet and bacterial metabolites. Nat Commun. 2015;6:7320 [DOI] [PubMed] [Google Scholar]
- 37. Guilleminault L, Williams E, Scott H, et al. It time to adapt our message? Nutrients. 2017;9(11):1227 [DOI] [PMC free article] [PubMed] [Google Scholar]
- 38. Chatzi L, Apostolaki G, Bibakis I, et al. Protective effect of fruits, vegetables and the Mediterranean diet on asthma and allergies among children in Crete. Thorax. 2007;62(8):677‐683. [DOI] [PMC free article] [PubMed] [Google Scholar]
- 39. Miyake Y, Sasaki S, Ohya Y, et al. Dietary intake of seaweed and minerals and prevalence of allergic rhinitis in Japanese pregnant females: baseline data from the Osaka Maternal and Child Health Study. Ann Epidemiol. 2006;16(8):614‐621. [DOI] [PubMed] [Google Scholar]
- 40. Stephen A, Champ M, Cloran S, et al. Dietary fibre in Europe: current state of knowledge on definitions, sources, recommendations, intakes and relationships to health. Nutr Res Rev. 2017;30(2):149‐190. [DOI] [PubMed] [Google Scholar]
- 41. Szmidt M, Kaluza J, Harris H, Linden A, Wolk A. Long‐term dietary fiber intake and risk of chronic obstructive pulmonary disease: a prospective cohort study of women. Eur J Nutr. 2020;59(5):1869‐1879. [DOI] [PMC free article] [PubMed] [Google Scholar]
- 42. Fernstrand A, Bury D, Garssen J, Verster J. Dietary intake of fibers: differential effects in men and women on perceived general health and immune functioning. Food Nutr Res. 2017;61(1):1297053 [DOI] [PMC free article] [PubMed] [Google Scholar]
- 43. Ma Y, Griffith J, Chasan‐Taber L, et al. Association between dietary fiber and serum C‐reactive protein. Am J Clin Nutr. 2006;83(4):760‐766. [DOI] [PMC free article] [PubMed] [Google Scholar]
- 44. Ma Y, Hébert J, Li W, et al. Association between dietary fiber and markers of systemic inflammation in the Women's Health Initiative Observational Study. Nutrition. 2008;24(10):941‐949. [DOI] [PMC free article] [PubMed] [Google Scholar]
- 45. Trompette A, Gollwitzer E, Yadava K, et al. Gut microbiota metabolism of dietary fiber influences allergic airway disease and hematopoiesis. Nat Med. 2014;20(2):159‐166. [DOI] [PubMed] [Google Scholar]
- 46. Zhang Z, Shi L, Pang W, et al. Dietary fiber intake regulates intestinal microflora and inhibits ovalbumin‐induced allergic airway inflammation in a mouse model. PLoS One. 2016;11(2):e0147778 [DOI] [PMC free article] [PubMed] [Google Scholar]
- 47. Zimmermann P, Messina N, Mohn WW, Finlay BB, Curtis N. Association between the intestinal microbiota and allergic sensitization, eczema, and asthma: a systematic review. J Allergy Clin Immunol. 2019;143(2):467‐485. [DOI] [PubMed] [Google Scholar]
- 48. Chiu CY, Chan YL, Tsai YS, et al. Airway microbial diversity is inversely associated with mite‐sensitized rhinitis and asthma in early childhood. Sci Rep. 2017;7(1):1820 [DOI] [PMC free article] [PubMed] [Google Scholar]
- 49. Riksmaten – barn 2003. Livsmedels‐Och Näringsintag Bland Barn I Sverige. Livsmedelsverket; 2003. Accessed January 10, 2022. https://www.livsmedelsverket.se/matvanor‐halsa‐miljo/matvanor‐undersokningar/riksmaten‐barn‐2003 [Google Scholar]
- 50. Riksmaten ungdom 2016‐17 . Så Äter Ungdomar I Sverige. Livsmedelsverket; 2018. Accessed January 10, 2022 from. https://www.livsmedelsverket.se/matvanor‐halsa‐miljo/matvanor‐‐undersokningar/riksmaten‐ungdom [Google Scholar]
- 51. Edwards C, Xie C, Garcia A. Dietary fibre and health in children and adolescents. Proc Nutr Soc. 2015;74(3):292‐302. [DOI] [PubMed] [Google Scholar]
- 52. Nordic Nutrition Recommendations 2012 . Nordic Council of Ministers; 2014. 10.6027/Nord2014-002 [DOI]
- 53. Willett WC. Nutritional Epidemiology. 3rd ed. Oxford University Press; 2012:529. [Google Scholar]
Associated Data
This section collects any data citations, data availability statements, or supplementary materials included in this article.
Supplementary Materials
Supplementary Material 1
Supplementary Material 2