Abstract
To make the vast collections of well-documented human clinical samples archived in biobanks accessible for mass spectrometry imaging (MSI), recent developments have focused on the label-free top-down MS analysis of neuropeptides in sections of paraffin embedded formalin-fixed (FFPE) tissues. In analogy to immunohistochemistry (IHC) this variant of MSI has been designated MSHC (mass spectrometry histochemistry). Besides the detection and localization of neuropeptide and other biomolecular MS signals in these FFPE samples, there is great interest in their molecular identification and full characterization. We here used MALDI MSI employing ultra-high-resolution FT ICR MS on DHB coated five-micron sections of human FFPE pituitary to demonstrate clear isotope patterns and elemental composition assignment of neuropeptides (with ~1ppm mass accuracy). Besides tandem MS fragmentation pattern analysis to deduce or confirm amino acid sequence information (Arg-vasopressin for the case here presented), there is a need for orthogonal primary structure characterization of the peptide-like MS signals of biomolecules desorbed directly off FFPE tissue sections. In the present work, we performed LESA extractions on consecutive (uncoated) tissue slices. This enables the successful characterization by ion mobility MS of vasopressin present in FFPE material. Differences in sequence coverage are discussed based on the mobility selected CID, ECD and UVPD MS/MS. Using Arg-vasopressin as model case (a peptide with a disulfide bridged ring structure), we illustrate the use of LESA in combination with a reduction agent for effective sequencing using mobility selected CID, ECD and UVPD MS/MS.
Keywords: MALDI FT-ICR MSHC, LESA-TIMS-MS/MS, CID, ExD, UVPD, FFPE tissue sections
Graphical Abstract
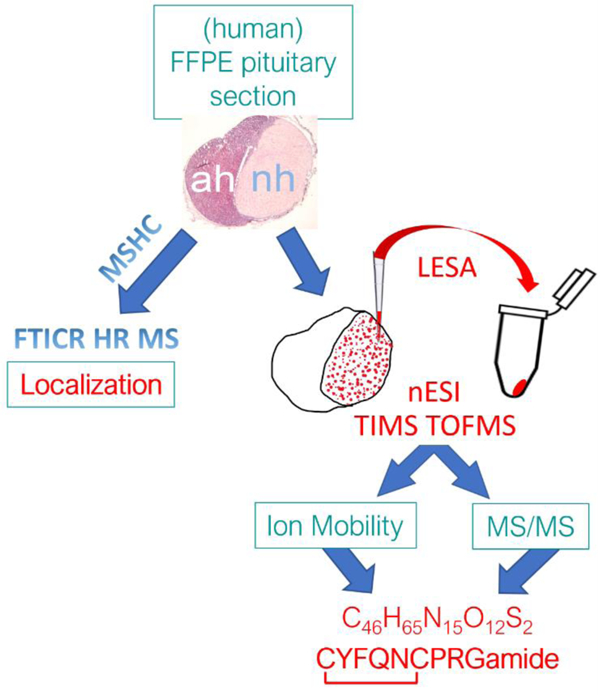
Authors are required to submit a graphic entry for the Table of Contents (TOC) that, in conjunction with the manuscript title, should give the reader a representative idea of one of the following: A key structure, reaction, equation, concept, or theorem, etc., that is discussed in the manuscript. Consult the journal’s Instructions for Authors for TOC graphic specifications.
1. INTRODUCTION
The biological tissues which comprise the various organs and organ systems in our body consist of large numbers of heterogeneous cells. Groups of cell types operate together to execute/complete a (physiological) function. Cells within tissues are known to respond to their surrounding extracellular environment and communicate with each other by a combination of physical signals (through specialized intercellular junctions), and biochemical molecular signals. This enables multicellular tissues to operate as functional units1. In this context, endogenous peptides are essential molecules synthesized (and released) by a living cell. They are biological messengers carrying information from one tissue to another through the extracellular circulation (e.g. bloodstream)2. The function of endogenous (secretory) peptides is dependent on their amino acid sequence and shape. Hence the interest to elucidate the peptides’ primary as well as secondary structures. In addition, their detailed spatial distribution within a tissue and correlation with classical histological and/or expert pathological features are crucial information with respect to revealing the importance of secretory peptides in the biology of a tissue/organ.
A series of analytical tools have been used to study changes related to endogenous peptides in a cell or an organism, such as chromatography, mass spectrometry (MS) and nuclear magnetic resonance (NMR)3. Most analyses are typically performed using MS4–6, in combination with separation techniques such as liquid chromatography (LC)7–10, and ion mobility (IMS)11–15 which assist with characterization. The caveat of these techniques is the loss of any detailed spatial distribution of the peptides within the tissue sample. Mass spectrometry imaging (MSI) was developed especially for spatially conserved ion sampling from a surface not requiring any targeted probe. Introduced already a quarter of a century ago by Caprioli and coworkers.16 MSI allows biomolecules to be mapped without the need of upfront knowledge of the targeted molecules. This so-called discovery mode is an important advantage when analyzing complex samples like biological tissues17, 18. MSI works as a label free technique that can provide information for the understanding of biological processes with high spatial resolution from multicellular down to single cell and even subcellular levels. MSI essentially involves a four-step procedure that includes sample preparation, desorption/ionization, mass analysis and image registration19. The most widely used MSI techniques are Matrix Assisted Laser Desorption Ionization (MALDI)20 and Secondary Ion Mass Spectrometry (SIMS)17 coupled to a Time of Flight (TOF) analyzer.
Formalin-fixed, paraffin-embedded (FFPE) tissues are samples amply archived in hospitals where they are extensively used for histological and histochemical studies21. However, the vast majority of MSI analyses of hospital biobanked material reported are not on FFPE samples. The main reason is that formaldehyde fixation and subsequent dehydration and embedding protocols have been found to be inferior for MSI of various biomolecules of interest. Inversely, fresh, or fresh frozen sample preparation of tissues is typically preferred as tissues which are not FFPE processed yield considerably higher intensity ions of many classes of biomolecules including metabolites,22, 23 glycans,24 and lipids25, 26 when compared to the same tissue samples after FFPE.
One of the most challenging classes of biological compounds to detect by MSI are endogenously produced peptides, tiny proteins which comprise the so-called neurosecretory peptides that are involved in the regulation of many if not all physiological processes of the (human) body.27 The use of MSI for the detection, characterization, and localization of neuropeptides has been showcased by only few independent groups (Andrén, et al.28–30, Fournier and Salzet et al.31 and Verhaert et al. 32).The two latter groups described different sample preparation workflows, including a procedure for FFPE peptide MSI (Paine et al.33). Different conclusions were drawn as to the usefulness of FFPE tissues, in particular for ‘top down’ MSI analyses of (endogenous, i.e., non-tryptic) peptides, which contributed to the neglection of FFPE samples for (neuro)peptide MSI.
In the present work, MALDI MSI using an ultra-high resolution 7T FT-ICR MS was performed on 2,5-Dihydroxybenzoic acid (DHB) coated sections of human pituitary FFPE tissue. As an orthogonal, complementary technique, liquid extraction surface analysis – trapped ion mobility spectrometry- tandem mass spectrometry (LESA-TIMS-MS/MS) was performed on consecutive FFPE tissue sections. This combination of orthogonal analyses was used to confirm the peptide identity based on the mobility pattern, accurate mass and mobility selected MS/MS fragmentation pattern. LESA has become an alternative technique to surface mapping, where a liquid micro-junction between the surface and an extraction tip is created, followed by direct nano-electrospray infusion34.
Finally, differences in sequence coverage after mobility selected collision induced dissociation (CID), electron capture dissociation (ECD) and UV photodissociation (UVPD) MS/MS are discussed. Focusing on Arg-vasopressin as exemplary neuropeptide with a cystine ring, the use of LESA with a disulfide reduction agent is illustrated for improved de novo sequencing using mobility selected CID, ECD and UVPD MS/MS.
2. EXPERIMENTAL SECTION
2.1. Chemicals.
HPLC-grade ethanol (dehydrated) was purchased from Biosolve B.V. (Valkenswaard, The Netherlands). Xylene (>99%), HPLC-grade acetonitrile (ACN; >99.93%), 2,5-dihydroxybenzoic acid (DHB; >99.0%), and trifluoracetic acid (TFA; 99%) were from Sigma-Aldrich (Zwijndrecht, The Netherlands). Vasopressin standard (synthetic [Arg8]-vasopressin (AVP)) was purchased from AnaSpec Inc. (Fremont, CA, USA).
2.2. Sample collection, embedding, microtome sectioning and mounting.
FFPE human pituitary tissues were obtained from the biobank at the Neuropathology Department of Leuven University (a generous gift by Prof. Dr. R. Sciot; UZ-Leuven, Belgium) all in compliance with (inter)national privacy and ethics laws and regulations and in full respect of human rights. Paraffin blocks containing more than 5-year-old biopsies from anonymized patients suffering from (anterior) pituitary adenomas, were especially selected for their inclusion of fragments of the posterior pituitary (i.e., neurohypophysis). These pituitary parts are known to store and release endogenous neuropeptides, including the cyclic nonapeptides vasopressin and oxytocin. All tissues had been fixed and embedded following a routine standard protocol employed for histopathology (see Figure 1)33.
Figure 1.
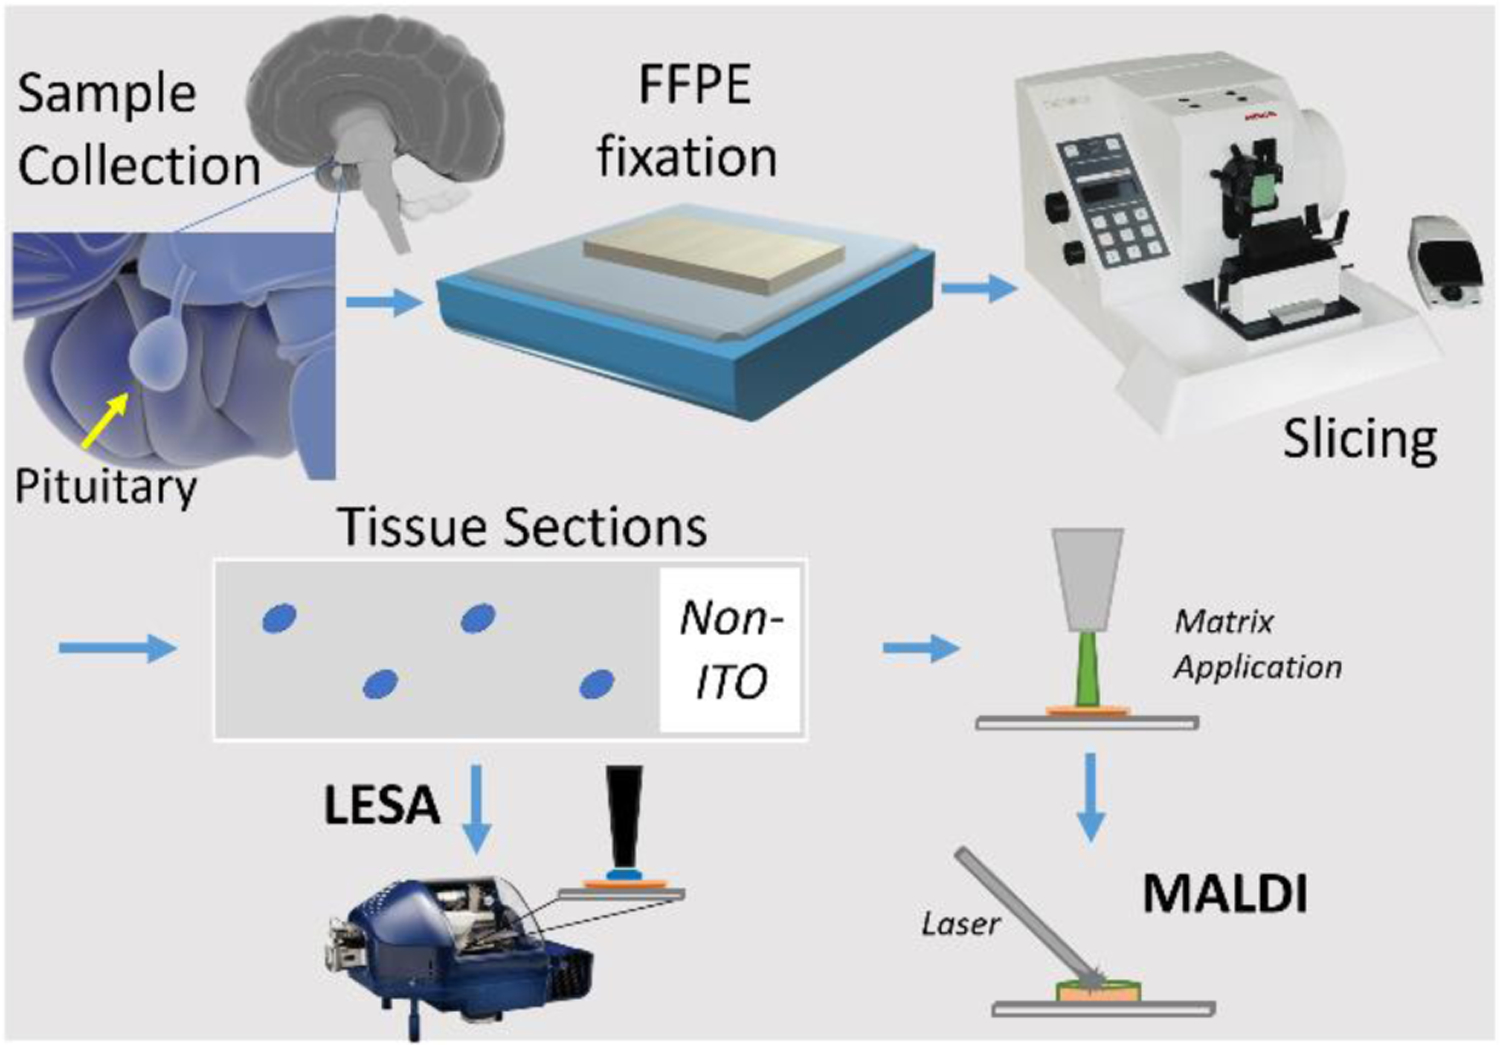
Workflow for FFPE fixation, microtome sectioning (slicing) and further (human pituitary tissue) sample preparation for MSHC analysis.
Briefly, fixation of tissues with 10% formalin (i.e. 40% formaldehyde, fixative volume 5‐10 times tissue volume) was performed at room temperature for 24‐48 hours. Fixed tissues (trimmed to appropriate size and shape) were placed in embedding cassettes. Paraffin embedding was performed according to the following schedule (total 16 hours); 70% ethanol (3 × 1h); 80% ethanol (2 × 1h); 95% ethanol (2 × 1h); 100% ethanol (3 × 1.5h); xylene (3 × 1.5h); paraffin wax (58‐60 ºC) (1 × 2h; 1 x >2h). Afterwards, embedded tissues were brought back to room temperature, allowing the paraffin to solidify. Paraffin blocks were trimmed as necessary and sectioned at 5 μm thickness on a semi-automated microtome (Microm) equipped with a Zeiss Stemi 2000 binocular loupe. Sections were collected in a water bath at room temperature and mounted onto regular microscope slides (Thermo Superfrost) using distilled water. Sections were stretched on a hotplate (50ºC) and air-dried for at least 30 minutes with optional overnight baking in an oven (45–50ºC). Prior to mass spectrometry histochemistry (MSHC) analysis, sections were deparaffinized in 2 changes of xylene (3 and 2 min respectively), xylene was removed by ethanol through 2 changes of 100% ethanol (2 min each), according to the MSHC protocol described earlier33. For microscopic reference, a few sections adjacent to those processed by MSHC were stained with classical histochemistry. These included hematoxylin/eosin (H&E) staining as well as immunohistochemistry with anti-vasopressin antibodies (a kind gift by Prof. L. Arckens; Laboratory for Neuroplasticity and Neuroproteomics, University of Leuven, Belgium).
2.3. MALDI sample preparation.
After deparaffinization, tissues on the microscope slides were coated with a matrix solution of 2,5-dihydroxybenzoic acid (DHB; 50 mg/mL) in ACN/H2O/TFA (49.95:49.95:0.1 v/v). The matrix solution was applied as a nebulized spray using a TM sprayer (HTX Technologies, NC, U.S.A.) with the following settings: flow rate, 0.1 mL/min; spray nozzle velocity, 1200 mm/min; spray nozzle temperature, 75 °C; number of passes, 3; nitrogen gas pressure, 10 psi; track spacing, 1 mm; drying time between passes, 10 s.
2.4. MALDI MSI FT-ICR MS.
MALDI Imaging experiments were done on a 7T FTMS system (SolariX Smartbeam, Bruker Daltonics, Billerica, MA, USA) with a 355nm Nd:YAG Laser. A total of 1000 shots were acquired per spectrum, with 100 shots per raster site. Raster width was set to 25 µm. FT-ICR MS spectra were collected with 2MW acquisition data size and internally calibrated.
2.5. Neuropeptide extraction from FFPE slides.
Glass slides containing deparaffinized human pituitary tissue slices were placed on the LESA universal adaptor plate of a TriVersa Nanomate device (Advion, Ithaca, NY, USA) in micro-junction mode. Extraction spots were determined manually. To start, an automated arm aspirated 5 μL of solvent from the solvent well and relocated on top of the desired spot in the tissue. The tip descended to a 1.9 mm dispensation height to deposit 1.0 μL of solvent forming a liquid micro-junction between the surface of the tissue sample and the solvent. Solvent droplet stayed in contact with the surface for 60 s, before being re-aspirated and re-dispensed for another 60 s for a total of 5 times. Ultimately, 1.5 μL of solvent was re-aspirated and dispensed into a specific well in a 96 well plate. As many spots as possible were extracted depending on tissue size. A peptide internal standard (human angiotensin II, 1046 m/z) was prepared to 1 μM concentration and added to the extraction solvent acetonitrile:water:formic acid (40:59:1; v/v/v). The use of an internal standard allowed to correct for variations in the LESA tip extraction and nESI spraying conditions.
2.6. LESA with disulfide bond reduction.
A 10µL volume of LESA extract was reduced by adding 1µL of 10mM Tris(2-carboxyethyl)phosphine (TCEP) at 50 °C for 15 min. Reduced solutions were analyzed immediately after dilution to avoid re-formation of the disulfide bond.
2.7. nESI-TIMS-q-TOF MS/MS.
A volume of 10 µL of LESA extract was loaded in a quartz glass pull-tip capillary (O.D.: 1.0mm and I.D.: 0.70mm) and sprayed at 800 – 1200 V into a custom built nESI-TIMS coupled to a q-TOF MS instrument (Impact q-TOF, Bruker Daltonics, Billerica, MA, USA)35. The TOF component was operated at 10 kHz and m/z range from 50 – 2000, using the maXis Impact Q-TOF acquisition program. The TIMS component was operated by Lab View, an in-house software, in synchronization with the TOF controls. This TIMS-q-TOF MS/MS prototype is also equipped with a CID cell, a custom-built electromagnetostatic (EMS) cell for ECD and a trap for mobility selected UVPD (213 nm) prior to TOF MS. Data were analyzed using Data Analysis version 5.2.
3. RESULTS AND DISCUSSION
3.1. MALDI MSI FT-ICR MS.
MSHC analysis of two different sections of the same paraffin block (a few 100 μm apart) by MALDI MSI FT ICR MS provided ultra-high mass resolution measurements in the range of m/z 500–2000 (Fig. 2a and 2b). Endogenous neuropeptide signals for Arg-vasopressin (AVP, 1084.44 m/z [M+H]+; Fig. 2, green) and oxytocin (1029.45 m/z [M+Na]+, Fig. SI1) were detected. The protonated signals of Arg-vasopressin were found to be accompanied by the Shiff base ([M+12]+, yellow) and sodiated adducts ([M+Na]+, red), providing similar MSHC images to that of the [M+H]+ signal (Fig. 2a and 2b). All peptide ion species were detected with their expected isotopic pattern (Fig. 2c and 2d showcase recorded MS data exhibiting the respective isotopic patterns and corresponding mass errors).
Figure 2.
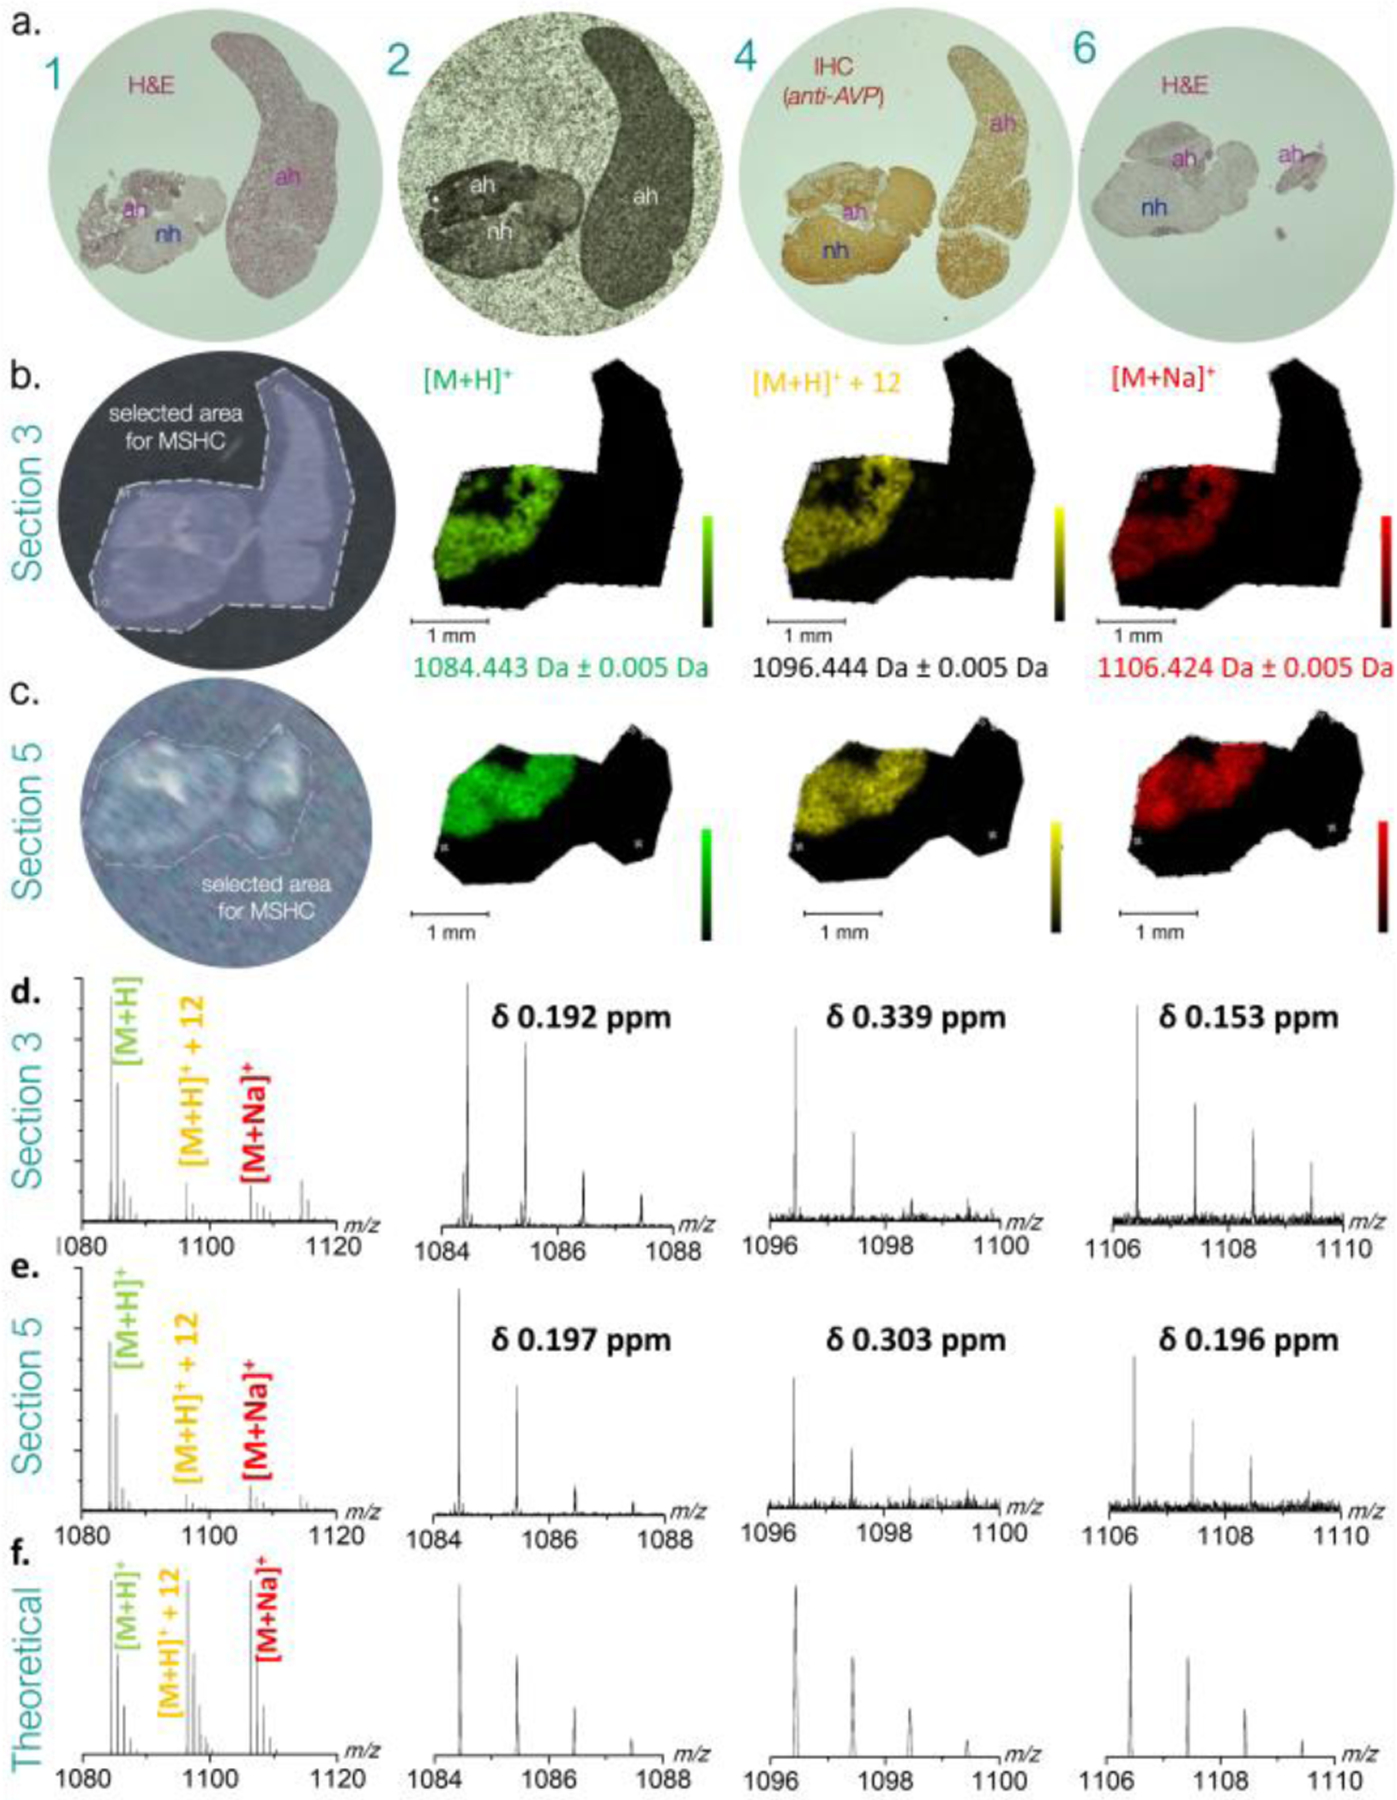
a. Bright field optical images of human pituitary biopsy tissue sections adjacent to MSHC imaged section 3 and 5. (1) haematoxylin-eosin staining of section 1; (2) unstained section 2 coated with DHB MALDI matrix; (4) immunohistochemically stained section 4 (in between MHSC imaged sections 3 and 5; (6) haematoxylin-eosin staining of section 6, at end of series. b. and c. MSHC experiments showing software selected areas analyzed (left panel) and the respective MALDI-FT ICR MSHC images of protonated (green), Shiff base (yellow) and sodiated (red) ions of Arg-vasopressin ions. Legend: ah, adenohypophysary tumour tissue; H&E, hematoxylin eosin; IHC, immunohistochemistry (using anti-vasopressin polyclonal antiserum). d. and e. showcase mass spectra and experimental isotopic patterns for each species in section 3 and section 5, respectively. f. theoretical isotopic patterns for each species.
Like other MALDI sources (including MassTech’s AP-MALDI and Waters’ Synapt) which do not require conductive (e.g. ITO coated) slides for MSI data acquisition, our setup allows for the use of regular microscope slides for MSHC. This represents a clear advantage over MSI protocols requiring ITO slides. Not only is it less costly, it is also logistically very elegant as samples can be collected straight from hospital biobanks.
3.2. LESA-nESI-TIMS-q-TOF MS/MS.
LESA-nESI-TIMS-TOF MS/MS provided a complementary, quick identification of AVP (1084 m/z [M+H]+ and 542 m/z [M+2H]2+) from the tissue sample (Figures 3 and 4, respectively). These results were compared to the analysis of a synthetic AVP standard in the same solvent conditions (red trace in both Figure 3 and 4). Interestingly, the AVP [M+H]+ yielded two mobility bands (302 Å2 and 310 Å2; Figure 3a), while the [M+2H]2+showed a single band (340 Å2) (Figure 4a). This is consistent with the primary structure of AVPwhich comprises 2 protonation sites, leading to the formation of 2 protomers for the case of the singly charged molecular ions. Moreover, an alternative explanation could be the isomerization of the Pro residue in the backbone. Since a single band is observed for the doubly charged molecular ion, the existence of protomers seems favored.
Figure 3.
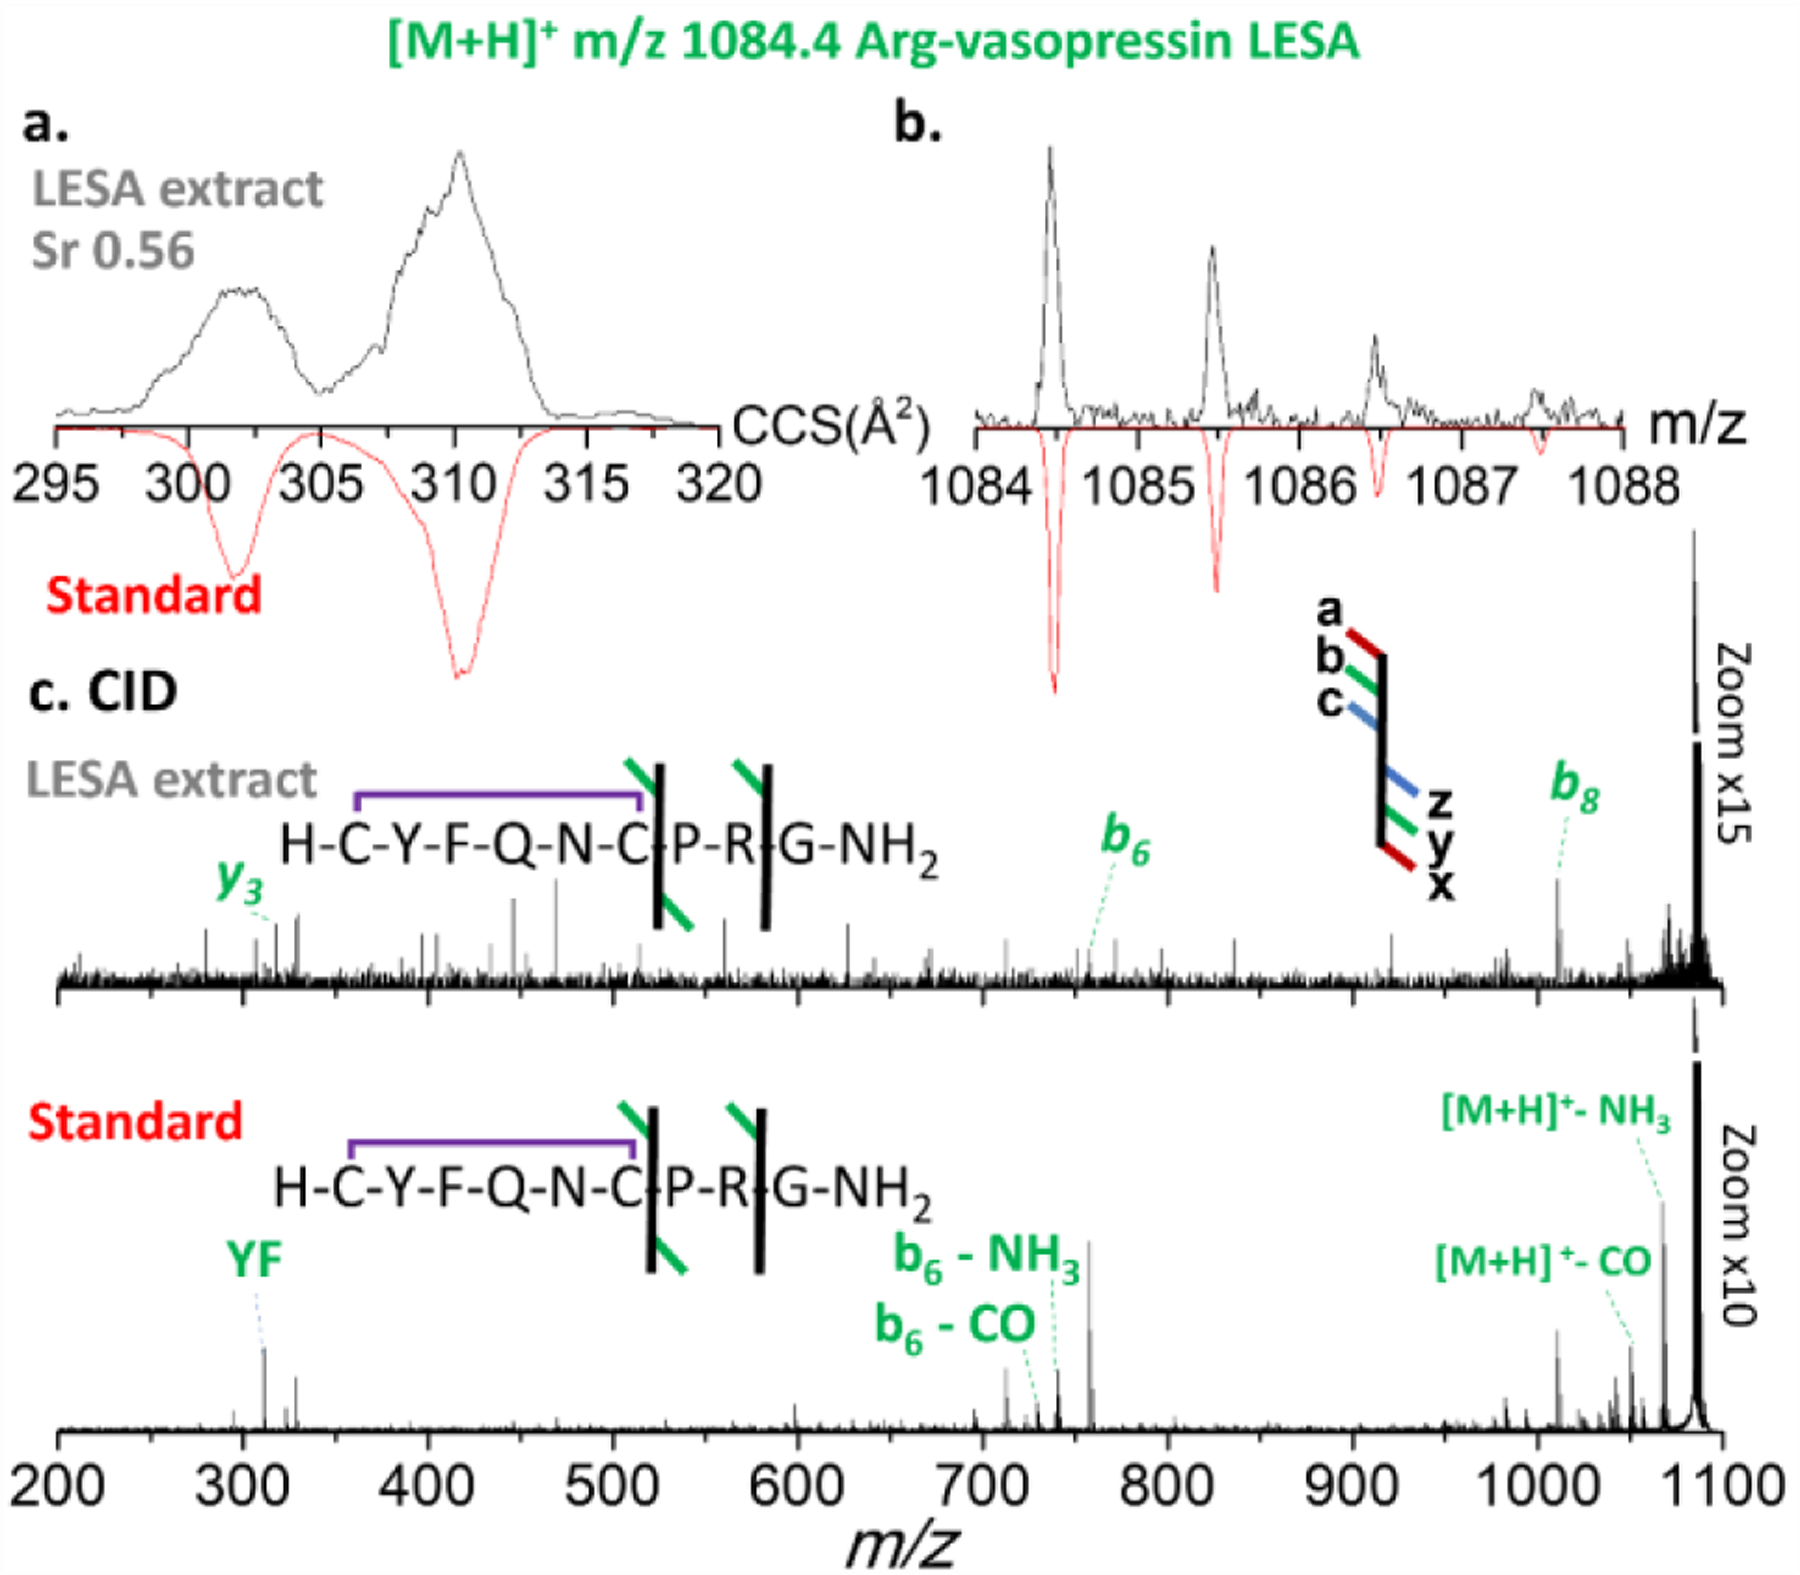
Figure 3. Ion mobility, isotopic and fragmentation patterns of LESA extracted [M+H]+ ions of Arg-vasopressin species. a. ion mobilogram of experimental LESA extracted tissue sample [upper panel, black traces] and of synthetic peptide standard [red traces]; b. isotope pattern of experimental LESA extracted tissue sample [upper panel, black traces] and of synthetic peptide standard [red traces]; c. CID tandem MS of experimental LESA extracted tissue sample [upper panel] and of synthetic peptide standard [lower panel]).
Figure 4.
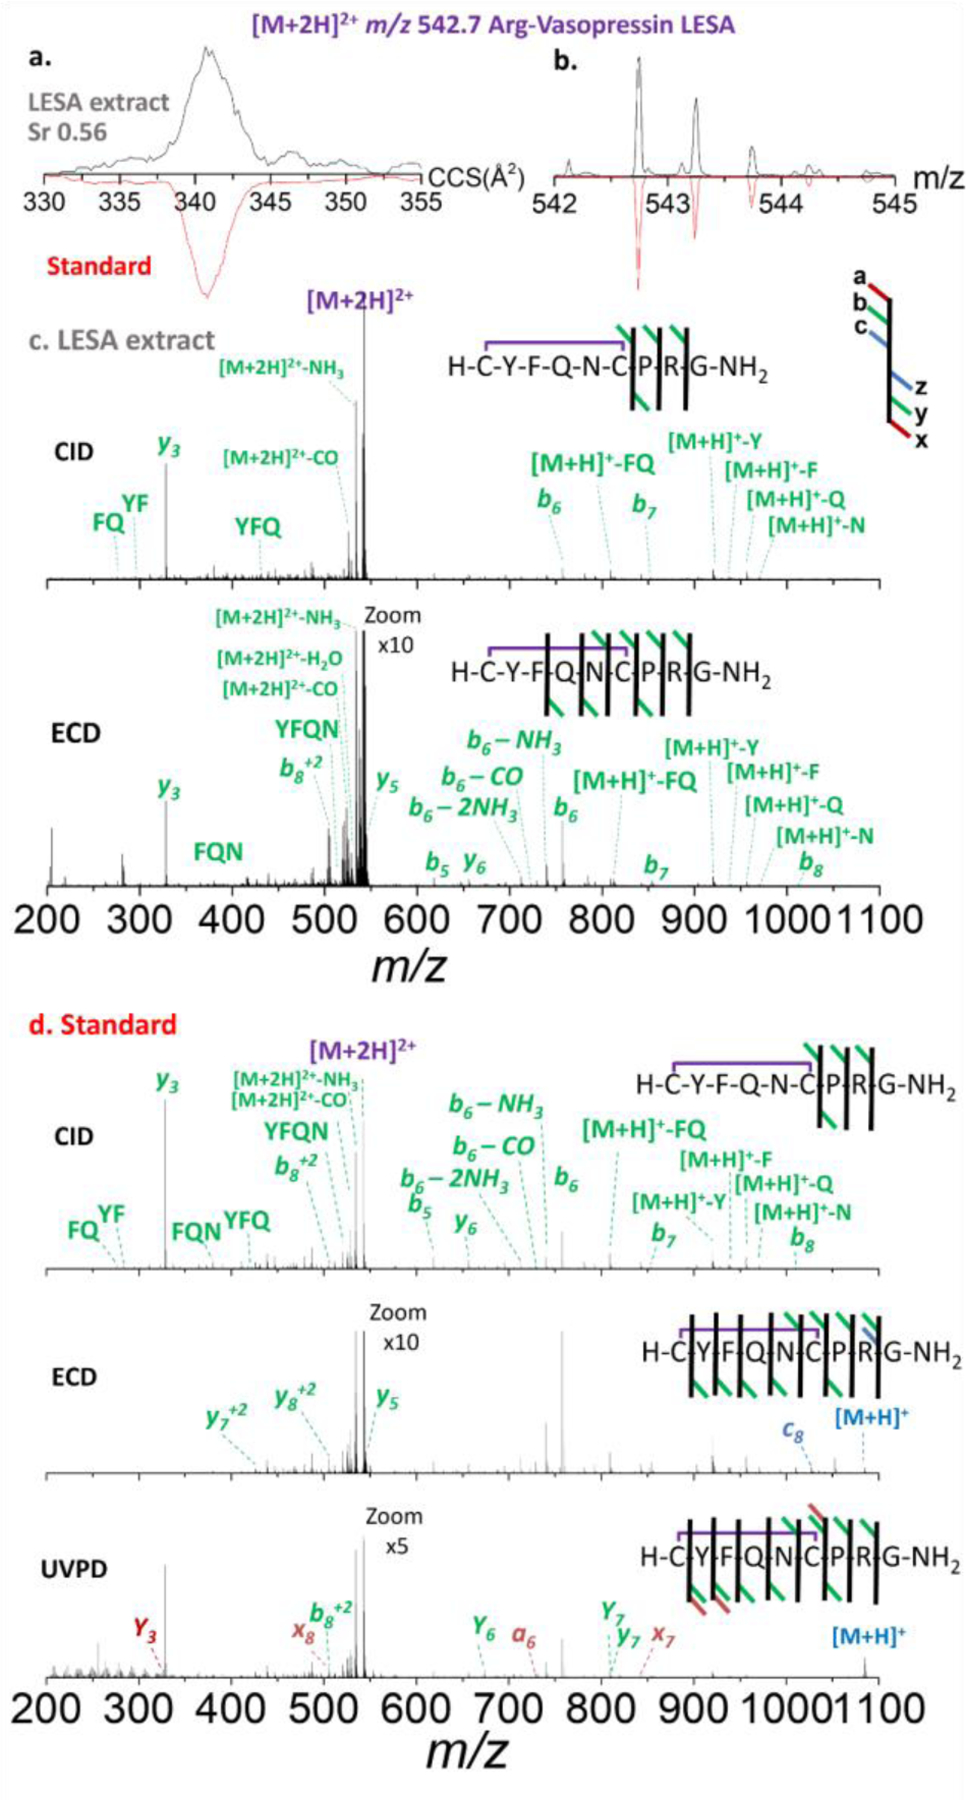
Ion mobility, experimental isotopic and fragmentation patterns of [M+2H]2+ species of Arg-vasopressin. a. ion mobilogram of experimental LESA extracted tissue sample [upper panel, black traces] and of synthetic peptide standard [red traces]; b. isotope pattern of experimental LESA extracted tissue sample [upper panel, black traces] and of synthetic peptide standard [red traces]; c. CID [upper panel] and ECD [lower panel] tandem MS of experimental LESA extracted tissue sample and d. CID [upper panel], ECD [center panel] and UVPD [lower panel] of synthetic peptide standard.
The mobility selected CID MS/MS of the singly charged AVP precursor ions from the LESA extract yielded characteristic fragment ions (b6, b8 and y3), in good agreement to that observed from the AVP standard (Figure 3). Even with the optimal collision energy, the intensity of the precursor and fragment ions remained quite low. This is likely due to the minute amount of analyte present in the small surface sampled, rather than to a lack of fragmentation energy. AVP contains a proline in the middle of its short sequence which produces characteristic ions evidencing peptide fragmentation in the C-terminal of the Pro residue as seen in the tandem MS data.
The mobility selected CID MS/MS of the doubly charged AVP ions from the LESA extract yielded characteristic fragment ions (b6, b7, b8 and y3), likewise in good agreement to that observed from the AVP (Figure 4). In contrast to CID, mobility selected ECD MS/MS from the LESA extract showed better sequence coverage (b5, b6, b7, b8, y3, y5, and y6 ), in good agreement to that observed from the AVP standard and previous CID/ECD comparisons.36–38 The mobility selected UVPD (213 nm) of the double charged AVP standard showed complete sequence coverage (b5, a6, b6, b7, b8, y3, y5, y6, x7, y7, x8 and y8). Note that exposure of peptides to 213 nm photons selectively cleaves disulfide bonds by UVPD fragmentations39. The caveat of ECD and UVPD over CID is the lower fragmentation efficiencies (2.6% and 4.03%, respectively), which combined with the low peptide concentration typically observed in the LESA extracts from FFPE makes this approach more challenging.
An additional analytical tool suitable to LESA samples, is the administration of a disulfide reduction agent prior the nESI-TIMS-TOF MS/MS analysis (Fig. 5). Interestingly, upon reduction of the disulfide bond, the mobility profiles of the doubly charged AVP ions now yield two mobility bands (consistent with the appearance of an extra protonation site in reduced versus oxidized peptide) and the reduction can be clearly seen by the A+2 isotopic profile. Moreover, the mobility selected CID MS/MS of the doubly charged reduced AVP ions from the LESA extract provided unambiguous sequence confirmation (b3, b4, b5, b6, b7, b82+, y3, y4, y5, y6, y7, y72+ and y82+) (Fig. 5c), in good agreement to that observed from the AVP standard (Fig. 5d).
Figure 5.
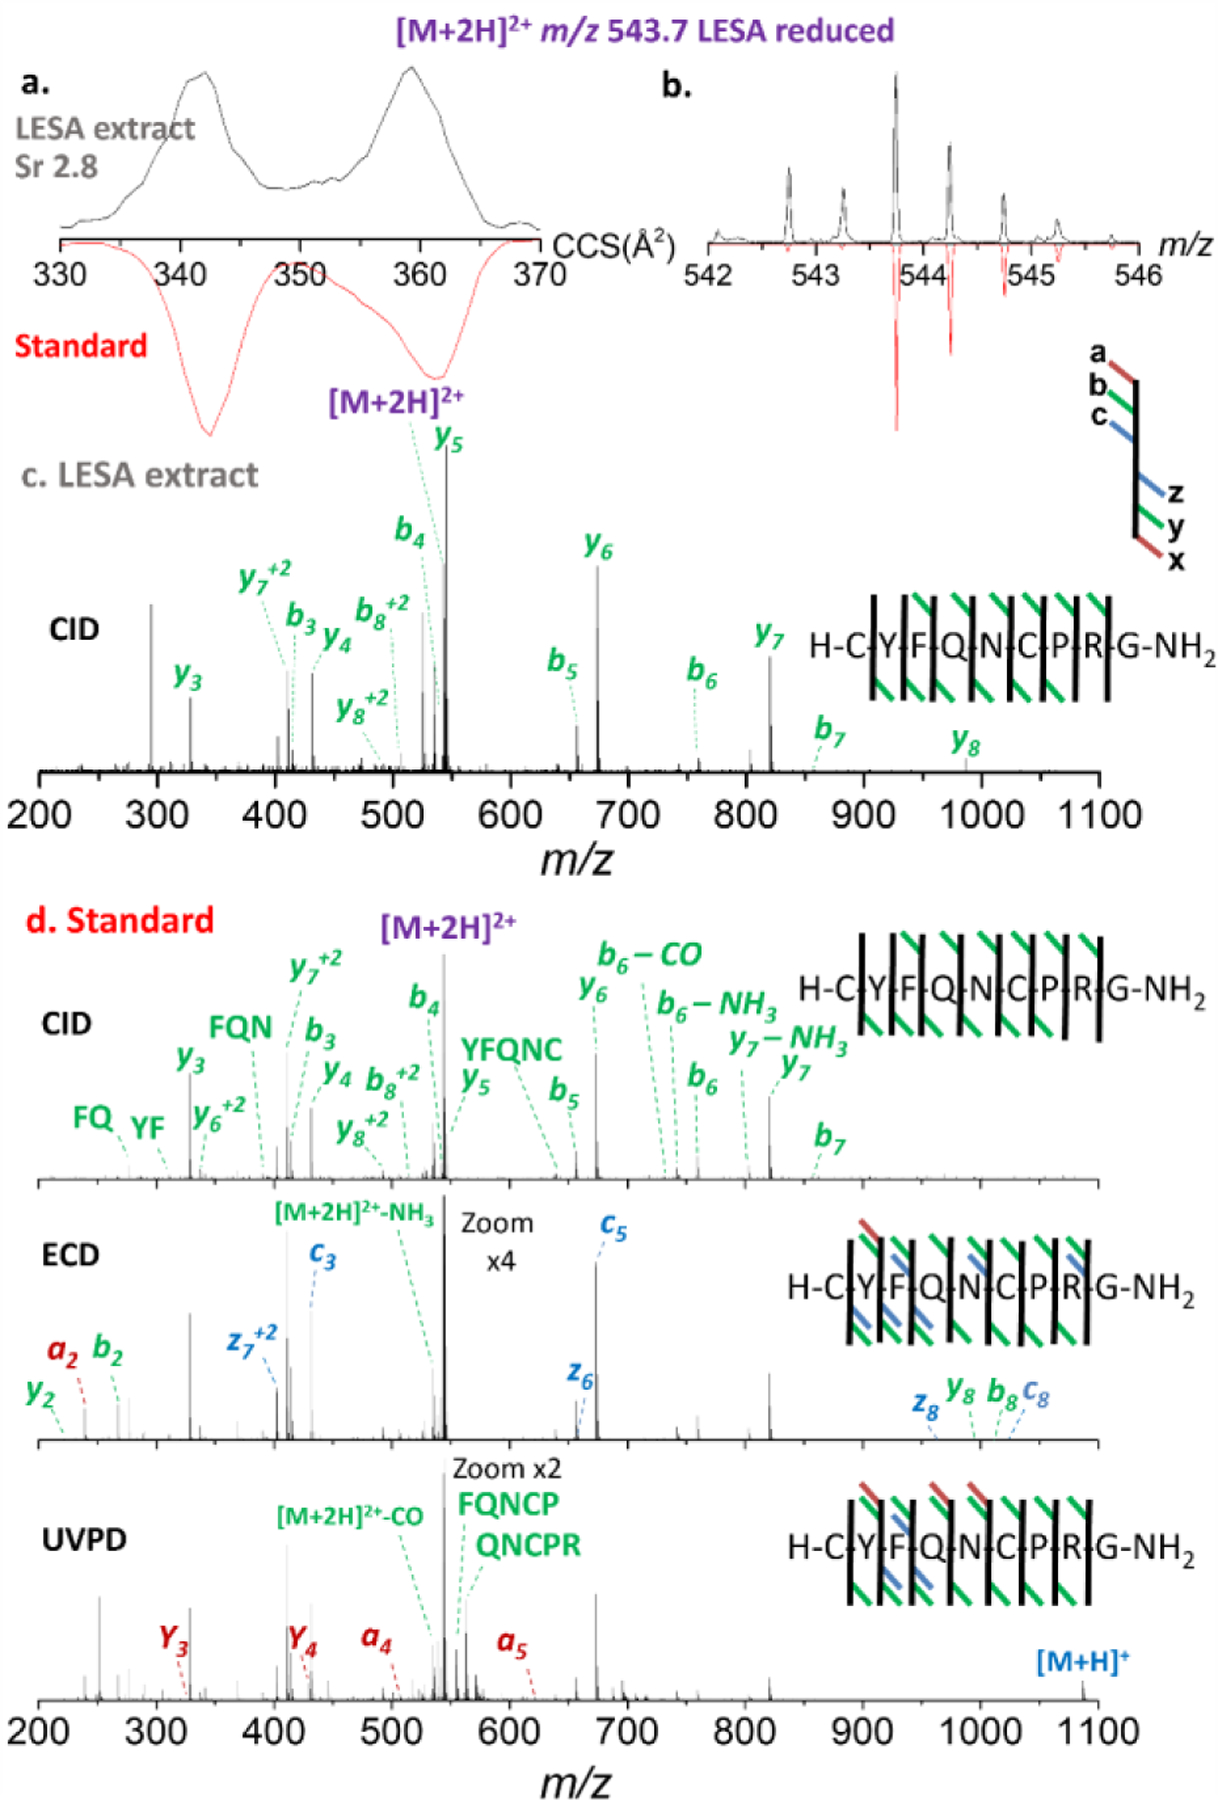
Ion mobility, experimental isotopic and fragmentation patterns of [M+2H]2+ species of reduced Arg-vasopressin species extracted (LESA) from tissue. a. ion mobilogram of experimental LESA extracted tissue sample [upper panel, black traces] and of synthetic peptide standard [red traces]; b. isotope pattern of experimental LESA extracted tissue sample [upper panel, black traces] and of synthetic peptide standard [red traces]; c. CID tandem MS of experimental LESA extracted tissue sample and d. CID [upper panel], ECD [center panel] and UVPD [lower panel] of synthetic peptide standard.
The mobility selected ECD and UVPD MS/MS of the doubly charged reduced AVP ions showed better sequence coverage than CID, with ions a2, b2, b3, c3, b4, b5, c5, b6, b7, b8, c8, y2, y3, y4, y5, y6, z6, y7, z72+, y8 and z8 observed for ECD and ions a2, b2, b3, c3, a4, b4, a5, b5, b6, b7, b82+, y2, y3, y4, y5, y6, z6, y7, z72+, and y82+ for UVPD. The same caveat was noted for the case of the S-S reduced LESA extract: the lower fragmentation efficiency of ECD and UVPD (9.5% and 3.0%, respectively) over CID did not provide meaningful fragmentation information. Overall, with the Cys1-Cys6 ring structure (cystine bond) present, fragment ions representing all inner amino acids were not achieved after mobility selected CID. However, after reduction of the S-S bond, full peptide sequence coverage was obtained.
4. Conclusions
We described the complementary use of MALDI MSI FT-ICR MS and LESA-TIMS-TOF MS/MS for the analysis of neuropeptides from FFPE tissue sections. The workflow allows for the MSHC based localization of neuropeptides with sub-ppm mass accuracy and effective peptide identification using mobility profiles, accurate m/z, and tandem MS fragmentation patterns. In addition, the LESA workflow allows for the incorporation of reduction agents effectively leading to full sequence coverage using CID techniques. The use of alternative mobility selected ECD and UVPD techniques yield better sequence coverage, yet with lower fragmentation efficiencies when compared to mobility selected CID.
Supplementary Material
ACKNOWLEDGMENT
YCD acknowledges the financial support from NSF FGLSAMP FIU Bridge to the Doctorate award HRD # 1810974. We also acknowledge the financial support from the National Science Foundation Division of Chemistry, under CAREER award CHE-1654274, with co-funding from the Division of Molecular and Cellular Biosciences and funding from National Institutes of General Medicine (R01GM134247) to FFL. ProteoFormiX was supported by a European Institute of Innovation and Technology (EIT) - Health Headstart grant and subsidy from the Flemish regional government through VLAIO (Flemish Agency of Innovation & Entrepreneurship). PV would like to dedicate this paper to the loving memory of his young colleague and friend, Martin ‘Marty’ R.L. Paine, who sadly lost the unequal fight against an aggressive cancer and passed away at the time the here reported experiments were carried out at FIU.
Footnotes
ASSOCIATED CONTENT
Supporting Information
MALDI-FT ICR images of doubly charged ions of Arg-vasopressin and of protonated and sodiated ions of oxytocin species on two different sections of human pituitary biopsy are showcased.
The Supporting Information is available free of charge on the ACS Publications website.
The authors declare no competing financial interest.
REFERENCES
- 1.Ross MH, Pawlina W, Histology: a text and atlas: with correlated cell and molecular biology 7th ed.; Wolters Kluwer: 2016. [Google Scholar]
- 2.Baggerman G, Verleyen P, Clynen E, Huybrechts J, De Loof A, L. Schoofs. Peptidomics. J Chromatogr B Analyt Technol Biomed Life Sci 2004, 803 (1), 3–16. [DOI] [PubMed] [Google Scholar]
- 3.Correia BSB, Torrinhas RS, Ohashi WY, Tasic L. Analytical tools for lipid assessment in biological assays. Intech Open 2018, 1–20. [Google Scholar]
- 4.Trauger SA, Webb W, Siuzdak G. Peptide and protein analysis with mass spectrometry. Spectroscopy 2002, 15–28. [Google Scholar]
- 5.Meng F, Wiener MC, Sachs JR, Burns C, Verma P, Paweletz CP, Mazur MT, Deyanova EG, Yates NA, Hendrickson RC. Quantitative analysis of complex peptide mixtures using FTMS and differential mass spectrometry. J Am Soc Mass Spectrom 2007, 18 (2), 226–33. [DOI] [PubMed] [Google Scholar]
- 6.Chiang S, Zhang W, Farnsworth C, Zhu Y, Lee K, Ouyang Z. Targeted Quantification of Peptides Using Miniature Mass Spectrometry. J Proteome Res 2020, 19 (5), 2043–2052. [DOI] [PubMed] [Google Scholar]
- 7.John H, Walden M, Schafer S, Genz S, Forssmann WG. Analytical procedures for quantification of peptides in pharmaceutical research by liquid chromatography-mass spectrometry. Anal Bioanal Chem 2004, 378 (4), 883–897. [DOI] [PubMed] [Google Scholar]
- 8.Midwoud P. M. v., Rieux L, Bischoff R, Verpoorte E, Niederla HAG. Improvement of Recovery and Repeatability in Liquid Chromatography-Mass Spectrometry Analysis of Peptides. J. Proteome Res 2006, 6, 781–791. [DOI] [PubMed] [Google Scholar]
- 9.Karpievitch YV, Polpitiya AD, Anderson GA, Smith RD, Dabney AR. Liquid Chromatography Mass Spectrometry-Based Proteomics: Biological and Technological Aspects. Ann Appl Stat 2010, 4 (4), 1797–1823. [DOI] [PMC free article] [PubMed] [Google Scholar]
- 10.Bian Y, Zheng R, Bayer FP, Wong C, Chang YC, Meng C, Zolg DP, Reinecke M, Zecha J, Wiechmann S, Heinzlmeir S, Scherr J, Hemmer B, Baynham M, Gingras AC, Boychenko O, Kuster B. Robust, reproducible and quantitative analysis of thousands of proteomes by micro-flow LC-MS/MS. Nat Commun 2020, 11 (1), 157. [DOI] [PMC free article] [PubMed] [Google Scholar]
- 11.Valentine SJ, Kulchania M, Barnes CAS, Clemmer DE. Multidimensional separations of complex peptide mixtures: a combined high-performance liquid chromatography/ion mobility/time-of-flight mass spectrometry approach. Int J Mass Spectrom 2001, 212, 97–109. [Google Scholar]
- 12.Ridenour WB, Kliman M, McLean JA, Caprioli RM. Structural characterization of phospholipids and peptides directly from tissue sections by MALDI traveling-wave ion mobility-mass spectrometry. Anal Chem 2010, 82 (5), 1881–9. [DOI] [PMC free article] [PubMed] [Google Scholar]
- 13.Baker ES, Livesay EA, Orton DJ, Moore RJ, W. F. D. III, Prior DC, Ibrahim YM, LaMarche BL, Mayampurath AM, Schepmoes AA, Hopkins DF, Tang K, Smith RD, Belov ME. An LC-IMS-MS Platform Providing Increased Dynamic Range for High-Throughput Proteomic Studies. J Proteome Res 2010, 9, 997–1006. [DOI] [PMC free article] [PubMed] [Google Scholar]
- 14.Baker ES, Burnum-Johnson KE, Ibrahim YM, Orton DJ, Monroe ME, Kelly RT, Moore RJ, Zhang X, Theberge R, Costello CE, Smith RD. Enhancing bottom-up and top-down proteomic measurements with ion mobility separations. Proteomics 2015, 15 (16), 2766–76. [DOI] [PMC free article] [PubMed] [Google Scholar]
- 15.May JC, Goodwin CR, McLean JA. Ion mobility-mass spectrometry strategies for untargeted systems, synthetic, and chemical biology. Curr Opin Biotechnol 2015, 31, 117–21. [DOI] [PMC free article] [PubMed] [Google Scholar]
- 16.Caprioli RM, Farmer TB, Gile J. Molecular Imaging of Biological Samples: Localization of Peptides and Proteins Using MALDI-TOF MS. Anal Chem 1997, 69, 4751–4760. [DOI] [PubMed] [Google Scholar]
- 17.Brunelle A, Touboul D, Laprevote O. Biological tissue imaging with time-of-flight secondary ion mass spectrometry and cluster ion sources. J Mass Spectrom 2005, 40 (8), 985–99. [DOI] [PubMed] [Google Scholar]
- 18.Chaurand P, Norris JL, Cornett DS, Mobley JA, Caprioli RM. New Developments in Profiling and Imaging of Proteins from Tissue Sections by MALDI Mass Spectrometry. Journal of proteome research 2006, 5, 2889–2900. [DOI] [PubMed] [Google Scholar]
- 19.Chughtai K, Heeren RM. Mass spectrometric imaging for biomedical tissue analysis. Chem Rev 2010, 110 (5), 3237–77. [DOI] [PMC free article] [PubMed] [Google Scholar]
- 20.Prentice BM, McMillen JC, Caprioli RM. Multiple TOF/TOF Events in a Single Laser Shot for Multiplexed Lipid Identifications in MALDI Imaging Mass Spectrometry. Int J Mass Spectrom 2019, 437, 30–37. [DOI] [PMC free article] [PubMed] [Google Scholar]
- 21.Kokkat TJ, Patel MS, McGarvey D, LiVolsi VA, Baloch ZW. Archived formalin-fixed paraffin-embedded (FFPE) blocks: A valuable underexploited resource for extraction of DNA, RNA, and protein. Biopreserv Biobank 2013, 11 (2), 101–6. [DOI] [PMC free article] [PubMed] [Google Scholar]
- 22.Arima K, Lau MC, Zhao M, Haruki K, Kosumi K, Mima K, Gu M, Vayrynen JP, Twombly TS, Baba Y, Fujiyoshi K, Kishikawa J, Guo C, Baba H, Richards WG, Chan AT, Nishihara R, Meyerhardt JA, Nowak JA, Giannakis M, Fuchs CS, Ogino S. Metabolic Profiling of Formalin-Fixed Paraffin-Embedded Tissues Discriminates Normal Colon from Colorectal Cancer. Mol Cancer Res 2020, 18 (6), 883–890. [DOI] [PMC free article] [PubMed] [Google Scholar]
- 23.Isberg OG, Xiang Y, Bodvarsdottir SK, Jonasson JG, Thorsteinsdottir M, Takats Z. The effect of sample age on the metabolic information extracted from formalin-fixed and paraffin embedded tissue samples using desorption electrospray ionization mass spectrometry imaging. J Mass Spectrom Adv Clin Lab 2021, 22, 50–55. [DOI] [PMC free article] [PubMed] [Google Scholar]
- 24.Powers TW, Jones EE, Betesh LR, Romano PR, Gao P, Copland JA, Mehta AS, Drake RR. Matrix assisted laser desorption ionization imaging mass spectrometry workflow for spatial profiling analysis of N-linked glycan expression in tissues. Anal Chem 2013, 85 (20), 9799–806. [DOI] [PMC free article] [PubMed] [Google Scholar]
- 25.Castellanos A, Hernandez MG, Tomic-Canic M, Jozic I, Fernandez-Lima F. Multimodal, in Situ Imaging of Ex Vivo Human Skin Reveals Decrease of Cholesterol Sulfate in the Neoepithelium during Acute Wound Healing. Anal Chem 2020, 92 (1), 1386–1394. [DOI] [PMC free article] [PubMed] [Google Scholar]
- 26.Castellanos A, Ramirez CE, Michalkova V, Nouzova M, Noriega FG, Francisco FL. Three Dimensional Secondary Ion Mass Spectrometry Imaging (3D-SIMS) of Aedes aegypti ovarian follicles. J Anal At Spectrom 2019, 34 (5), 874–883. [DOI] [PMC free article] [PubMed] [Google Scholar]
- 27.Verhaert PDEM. The Bright Future of Peptidomics. Methods Mol Biol 2018, 1719, 407–416. [DOI] [PubMed] [Google Scholar]
- 28.Hulme H, Fridjonsdottir E, Gunnarsdottir H, Vallianatou T, Zhang X, Wadensten H, Shariatgorji R, Nilsson A, Bezard E, Svenningsson P, Andren PE. Simultaneous mass spectrometry imaging of multiple neuropeptides in the brain and alterations induced by experimental parkinsonism and L-DOPA therapy. Neurobiol Dis 2020, 137, 104738. [DOI] [PubMed] [Google Scholar]
- 29.Shariatgorji M, Nilsson A, Fridjonsdottir E, Vallianatou T, Kallback P, Katan L, Savmarker J, Mantas I, Zhang X, Bezard E, Svenningsson P, Odell LR, Andren PE. Comprehensive mapping of neurotransmitter networks by MALDI-MS imaging. Nat Methods 2019, 16 (10), 1021–1028. [DOI] [PubMed] [Google Scholar]
- 30.Shariatgorji M, Svenningsson P, Andren PE. Mass spectrometry imaging, an emerging technology in neuropsychopharmacology. Neuropsychopharmacology 2014, 39 (1), 34–49. [DOI] [PMC free article] [PubMed] [Google Scholar]
- 31.Lemaire R, Desmons A, Tabet JC, Day R, Salzet M, Fournier I. Direct Analysis and MALDI Imaging of Formalin-Fixed, Paraffin-Embedded Tissue Sections. J Proteome Res 2007, 6, 1295–1305. [DOI] [PubMed] [Google Scholar]
- 32.Verhaert PDEM, Pinkse MWH, Strupat K, Conaway MCP . Imaging of similar mass neuropeptides in neuronal tissue by enhanced resolution MALDI MS with an ion trap - Orbitrap hybrid instrument Methods Mol Biol 2010, 656, 433–449. [DOI] [PubMed] [Google Scholar]
- 33.Paine MRL, Ellis SR, Maloney D, Heeren RMA, Verhaert P. Digestion-Free Analysis of Peptides from 30-year-old Formalin-Fixed, Paraffin-Embedded Tissue by Mass Spectrometry Imaging. Anal Chem 2018, 90 (15), 9272–9280. [DOI] [PMC free article] [PubMed] [Google Scholar]
- 34.Kertesz V, Van Berkel GJ. Fully automated liquid extraction-based surface sampling and ionization using a chip-based robotic nanoelectrospray platform. J Mass Spectrom 2010, 45 (3), 252–60. [DOI] [PubMed] [Google Scholar]
- 35.Fernandez-Lima FA, Kaplan DA, Park MA. Integration of trapped ion mobility spectrometry with mass spectrometry. Rev Sci Instrum 2011, 82, 126106. [DOI] [PMC free article] [PubMed] [Google Scholar]
- 36.Jeanne Dit Fouque K, Hegemann JD, Santos-Fernandez M, Le TT, Gomez-Hernandez M, van der Donk WA, Fernandez-Lima F. Exploring structural signatures of the lanthipeptide prochlorosin 2.8 using tandem mass spectrometry and trapped ion mobility-mass spectrometry. Anal Bioanal Chem 2021, 413 (19), 4815–4824. [DOI] [PMC free article] [PubMed] [Google Scholar]
- 37.Jeanne Dit Fouque K, Bisram V, Hegemann JD, Zirah S, Rebuffat S, Fernandez-Lima F. Structural signatures of the class III lasso peptide BI-32169 and the branched-cyclic topoisomers using trapped ion mobility spectrometry-mass spectrometry and tandem mass spectrometry. Anal Bioanal Chem 2019, 411 (24), 6287–6296. [DOI] [PubMed] [Google Scholar]
- 38.Jeanne Dit Fouque K, Lavanant H, Zirah S, Hegemann JD, Fage CD, Marahiel MA, Rebuffat S, Afonso C. General rules of fragmentation evidencing lasso structures in CID and ETD. Analyst 2018, 143 (5), 1157–1170. [DOI] [PubMed] [Google Scholar]
- 39.Brodbelt JS, Morrison LJ, Santos I. Ultraviolet Photodissociation Mass Spectrometry for Analysis of Biological Molecules. Chem Rev 2020, 120 (7), 3328–3380. [DOI] [PMC free article] [PubMed] [Google Scholar]
Associated Data
This section collects any data citations, data availability statements, or supplementary materials included in this article.


