

Abstract
Background & Aims:
Non-alcoholic steatohepatitis (NASH) represents the fastest growing underlying cause of hepatocellular carcinoma (HCC) and has been shown to impact immune effector cell function. The standard of care for the treatment of advanced HCC is immune checkpoint inhibitor (ICI) therapy, yet NASH may negatively affect the efficacy of ICI therapy in HCC. The immunologic mechanisms underlying the impact of NASH on ICI therapy remain unclear.
Methods:
Here, using multiple murine NASH models, we analyzed the influence of NASH on the CD8+ T cell-dependent anti-PD-1 responses against liver cancer. We characterized CD8+ T cells’ transcriptomic, functional, and motility changes in normal (ND) and NASH diet.
Results:
NASH blunted the effect of anti-PD-1 therapy against liver cancers in multiple murine models. NASH caused a proinflammatory phenotypic change of hepatic CD8+ T cells. Transcriptomic analysis revealed changes related to NASH-dependent impairment of hepatic CD8+ T cell metabolism. In vivo imaging analysis showed reduced motility of intra-tumoral CD8+ T cells. Metformin treatment rescued the efficacy of anti-PD-1 therapy against liver tumors in NASH.
Conclusions:
Our study discovered a critical regulation of CD8+ T cell metabolism in ICI therapy for liver cancer in the context of NASH, a finding with potential implications for treating liver cancer patients with NASH.
Keywords: liver cancer, metabolic syndrome, NASH immunology, immunometabolism, hepatic intravital imaging, hepatic transcriptomics
Lay Summary
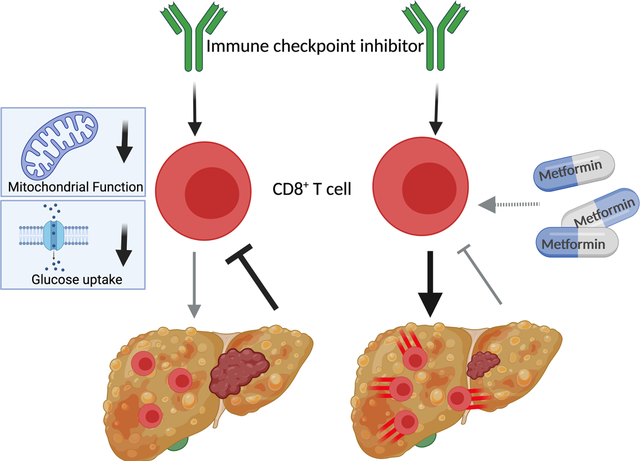
Non-alcoholic fatty liver disease impairs motility, metabolic function and response to anti-PD-1 treatment of hepatic CD8+ T cells, which can be rescued by metformin treatment.
Graphical Abstract
Introduction
Liver cancer remains a global health challenge and its incidence is growing worldwide. Recent estimates report that >1 million individuals will be affected by liver cancer annually by 2025 (1). Even though hepatitis B and C virus infection remain the most prominent risk factors for hepatocellular carcinoma (HCC) development (1), non-alcoholic steatohepatitis (NASH), which is associated with metabolic syndrome or diabetes mellitus, represents the fastest growing etiology for HCC, particularly in the western world (2). Currently the estimated annual incidence of HCC ranges from 0.5% to 2.6% among patients with NASH cirrhosis (3).
Immune checkpoint inhibitors (ICIs) are widely used to treat different cancers (4). Monoclonal antibodies targeting PD-1, PD-L1, and CTLA4 are FDA approved drugs for the treatment of HCC and represent the standard of care for patients with advanced disease (5). Recent data suggests that the underlying liver condition might negatively impact efficacy of ICI treatment in HCC (6, 7) and response to immunotherapy against other hepatic tumors (8). While obesity has been reported to enhance anti-PD-1/PD-L1 tumor therapy (9), a recent study by Pfister and colleagues demonstrated that anti-PD-1 therapy was less effective in mice with NASH driven HCC (10, 11).
Here, we investigated possible mechanisms how NASH impairs response of hepatic CD8+ T cells to anti-PD-1 treatment using different murine tumor models of NASH-HCC and liver metastasis (8). Importantly, these models allow for the differential analysis of anti-PD-1 treatment efficacy as well as immune cell phenotypes in mice with and without NASH.
Results
NASH impairs the effect of anti-PD-1 therapy against hepatic tumors.
We tested the efficacy of anti-PD-1 treatment in a syngeneic model of primary liver cancer. Mice were fed a choline-deficient L-amino-defined (CDAA) diet for 24 weeks or kept on normal diet (ND). CDAA diet caused an increase in bodyweight (Fig. S1A), AST (Fig. S1B) and steatosis (Fig. S1C+D), a typical histopathological change seen in the liver of individuals with NASH (12).
RIL-175 tumor cells were injected into livers of mice followed by 3 doses of anti-PD-1 treatment on days 5, 10 and 15 after tumor implantation. Tumor weights were evaluated on day 18 (Fig. 1A). As expected, anti-PD-1 therapy impaired growth of orthotopic tumors in mice kept on ND. In contrast anti-PD-1 treatment had no effect in mice with NASH and even resulted in a trend towards increased tumor growth (Fig. 1B and C).
Figure 1: NASH impairs anti-PD-1 therapy against liver cancer.
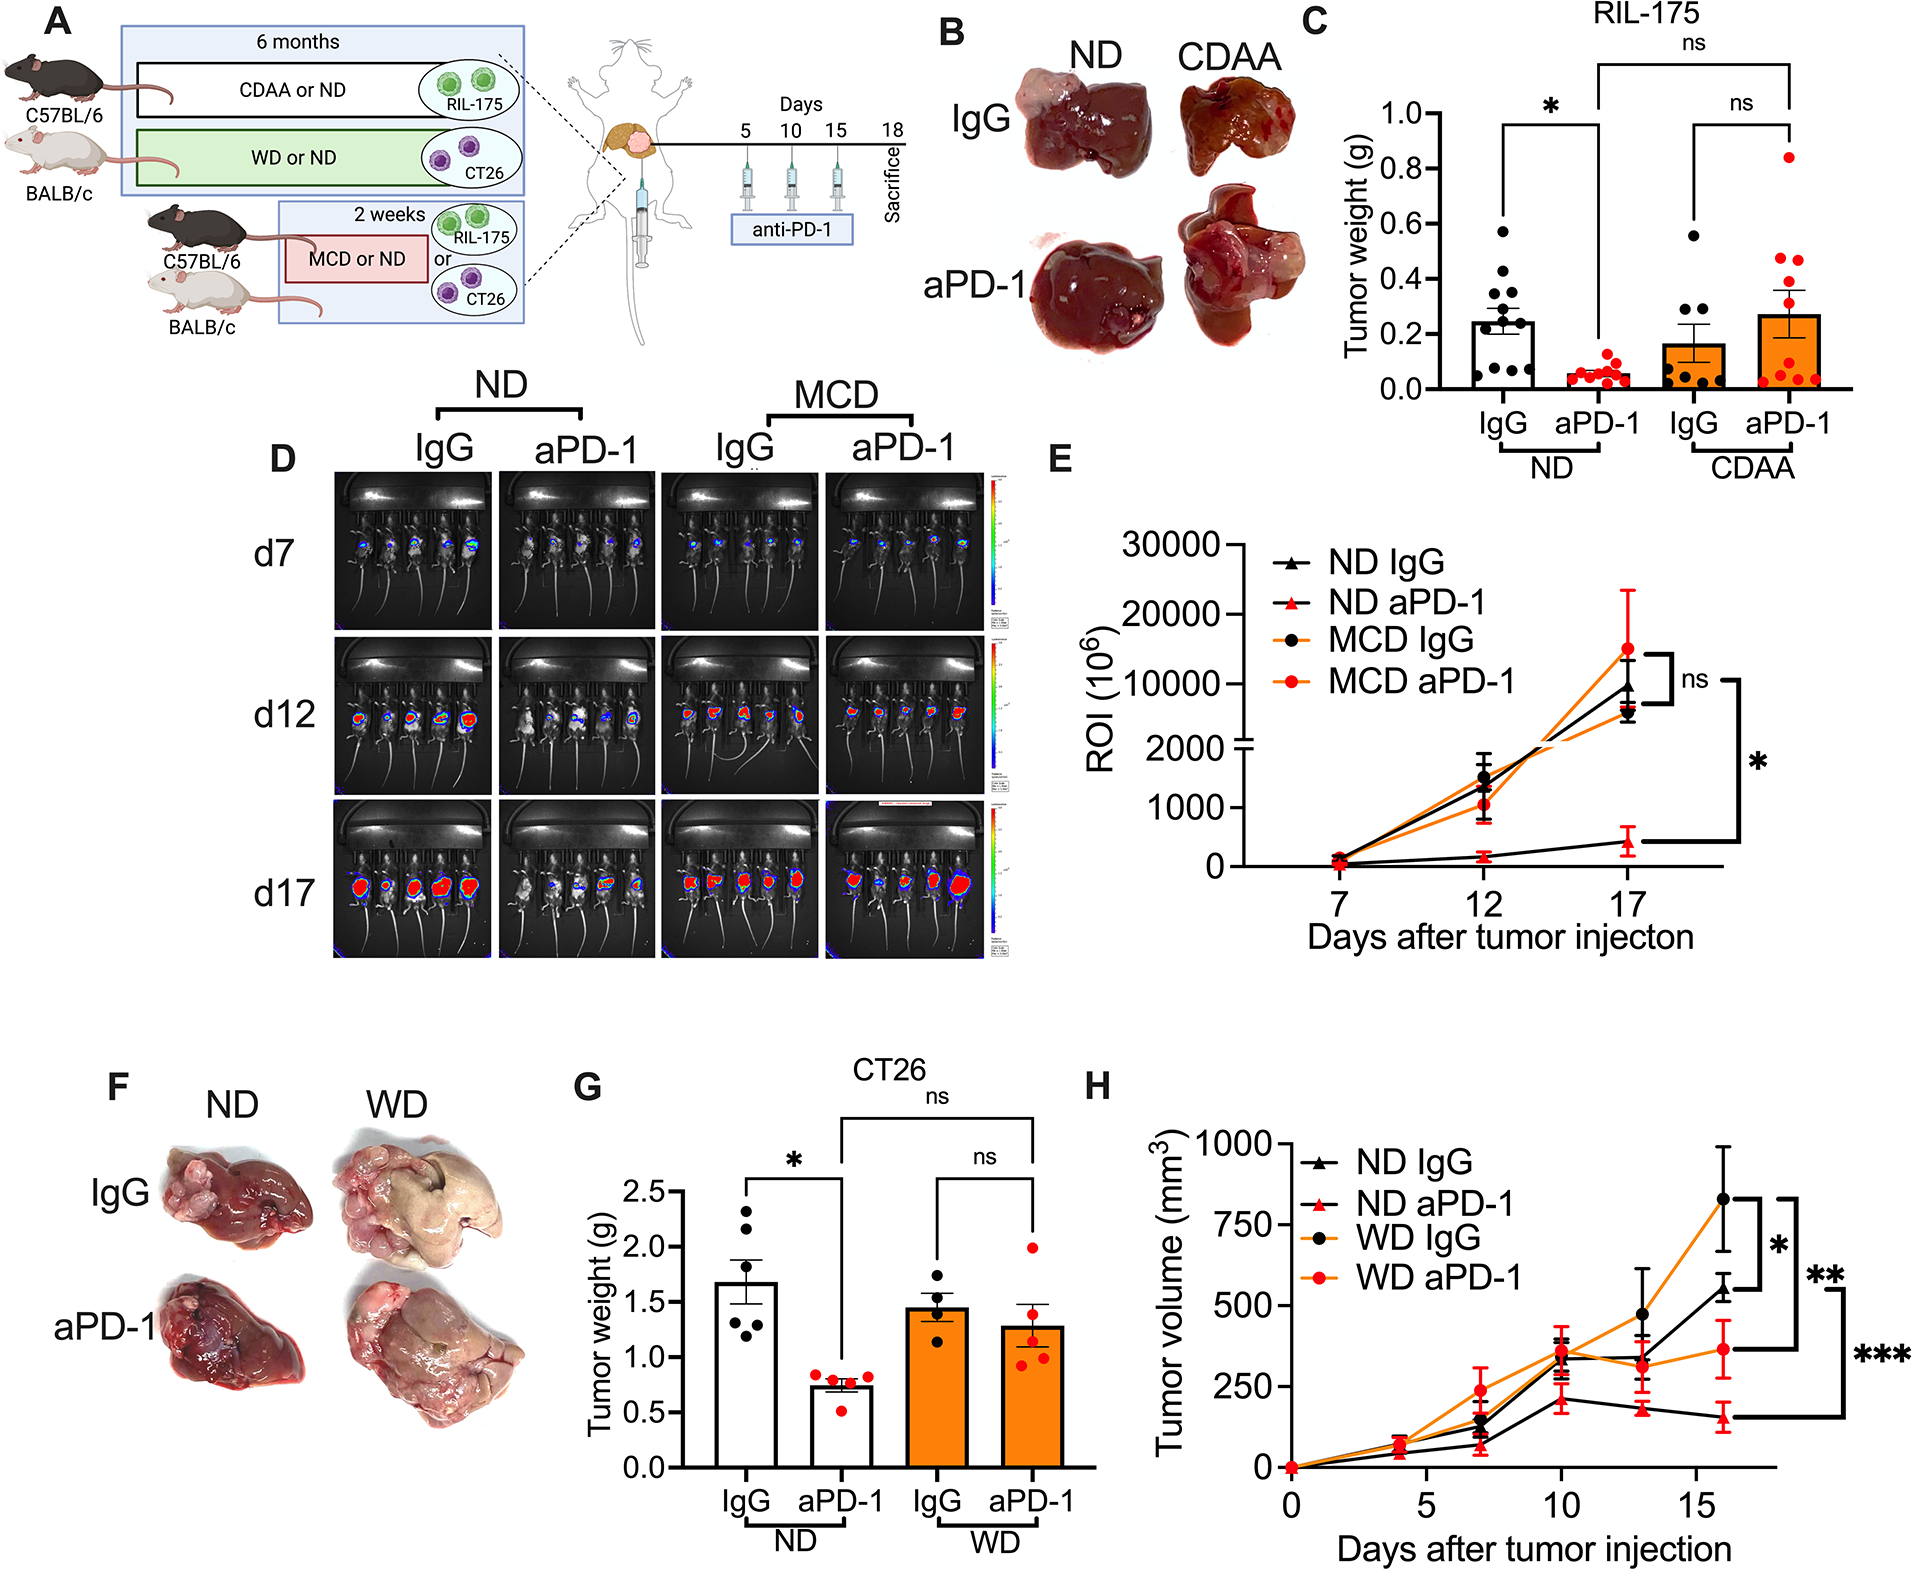
A. Experimental setup: NASH was induced by feeding C57BL/6 or BALB/c mice with CDAA or WD diet for 6 months or MCD diet for 2 weeks. Then intrahepatic injections of 2×10⁵ RIL-175 or CT26 tumor cells were performed to induce liver tumor in congenic mice. Tumor-bearing NASH mice were given i.p. injection of anti-PD-1 (200μg/mouse) at indicated time points.
B+C. End point assessment of intrahepatic RIL-175 tumors in CDAA or ND mice after anti-PD-1 treatment. Experimental setup is shown in (A). Representative liver pictures are shown in (B). Tumor weights were quantified (C). Data are presented as mean±s.e.m. from two independent experiments. ND IgG, n=12; ND anti-PD-1, n= 10; CDAA IgG, n=8; CDAA anti-PD-1 n=10. *p<0.05, one-way ANOVA with Tukey’s multiple comparisons test.
D+E. Tumor growth kinetics of intrahepatic RIL-175 tumors was monitored in MCD or ND mice following anti-PD-1 treatment using non-invasive bioluminescence imaging. Experimental setup is shown in (A). Representative images at indicated time points are shown in (D). Turmor burdens were quantifed in (E). Representative data from one experiment are presented as mean±s.e.m. Experiments were repeated twice. n=5 per group. *p<0.05 one-way ANOVA with Tukey’s multiple comparisons test.
F+G. End point assessment of intrahepatic CT26 tumors WD or ND mice after anti-PD-1 treatment. Experimental setup is shown in (A). Representative liver pictures are shown in (F). Tumor weights were quantified in (G). Representative data from one experiment are presented as mean±s.e.m. Experiments were repeated twice. ND IgG, n=6; ND anti-PD-1, n= 5; WD IgG, n=4; WD anti-PD-1 n=5. *p<0.05, one-way ANOVA with Tukey’s multiple comparisons test.
H. Tumor growth curve of s.c. RIL-175 tumors in WD or ND mice given anti-PD-1 treatment. Experimental setup is shown in Fig. S2C. Representative data from one experiment are presented as mean±s.e.m. Experiments were repeated twice. n=5 per group. *p<0.05, one-way ANOVA with Tukey’s multiple comparisons test.
Next, we depleted CD4+ and CD8+ T cells in mice kept on ND to identify the T cell subset mediating the effect of anti-PD-1 treatment (Fig. S1E). Depleting CD8+ T cells attenuated the effect of anti-PD-1 treatment on tumor growth (Fig. S1F+G), whereas depletion of CD4+ T cells had minimal effects (Fig. S1H+I). Thus, the effect of anti-PD-1 treatment on intrahepatic RIL-175 depended on CD8+ T cells. For this reason, we decided to study the effect of NASH on CD8+ T cell function and anti-PD-1 treatment in more detail.
To further confirm our initial observation, we repeated the study using two other dietary NASH models, one other cell line and a different genetic mouse strain (Fig. 1A). We used a methionine/choline deficient (MCD) diet, which has previously been described by us and others to induce NASH in mice (6, 13). Presence of NASH was confirmed by liver histology (Fig. S1J) and elevated serum ALT (Fig. S1K). Tumor growth kinetics were monitored using non-invasive bioluminescence imaging(14). Again, anti-PD-1 treatment impaired growth of intrahepatic RIL-175 tumors in mice on ND but not in NASH mice kept on MCD diet (Fig. 1D+E). A similar observation was made in a second mouse strain (BALB/c) using a different cell line (CT26) and a third diet (Western diet, (WD)) to induce NASH(15). The murine colon CT26 tumor cell line was chosen based on fact that that the liver is a common metastatic site for colorectal cancer(16). BALB/c mice were kept on WD for 6 months(17) (Fig. 1A) which caused significant increase of body weight (Fig. S1L) and the presence of NASH was confirmed by histology (Fig. S1M+N). Again, anti-PD-1 therapy failed to impact growth of intrahepatic CT26 tumors in mice kept on WD diet, but effectively impacted CT26 tumor growth in mice on ND (Fig. 1R+S). To determine whether NASH would also impact anti-PD-1 mediated immune responses outside the intrahepatic environment, we established subcutaneous (s.c.) RIL-175 tumors in mice kept on WD, followed by anti-PD-1 treatment (Fig. S1O). Anti-PD-1 treatment effectively impaired tumor growth (Fig. 1H) and tumor weights (Fig. S1P+Q) of s.c. RIL-175 tumors in mice kept on ND and WD. Of interest, IgG WD mice had a higher tumor burden than IgG ND mice as previously described by others(18, 19). In summary, using three different NASH models and two anti-PD-1 responsive liver tumor models in two different mouse strains, our results demonstrate that NASH impairs the effect of anti-PD-1 treatment against liver cancers.
CD8+ T cells are activated in NASH liver.
Next, we investigated hepatic CD8+ T cells in mice with NASH in more detail. The frequency of hepatic CD8+ T cells with a CD44+CD62L− effector memory phenotype increased in the liver of tumor-free mice kept on three different NASH inducing diets (CDAA and WD Fig. 2A–C and MCD, Fig. S2A). Tim3+PD-1+ CD8+ T cells have been described as exhausted CD8+ T cells(20). We found higher frequencies of Tim3+PD-1+CD8+ T cells in the liver than in the spleen of mice and the frequency of Tim3+PD-1+CD8+ T cells increased further in mice with NASH (Fig. 2D–F, Fig. S2B). Furthermore, there was an increase in IFNγ+TNFα+ hepatic CD8+ T cells in all the three NASH models (Fig. 2G–I, Fig. S2C). Interestingly, this increase was only seen in the liver, but not the spleen. Further analysis demonstrated more Granzyme B+CD8+ T cells in mice with NASH (Fig. 2J–L, Fig. S2D). Consistent with a recent report, CXCR6+CD8+ T cells were increased in NASH compared to mice kept on ND (Fig. S2E–G)(21).
Figure 2: NASH causes an aberrant CD8+ T cell activation in liver but does not affect CD8+ T cell immune phenotype in liver tumor upon anti-PD-1 treatment.
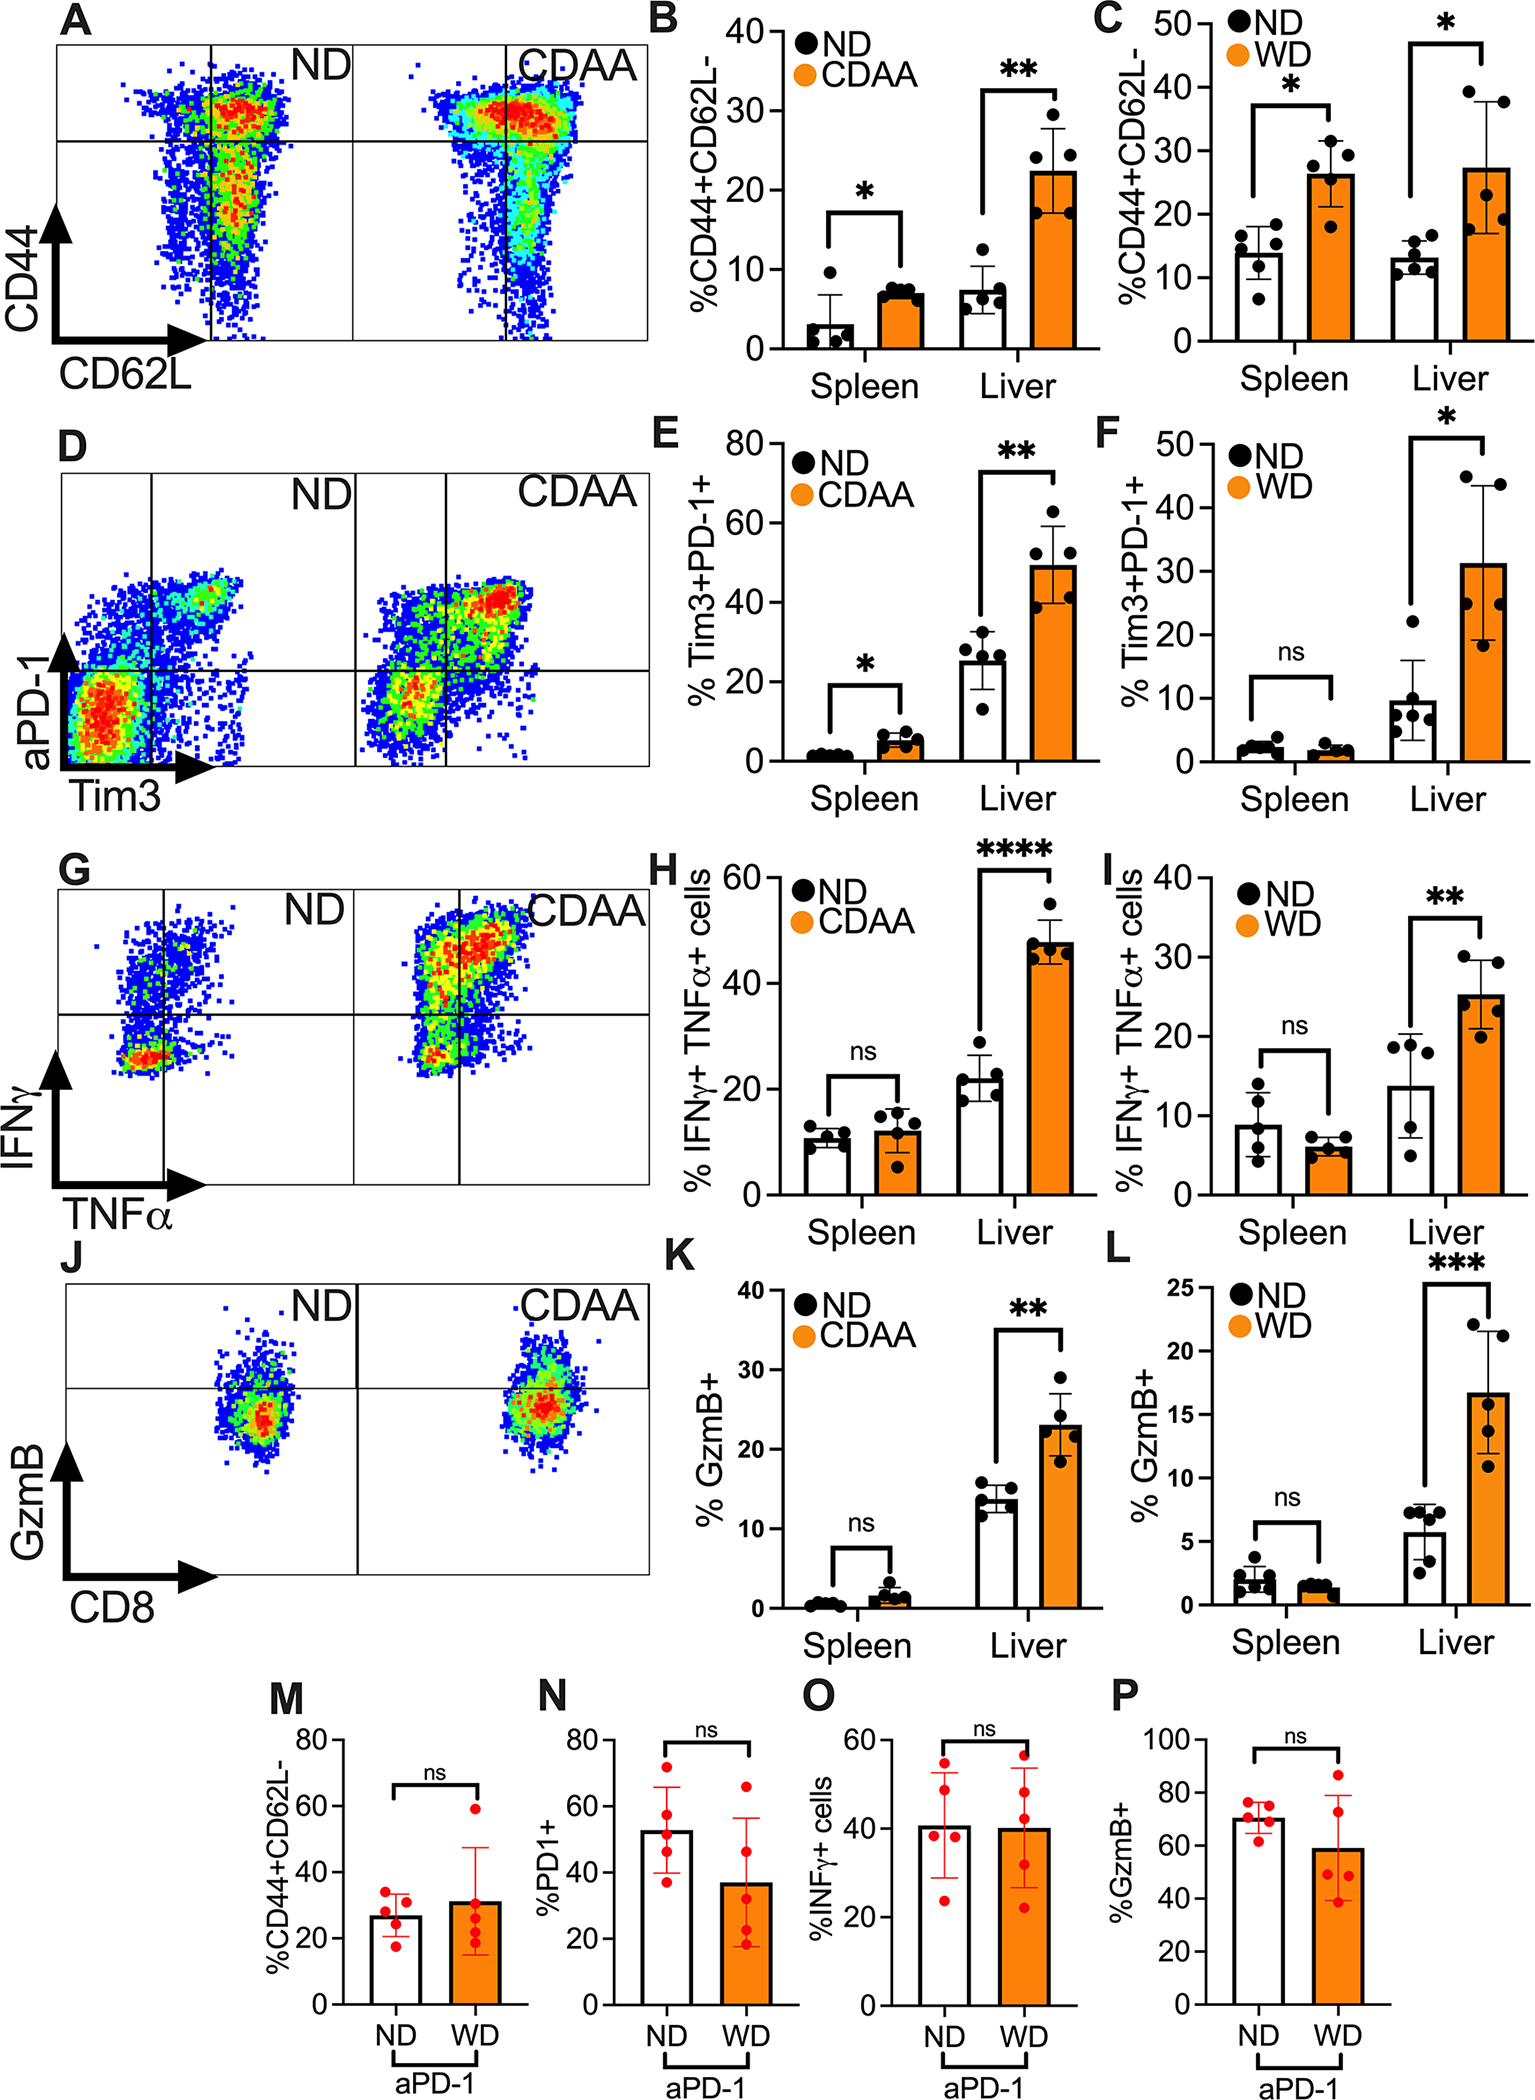
A-C. Effector memory phenotyping of CD8+ T cells were assessed by flow cytometry CD44 and CD62L staining. Representative contour plots of hepatic CD44+CD62L−CD8+ T cells (gated on CD3+CD8+ cells) from CDAA or ND mice are shown in (A). Hepatic and splenic CD44+CD62L−CD8+ T cells from NASH mice fed with CDAA (B) or WD (C) were quantified. Representative data from one experiment are presented as mean±s.e.m. Experiments were repeated twice. In (B), n=5 per group. In (C), Spleen ND, n=6; Spleen WD, n= 5; Liver ND, n=6; Liver WD, n=5. *p<0.05, **p<0.01, student’s t-test.
D-F. Exhaustion CD8+ T cells were measured by PD-1 and Tim3 flow cytometry staining. Representative contour plot of hepatic PD-1+Tim3+CD8+ T cells of CDAA or ND mice are shown in (D). Hepatic and splenic PD-1+Tim3+CD8+ T cells from NASH mice fed with CDAA (F) or WD (G) were quantified. Representative data from one experiment are presented as mean±s.e.m. Experiments were repeated twice. In (E), n=5 per group. In (F), Spleen ND, n=6; Spleen WD, n= 5; Liver ND, n=6; Liver WD, n=5. *p<0.05, ***p<0.001, student’s t-test.
G-I. Cytokine produciton of CD8+ T cells were determined by measuring IFNγ+TNFα+CD8+ T cells after ex vivo stimulation with PMA/Ionomycin for 4h. Representative contour plot of hepatic IFNγ+TNFα+CD8+ T cells of CDAA or ND are shown in (G). Hepatic and splenic IFNγ+TNFα+CD8+ T cells from NASH mice fed with CDAA (H) or WD (I) were quantified. Representative data from one experiment are presented as mean±s.e.m. Experiments were repeated twice. In (H), n=5 per group. In (I), Spleen ND, n=6; Spleen WD, n= 5; Liver ND, n=6; Liver WD, n=5. **p<0.01, ***p<0.001, student’s t-test.
J-L. Expression of cytotoxic molecule Granzyme B in CD8+ T cells was measured by flow cytometry. Representative contour plot of hepatic Granzyme B+CD8+ T cells of CDAA or ND mice are shown in (J). Hepatic and splenic Granzyme B+CD8+ T cells from NASH mice fed with CDAA (K) or WD (L) were quantified. Representative data from one experiment are presented as mean±s.e.m. Experiments were repeated twice. In (H), n=5 per group. In (L), Spleen ND, n=6; Spleen WD, n= 5; Liver ND, n=6; Liver WD, n=5. **p<0.01, ***p<0.001, student’s t-test.
M-P. Upon anti-PD-1 treatment, the infulence of NASH on immune phenotype of tumor infiltering CD8+ T cells was assessed. Levels of CD44+CD62− (M), PD-1+ (N), IFNγ+ (O) and Granzym B+ (P) in tumor infiltrating CD8+ T cells were measued in WD compared to ND mice. For IFNγ staining, cells were stimulated ex vivo with PMA/Ionomycin for 4h. Representative data from one experiment are presented as mean±s.e.m. Experiments were repeated twice. n=5 per group. student’s t-test.
Next, we evaluated the effect of NASH on tumor infiltrating CD8+ T cells in mice with hepatic tumors with and without NASH. Immunofluorescence staining for CD8+ T cells on liver tumor sections was performed, and the number of CD8+ T cells was counted. The frequency of tumor infiltrating CD8+ T cells was similar in mice with and without NASH in two tumor models (Fig. S2H–K). Phenotypic analyses by flow cytometry revealed an increase in the frequencies of CD44+CD62L−%, Tim3+% and Granzyme B+% in tumor infiltrating CD8+ T cells compared to CD8+ T cells isolated from the surrounding liver (Fig. S2L–N). Further analysis of tumor infiltrating CD8+ T cells after anti-PD-1 treatment revealed no difference between ND and NASH in the frequency of CD44+CD62L−, PD-1+, IFNγ+ and Granzyme B+ T cells (Fig. 2M–P). In summary and confirming prior reports (22), hepatic CD8+ T cells had an activated and proinflammatory phenotype in mice with NASH and we did not find significant alterations, which would potentially explain why anti-PD-1 treatment was less effective in mice with NASH.
Mobility of CD8+ T cells is impaired in NASH.
We were interested in further exploring differences in CD8+ T cells between ND- and NASH-fed mice. To observe these cells in real time, we utilized intravital imaging by 2-photon laser microscopy, a well-established method for in situ imaging of microenvironmental dynamics of a tumor (23). We performed in situ microscopy of CD8+ T cells in tumor bearing mice to better understand the impact of NASH on hepatic CD8+ T cells in vivo. NASH was induced by feeding mice WD diet for 6 months or MCD diet for 2 weeks in control experiments. Tumor cells were orthotopically injected and intravital microscopy was performed 10–12 days after tumors had been implanted. Fluorochrome conjugated anti-CD8 and anti-CD31 antibodies were injected to visualize CD8+ T cells and vasculature, respectively (Fig. 3A). Where indicated, studies were performed in CXCR6GFP mice (24, 25), which allowed us to include analysis of CXCR6 expression in our in vivo studies.
Figure 3: NASH induces an environment-independent reduction of CD8+ T cell motility in liver.
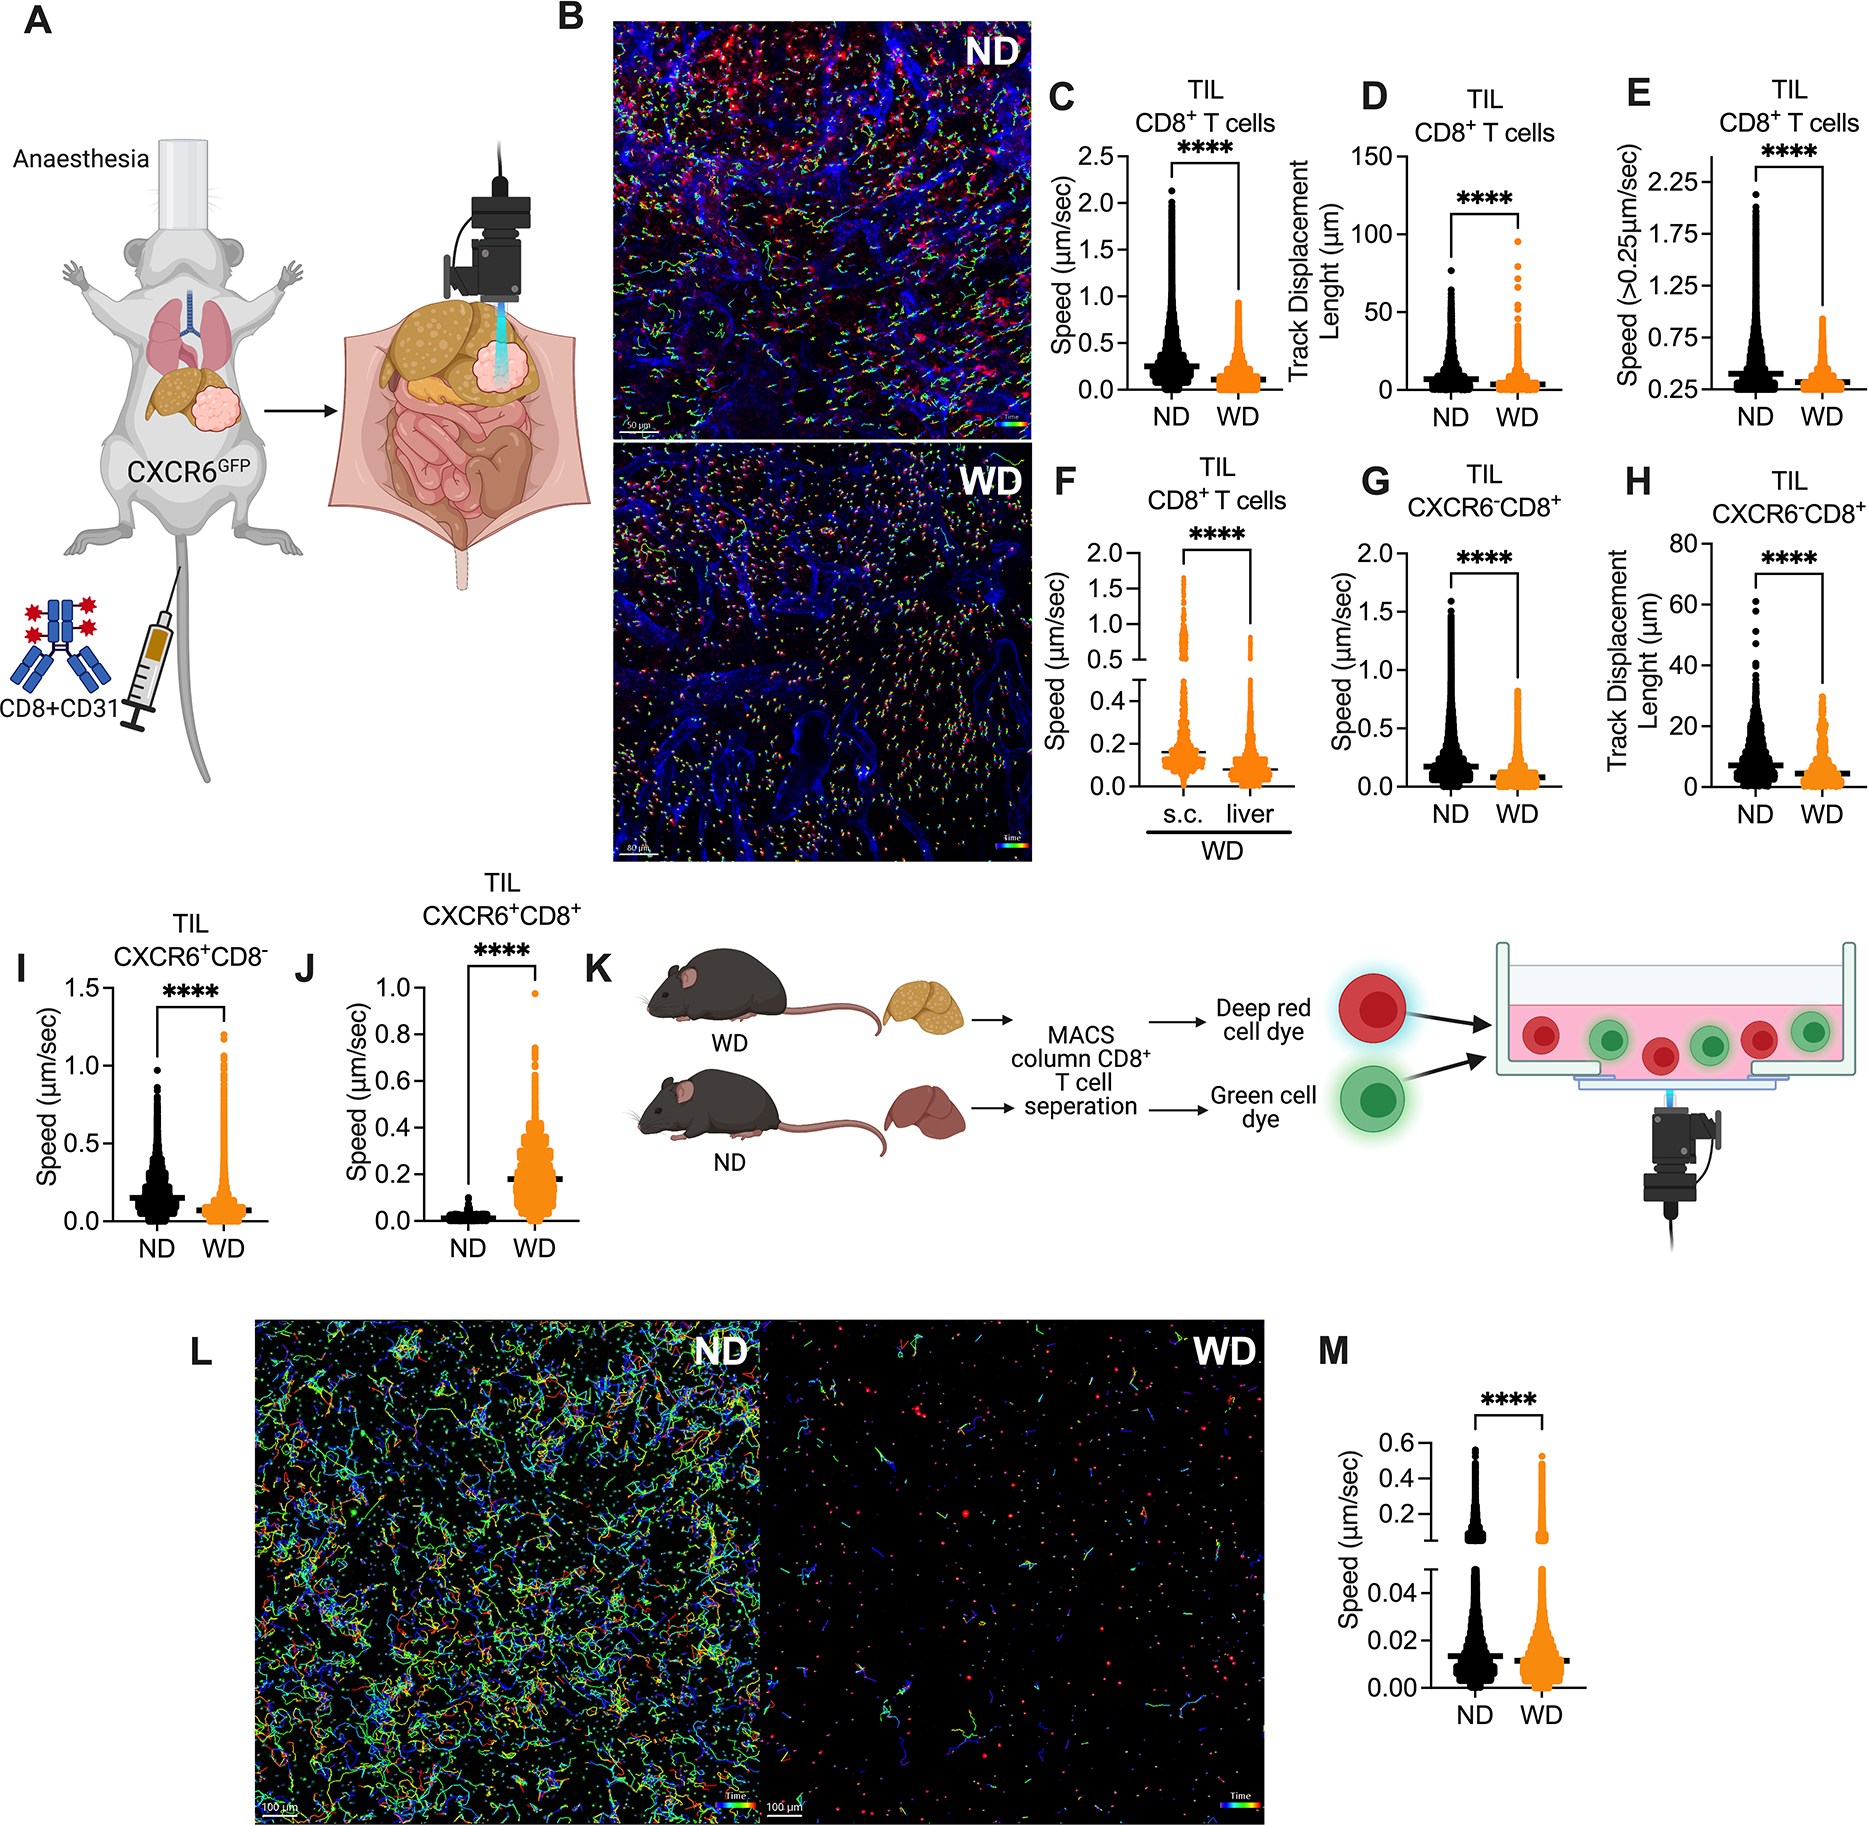
A. In vivo intravital imaging assay experimental setup: CXCR6GFP mice fed with WD or ND for 6 months were given intrahepatic injection of 2×10⁵ RIL-175. At day 10–12 after tumor injection, mice were i.v. injected with fluorochrome-coupled anti-CD8 and anti-CD31, and intravital multi-photon confocal microscopy microscopy was used to examine the dynamics of T cells in liver tumors.
B. Representative immunofluorescence images derived from automated tracking of tumor infiltrating CXCR6−CD8+ T in ND mice (upper section) and WD mice (lower section). Cell movement behavior measured over time using Imaris. Scale bar 50 μm.
C+D. Speed (C, μm/sec) and track displacement length (D, distance between first and last cell position in μm) of tumor infiltrating CD8+ T cells were measured by Imaris software in WD or ND CXCR6GFP mice. Representative data from one mouse are presented as mean. Imaging was repeated in 3 mice per group. ****p<0.0001, student’s t-test.
E. Speed (μm/sec) of moving tumor infiltrating CD8+ T cell of CXCR6GFP mice fed with WD or ND. Moving cells were defined by a mean speed of >0.25μm/sec. Representative data from one mouse are presented as mean. Imaging was repeated in 3 mice per group. ****p<0.0001, student’s t-test.
F. Speed (μm/s) of intrahepatic and s.c. tumor infiltrating CD8+ T cells in WD CXCR6GFP mice. Imaging was repeated in 3 mice per group. ****p<0.0001, student’s t-test.
G+H. Speed (G, μm/s) and track displacement length (H, distance between first and last cell position in μm) of tumor infiltrating CXCR6−CD8+ T cells (F, G) were measured by Imaris software in WD or ND CXCR6GFP mice. Representative data from one mouse are presented as mean. Imaing was repeated in 3 mice per group. ****p<0.0001, student’s t-test.
I+J. Speed (μm/sec) of tumor infiltrating CXCR6+CD8− (I) and CXCR6+CD8+ (J) cells were measured by Imaris software in WD or ND CXCR6GFP mice. Representative data from one mouse are presented as mean. Imaging was repeated in 3 mice per group. ****p<0.0001, student’s t-test.
K. In vitro imaging experimental setup: C57BL/6 mice fed with WD or ND for 6 months. Hepatic CD8+ T cells were isolated and stained with cell tracker green and cell tracker deep red and imaged in collagen+media overnight.
L. Representative immunofluorescence images derived from automated tracking of hepatic CD8+ T from ND (left section) and WD (right section) mice. Cell movement behavior was measured over time using Imaris. Scale bar 100μm.
M. Speed (μm/sec) of hepatic WD and ND CD8+ T cells in collagen+media imaged overnight and analyzed with Imaris. Representative data from one experiment are presented as mean±s.e.m. Experiments were repeated twice. ****p<0.0001, student’s t-test;
Intrahepatic tumors were identified due to their irregular CD31 staining (Fig. S3A) and fluorescent cells were followed in vivo. Cell movements were recorded for 60 minutes, which allowed to compute speed and distance between first and last cell position (track displacement, see Fig. 3B for representative image) of every labeled cell individually.
First, we studied intra-tumoral CD8+ T cells by in vivo microscopy in mice kept on ND and WD. CD8+ T cells demonstrated a higher speed in mice on ND (video 1) than in mice with WD-induced NASH (video 2, Fig. 3C). Similarly, CD8+ T cells in mice with NASH displayed a shorter track displacement length (Fig. 3D). We noticed that some intra-tumoral CD8+ T cells appeared to remain resident and did not show signs of motility while others were moving rapidly. To compare only motile CD8+ cells, we performed a focused analysis limited to cells with a speed of greater than 0.25 μm/sec and again noticed that their mean speed was higher in mice with ND vs. WD (Fig. 3F). Similar results on tumor infiltrating CD8+ T cells were also found in a second NASH model using a different tumor model (CT26) as shown in (video 3+4, Fig. S3B–D). The impaired mobility was also seen in hepatic CD8+ T cells (Fig. S3E+F).
To evaluate if the reduced mobility of CD8+ T cells is specific to intrahepatic tumors we performed intravital imaging of s.c. tumors in WD and ND mice. Again, CD8+ T cell mobility in s.c. tumors of WD (video 5) vs. ND (video 6) mice was decreased (Fig. S3G+H). However, comparing the speed of CD8+ T cells in s.c. vs intrahepatic tumors in WD mice, revealed a significant reduction of cell speed in intrahepatic tumors (Fig. 3F).
Use of CXCR6GFP mice allowed us to study CXCR6+CD8+ T cells and CXCR6−CD8+ T cells separately, which was of specific interest since CXCR6+CD8+ T cells were recently reported to promote NASH (21). In addition, this also gave rise to the possibility to visualize CD8− cells in the same experiment. Flow cytometry analysis of hepatic mononuclear cells from a naïve mouse indicated that the majority of CXCR6+CD8− cells in livers of CXCR6GFP mice were NKT cells (Fig. S3I). Similar to our in vivo analysis on bulk CD8+ T cells, we observed an impaired motility and track displacement of intra-tumoral CXCR6−CD8+ T cells in mice with NASH (Fig. 3G+H). Restricting the analysis to cells with a speed of greater than 0.25 μm/sec supported our findings and showed a higher speed of CXCR6−CD8+ T cells in mice kept on ND (Fig. S3J). Next, we studied CXCR6+CD8− cells and also noticed lower speed and shorter track displacement length in mice kept on WD (video 7+8, Fig. 3I and Fig S3K+L). Finally, we studied CXCR6+CD8+ T cells, which demonstrated a higher speed and longer track displacement length in mice kept on WD (Fig. 3J and Fig. S3M).
We also studied T cell movement ex vivo to evaluate if NASH-dependent changes in the liver environment such as architectural changes or changes in the cytokine and chemokine milieu were responsible for the changes in CD8+ T cell motility observed in vivo. We isolated hepatic CD8+ T cells from mice kept on WD or ND and labeled cells with a red and green fluorescent dye respectively. Differentially labelled CD8+ T cells from mice kept on ND and WD were mixed in collagen without any chemokine or cytokine supplement, and their movement was monitored ex vivo (Fig. 3K). CD8+ T cells from ND mice showed spontaneous crawling with frequent change of direction. In contrast, CD8+ T cells derived from WD mice showed reduced speed and a shorter mean track displacement length (video 9, Fig. 3M and Fig S3N). In summary our studies suggest that NASH decreases the motility of intra-tumoral CD8+ T cells in vivo through a mechanism independent of chemotaxis or cell adhesion.
NASH reduces mitochondrial fitness of hepatic CD8+ T cells.
Regulation of T cell metabolism has been recognized to be critical in controlling anti-tumor function (26) and various studies have highlighted important contributions of cellular metabolism to drive and modulate anti-PD-1 induced immune responses (27). Furthermore lymphocyte mobility is regulated by the metabolic condition of T cells (28). However, it is still unknown how NASH, characterized by dysregulation of lipid metabolism in the liver, affects the metabolism of hepatic CD8+ T cells. We studied the transcriptional profile of hepatic CD8+ T cells in mice with and without NASH before and after anti-PD-1 treatment. Here we used a NanoString NCounter Metabolic Pathway Panel targeting pathways involved in cell metabolism including metabolic signaling, biosynthesis, anabolic pathways and cell stress. Unsupervised clustering analysis revealed a clear distinction between CD8+ T cells derived from mice kept on MCD and ND. Furthermore, CD8+ T cells derived from mice kept on ND clearly separated into two different clusters dependent on anti-PD-1 treatment, which was not as obvious in mice kept on MCD and with NASH (Fig. 4A). Pathway scoring analysis revealed alteration of key metabolic pathways. Pathway scores for glycolysis, fatty acid oxidation and mitochondrial respiration in CD8+ T cells derived from mice with NASH (Fig. S4A–C). Interestingly, lysosomal degradation, cytokine and chemokine signaling, or TCR and costimulatory signaling pathway scores were comparable between anti-PD-1 treatment in CD8+ T cells derived from mice with NASH in contrast to CD8+ T cells from mice kept on ND (Fig. S4D–F).
Figure 4: NASH impairs CD8+ T cell metabolic fitness.
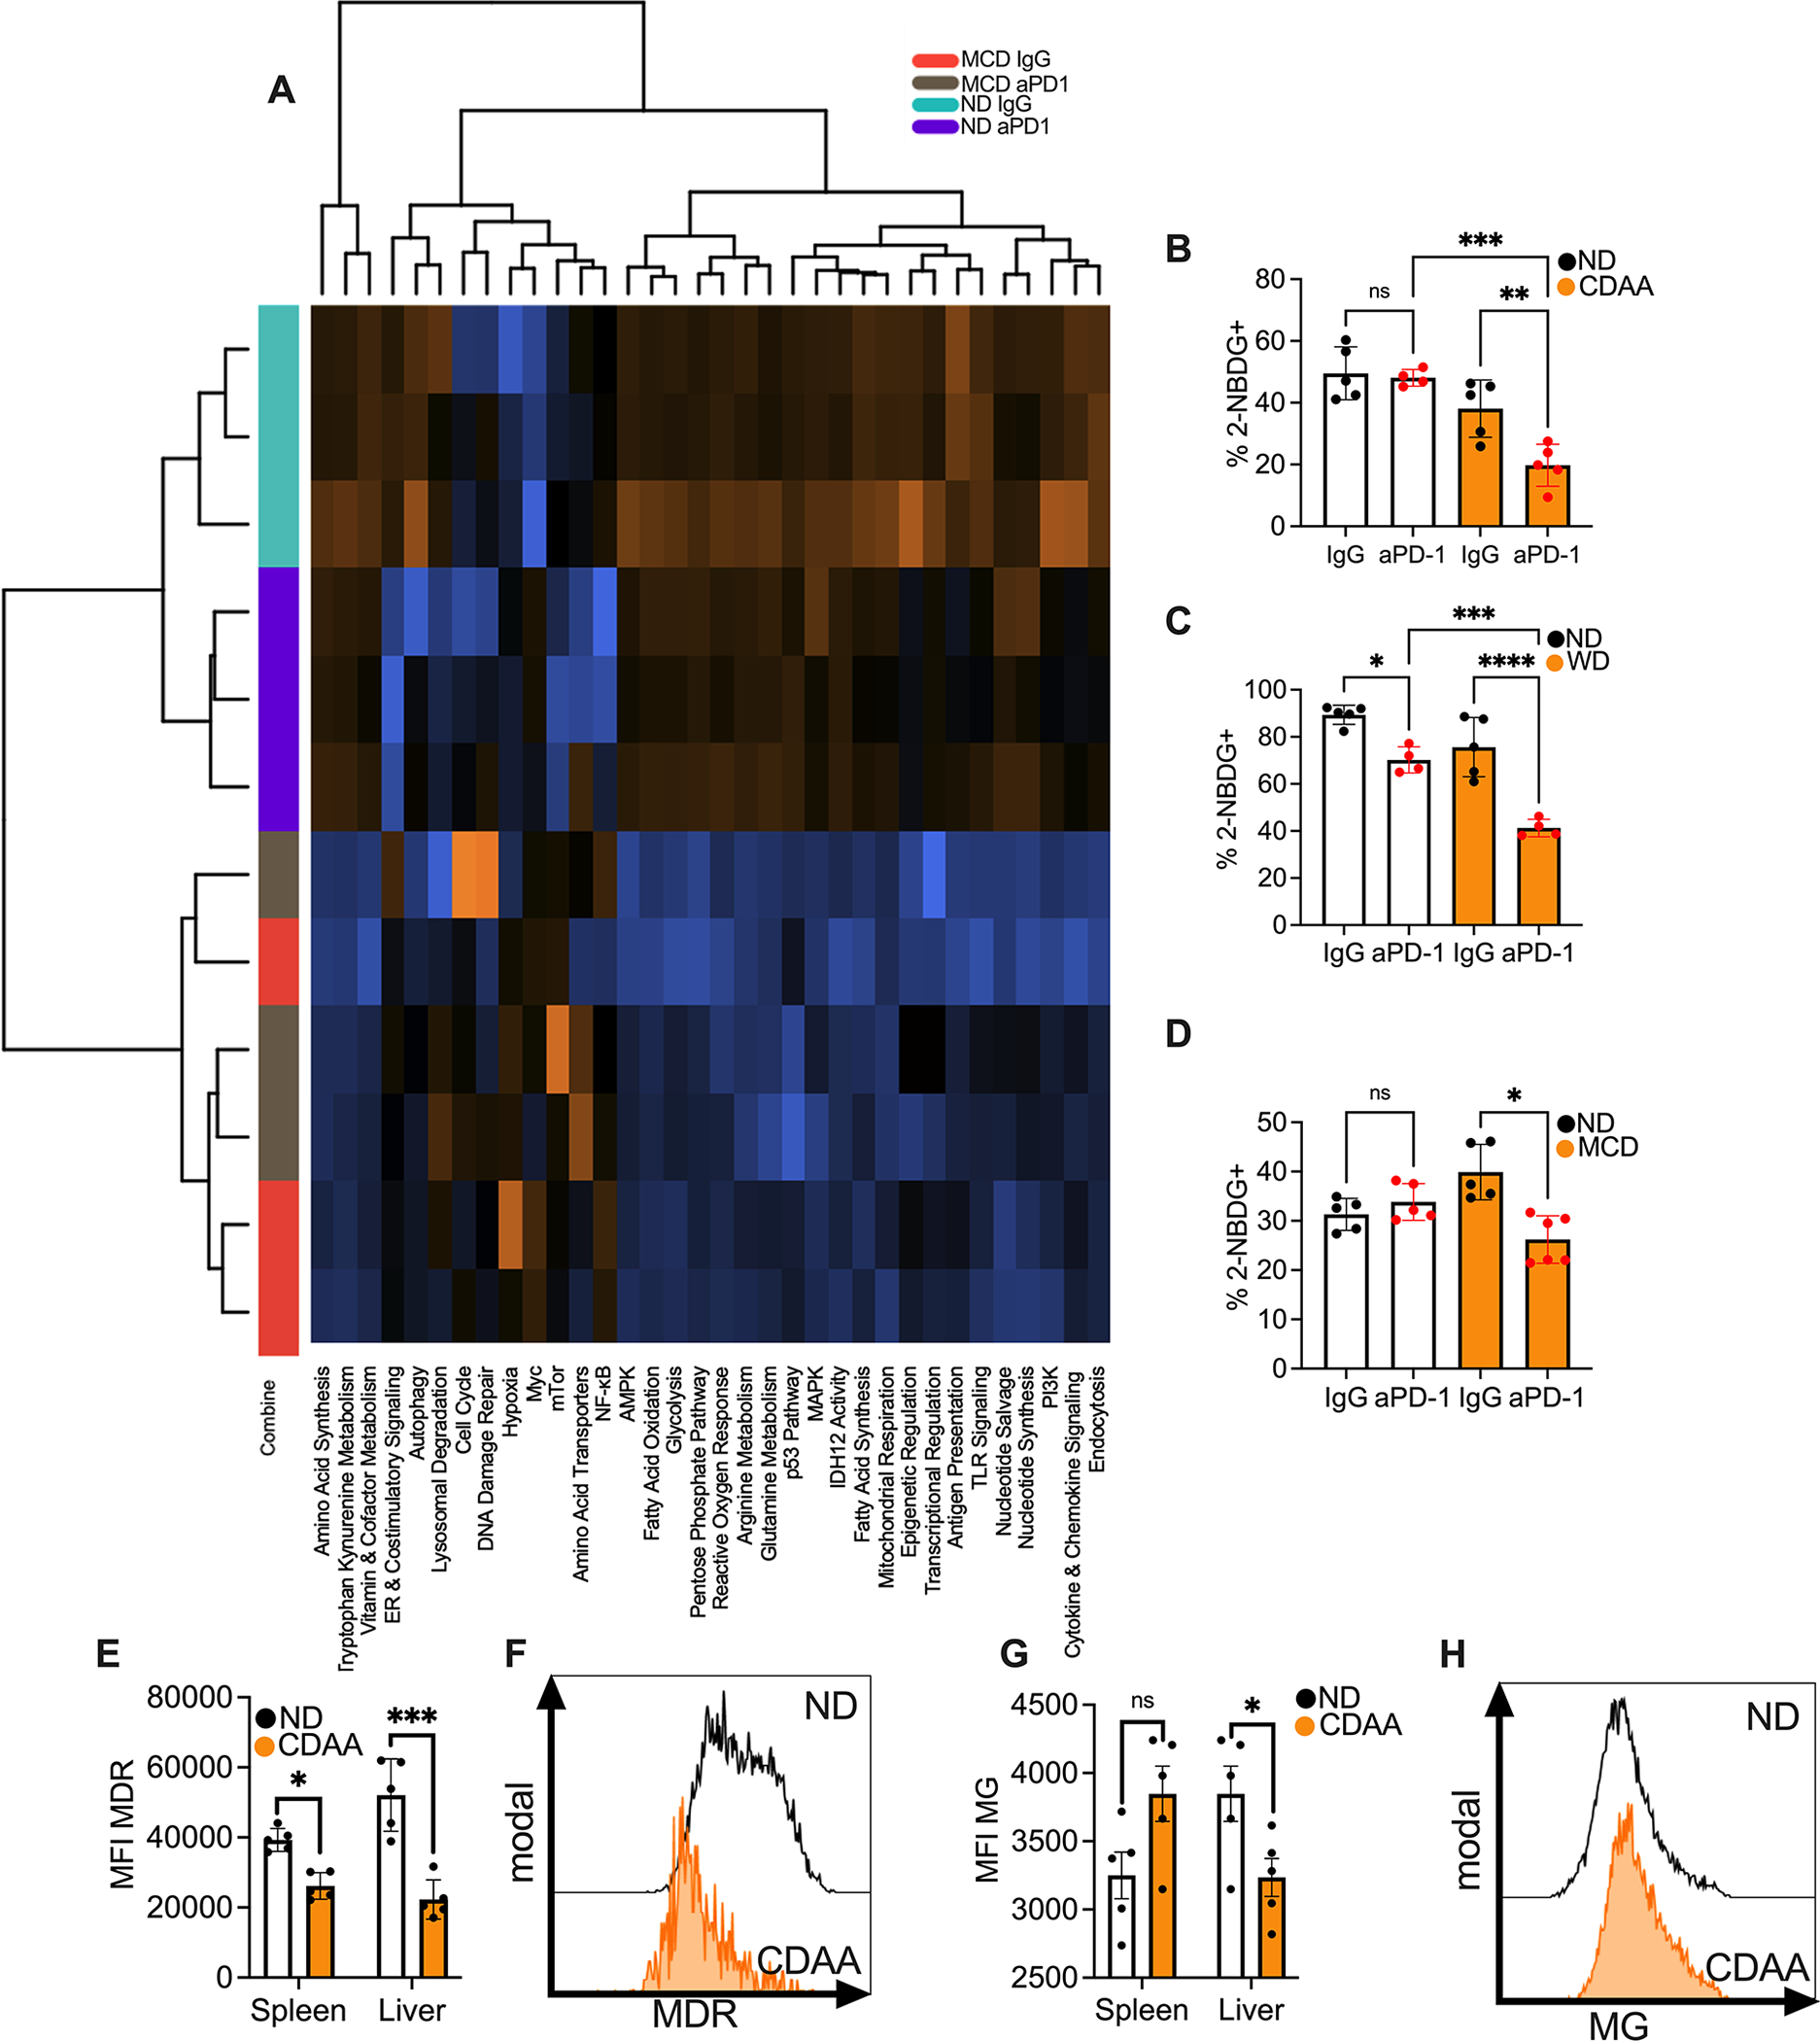
A. Pathway analysis of hepatic CD8+ T cells of mice fed with MCD or ND and treated with anti-PD-1. Hepatic CD8+ T cells from three mice were pooled per sample (n=3 per group) for RNA isolation. Hepatic CD8+ T cells were sorted and sequenced using nCounter® the metabolic pathways panel. Hierarchical clustering was used to group pathways.
B. Percentage of 2-NBDG staining of hepatic CD8+ T cells of C57BL/6 fed with ND or CDAA and treated with anti-PD-1. Representative data from one experiment are presented as mean±s.e.m. Experiments were repeated twice. ND IgG, n=6; ND anti-PD-1, n= 4; CDAA IgG, n=5; CDAA anti-PD-1 n=5. **p<0.01, ***p<0.001, one-way ANOVA with Tukey’s multiple comparisons test.
C. Percentage of 2-NBDG staining of hepatic CD8+ T cells of BALB/C fed with ND or WD and treated with anti-PD-1. Representative data from one experiment are presented as mean±s.e.m. Experiments were repeated twice. ND IgG, n=5; ND anti-PD-1, n= 4; WD IgG, n=5; WD anti-PD-1 n=4. ***p<0.001, ****p<0.0001, one-way ANOVA with Tukey’s multiple comparisons test.
D. Percentage of 2-NBDG staining of hepatic CD8+ T cells of C57BL/6 fed with ND or MCD and treated with anti-PD-1. Representative data from one experiment are presented as mean±s.e.m. Experiments were repeated twice. ND IgG, n=5; ND anti-PD-1, n= 4; MCD IgG, n=5; MCD anti-PD-1 n=6. *p<0.05, one-way ANOVA with Tukey’s multiple comparisons test.
E. MFI of MitoTracker deep red staining (MDR) of hepatic and splenic CD8+ T cells of mice fed with ND or CDAA. Representative data from one experiment are presented as mean±s.e.m. Experiments were repeated twice. n=5 per group. *p<0.05, ***p<0.001, student’s t-test.
F. Representative histogram of MitoTracker deep red staining of hepatic CD8+ T cells of C57BL/6 fed with ND or CDAA.
G. MFI of mitotracer green (MG) of hepatic and splenic CD8+ T cells of mice fed with ND or CDAA. Representative data from one experiment are presented as mean±s.e.m. Experiments were repeated twice. n=5 per group. *p<0.05, student’s t-test.
H. Representative histogram of Mitotracker green staining of hepatic CD8+ T cells of C57BL/6 fed with ND or CDAA.
Next we wanted to confirm the results of the NanoString NCounter Metabolic Pathway Panel of mice keeped on MCD and ND in a second NASH model. Volcano plot analysis was used to identify genes related to pathways altered in CD8+ T cells derived from mice with NASH (Fig. S4G–I). 4 genes (Pck1, Adh4, Fbp1 and Adh1) related to glycolysis, fatty acid oxidation and mitochondrial respiration pathways from the Nanostring panel were chosen and lower expression of these genes was verified in CD8+ T cells derived from mice kept on CDAA diet (Fig. S4J–M).
Next, impaired metabolic function of CD8+ T cells derived from mice with NASH was confirmed in functional assays. Glycolysis is often tested by monitoring cell uptake of 2-NBDG, a fluorescent glucose analog (29). As expected, 2-NBDG uptake was reduced in hepatic CD8+ T cells derived from mice with NASH (Fig. 4B–D). Mitochondrial mass (30) and membrane polarization (31) was measured using Mitotracker Green and Deep Red staining. Mitochondrial membrane potential indicates the capacity of the mitochondria to generate ATP by oxidative phosphorylation (32). Consistent with our results from NanoString analysis, mitochondrial depolarization and mitochondrial mass of hepatic CD8+ T cells were significantly impacted in CD8+ T cells from mice with NASH (Fig. 4E–H). These finding were further confirmed using mice kept on two different diets (Fig. S4N–S). In summary, transcriptomic profiling as well as functional studies of T cell metabolism revealed metabolic dysfunction of CD8+ T cells from mice with NASH.
Metformin restores anti-PD-1 treatment efficacy in NASH.
Metformin is well known for its glucose-lowering action. However, there is accumulating data indicating that metformin’s main mechanism of action is alteration of energy metabolism within the cell(33). It has previously been shown to induce metabolic reprograming of CD8+ T cells and to empower them to contain bacterial infections(34). Therefore, we decided to evaluate the effect of metformin treatment on CD8+ T cells in mice with NASH. Naïve mice were kept on MCD diet for 2 weeks before metformin treatment was initiated. 2 weeks later hepatic CD8+ T cells were isolated and we quantitatively analyzed mRNA expression of a set of genes that were previously identified to be differentially expressed in mice with and without NASH (Fig. S4G–I). An increased expression of Mpc1, Pck1 and Aldh4 was noted in CD8+ T cells with metformin treatment (Fig. 5A–C). No changes were observed for Fbp1, Aldh2 and Aldh1 (Fig. S5A–C). The effect of metformin on mitochondrial function of hepatic CD8+ T cells was further investigated using MitoTracker Deep Red and Green staining. Although metformin did not change mitochondrial depolarization (Fig. S5D+E), it did increase MitroTracker Green level of hepatic CD8+ T cells in NASH (Fig. 5D–F), suggesting an increased mitochondrial mass and overall higher mitochondrial functional capacity. Next, we examined the effect of metformin treatment on CD8+ T cell mobility as a functional readout for T cell fitness. We performed ex vivo imaging of isolated hepatic CD8+ T cells after metformin treatment in mice with NASH (video 10). Interestingly, metformin therapy increased both cell speed (Fig. 5G) and track displacement length (Fig. 5H) ex vivo. To evaluate the capacity of metformin treatment to improve mitochondrial function of CD8+ T cells we performed seahorse analysis. Indeed, oxidative consumption rate in CD8+ T cells was decreased in NASH compared to ND and rescued by metformin treatment (Fig. 5I). In contrast metformin treatment had no effect on the extracellular acidification rate in CD8+ T cells (Fig. S5F). In line with previous reports (35), our results suggest that metformin can improve CD8+ T cells metabolic function and this can potentially lead to improved CD8+ T cell response to ICI therapy.
Figure 5: Metformin restores efficacy of aPD-1 therapy in NASH-HCC.
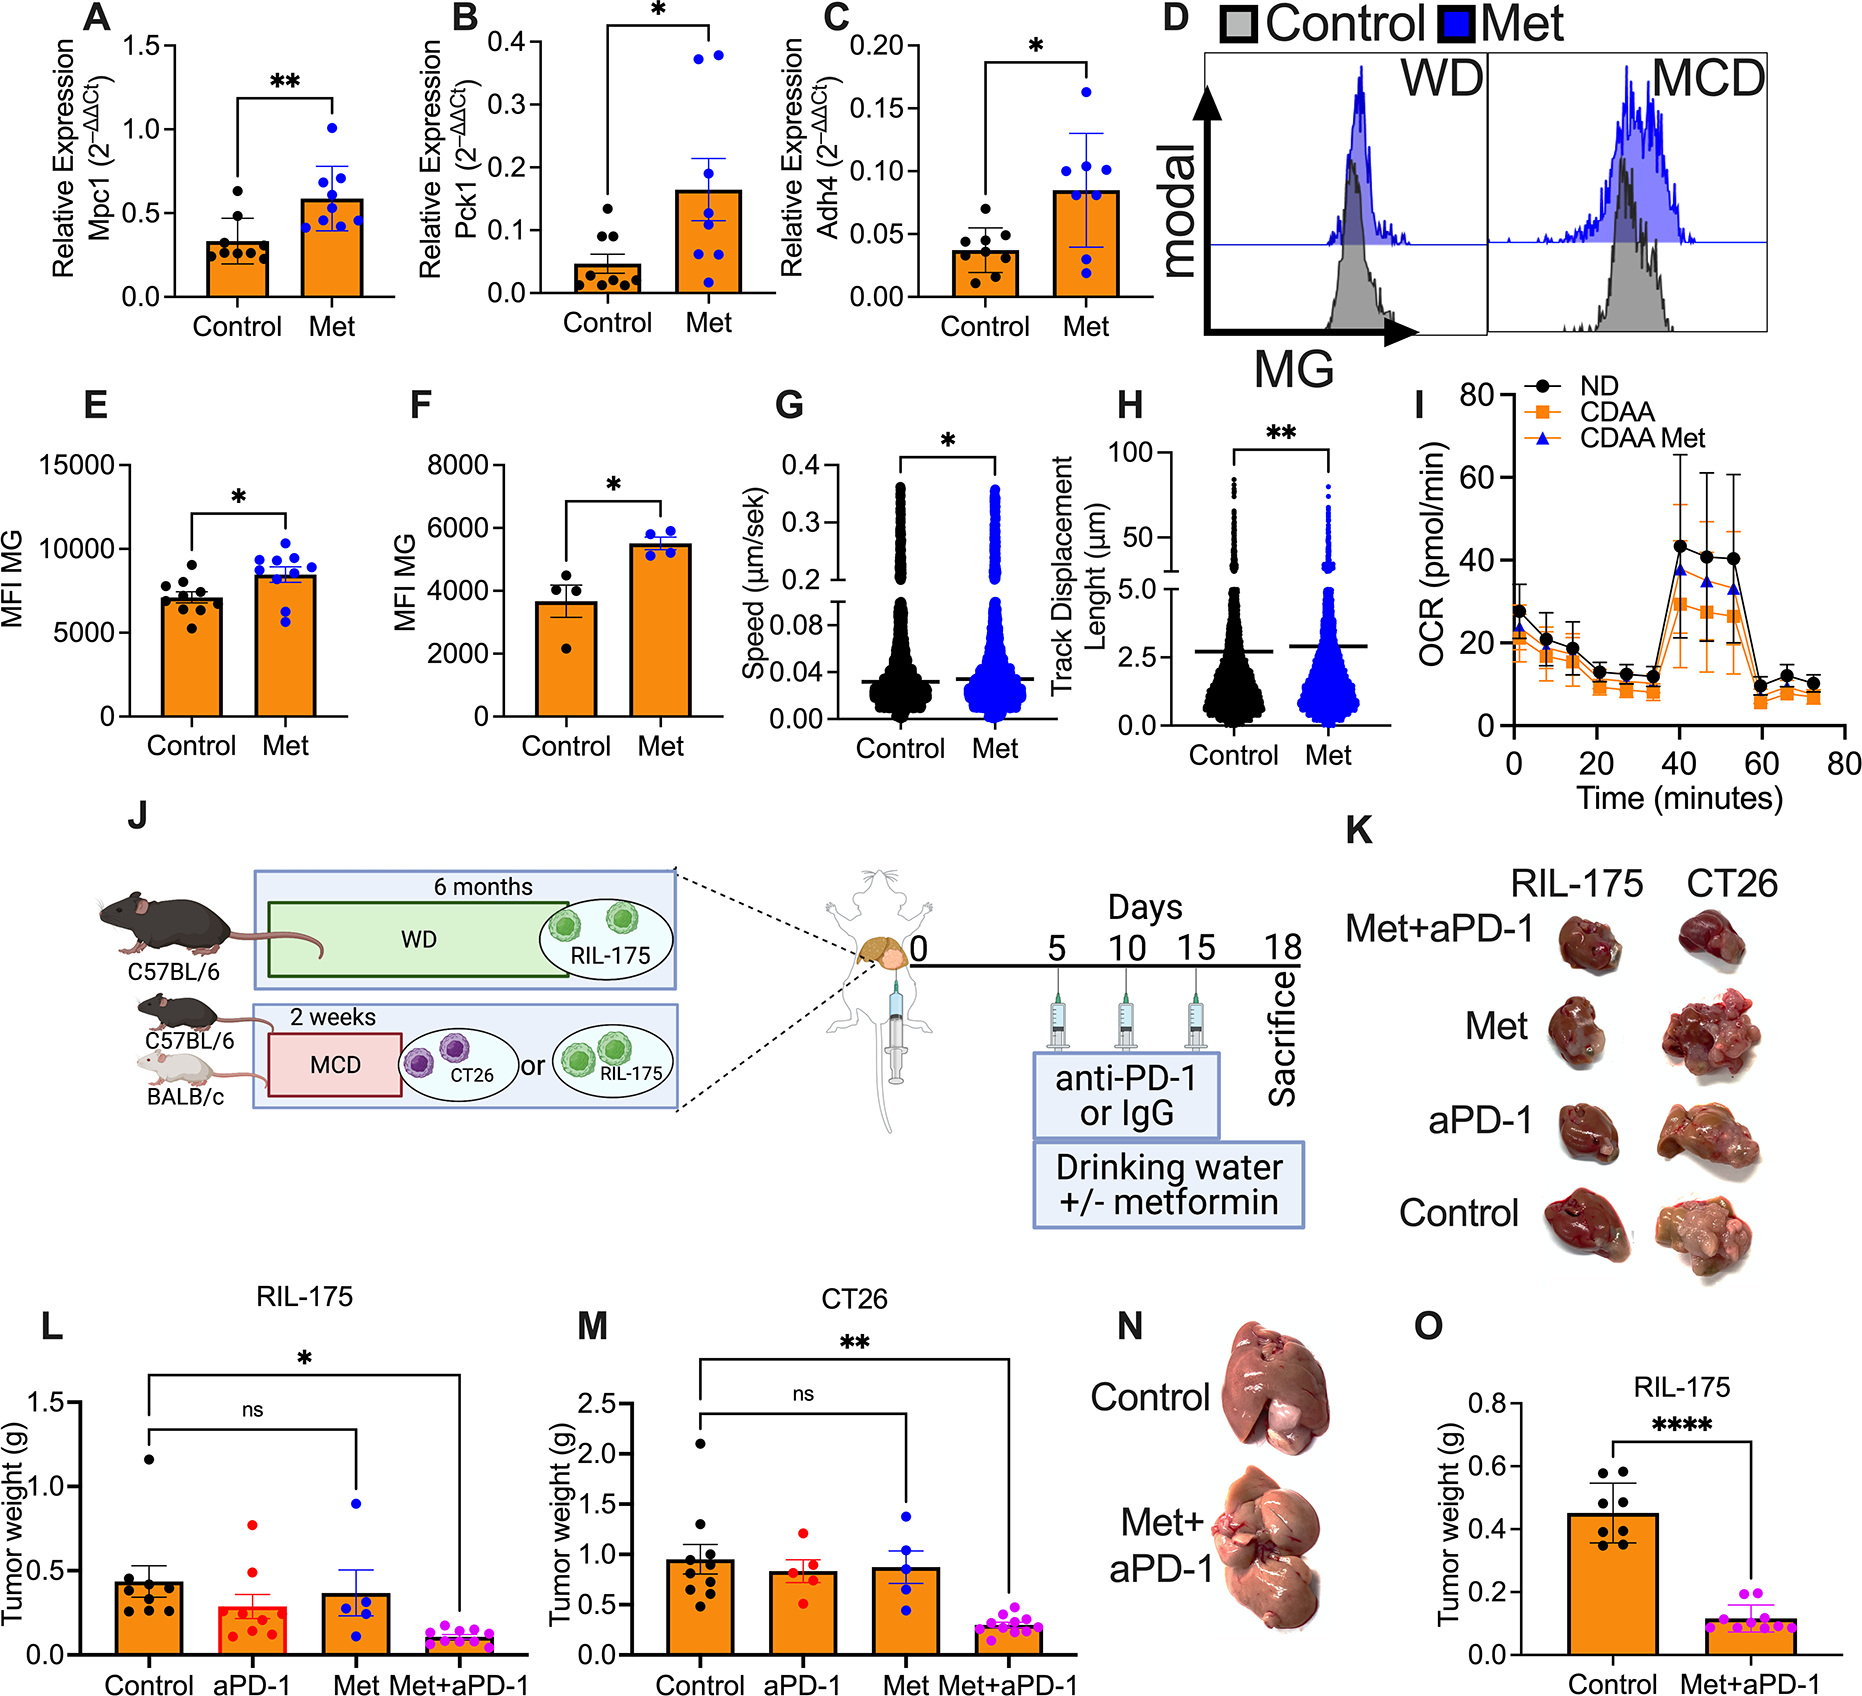
A-C. Relative expression of Mpc1 (A), Pck1 (B) and Adh4 (C) of C57BL/6 mice fed with MCD. Mice were treated with metformin for 2 weeks before sacrifice. RNA extracted from sorted hepatic CD8+ T cells from two mice were pooled for PCR analysis. Data are presented as mean±s.e.m. from two independent experiments. n=9 per group. *p<0.05, **p<0.01
D. Representative histogram of MitoTracker green staining of hepatic CD8+ T cells of C57BL/6 fed with WD and treated with metformin.
E+F. MFI of MitoTracker green (MG) of hepatic CD8+ T cells of mice fed with MCD (E) or WD (F) and treated with metformin. E: data are presented as mean±s.e.m. from two independent experiments. n=10 per group. F: representative data from one experiment are presented as mean±s.e.m. Experiments were repeated twice. n=4 per group. *p<0.05, student’s t-test.
G+H. Speed (G, μm/s) and displacement length (H, μm) of hepatic CD8+ T cells from metformin treated or control WD mice in collagen+media imaged ex vivo overnight and analyzed with Imaris. Mice were treated with metformin for 2 weeks before sacrifice. Representative data from one experiment are presented as mean±s.e.m. Experiments were repeated twice. *p<0.05, student’s t-test.
I. Oxygen consumption rate (OCR) measured using seahorse analysis of splenic CD8+ T cells from ND, CDAA control or CDAA metformin treated mice. Mice were treated with metformin for 2 weeks before sacrifice. Mean±s.e.m.
J. Experimental setup: C57BL/6 or BALB/c mice fed with MCD or ND for 2 weeks or WD or ND for 6 months with intrahepatic injection of 2×10⁵ RIL-175 or CT-26 tumor cells treated with anti-PD-1 (200μg/mouse at indicated time points). 5 mg/ml metformin was added to the drinking water on day five.
K. Representative pictures of intrahepatic RIL-175 (left) and CT26 (right) tumors of mice fed with MCD or ND and treated with anti-PD-1, metformin or the combination. Experimental setup shown in Fig. 5I. Scale bar, 1cm.
L+M. End point assessment of intrahepatic RIL-175 (L) and CT26 (M) tumors of C57BL/6 or BALB/c mice fed with MCD and treated with anti-PD-1, metformin or the combination. Experimental setup shown in Fig. 5I. K: data are presented as mean±s.e.m. from two independent experiments. Control, n=9; anti-PD-1, n=9; Met, n=5; Met+anti-PD-1, n=10. L: representative data from one experiment are presented as mean±s.e.m. Experiments were repeated twice. Control, n=10; anti-PD-1, n=5; Met, n=5; Met+anti-PD-1, n=11. *p<0.05, one-way ANOVA with Tukey’s multiple comparisons test.
N. Representative pictures of intrahepatic RIL-tumors of C57BL/6 mice fed with WD and treated with the combination of anti-PD-1 and metformin. Experimental setup shown in Fig. 5I.
O. End point assessment of intrahepatic RIL-175 tumors of C57BL/6 mice fed with WD and treated with the combination of anti-PD-1 and metformin. Experimental setup shown in Fig. 5I. Data are presented as mean± s.e.m. from two independent experiments. Control, n=8; Met+anti-PD-1, n=10. ****p<0.0001, student’s t-test.
These findings prompted us to test the effect of metformin treatment in mice and HCC receiving anti-PD-1 treatment. First, we tested the direct effect of metformin on tumor cell growth in vitro. Inhibitory concentration (IC50) of metformin in RIL-175 was 15.24 mM and 25.64 mM in CT26 (Fig. S5G+H) tumor cells, concentrations that exceed metformin serum concentrations (36). Additionally, metformin did not inhibit colony formation of RIL-175 (Fig. S5I) and CT26 (Fig. S5J) cells in vitro, suggesting no significant direct growth inhibition of metformin on these tumor cells. Further in vivo studies revealed that metformin treatment did not enhance the effect of anti-PD-1 treatment in mice kept on ND (Fig. S5K–M).
Next, we treated mice with intrahepatic CT26 or RIL-175 tumors and NASH with anti-PD-1 and metformin (Fig. 5I). Monotherapy of anti-PD-1 or metformin did not change tumor growth in mice with NASH. In contrast, metformin treatment potentiated the tumor inhibitory effects of anti-PD-1 treatment in mice on MCD (Fig. 5J–L) and WD (Fig. 5M+N) similar to what was seen in mice kept on ND without metformin treatment. We also tested a possible effect of metformin treatment on NASH, but did not observe changes in steatosis, serum glucose and ALT levels (Fig. S5N–Q).
Finally, we tested whether metformin would also show an effect in mice with NASH treated with anti-PD-L1 and anti-VEGFR2, an experimental setting similar to the approved first line therapy for advanced HCC using atezolizumab plus bevacizumab (37). HCC bearing mice with NASH were treated with metformin, anti-PD-L1 plus anti-VEGFR2. While anti-PD-L1 plus anti-VEGFR2 demonstrated minimal efficacy in mice with NASH, addition of metformin to the combination could fully restore the therapeutic efficacy of the treatment in mice with NASH (Fig. S5R+S).
Discussion
Here we studied the effect of NASH on PD-1 induced anti-tumor responses against tumors in the liver of mice. We describe that anti-PD1 treatment is less effective for the treatment of liver tumors in mice with NASH and that metformin treatment rescues efficacy of anti-PD1 treatment in mice with NASH. It has recently been suggested that HCC patients with NASH benefit less from immune checkpoint inhibitor therapy (10) and therefore the findings described here may have potential clinical implication for the treatment of HCC patients with underlying NASH condition.
HCC patients are often diagnosed with unresectable disease with limited treatment options (1). Sorafenib, a multikinase inhibitor which offers a limited survival benefit for HCC patients, was the only approved therapy for advanced HCC since 2007 until recent breakthroughs with ICI-based therapy (38). Although the overall response rate is still low (~20–30%), ICI therapy provides better survival benefit than sorafenib, and combination treatment with anti-PD-1 and anti-VEGF has been recently authorized as the first-line therapy for advanced HCC (37). NASH, a common condition associated with obesity and metabolic syndrome, is becoming an increasing cause for HCC (1). Our group found that NASH impairs CD4+ T cell function in murine NASH models (6) and CD4+ T cell dependent immunotherapy against liver cancer 8. A recent study by Pfister et al. suggests that NASH may impact responses to immune checkpoint inhibitor therapy against HCC and that anti-PD1 treatment may even promote NASH development and tumor growth (10), which raises the important question whether HCC patients with NASH should still be treated with ICI therapy (11). Here, using murine models, which allow a direct comparison of tumor growth in mice with and without NASH (39), we demonstrate that NASH impacts efficacy of ICI therapy against liver tumors. Interestingly, metformin, a drug with an excellent safety profile, which has been used for decades to treat type 2 diabetes effectively rescued anti-PD-1 efficacy in NASH mice with intrahepatic tumors. These findings suggest the NASH-induced inability to effectively engage T cells upon ICI therapy may be reversed by systemic metformin treatment. While we would expect that metformin treatment may also improve NASH the experimental set-up chosen in our studies clearly suggests that the metformin treatment had direct effects on CD8+ T cells thereby increasing treatment efficacy of anti-PD1 treatment in mice with NASH. Further clinical investigations are warranted to test the combination of metformin with ICI therapy to treat HCC patients with NASH or at least to study the outcome of NASH patients with HCC treated with ICI, who also received metformin treatment.
NASH is an important risk factor for HCC and alters immune responses in the liver through various mechanisms (40). However, our knowledge of how NASH affects tumor immunotherapy is limited and controversial effects of NASH on anti-tumor ICI therapy have been reported. Obesity has been reported to enhance ICI therapy in both cancer patients and mouse models (9, 41, 42) and in the NASH-HCC model using high fat diet-fed MUP-uPA mice, anti-PD-L1 therapy was found to effectively reduce NASH-induced HCC (43). In contrast, ICI therapy has been found to be less effective in a purely NASH-driven HCC mouse model and HCC patients with NASH (10). These seemingly contradictory observations demand a rigorous study design to clarify the impact of NASH on ICI therapy against liver cancer. To the best of our knowledge this is the first study comparing ICI therapy efficacy against liver tumors in mice with and without NASH. Using multiple murine NASH models, our results provide clear evidence that NASH impacts ICI therapy against liver cancer. It is also interesting to note that this phenomenon was organ selective and did not affect subcutaneous tumors. Thus, our study indicates that ICI treatment may be still effective against extrahepatic tumors in patients with NASH.
Antibody depletion studies confirmed that CD8+ T cells were the main effector cell type for anti-PD-1 therapy in our liver cancer model as expected (44). We first assessed the effect of NASH on phenotype and function of hepatic CD8+ T cells. Consistent with previous reports (22), hepatic CD8+ T cells from mice with NASH showed signs of aberrant activation and a proinflammatory phenotype with increased IFNγ and TNFα production and increased expression of exhaustion markers Tim3+ and PD-1+. Interestingly, tumor infiltrating CD8+ T cells did not show this phenotype and anti-PD1 treatment had the same effect on tumor infiltrating CD8+ T cells in mice with and without NASH despite impaired treatment efficacy. Thus, the commonly used immune phenotyping of CD8+ T cells could not explain why NASH led to impaired responses to anti-PD1 therapy and we decided to study T cell motility in vivo.
We acquired in vivo spatial-timing information of tumor infiltrating CD8+ T cells using intravital microscopy and observed that NASH slowed down CD8+ T cell motility. Reduced cell motility was also found in vitro using isolated hepatic CD8+ T cells from NASH mice indicating a cell intrinsic cause of motility inhibition rather than changes in the local environment of NASH livers. Interestingly, CXCR6+CD8+ T cells showed an even higher speed in line with studies by others demonstrating a correlation between T cell exhaustion and motility (45). Interactions among immune cells and tumor cells are critical for mounting anti-tumor responses (46). We propose that the reduced CD8+ T cell motility observed in mice with NASH is likely due to impaired metabolic function, and may affect their anti-tumor function. However, more studies are needed to decipher the exact link between T cell motility and anti-tumor function.
It has been recognized for more than 30 years that cell metabolism can control T cell function and migration (47), (26). NASH is characterized by dysregulation of the lipid metabolism in the liver; however, it is still unknown how NASH affects CD8+ T cell metabolism. Based on these considerations, we studied the transcriptomic profile of hepatic CD8+ T cells focusing on metabolic pathways using NanoString assay. A dramatic, but not unexpected, broad impairment of metabolic pathways was found in hepatic CD8+ T cells from NASH mice, revealing an overall impaired metabolic fitness. The finding was confirmed by PCR analysis of selected genes and functional studies of glycolysis and mitochondrial functions. Impaired metabolic fitness of NASH derived CD8+ T cells may also contribute to their reduced motility since different cell metabolism pathways such as glycolysis, mitochondrial respiration and mTOR signaling are known to control cell movement (48–50). We also attempted to study publicly available RNA single cell sequencing data (10) for metabolism related genes to confirm whether similar findings can be observed in CD8 T cells derived from human livers with NASH, but such studies did not result inconclusive results due to the sparcity of single cell whole transcriptome data. Sequencing reads of glycolysis and mitochondrial related genes were undetectable in a majority of both healthy and NASH liver derived T-cells. We cannot say for certain if this is due to an actual low expression of these genes or if it is due to gene expression drop out characteristic of scRNA-seq studies. Potentially, targeted gene expression experiments would yield enriched sequencing depth of glycolysis and mitochondrial related genes to increase the power for future analysis. Based on these findings, we propose that due to their metabolic unfitness NASH CD8+ T cells cannot respond effectively to ICI therapy leading to a loss of treatment efficacy.
We chose metformin to test our hypothesis based on three reasons. (i) Targeting a single metabolic pathway may have not been effective enough since we demonstrated that NASH causes a broad metabolic dysfunction in CD8+ T cells. (ii) Metformin is known to improve metabolic functions by multiples mechanisms and (iii) it has been shown to improve CD8+ T cell metabolism and function in other pathological situations (35). Indeed, in NASH CD8+ T cells metformin reversed the downregulation of genes related to different metabolic pathways and improved mitochondrial function. Interestingly, in vivo metformin treatment also improved CD8+ T cell mobility in NASH.
To better mimic current clinical practice, we also tested a combination with anti-PD-L1 and anti-VEGFR2 in mice, which mimics the currently used first line regimen of atezolizumab plus bevacizumab (37). Similarly, NASH greatly reduced efficacy of anti-PD-L1 and anti-VEGFR2 combination therapy against liver tumors compared to non-NASH condition. Again, adding metformin rescued the effectiveness of the combination therapy in mice with NASH.
In summary, using multiple NASH-HCC mouse models, we demonstrate that NASH impairs ICI therapy against liver cancer. CD8+ T cells were identified as the main effect for ICI therapy. We discovered that NASH caused a broad metabolic dysfunction in CD8+ T cells accompanied by reduced motility. Metformin improved CD8+ T cells metabolic fitness and effectively restored ICI therapy against liver cancer in NASH. Future studies should be conducted to study whether metformin can rescue the efficacy of ICI therapy in patients with NASH.
Methods
Cell Lines and mouse strains
Murine colorectal carcinoma cell lines CT26 (51) and HCC cell line RIL-175 (14) were used as previously described (8). C57BL/6 and BALB/c mice were purchased from the Charles River Laboratory. Albino strain B6(Cg)-Tyr<c- 2J>/J and B6.CXCR6-GFP knock-in (B6.129P2-Cxcr6tm1Litt/J) mice were purchased from the Jackson Laboratory. All experiments were conducted according to local institution guidelines and approved by the Animal Care and Use Committee of the National Institutes of Health, Bethesda, USA.
Animal studies
Age- and sex-matched mice were fed regular chow or MCD (Research diets, Ref. A02082002BR) or CDAA (Dyets inc, Ref. 518753) or WD (Envigo, Ref. TD.120528)(12, 15). Diets started at the age of 6–7 weeks and mice were kept on diet until the end of the experiment. Intrahepatic RIL-175 or CT26 tumors were established by injecting 2 ×10⁵ RIL-175 or CT26 tumor cells in 20μL of a 50:50 solution of PBS and Matrigel (Corning, Ref. 354248) into the left liver lobe as described previously(52). Mice were injected i.p with 200μg anti-PD-1 (clone 29F.1A12, BioXCell) or IgG control (clone 2A3, BioXCell) on days 5, 10, 15 after tumor injection. When indicated 5mg/ml metformin (Sigma, Ref. D150950-5G) was added to the drinking water(36). For metformin+anti-PD1 experiments in ND, treatment was started at day 7. Bioluminescence imaging was used to monitor growth of RIL175 luciferase–expressing intrahepatic tumors as described (8). For PD-L1 and anti-VEGFR2 treatment, ND and MCD mice were treated with 200μg anti-PD-L1 (clone 10F.9G2, BioXCell) or IgG control (clone LTF-2, BioXCell) on days 5, 9 and 15 and 800μg anti-VEGFR2 (clone DC101, BioXCell) or IgG control (clone HRPN, BioXCell) on days 6, 10, 13 and 16. 1×10⁶ RIL-175 in 100μL PBS were injected in the right lateral flank to establish subcutaneous tumors. Mice with similar tumor volume of approximately 100 mm3 were randomized after 5 days and treatment with 200μg anti-PD-1 or IgG control was started. Tumor measurements were done by a blinded investigator every 2– 3 days and tumor volumes were calculated using this formula: 1/2(length × width2). Mice were sacrificed on day 18 post tumor cell injection.
Intravital imaging
B6.CXCR6-GFP knock-in or BALB/C mice were fed with ND or MCD for 2 weeks or WD for 25 weeks. Subcutaneous and intrahepatic RIL-175 tumor cell injection was performed 12–14 days before imaging as described above. For imaging, mice were anesthetized and the tumor bearing liver was exposed for imaging. Intravital imaging was performed as previously described(53, 54) with few modifications to provide access to hepatic and subcutaneous tumors. Briefly, time-lapse videos were acquired using a Leica DIVE (Deep In Vivo Explorer) inverted microscope (Leica Microsystems) equipped with full range of visible light lasers (Spectra Physics) and 37°C environmental chamber (NIH Division of Scientific Equipment and Instrumentation Services). Anesthesia was provided using SurgiVet vaporizer and a nose-cone mask (Braintree Scientific). Mice were anesthetized with 2 % Isoflurane delivered into induction chamber (Braintree Scientific) and maintained at 1.75 % during imaging. The imaging was performed in regular confocal mode using long-working distance objective (L HC FLUOTAR 25x, NA=0.95, Leica Microsystems).
To visualize blood vessels and CD8+ T cells 0.25 mg of anti-CD31-AF647 (clone MEC13.3, BioLegend) and 0.5 mg of anti-CD8-AF594 (clone 53–6.7, BioLegend) were injected iv. Tumors were surgically accessed, restricted using custom-built tissue holder, and immersed in pre-warmed lubricating jelly. Images were acquired at 488 nm excitation for eGFP; 594 nm for CD8, and 647 nm for CD31. Emitted fluorescence was collected with 4 tunable non-descanned hybrid detectors (HyDs) of DIVE detection system. For time-lapse recording, images were acquired with 1x zoom, a 2.5 – 5 μm z step for a depth of 50–70 μm every 30–90 s. Most videos and large static images were tiled, and a merged mosaic was constructed using Leica tile scanning software. Time-lapse videos were analyzed using Imaris (Bitplane). Cellular speeds were calculated using the spot function of Imaris. Cells were classified as immobilized if their speed was under 1.5 μm/min and displacement was equal to or less than 5 μm during each imaging period. Cell were manually assigned to groups and cellular speeds and displacements were calculated using the spot function.
In vitro CD8+ T cell imaging
Hepatic MNC from WD, MCD or ND C57BL/6 mice were isolated and CD8+ T cells were sorted using an AutoMACS Pro following manufacture’s instruction (Miltenyi Biotec, Ref. 130-104-075). Cell purity was confirmed using flowcytometry. To achieve 5×10⁵ hepatic CD8+ T cells per condition, we pooled cells from three mice. Cells were than stained with either Deep Red (Invitrogen, Ref. C34565 A) or CellTracker Green (Invitrogen, Ref. C2925) dye following manufacturer’s instruction. Cells were washed and resuspended in 100μL media (RPMI, 10% FBS, 1%Pen/Strep) and 10μL of sodium bicarbonate 7.5 % (Gibco, Ref. 25080–094) and 150μL of bovine PureCol (Advanced Biomatrix, Ref. 5005–100ml) was added and mixed carefully. The cell mix was put on a microscopy dish (MatTek, Ref. P35G-1.5-14.C) and incubated for 30 minutes in 37°C. Cells were than imaged using a Leica DIVE (Deep In Vivo Explorer) inverted microscope (Leica Microsystems) equipped with full range of visible light lasers (Spectra Physics) and 37°C environmental chamber (NIH Division of Scientific Equipment and Instrumentation Services). Movement of cells was analyzed as described above.
Statistical analysis and graphical design
Sample sizes for animal studies were guided by previous studies in our laboratory in which similar or identical liver tumor models were used. For all models, randomization and blinding were performed. Statistical analysis was performed with GraphPad Prism 8 (GraphPad Software). Significance of the difference between groups was calculated by Student’s unpaired t-test, one-way ANOVA (Tukey’s and Bonferroni’s multiple comparison test). P<0.05 was considered as statistically significant.
Supplementary Material
Video 1 ND CXCR6GFP mouse with intrahepatic RIL-175 tumors and intravenous administration of CD8 (red) and CD31 (blue) antibodies. Time-Lapsed intratumoral focus, scale bar, 50μm.
Video 2 WD CXCR6GFP mouse with intrahepatic RIL-175 tumors and intravenous administration of CD8 (red) and CD31 (blue) antibodies. Time-Lapsed intratumoral focus, scale bar, 50μm.
Video 3 MCD BALB/c mouse with intrahepatic RIL-175 tumors and intravenous administration of CD8 (red) and CD31 (blue) antibodies. Time-Lapsed intratumoral focus, scale bar, 50μm.
Video 4 ND BALB/c mouse with intrahepatic RIL-175 tumors and intravenous administration of CD8 (red) and CD31 (blue) antibodies. Time-Lapsed intratumoral focus, scale bar, 50μm.
Video 5 WD CXCR6GFP mouse with subcutaneous RIL-175 tumors and intravenous administration of CD8 (red) and CD31 (blue) antibodies and GFP expressing CXCR6+ cells. Time-Lapsed intratumoral focus, scale bar, 50μm.
Video 6 ND CXCR6GFP mouse with subcutaneous RIL-175 tumors and intravenous administration of CD8 (red) and CD31 (blue) antibodies and GFP expressing CXCR6+ cells. Time-Lapsed intratumoral focus, scale bar, 50μm.
Video 7 WD CXCR6GFP mouse with intrahepatic RIL-175 tumors and intravenous administration of CD8 (red) and CD31 (blue) antibodies and GFP expressing CXCR6+ cells. Time-Lapsed intratumoral focus, scale bar, 50μm.
Video 8 ND CXCR6GFP mouse with intrahepatic RIL-175 tumors and intravenous administration of CD8 (red) and CD31 (blue) antibodies and GFP expressing CXCR6+ cells. Time-Lapsed intratumoral focus, scale bar, 50μm.
Video 9 Isolated hepatic CD8+ T cells from WD (Red) and ND (Green) mice imaged in collagen ex vivo. Time-Lapsed video, scale bar, 50μm
Video 10 Isolated hepatic CD8+ T cells from WD mice after metformin treatment for two weeks before sacrifice (Green) or control (Red) imaged in collagen ex vivo. Time-Lapsed video, scale bar, 50μm
Highlights:
Multiple murine models of NASH-HCC show CD8+ T cell-dependent resistance to ICI therapy.
Correlative transcriptomic analysis of hepatic CD8+ T cells revealed NASH-induced mitochondrial aberations.
Although hepatic CD8+ T cells are activated in NASH mice, they have impaired motility and mitochondrial fitness.
NASH may diminish the efficacy of ICI therapy in patients with HCC.
Metformin can salvage ICI therapy and CD8+ T cell activity in tumor-bearing NASH mice.
Acknowledgements:
The graphical abstract and treatment plans were created with BioRender.com.
Funding:
S.W was supported by the Deutsche Forschungsgemeinschaft (WA-4610/1–1). T.F.G. is supported by the Intramural Research Program of the NIH, NCI (ZIA BC 011345, ZO1 BC010870). B.R. is supported by the International Liver Cancer Association (ILCA) Fellowship Award. K.C.B is supported by an iCure NIH-NCI Fellowship. J.D.M was supported through the NIH Medical Research Scholars Program, a public-private partnership supported jointly by the NIH and contributions to the Foundation for the NIH from the Doris Duke Charitable Foundation, Genentech, the American Association for Dental Research, the Colgate-Palmolive Company, and other private donors.
Footnotes
Conflict of interest: The authors declare no potential conflicts of interest.
Data and materials availability: Sequencing data is available at NCBI Gene Expression Omnibus database (GEO accession: GSE184231).
Publisher's Disclaimer: This is a PDF file of an unedited manuscript that has been accepted for publication. As a service to our customers we are providing this early version of the manuscript. The manuscript will undergo copyediting, typesetting, and review of the resulting proof before it is published in its final form. Please note that during the production process errors may be discovered which could affect the content, and all legal disclaimers that apply to the journal pertain.
References
- 1.Llovet JM, Kelley RK, Villanueva A, Singal AG, Pikarsky E, Roayaie S, et al. Hepatocellular carcinoma. Nat Rev Dis Primers. 2021;7(1):6. [DOI] [PubMed] [Google Scholar]
- 2.Estes C, Razavi H, Loomba R, Younossi Z, Sanyal AJ. Modeling the epidemic of nonalcoholic fatty liver disease demonstrates an exponential increase in burden of disease. Hepatology. 2018;67(1):123–33. [DOI] [PMC free article] [PubMed] [Google Scholar]
- 3.Huang DQ, El-Serag HB, Loomba R. Global epidemiology of NAFLD-related HCC: trends, predictions, risk factors and prevention. Nat Rev Gastroenterol Hepatol. 2021;18(4):223–38. [DOI] [PMC free article] [PubMed] [Google Scholar]
- 4.Hoos A Development of immuno-oncology drugs - from CTLA4 to PD1 to the next generations. Nat Rev Drug Discov. 2016;15(4):235–47. [DOI] [PubMed] [Google Scholar]
- 5.Greten TF, Abou-Alfa GK, Cheng AL, Duffy AG, El-Khoueiry AB, Finn RS, et al. Society for Immunotherapy of Cancer (SITC) clinical practice guideline on immunotherapy for the treatment of hepatocellular carcinoma. J Immunother Cancer. 2021;9(9). [DOI] [PMC free article] [PubMed] [Google Scholar]
- 6.Ma C, Kesarwala AH, Eggert T, Medina-Echeverz J, Kleiner DE, Jin P, et al. NAFLD causes selective CD4(+) T lymphocyte loss and promotes hepatocarcinogenesis. Nature. 2016;531(7593):253–7. [DOI] [PMC free article] [PubMed] [Google Scholar]
- 7.Shalapour S, Lin XJ, Bastian IN, Brain J, Burt AD, Aksenov AA, et al. Inflammation-induced IgA+ cells dismantle anti-liver cancer immunity. Nature. 2017;551(7680):340–5. [DOI] [PMC free article] [PubMed] [Google Scholar]
- 8.Heinrich B, Brown ZJ, Diggs LP, Vormehr M, Ma C, Subramanyam V, et al. Steatohepatitis Impairs T-cell-Directed Immunotherapies Against Liver Tumors in Mice. Gastroenterology. 2021;160(1):331–45 e6. [DOI] [PMC free article] [PubMed] [Google Scholar]
- 9.Wang Z, Aguilar EG, Luna JI, Dunai C, Khuat LT, Le CT, et al. Paradoxical effects of obesity on T cell function during tumor progression and PD-1 checkpoint blockade. Nat Med. 2019;25(1):141–51. [DOI] [PMC free article] [PubMed] [Google Scholar]
- 10.Pfister D, Nunez NG, Pinyol R, Govaere O, Pinter M, Szydlowska M, et al. NASH limits anti-tumour surveillance in immunotherapy-treated HCC. Nature. 2021;592(7854):450–6. [DOI] [PMC free article] [PubMed] [Google Scholar]
- 11.Kelley RK, Greten TF. Hepatocellular Carcinoma - Origins and Outcomes. N Engl J Med. 2021;385(3):280–2. [DOI] [PubMed] [Google Scholar]
- 12.Farrell G, Schattenberg JM, Leclercq I, Yeh MM, Goldin R, Teoh N, et al. Mouse Models of Nonalcoholic Steatohepatitis: Toward Optimization of Their Relevance to Human Nonalcoholic Steatohepatitis. Hepatology. 2019;69(5):2241–57. [DOI] [PubMed] [Google Scholar]
- 13.Deczkowska A, David E, Ramadori P, Pfister D, Safran M, At The B, et al. XCR1(+) type 1 conventional dendritic cells drive liver pathology in non-alcoholic steatohepatitis. Nat Med. 2021. [DOI] [PubMed] [Google Scholar]
- 14.Yu SJ, Ma C, Heinrich B, Brown ZJ, Sandhu M, Zhang Q, et al. Targeting the crosstalk between cytokine-induced killer cells and myeloid-derived suppressor cells in hepatocellular carcinoma. J Hepatol. 2019;70(3):449–57. [DOI] [PMC free article] [PubMed] [Google Scholar]
- 15.Tsuchida T, Lee YA, Fujiwara N, Ybanez M, Allen B, Martins S, et al. A simple diet- and chemical-induced murine NASH model with rapid progression of steatohepatitis, fibrosis and liver cancer. J Hepatol. 2018;69(2):385–95. [DOI] [PMC free article] [PubMed] [Google Scholar]
- 16.Manfredi S, Lepage C, Hatem C, Coatmeur O, Faivre J, Bouvier AM. Epidemiology and management of liver metastases from colorectal cancer. Ann Surg. 2006;244(2):254–9. [DOI] [PMC free article] [PubMed] [Google Scholar]
- 17.Kohli R, Kirby M, Xanthakos SA, Softic S, Feldstein AE, Saxena V, et al. High-fructose, medium chain trans fat diet induces liver fibrosis and elevates plasma coenzyme Q9 in a novel murine model of obesity and nonalcoholic steatohepatitis. Hepatology. 2010;52(3):934–44. [DOI] [PMC free article] [PubMed] [Google Scholar]
- 18.O’Neill AM, Burrington CM, Gillaspie EA, Lynch DT, Horsman MJ, Greene MW. High-fat Western diet-induced obesity contributes to increased tumor growth in mouse models of human colon cancer. Nutr Res. 2016;36(12):1325–34. [DOI] [PubMed] [Google Scholar]
- 19.Ringel AE, Drijvers JM, Baker GJ, Catozzi A, García-Cañaveras JC, Gassaway BM, et al. Obesity Shapes Metabolism in the Tumor Microenvironment to Suppress Anti-Tumor Immunity. Cell. 2020;183(7):1848–66.e26. [DOI] [PMC free article] [PubMed] [Google Scholar]
- 20.Wherry EJ, Kurachi M. Molecular and cellular insights into T cell exhaustion. Nat Rev Immunol. 2015;15(8):486–99. [DOI] [PMC free article] [PubMed] [Google Scholar]
- 21.Dudek M, Pfister D, Donakonda S, Filpe P, Schneider A, Laschinger M, et al. Auto-aggressive CXCR6(+) CD8 T cells cause liver immune pathology in NASH. Nature. 2021;592(7854):444–9. [DOI] [PubMed] [Google Scholar]
- 22.Dudek M, Pfister D, Donakonda S, Filpe P, Schneider A, Laschinger M, et al. Auto-aggressive CXCR6(+) CD8 T cells cause liver immune pathology in NASH. Nature. 2021. [DOI] [PubMed] [Google Scholar]
- 23.Bullen A, Friedman RS, Krummel MF. Two-photon imaging of the immune system: a custom technology platform for high-speed, multicolor tissue imaging of immune responses. Curr Top Microbiol Immunol. 2009;334:1–29. [DOI] [PubMed] [Google Scholar]
- 24.Geissmann F, Cameron TO, Sidobre S, Manlongat N, Kronenberg M, Briskin MJ, et al. Intravascular immune surveillance by CXCR6+ NKT cells patrolling liver sinusoids. PLoS Biol. 2005;3(4):e113. [DOI] [PMC free article] [PubMed] [Google Scholar]
- 25.Wehr A, Baeck C, Heymann F, Niemietz PM, Hammerich L, Martin C, et al. Chemokine receptor CXCR6-dependent hepatic NK T Cell accumulation promotes inflammation and liver fibrosis. Journal of immunology (Baltimore, Md : 1950). 2013;190(10):5226–36. [DOI] [PubMed] [Google Scholar]
- 26.Rangel Rivera GO, Knochelmann HM, Dwyer CJ, Smith AS, Wyatt MM, Rivera-Reyes AM, et al. Fundamentals of T Cell Metabolism and Strategies to Enhance Cancer Immunotherapy. Frontiers in immunology. 2021;12:645242-. [DOI] [PMC free article] [PubMed] [Google Scholar]
- 27.Chang CH, Qiu J, O’Sullivan D, Buck MD, Noguchi T, Curtis JD, et al. Metabolic Competition in the Tumor Microenvironment Is a Driver of Cancer Progression. Cell. 2015;162(6):1229–41. [DOI] [PMC free article] [PubMed] [Google Scholar]
- 28.Vuononvirta J, Marelli-Berg FM, Poobalasingam T. Metabolic regulation of T lymphocyte motility and migration. Mol Aspects Med. 2021;77:100888. [DOI] [PubMed] [Google Scholar]
- 29.TeSlaa T, Teitell MA. Techniques to monitor glycolysis. Methods Enzymol. 2014;542:91–114. [DOI] [PMC free article] [PubMed] [Google Scholar]
- 30.Agnello M, Morici G, Rinaldi AM. A method for measuring mitochondrial mass and activity. Cytotechnology. 2008;56(3):145–9. [DOI] [PMC free article] [PubMed] [Google Scholar]
- 31.Gilmore K, Wilson M. The use of chloromethyl-X-rosamine (Mitotracker red) to measure loss of mitochondrial membrane potential in apoptotic cells is incompatible with cell fixation. Cytometry. 1999;36(4):355–8. [DOI] [PubMed] [Google Scholar]
- 32.Perry SW, Norman JP, Barbieri J, Brown EB, Gelbard HA. Mitochondrial membrane potential probes and the proton gradient: a practical usage guide. Biotechniques. 2011;50(2):98–115. [DOI] [PMC free article] [PubMed] [Google Scholar]
- 33.Pernicova I, Korbonits M. Metformin—mode of action and clinical implications for diabetes and cancer. Nature Reviews Endocrinology. 2014;10(3):143–56. [DOI] [PubMed] [Google Scholar]
- 34.Böhme J, Martinez N, Li S, Lee A, Marzuki M, Tizazu AM, et al. Metformin enhances anti-mycobacterial responses by educating CD8+ T-cell immunometabolic circuits. Nat Commun. 2020;11(1):5225. [DOI] [PMC free article] [PubMed] [Google Scholar]
- 35.Russell SL, Lamprecht DA, Mandizvo T, Jones TT, Naidoo V, Addicott KW, et al. Compromised Metabolic Reprogramming Is an Early Indicator of CD8(+) T Cell Dysfunction during Chronic Mycobacterium tuberculosis Infection. Cell Rep. 2019;29(11):3564–79.e5. [DOI] [PMC free article] [PubMed] [Google Scholar]
- 36.Dowling RJ, Lam S, Bassi C, Mouaaz S, Aman A, Kiyota T, et al. Metformin Pharmacokinetics in Mouse Tumors: Implications for Human Therapy. Cell Metab. 2016;23(4):567–8. [DOI] [PubMed] [Google Scholar]
- 37.Finn RS, Qin S, Ikeda M, Galle PR, Ducreux M, Kim TY, et al. Atezolizumab plus Bevacizumab in Unresectable Hepatocellular Carcinoma. N Engl J Med. 2020;382(20):1894–905. [DOI] [PubMed] [Google Scholar]
- 38.Llovet JM, Ricci S, Mazzaferro V, Hilgard P, Gane E, Blanc JF, et al. Sorafenib in advanced hepatocellular carcinoma. N Engl J Med. 2008;359(4):378–90. [DOI] [PubMed] [Google Scholar]
- 39.Brown ZJ, Heinrich B, Greten TF. Mouse models of hepatocellular carcinoma: an overview and highlights for immunotherapy research. Nat Rev Gastroenterol Hepatol. 2018;15(9):536–54. [DOI] [PubMed] [Google Scholar]
- 40.Anstee QM, Reeves HL, Kotsiliti E, Govaere O, Heikenwalder M. From NASH to HCC: current concepts and future challenges. Nat Rev Gastroenterol Hepatol. 2019;16(7):411–28. [DOI] [PubMed] [Google Scholar]
- 41.McQuade JL, Daniel CR, Hess KR, Mak C, Wang DY, Rai RR, et al. Association of body-mass index and outcomes in patients with metastatic melanoma treated with targeted therapy, immunotherapy, or chemotherapy: a retrospective, multicohort analysis. Lancet Oncol. 2018;19(3):310–22. [DOI] [PMC free article] [PubMed] [Google Scholar]
- 42.Albiges L, Hakimi AA, Xie W, McKay RR, Simantov R, Lin X, et al. Body Mass Index and Metastatic Renal Cell Carcinoma: Clinical and Biological Correlations. J Clin Oncol. 2016;34(30):3655–63. [DOI] [PMC free article] [PubMed] [Google Scholar]
- 43.Shalapour S, Lin X-J, Bastian IN, Brain J, Burt AD, Aksenov AA, et al. Inflammation-induced IgA+ cells dismantle anti-liver cancer immunity. Nature. 2017;551(7680):340–5. [DOI] [PMC free article] [PubMed] [Google Scholar]
- 44.Tumeh PC, Harview CL, Yearley JH, Shintaku IP, Taylor EJ, Robert L, et al. PD-1 blockade induces responses by inhibiting adaptive immune resistance. Nature. 2014;515(7528):568–71. [DOI] [PMC free article] [PubMed] [Google Scholar]
- 45.You R, Artichoker J, Fries A, Edwards AW, Combes AJ, Reeder GC, et al. Active surveillance characterizes human intratumoral T cell exhaustion. J Clin Invest. 2021;131(18). [DOI] [PMC free article] [PubMed] [Google Scholar]
- 46.Cardenas MA, Prokhnevska N, Kissick HT. Organized immune cell interactions within tumors sustain a productive T-cell response. Int Immunol. 2021;33(1):27–37. [DOI] [PMC free article] [PubMed] [Google Scholar]
- 47.Finlay D, Cantrell DA. Metabolism, migration and memory in cytotoxic T cells. Nat Rev Immunol. 2011;11(2):109–17. [DOI] [PMC free article] [PubMed] [Google Scholar]
- 48.Kishore M, Cheung KCP, Fu H, Bonacina F, Wang G, Coe D, et al. Regulatory T Cell Migration Is Dependent on Glucokinase-Mediated Glycolysis. Immunity. 2017;47(5):875–89.e10. [DOI] [PMC free article] [PubMed] [Google Scholar]
- 49.Campello S, Lacalle RA, Bettella M, Mañes S, Scorrano L, Viola A. Orchestration of lymphocyte chemotaxis by mitochondrial dynamics. J Exp Med. 2006;203(13):2879–86. [DOI] [PMC free article] [PubMed] [Google Scholar]
- 50.Bao Y, Ledderose C, Graf AF, Brix B, Birsak T, Lee A, et al. mTOR and differential activation of mitochondria orchestrate neutrophil chemotaxis. J Cell Biol. 2015;210(7):1153–64. [DOI] [PMC free article] [PubMed] [Google Scholar]
- 51.Brattain MG, Strobel-Stevens J, Fine D, Webb M, Sarrif AM. Establishment of mouse colonic carcinoma cell lines with different metastatic properties. Cancer Res. 1980;40(7):2142–6. [PubMed] [Google Scholar]
- 52.Brown ZJ, Heinrich B, Greten TF. Establishment of Orthotopic Liver Tumors by Surgical Intrahepatic Tumor Injection in Mice with Underlying Non-Alcoholic Fatty Liver Disease. Methods and protocols. 2018;1(2). [DOI] [PMC free article] [PubMed] [Google Scholar]
- 53.Kamenyeva O, Boularan C, Kabat J, Cheung GY, Cicala C, Yeh AJ, et al. Neutrophil recruitment to lymph nodes limits local humoral response to Staphylococcus aureus. PLoS Pathog. 2015;11(4):e1004827. [DOI] [PMC free article] [PubMed] [Google Scholar]
- 54.Shannon JP, Kamenyeva O, Reynoso GV, Hickman HD. Intravital Imaging of Vaccinia Virus-Infected Mice. Methods Mol Biol. 2019;2023:301–11. [DOI] [PMC free article] [PubMed] [Google Scholar]
Associated Data
This section collects any data citations, data availability statements, or supplementary materials included in this article.
Supplementary Materials
Video 1 ND CXCR6GFP mouse with intrahepatic RIL-175 tumors and intravenous administration of CD8 (red) and CD31 (blue) antibodies. Time-Lapsed intratumoral focus, scale bar, 50μm.
Video 2 WD CXCR6GFP mouse with intrahepatic RIL-175 tumors and intravenous administration of CD8 (red) and CD31 (blue) antibodies. Time-Lapsed intratumoral focus, scale bar, 50μm.
Video 3 MCD BALB/c mouse with intrahepatic RIL-175 tumors and intravenous administration of CD8 (red) and CD31 (blue) antibodies. Time-Lapsed intratumoral focus, scale bar, 50μm.
Video 4 ND BALB/c mouse with intrahepatic RIL-175 tumors and intravenous administration of CD8 (red) and CD31 (blue) antibodies. Time-Lapsed intratumoral focus, scale bar, 50μm.
Video 5 WD CXCR6GFP mouse with subcutaneous RIL-175 tumors and intravenous administration of CD8 (red) and CD31 (blue) antibodies and GFP expressing CXCR6+ cells. Time-Lapsed intratumoral focus, scale bar, 50μm.
Video 6 ND CXCR6GFP mouse with subcutaneous RIL-175 tumors and intravenous administration of CD8 (red) and CD31 (blue) antibodies and GFP expressing CXCR6+ cells. Time-Lapsed intratumoral focus, scale bar, 50μm.
Video 7 WD CXCR6GFP mouse with intrahepatic RIL-175 tumors and intravenous administration of CD8 (red) and CD31 (blue) antibodies and GFP expressing CXCR6+ cells. Time-Lapsed intratumoral focus, scale bar, 50μm.
Video 8 ND CXCR6GFP mouse with intrahepatic RIL-175 tumors and intravenous administration of CD8 (red) and CD31 (blue) antibodies and GFP expressing CXCR6+ cells. Time-Lapsed intratumoral focus, scale bar, 50μm.
Video 9 Isolated hepatic CD8+ T cells from WD (Red) and ND (Green) mice imaged in collagen ex vivo. Time-Lapsed video, scale bar, 50μm
Video 10 Isolated hepatic CD8+ T cells from WD mice after metformin treatment for two weeks before sacrifice (Green) or control (Red) imaged in collagen ex vivo. Time-Lapsed video, scale bar, 50μm