Abstract
Aims
We evaluated the performance of contrast-enhanced ultrasound (CEUS) based on radiomics analysis to distinguish benign from malignant breast masses.
Methods
131 women with suspicious breast masses (BI-RADS 4a, 4b, or 4c) who underwent CEUS examinations (using intravenous injection of perflutren lipid microsphere or sulfur hexafluoride lipid-type A microspheres) prior to ultrasound-guided biopsies were retrospectively identified. Post biopsy pathology showed 115 benign and 16 malignant masses. From the cine clip of the CEUS exams obtained using the built-in GE scanner software, breast masses and adjacent normal tissue were then manually segmented using the ImageJ software. One frame representing each of the four phases: precontrast, early, peak, and delay enhancement were selected post segmentation from each CEUS clip. 112 radiomic metrics were extracted from each segmented tissue normalized breast mass using custom Matlab® code. Linear and nonlinear machine learning (ML) methods were used to build the prediction model to distinguish benign from malignant masses. tenfold cross-validation evaluated model performance. Area under the curve (AUC) was used to quantify prediction accuracy.
Results
Univariate analysis found 35 (38.5%) radiomic variables with p < 0.05 in differentiating between benign from malignant masses. No feature selection was performed. Predictive models based on AdaBoost reported an AUC = 0.72 95% CI (0.56, 0.89), followed by Random Forest with an AUC = 0.71 95% CI (0.56, 0.87).
Conclusions
CEUS based texture metrics can distinguish between benign and malignant breast masses, which can, in turn, lead to reduced unnecessary breast biopsies.
Keywords: Radiomics, CEUS, Breast masses, Malignancy, Machine learning
Key Points
| CEUS based texture metrics may contribute as a promising tool for distinguishing benign and malignant breast masses Future research in CEUS based breast mass discrimination may potentially help in reducing unnecessary breast biopsies CEUS radiomics can be a helpful adjunct tool to CEUS and conventional imaging. |
Introduction
Breast cancer accounts for nearly 30% of all cancers in women [1]. Currently, mammography and conventional grayscale ultrasound are the standard imaging techniques used to diagnose breast cancer. However, only 15–40% of abnormal screening mammograms and 25–50% of palpable lumps that result in recommendations for biopsy are reported to be malignant [2]. While more commonly used to evaluate liver and renal masses, newer imaging techniques, such as contrast-enhanced ultrasound (CEUS) have also been used for breast masses as it can offer good temporal resolution in tracing the microcirculation perfusion of breast masses [3–6]. Previous studies revealed that certain quantifiable patterns of CEUS could help differentiate benign from malignant breast masses [7–10].
Radiomics, the high-throughput extraction of quantitative metrics from routine clinical images using a panel of data characterization algorithms, is emerging as a valuable tool in evaluating and managing various diseases, particularly cancer [11, 12]. Despite the widespread application of radiomics, the limited knowledge of its basics concepts among radiologists and the lack of efficient and standardized systems of performing radiomics and data sharing hinder its clinical translation, even in breast imaging [13].
In this study, we hypothesized that the heterogeneity of breast masses as captured by texture radiomic metrics and their change over the CEUS scan duration is associated with tumor malignancy status. Interpretation of this heterogeneity may provide additional tools for increasing the precision of identifying breast masses as benign or malignant. To improve the use of CEUS to answer the specific question of whether a breast mass is malignant, we developed a machine-learning (ML)-based radiomics strategy (radiomics signature) using its CEUS data. Although CEUS radiomics in combination with artificial intelligence (ML or deep-learning) have been reported [14, 15], to the best of our knowledge, no previous study has investigated whether a radiomics signature would reliably distinguish benign from malignant breast masses using breast CEUS images [16].
Materials and methods
Patient cohort
In this IRB-approved study, we retrospectively selected a cohort of 131 women (median age in years = 46; 18–76 years) with suspicious breast masses on either conventional breast US or 2D mammography who underwent CEUS examinations prior to US guided-biopsies (Table 1) between October 2016 and June 2017. The CEUS examinations were performed on the same day immediately prior to US guided-biopsies. Our inclusion criteria were: (a) Women ≥ 18 years of age with a BI-RADS 4 breast mass considered for US guided biopsy. (b) Subjects able to provide written informed consent. (c) Subjects willing to comply with the protocol. Our exclusion criteria were: (a) Contraindications to microbubble contrast- specifically, patients who have known severe pulmonary hypertension or hypersensitivity to US contrast agent, (b) Pregnant or lactating patients or minors and (c) history of prior cancer in the same breast or undergoing neoadjuvant chemotherapy. All patients underwent a clinically age-appropriate imaging workup including grayscale US, mammography and study-specific CEUS.
Table 1.
Cohort details
| Parameter | Biopsy histopathologic result | |
|---|---|---|
| Benign | Malignant | |
| (n = 115) | (n = 16) | |
| Age, years (min, max) | 46 (18, 74) | 54 (38, 76) |
| Age, years | ||
| 18–29 | 14 (13%) | 0 (0%) |
| 30–39 | 18 (15%) | 2 (13%) |
| 40–49 | 43 (38%) | 4 (25%) |
| 50–76 | 40 (34%) | 10 (62%) |
| Grayscale US size, mm | 12.0 (4.0, 48.0) | 14.0 (7.0, 48.0) |
| BI‐RADS | ||
| 4a | 104 (91%) | 4 (25%) |
| 4b | 10 (9%) | 1 (6%) |
| 4c | 1 (0) | 11 (69%) |
| CEUS | ||
| Nonenhanced | 36 (33%) | 2 (13%) |
| Enhanced | 79 (67%) | 14 (87%) |
| CEUS, nonenhancing mass size, mm | 9.0 (4.0, 30.0) | 11.0 (8.0, 14.0) |
| CEUS, enhancing mass size, mm | 12.0 (4.0, 36.0) | 15.0 (7.0, 36.0) |
CEUS procedure
CEUS examinations were performed on a LOGIQ E9 US machine with high‐definition clear technology (GE Healthcare) with a 9‐ or 15‐MHz linear transducer to maximize breast mass visibility. First conventional B‐mode US was used to identify the mass and determine its longest dimension and most suspicious part. Subsequently, real‐time CEUS imaging using a low mechanical index (automatically selected by the machine in the CEUS mode) was performed. A peripheral IV line with 20-gauge needle or larger was placed. A 3-way stopcock was attached to the peripheral IV line. A 5-cc syringe with agitated ultrasound contrast agent (UCA) and a 10 cc syringe with normal saline were attached to the stopcock. For all cases, either Definity (perflutren lipid microspheres; Lantheus Medical Imaging) or Lumason (sulfur hexafluoride lipid-type A microspheres; Bracco Diagnostics Inc), purely intravascular agents, both of which are approved by the Food and Drug Administration for use in cardiac studies (and Lumason for liver imaging) was injected intravenously. In our study, we used these CEUS agents off label, owing to the non-availability of approved CEUS agents in the United States market for breast imaging. When Definity was used, the solution was agitated per the protocol, and 10 μL/kg was administered intravenously. When Lumason was used, the contrast agent was reconstituted per protocol. A bolus injection of 2.4 or 4.8 mL UCA was given followed by a 10 mL normal saline flush. The transducer was positioned over the suspicious breast mass and dual-image mode with grayscale and contrast images ensured optimal visualization of the breast mass during the exam. Images were recorded in the same position with cine clip function for 90 s following administration of contrast. Video clips of the CEUS examination were recorded and postprocessing was performed using the built-in GE scanner software and then temporarily stored on the LOGIQ E9 US machine. These were later transferred to the Picture archiving and communication system (PACS) as cine clips. Native DICOM format of the cine clips were stored in an encrypted hard-drive for archiving. In the patient cohort, 29 patients received Definity and 102 patients received Lumason.
Confirmatory diagnosis
Histopathology by samples obtained by US-guided core needle biopsy and/or surgery was used as the confirmatory diagnosis (gold standard). The masses were biopsied after completion of the CEUS exam. All 131 women had BI-RADS 4A, 4B, or 4C breast masses detected by mammography, conventional ultrasound (US), or both (Table 1). The final diagnosis included 115 benign and 16 malignant masses (Table 2).
Table 2.
Histopathology of the 131 breast masses
| Histopathology | Samples | Percent (%) |
|---|---|---|
| Malignant (N = 16) | ||
| Invasive ductal carcinoma (with and without associated ductal carcinoma in situ) | 14 | 87.50 |
| Mixed pleomorphic invasive lobular and ductal carcinoma | 1 | 6.25 |
| Intraductal papillary carcinoma | 1 | 6.25 |
| Benign (N = 115) | ||
| Fibroadenomaa | 51 | 44.35 |
| Fibrocystic changes | 21 | 18.26 |
| Inflammatory process (including chronic inflammation, abscess and idiopathic granulomatous mastitis) | 11 | 9.57 |
| Other benign | 9 | 7.83 |
| Papillary lesions (including benign intraductal papillomas and one papillary lesion with atypia that was not upgraded to malignancy with surgical excisiona) | 8 | 6.96 |
| Stromal fibrosis | 7 | 6.09 |
| Fat necrosis | 2 | 1.74 |
| Lymph node/lymphoid tissuea | 2 | 1.74 |
| Pseudoangiomatous stromal hyperplasia (PASH) | 2 | 1.74 |
| Nipple adenoma | 1 | 0.87 |
| Atypical ductal hyperplasia (ADH) with associated atypical papillary lesion (not upgraded to malignancy with surgical excision)a | 1 | 0.87 |
aSix of the 131 lesions were recommended for surgical excisional biopsy. 4 of the 6 patients obtained surgical excisional biopsy and none were upgraded to malignancy
Image segmentation and selection of images representing the multiple phases of CEUS
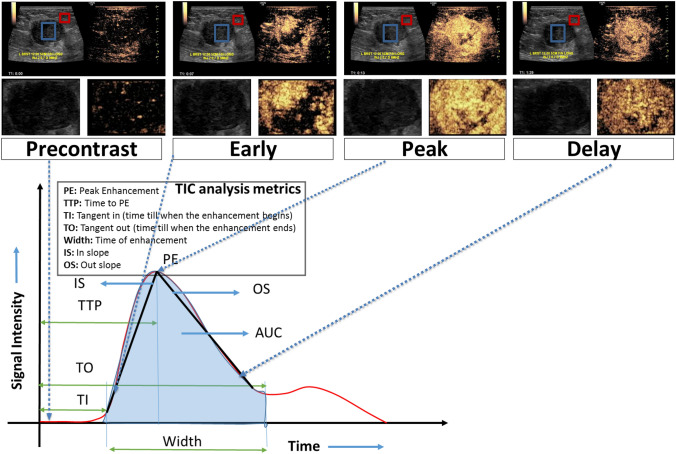
Using the ImageJ (U. S. National Institutes of Health) [17] software one trained radiologist (5 years of experience in CEUS breast imaging) placed 2 square ROIs (size: 5mm2) on the CEUS image. The first ROI centered around the most enhancing portion of the breast mass, keeping away from the mass margins and the second one surrounding normal breast tissue at least 1 cm away from the breast mass on the cine clip of the CEUS examination (Fig. 1A). A second radiologist (5 years of experience in CEUS breast imaging) verified the placement of the ROIs. Additional examination was performed in the same quadrant of the breast outside the observed breast mass, to accommodate scenarios when the breast mass was large, and a second ROI could not be placed in the same video loop. Based on a normalized map of the breast mass, obtained by dividing the breast mass values by mean of the normal tissue data, a surrogate mean time-intensity curve was obtained for the CEUS cine upto 90 s. The normalization process was performed to remove any effects due to a difference in contrast agents and its administration volumes i.e., Lumason vs. Definity. Representative images obtained at four time points on the time-intensity curve that correspond to precontrast, early, peak, and delay enhancement, respectively were extracted (Fig. 1B). The chosen images for radiomics analysis were further visually analyzed based on the vascular architecture (evaluated in the early wash-in phase) and the contrast enhancement of the lesion compared to the adjacent tissue (time course of wash-in and wash-out) to ensure that they represented the 4 key time points of the time-intensity curve. If the images selected by the surrogate time-intensity curve analysis had issues due to motion or excessive noise, a different image within the same time window (5 s) was chosen.
Fig. 1.
Top panel: CEUS scans showing 4 enhancement phases (precontrast, early, peak and delay) of the Invasive Ductal Carcinoma (ER-/PR-/HER2-) in a 44 year-old woman presenting with a left breast large palpable lump measuring up to 4.4 cm. The CEUS scan shows avidly enhancing irregular mass with marked heterogeneous enhancement and small areas of clear defect, which is worrisome for a malignant mass. On the CEUS clip, the breast mass (blue contour) and adjacent normal tissue (red contour) are annotated by a fellowship trained radiologist using ImageJ software. Middle panel: Segmented regions of interest (here, the lesion) from the CEUS scans are shown to highlight the variation in enhancement across the different phases. Bottom panel: Based on a normalized map of the breast mass, obtained by dividing the breast mass (blue contour in top panel) values by mean of the normal tissue (red contour in top panel) data, a surrogate mean time-intensity curve was acquired for the whole cine clip. Subsequently, representative images corresponding to four time points on the surrogate mean time-intensity curve were extracted from cine clips: precontrast, early, peak, and delay enhancement, respectively. Here, the four shortlisted normalized images show nodular enhancement of the breast mass (blue contour in top panel)
Radiomic analysis
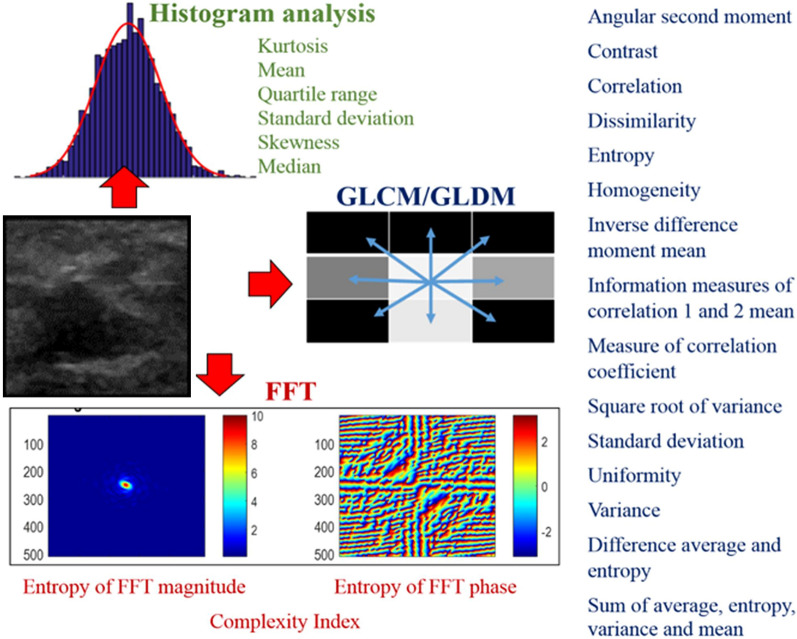
Using custom developed radiomics software developed on Matlab® (Mathworks), texture and intensity were extracted from the normalized masses of each of the four representative images per patient. Absolute values and temporal changes across each of the four phases of the CEUS were extracted. The radiomics panels spanned texture metrics extracted from four different groups: (1) intensity/histogram analysis metrics representing first-order statistical measures of texture, (2) Gray level co-occurrence matrix (GLCM) and (3) Gray level difference matrix (GLDM) metrics, both representing second order statistical measures of texture, and (4) Fast Fourier transform (FFT) metrics representing higher-order statistical measures of texture.
Feature extraction
The radiomics panel comprised of 112 absolute radiomic values extracted per phase and their differences between the phases (delta radiomic values) (Fig. 2). Delta radiomic metrics capture the changes of radiomic features over time here the cine of the CEUS exam. Here, only differences in sequential phases were considered. In our case this included differences between precontrast and early, early and peak, and delay and peak enhancement phases. Therefore, in total 64 absolute radiomic metrics were extracted across the 4 phases i.e., 16 metrics per phase and 48 additional delta radiomic metrics were extracted between precontrast and early phase (N = 16), early and peak phase (N = 16), and delay and peak enhancement phase (N = 16).
Fig. 2.
Metrics of the radiomics panel. 112 metrics spanning first-order (intensity/histogram analysis), second-order (GLCM/GLDM) and higher-order (FFT) statistical measures of texture were considered
Radiomic signature model construction
All 112 metrics were input to four different ML classifier models: ElasticNet, Multivariate adaptive regression spline (MARS), REAL AdaBoost [18, 19] and Random Forest (RF).
Model validation
For all four classifiers tenfold stratified cross-validation was used to evaluate model performance. Consequently, the original cohort of 131 patients was randomly partitioned into 10 equal size sub-cohorts. Of the 10 sub-cohorts, a single sub-cohort was separated out for testing the four ML models’ performance, and the remaining 9 sub-cohorts are used for training the four ML models. This cross-validation process is repeated 10 times, with each of the 10 sub-cohorts used exactly once for testing the ML models’ performance. Receiver Operating Characteristic (ROC) curve was constructed using the predicted probability from 10 testing datasets combined. The area under the curve (AUC) with 95% confidence interval was used to assess prediction accuracy. We applied a fivefold cross-validation process within each iteration to determine the final prediction model before scoring through the 10% independent testing sample. The 10% of independent testing data was excluded from the learning phase to avoid information leaking. For Random Forest, 800 trees with a maximal depth of 50, leaf size of 16 was used. For Real AdaBoost, since it is more efficient, only 25 trees were considered with a depth of 3 as recommended by Hastie et al. [20]. For Random Forest and AdaBoost, the Gini impurity index was used as the loss function. Loh method [21] was used for variable selection. This method selects the variable that has the smallest p-value of a chi-square test of association in a contingency table; interval variable was truncated by dynamically calculated proportion of standard deviation from mean. Predicted residual sum of squares (CVPRESS) was used for ElasticNet to select candidate predictors and the final model. Since our data cohort was limited in terms of class balance and sample size, to prevent potential bias, prior correction as described by King et al. [22]. for imbalanced outcome was used. To avoid overfitting of the model, a rigorous tenfold cross validation procedure was used. Delong’s test was used to compare AUC between machine learning models [23].
Statistical analysis
Following extraction, the 112 radiomic metrics they were statistically analyzed and used to create prediction models (radiomics signatures) of breast mass malignancy. Univariate independent t-test or Wilcox on rank sum test depending on data normality, along with mean, standard division, and interquartile range displayed in box plot were used as the descriptive analyses. Benjamini–Hochberg (BH) Procedure was used to control multiple comparison error for univariate analyses. Percent features with unadjusted and BH procedure adjusted p < 0.05 by each radiomics family was calculated as the assessment of overall signal strength from each radiomic family, in comparing to variable of importance generated by machine learning. Descriptive analyses were conducted by using histogram and box-whisker plots.
Sample size calculation
The purpose of sample size calculation is to ensure the lower limit of 95% confidence interval of AUC to be above 0.5 if there is a true predictive value, and to reject the null hypothesis of no predictive value. Since we used tenfold cross validation, each individual subject has been used as the testing sample. With 131 study samples (16 malignant cases), we can produce a 95% confidence interval for AUC with a lower limit above 0.55. Thus reject the null hypothesis of radiomics not being able to predict malignancy. PASS 2021 was used for power calculation.
Model interpretation
Variable-of-importance (VOI) from Random Forest and AdaBoost was selected and ranked using Out-of-bag Gini index (OOBGini), while ElasticNet was the remaining variable in the final model. For Random Forest and AdaBoost, the cut-off for “top” VOI was determined by the “cliff” of OOBGini, i.e., a sudden large change from the previous ranking position. The VOI selection procedure was repeated ten times, and the final ranking was based on the number of counts as top VOI during the tenfold cross-validation. SAS Enterprise Miner 15.1: High-Performance procedures were used for machine learning. SAS9.4 was used for all other statistical analysis. All statistical analyses and machine learning were conducted by the departmental biostatistician (SYC with > 20 years of experience).
Results
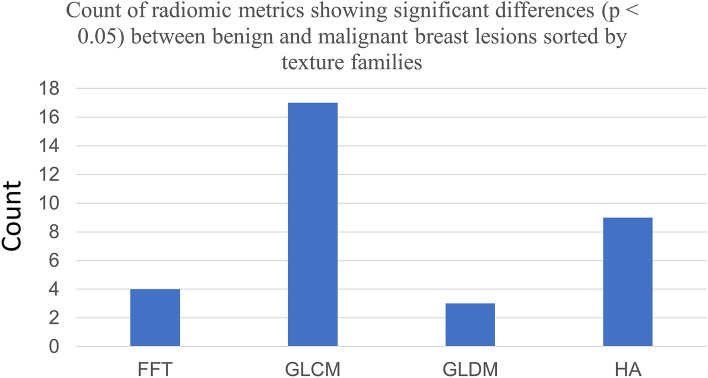
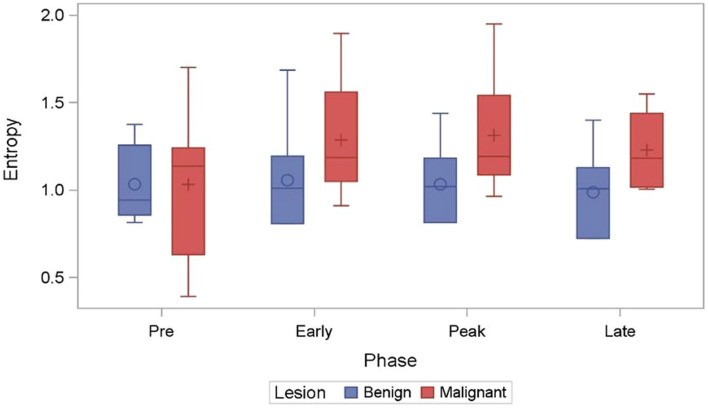
Across the four texture families analyzed (Fig. 3), univariate analysis showed 33 out of 112 (29.46%) radiomic metrics with p < 0.05 in differentiated benign from malignant masses. Amongst these 33 metrics, Gray level Co-Occurrence matrix (GLCM) yielded the greatest percentage (50.07%) of signatures within a given family to reach significance at the p ≤ 0.05 level. This was followed by histogram analysis (HA) at 26.47%, Fast Fourier Transform (FFT) at 11.76% and Gray Level Difference Matrix (GLDM) at 8.82% (Fig. 3). Of the radiomics signatures to reach significance at the p ≤ 0.05 level 11.76% belonged to the delta radiomics category. Box-and-whisker plot of a GLCM metric: Entropy across the CEUS sequence is presented in Fig. 4. The overall mean intensity was lower in the benign masses (2.82 ± 1.53) compared to malignant masses (4.23 ± 1.12).
Fig. 3.
Clustered Column chart showing the distribution of radiomic metrics showing significant (p < 0.05) differences between benign and malignant breast masses, sorted according to their texture families. GLCM metrics show the highest contribution followed by HA, FFT and GLDM. Here, FFT Fast Fourier Transform, GLCM Gray level Co-Occurrence matrix, GLDM Gray level Difference matrix, HA Histogram Analysis
Fig. 4.
Box-whisker plot of GLCM metric Entropy (measure of randomness of gray levels within an ROI) has been plotted across the four timepoints of the CEUS cine. Significant differences were observed across different timepoints between the benign and malignant breast masses
Of the four machine learning classifiers considered i.e., ElasticNet, Multivariate adaptive regression spline (MARS), REAL AdaBoost, and Random Forest (RF), RF and AdaBoost showed very similar performance, measured in terms of area under the receiver operating curve (AUC), in differentiating between benign and malignant breast masses. The best performance is from AdaBoost with AUC = 0.72 95% CI (0.564, 0.89), followed by RF AUC i.e., 0.71 95% CI (0.56, 0.87) (Fig. 5). Our study was not powered to detect the AUC difference between machine learning methods. There were no statistically significant differences detected in AUC between machine learning methods. The confusion matrix is illustrated in Table3. Adaboost and RF have sensitivity/specificity of 0.68 95% CI (0.6, 0.76)/0.69 95% CI (0.46, 0.91) and 0.69 95% CI (0.61, 0.77)/0.69 95% CI (0.46, 0.91) respectively. Sensitivity is the correct diagnosis for malignant cases, and specificity is the correct diagnosis for benign cases.
Fig. 5.
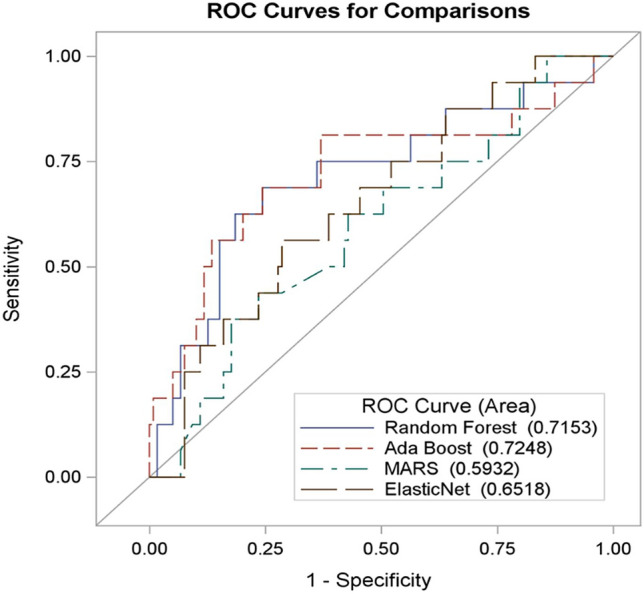
Receiver operator curve showing the prediction accuracy of the four machine-learning models used to differentiate between benign and malignant breast masses. RF and Ada Boost show comparable performance (AUC > 0.7)
Table 3.
Sensitivity, specificity, positive predictive value (PPV) and negative predictive value (NPV) of the four machine learning classifiers
| Method | Sensitivity | Specificity | PPV | NPV |
|---|---|---|---|---|
| Random Forest | 0.69 95% CI (0.61, 0.77) | 0.69 95% CI (0.46, 0.91) | 0.94 95% CI (0.89, 0.99) | 0.23 95% CI (0.11, 0.35) |
| Ada Boost | 0.68 95% CI (0.6, 0.76) | 0.69 95% CI (0.46, 0.91) | 0.94 95% CI (0.89, 0.99) | 0.22 95% CI (0.11, 0.34) |
| MARS | 0.42 95% CI (0.33, 0.51) | 0.44 95% CI (0.19, 0.68) | 0.85 95% CI (0.76, 0.94) | 0.09 95% CI (0.03, 0.16) |
| ElasticNet | 0.61 95% CI (0.53, 0.7) | 0.63 95% CI (0.39, 0.86) | 0.92 95% CI (0.87, 0.98) | 0.18 95% CI (0.08, 0.28) |
Of the radiomic metrics, the top 10 that met the criteria for variables of importance for the AdaBoost model were from the families of texture metrics from histogram analysis, followed by FFT and GLCM. This observation was consistent within the Random Forest model as well with a 70% overlap in radiomic metrics between the two models. The distribution of these metrics for AdaBoost model is summarized in Fig. 6. VOI analysis also revealed that 31 of the 33 variables (93.9%) identified by the univariate analysis greatly contributed to model performance. The majority (8 of the top 10) of the VOI were delta radiomics metrics compared to absolute value radiomic metrics.
Fig. 6.
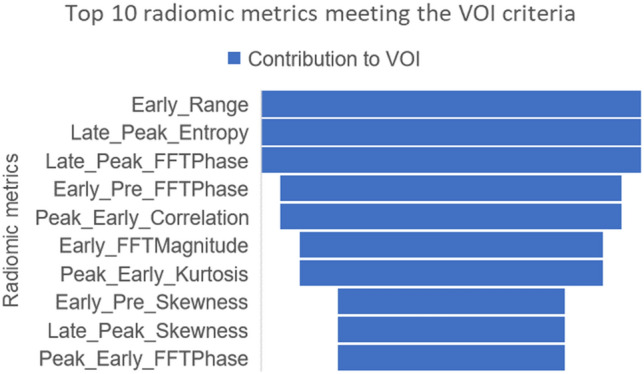
A funnel chart showing the decreasing impact of the top 10 radiomic metrics identified as VOI in the AdaBoost classifier
Discussion
Making an accurate qualitative cancer diagnosis using mammography and conventional grayscale ultrasound is still a challenge for radiologists. Here we assess the feasibility and methodology of CEUS radiomics analysis using a "practical" approach using simple bounding boxes and four key frames representing the four phases of a CEUS cine and extracting both absolute values and temporal changes across each of the four phases. Our results indicate that the CEUS-based radiomics signature could preoperatively predict breast mass characteristics with acceptable performance (AUC = 0.72 95% CI (0.564, 0.89)) to identify benign from malignant breast masses belonging to BI-RADS 4a, 4b and 4c assessment categories with confirmed histopathology.
While the application of radiomics for the analysis of breast masses has been previously reported, the reports using ultrasound are scant. Results from our study showed that CEUS-based radiomics could be used as an adjunct or supplement to the conventional clinical approach of identifying benign and malignant breast masses. This observation is in line with prior literature where, using a CEUS-based radiomics approach, Luo et al. showed that a nomogram incorporating the radiomics score and BI-RADS category showed better performance for discriminating (AUC = 0.928; 95% CI [0.88, 0.98]) malignant from benign masses than using either the radiomics score (p = 0.029) or BI-RADS category alone (p = 0.011).
Using ultrasound data from eight cancers, 22 cysts, 28 fibroadenomata, and 22 fibrocystic nodules, Garra et al. reported a sensitivity of 100% and specificity of 80% in identifying malignant masses using texture analysis [24]. Using texture analysis of ultrasound images for 71 breast masses (24 cyst, 21 solid benign masses and 26 solid malignant masses), Sivaramakrishnan et al., identified GLCM-based texture metrics that provided the best discrimination between benign vs. malignant masses (C-statistic = 0.88) [25]. Using ultrasound images from 242 patients (161 benign masses and 82 carcinomas) and texture analysis, Chen et al., reported an AUC of 0.9396 ± 0.0183, a sensitivity of 98.77%, a specificity of 81.37%, a positive predictive value of 72.73% and a negative predictive value of 99.24% for breast mass diagnosis [26]. Chen et al., reported on an artificial neural network-based prediction model that correctly identified 35 of 36 malignancies and 211 of 219 benign tumors and showed better diagnostic performance than radiologists' results [27]. In agreement with the literature, we found the relative improved performance of GLCM and histogram analysis metrics in discriminating benign from malignant breast masses. We also show that the metrics’ relative changes along four key points on the CEUS time-intensity curve have significant predictive power in identifying benign from malignant breast masses. Our comparatively lower performance may be due to the lack of extreme BI-RADS categories i.e., BI-RADS 3 and below and BI-RADS 5 within our cohort. Also, in clinical practice, histopathological confirmation is not performed for all benign masses.
Our study observes that texture metrics (particularly those from the histogram analysis and GCLM approach) demonstrate higher heterogeneity of gray level intensity in malignant masses compared to benign ones. We observed an overall lower mean intensity in benign masses compared to malignant masses. This observation is in line with prior literature. For e.g. Lee et al., reported that CEUS analysis of breast masses using time-intensity curve analysis showed benign masses tend to have homogenous enhancement and lower peak intensity [7]. The key role of tumor vasculature in lesion classification, staging, prognosis and treatment response has been demonstrated in various studies [28–31]. Therefore, it may seem that differential patterns in spatial texture created by differential dynamics of the contrast within the vasculature of the masses may be significantly different between malignant and benign masses.
Some of the study’s limitations include the sampling bias in choosing a single image from a cine clip to represent a given timepoint on the CEUS time-intensity curve. The four representative images per patient may not be exact comparisons across different patients, but we believe, they were representative of the same phenomenon. For e.g., they all captured peak enhancement, but the exact time after injection for different patients may be different. Adding more than one image to represent each phase will only help in smoothing the time-intensity curve and reinforce our results. In our study, since we used rectangular ROIs within each CEUS image per patient and the breast mass boundary was not traced, shape-based radiomic metrics were excluded from our analysis. While only a relatively low number of patients were included in our cohort, there was good confidence that CEUS data could be used to perform a radiomic analysis and perform breast mass stratification. For dealing with the imbalanced outcome, prior correction as described by King et.al. was implemented [22]. This method is a common practice in handling imbalance data. It adds prior probability to the loss function by assuming the distribution of the inputs for a target class is the same in the training data as in the population of interest. In our study, we perform a rigorous tenfold cross validation to evaluate model performance. The full dataset was equally divided into 10 folds. We re-iterated the learning process 10 times and applied the classifier to each of the testing sample. Thus, each study sample served as an independent testing case once. Within each iteration, we applied a fivefold cross validation in each learning process to determine the final prediction model before scoring through the 10% independent testing sample. The 10% of independent testing data was excluded from learning phase to avoid information leaking. In the current study, we used the most reported loss functions and did not compare different loss functions. In our study, we choose to use two types of contrast agents i.e., Definity and Lumason. The application of the different ultrasound contrast agents and different dosage of Lumason may result in different enhancement intensity and diagnostic thresholds, thus causing the failure of image standardization and unrepeatability of radiomics analysis. However, to alleviate this issue we perform normalization of the breast mass by dividing the breast mass values by mean of the normal tissue data, prior to radiomics analysis. Comparative intensity normalization techniques have been used in literature for harmonization purposes for data extracted from different scanner etc.
In conclusion, this study provides a preliminary demonstration of the use of CEUS based texture metrics to distinguish benign from malignant breast masses. Future research in CEUS based breast mass discrimination may potentially help in reducing unnecessary breast biopsies by using CEUS radiomics as an adjunct tool to CEUS and conventional imaging.
Acknowledgements
We thank Tessa Rivera for her time in performing the contrast‐enhanced ultrasound examinations.
Abbreviations
- CEUS
Contrast-enhanced ultrasound
- IRB
Institutional Review Board
- BI-RADS
Breast Imaging Reporting & Data System
- US
Conventional ultrasound
- ROI
Region of interest
- MARS
Multivariate adaptive regression spline
- RF
Random Forest
- AUC
Area under the receiver operating characteristic curve
- CI
Confidence interval
- ML
Machine learning
- IV line
Intravenous line
- HA
Histogram analysis
- GLCM
Gray level co-occurrence matrix
- GLDM
Gray level difference matrix
- FFT
Fast Fourier transform
- ROC
Receiver Operating Characteristic curve
- CVPRESS
Predicted residual sum of squares
- VOI
Variable of importance
- OOBGini
Out-of-bag Gini index
- DCIS
Ductal carcinoma in situ
- IGM
Idiopathic granulomatous mastitis
- PASH
Pseudoangiomatous stromal hyperplasia
- ADH
Atypical ductal hyperplasia
Declarations
Funding
This work was funded by Wright foundation 2016, Wright Foundation 2019.
Conflict of interest
All the authors wish to confirm no known conflicts of interest associated with this publication.
Ethical statements
Not applicable.
Informed consent
Not applicable.
Footnotes
Publisher's Note
Springer Nature remains neutral with regard to jurisdictional claims in published maps and institutional affiliations.
References
- 1.U.S. Breast Cancer Statistics. In: Breastcancer.org. 202. https://www.breastcancer.org/symptoms/understand_bc/statistics. Accessed 14 Jan 2021.
- 2.Carney PA, Parikh J, Sickles EA, et al. Diagnostic mammography: identifying minimally acceptable interpretive performance criteria. Radiology. 2013;267:359–367. doi: 10.1148/radiol.12121216. [DOI] [PMC free article] [PubMed] [Google Scholar]
- 3.Li C, Gong H, Ling L, et al. Diagnostic performance of contrast-enhanced ultrasound and enhanced magnetic resonance for breast nodules. J Biomed Res. 2018;32:198–207. doi: 10.7555/JBR.32.20180015. [DOI] [PMC free article] [PubMed] [Google Scholar]
- 4.Zhang J, Cai L, Chen L, et al. CEUS helps to rerate small breast tumors of BI-RADS Category 3 and Category 4. Biomed Res Int. 2014 doi: 10.1155/2014/572532. [DOI] [PMC free article] [PubMed] [Google Scholar]
- 5.Gu L-S, Zhang R, Wang Y, et al. Characteristics of contrast-enhanced ultrasonography and strain elastography of locally advanced breast cancer. J Thorac Dis. 2019;11:5274–5289. doi: 10.21037/jtd.2019.11.52. [DOI] [PMC free article] [PubMed] [Google Scholar]
- 6.Janu E, Krikavova L, Little J, et al. Prospective evaluation of contrast-enhanced ultrasound of breast BI-RADS 3–5 lesions. BMC Med Imaging. 2020 doi: 10.1186/s12880-020-00467-2. [DOI] [PMC free article] [PubMed] [Google Scholar]
- 7.Lee SC, Tchelepi H, Grant E, et al. Contrast-enhanced ultrasound imaging of breast masses: adjunct tool to decrease the number of false-positive biopsy results. J Ultrasound Med. 2019;38:2259–2273. doi: 10.1002/jum.14917. [DOI] [PMC free article] [PubMed] [Google Scholar]
- 8.Theek B, Opacic T, Magnuska Z, et al. Radiomic analysis of contrast-enhanced ultrasound data. Sci Rep. 2018 doi: 10.1038/s41598-018-29653-7. [DOI] [PMC free article] [PubMed] [Google Scholar]
- 9.Leng X, Huang G, Ma F, Yao L. Regional contrast-enhanced ultrasonography (CEUS) characteristics of breast cancer and correlation with microvessel density (MVD) Med Sci Monit. 2017;23:3428–3436. doi: 10.12659/MSM.901734. [DOI] [PMC free article] [PubMed] [Google Scholar]
- 10.Zhang Y, Zhang B, Fan X, Mao D. Clinical value and application of contrast-enhanced ultrasound in the differential diagnosis of malignant and benign breast lesions. Exp Ther Med. 2020;20:2063–2069. doi: 10.3892/etm.2020.8895. [DOI] [PMC free article] [PubMed] [Google Scholar]
- 11.van Timmeren JE, Cester D, Tanadini-Lang S, et al. Radiomics in medical imaging—“how-to” guide and critical reflection. Insights Imaging. 2020;11:91. doi: 10.1186/s13244-020-00887-2. [DOI] [PMC free article] [PubMed] [Google Scholar]
- 12.Varghese BA, Cen SY, Hwang DH, Duddalwar VA. Texture analysis of imaging: What radiologists need to know. AJR Am J Roentgenol. 2019;212:520–528. doi: 10.2214/AJR.18.20624. [DOI] [PubMed] [Google Scholar]
- 13.Crivelli P, Ledda RE, Parascandolo N, et al. A new challenge for radiologists: radiomics in breast cancer. In: BioMed Research International. 2018. https://www.hindawi.com/journals/bmri/2018/6120703/. Accessed 9 Nov 2020. [DOI] [PMC free article] [PubMed]
- 14.Liu F, Liu D, Wang K, et al. Deep learning radiomics based on contrast-enhanced ultrasound might optimize curative treatments for very-early or early-stage hepatocellular carcinoma patients. LIC. 2020 doi: 10.1159/000505694. [DOI] [PMC free article] [PubMed] [Google Scholar]
- 15.Wei M, Du Y, Wu X, et al. A benign and malignant breast tumor classification method via efficiently combining texture and morphological features on ultrasound images. In: Computational and Mathematical Methods in Medicine. 2020. https://www.hindawi.com/journals/cmmm/2020/5894010/. Accessed 9 Nov 2020. [DOI] [PMC free article] [PubMed]
- 16.Lee S-H, Park H, Ko ES. Radiomics in breast imaging from techniques to clinical applications: a review. Korean J Radiol. 2020;21:779–792. doi: 10.3348/kjr.2019.0855. [DOI] [PMC free article] [PubMed] [Google Scholar]
- 17.Ct R, J S, Mc H, , et al. Image J2: ImageJ for the next generation of scientific image data. BMC Bioinform. 2017;18:529–529. doi: 10.1186/s12859-017-1934-z. [DOI] [PMC free article] [PubMed] [Google Scholar]
- 18.Friedman J, Hastie T, Tibshirani R. Additive logistic regression: a statistical view of boosting (With discussion and a rejoinder by the authors) Ann Stat. 2000;28:337–407. doi: 10.1214/aos/1016218223. [DOI] [Google Scholar]
- 19.Friedman JH. Multivariate adaptive regression splines. Ann Stat. 1991;19:1–67. doi: 10.1214/aos/1176347963. [DOI] [PubMed] [Google Scholar]
- 20.Hastie T, Tibshirani R, Friedman J. Boosting and additive trees. In: Hastie T, Tibshirani R, Friedman J, editors. The elements of statistical learning: data mining, inference, and prediction. New York: Springer; 2009. pp. 337–387. [Google Scholar]
- 21.Loh W-Y. Improving the precision of classification trees. Ann Appl Stat. 2009;3:1710–1737. doi: 10.1214/09-AOAS260. [DOI] [Google Scholar]
- 22.King G, Zeng L. Logistic regression in rare events data. Polit Anal. 2001;9:137–163. doi: 10.1093/oxfordjournals.pan.a004868. [DOI] [Google Scholar]
- 23.DeLong ER, DeLong DM, Clarke-Pearson DL. Comparing the areas under two or more correlated receiver operating characteristic curves: a nonparametric approach. Biometrics. 1988;44:837–845. doi: 10.2307/2531595. [DOI] [PubMed] [Google Scholar]
- 24.Garra BS, Krasner BH, Horii SC, et al. Improving the distinction between benign and malignant breast lesions: the value of sonographic texture analysis. Ultrason Imaging. 1993;15:267–285. doi: 10.1177/016173469301500401. [DOI] [PubMed] [Google Scholar]
- 25.Sivaramakrishna R, Powell KA, Lieber ML, et al. Texture analysis of lesions in breast ultrasound images. Comput Med Imaging Graph. 2002;26:303–307. doi: 10.1016/s0895-6111(02)00027-7. [DOI] [PubMed] [Google Scholar]
- 26.Chen D-R, Chang R-F, Kuo W-J, et al. Diagnosis of breast tumors with sonographic texture analysis using wavelet transform and neural networks. Ultrasound Med Biol. 2002;28:1301–1310. doi: 10.1016/s0301-5629(02)00620-8. [DOI] [PubMed] [Google Scholar]
- 27.Chen D-R, Chang R-F, Huang Y-L, et al. Texture analysis of breast tumors on sonograms. Semin Ultrasound CT and MRI. 2000;21:308–316. doi: 10.1016/S0887-2171(00)90025-8. [DOI] [PubMed] [Google Scholar]
- 28.Du J, Li F-H, Fang H, et al. Microvascular architecture of breast lesions: evaluation with contrast-enhanced ultrasonographic micro flow imaging. J Ultrasound Med. 2008;27:833–842. doi: 10.7863/jum.2008.27.6.833. [DOI] [PubMed] [Google Scholar]
- 29.Rix A, Lederle W, Siepmann M, et al. Evaluation of high frequency ultrasound methods and contrast agents for characterising tumor response to anti-angiogenic treatment. Eur J Radiol. 2012;81:2710–2716. doi: 10.1016/j.ejrad.2011.10.004. [DOI] [PubMed] [Google Scholar]
- 30.Braman NM, Etesami M, Prasanna P, et al. Intratumoral and peritumoral radiomics for the pretreatment prediction of pathological complete response to neoadjuvant chemotherapy based on breast DCE-MRI. Breast Cancer Res. 2017;19:57. doi: 10.1186/s13058-017-0846-1. [DOI] [PMC free article] [PubMed] [Google Scholar]
- 31.Tanadini-Lang S, Bogowicz M, Veit-Haibach P, et al. Exploratory radiomics in computed tomography perfusion of prostate cancer. Anticancer Res. 2018;38:685–690. doi: 10.21873/anticanres.12273. [DOI] [PubMed] [Google Scholar]


