Background:
Urology authors are required to evaluate research achievements (RAs) in the field of bladder cancer (BC). However, no such bibliometric indices were appropriately applied to quantify the contributions to BC in research. In this study, we examined 3 questions: whether RAs in China are higher than those in the United States, how the Sankey-based temporal bar graph (STBG) may be applied to the analysis of the trend of article citations in the BC field, and what subthemes were reflected in China’s and the United States’ proportional counts in BC articles.
Methods:
Using the PubMed search engine to download data, we conducted citation analyses of BC articles authored by urology scholars since 2012. A total of 9885 articles were collected and analyzed using the relative citations ratios (RCRs) and the STBG. The 3 research goals were verified using the RCRs, the STBG, and medical subject headings (MesH terms). The choropleth map and the forest plot were used to 1 highlight the geographical distributions of publications and RCRs for countries/regions and 2 compare the differences in themes (denoted by major MeSH terms on proportional counts using social network analysis to cluster topics) between China and the United States.
Results:
There was a significant rise over the years in RCRs within the 9885 BC articles. We found that the RCRs in China were substantially higher than those in the United States since 2017, the STBG successfully explored the RCR trend of BC articles and was easier and simpler than the traditional line charts, area plots, and TBGs, and the subtheme of genetics in China has a significantly higher proportion of articles than the United States. The most productive and influential countries/regions (denoted by RCRs) were {Japan, Germany, and Italy} and {Japan, Germany, New York}, respectively, when the US states and provinces/metropolitan cities/areas in China were separately compared to other countries/regions.
Conclusions:
With an overall increase in publications and RCRs on BC articles, research contributions assessed by the RCRs and visualized by the STBGs are suggested for use in future bibliographical studies.
Keywords: bladder cancer, choropleth map, forest plot, relative citations ratio, research achievement, Sankey diagram, temporal bar graph, urology
Key points
We demonstrated the use of the relative citation ratios (RCRs) and the Sankey temporal bar graphs in comparison to research achievements in bladder cancer articles between China and the United States since 2012.
A summary of research achievements in trends for urology authors is rarely seen in bibliometrics because of difficulties in 1 trend analyses and proportional comparison in counts simultaneously displayed using traditional line charts, area plots, and TBGs and 2 RCRs normalized by citations, years, and disciplines, superior to the citations determined by article ages and research domains.
Both choropleth maps and forest plots applied to compare the differences in publications and RCRs are novel and modern in bibliometrics.
1. Introduction
Bladder cancer (BC), one of the top 10 most frequently occurring neoplasms worldwide, is the most frequently diagnosed malignancy in the urinary system and has high morbidity and mortality rates.[1,2] It leads to over 150,000 deaths per annum.[1] Chemotherapy as a BC treatment is urgent to develop potent anti-BC drugs.[3,4] Histone lysine-specific demethylase 1 (LSD1) has been considered a potential cancer therapeutic target to discover novel anti-BC agents.[5–7] Although a variety of LSD1 inhibitors have been reported to date, many of them show insufficient selectivity toward LSD1.[8]
1.1. Racial differences in BC survival
Risk factors for BC include smoking, family history, prior radiation therapy, frequent bladder infections, and exposure to certain chemicals.[9] Diagnosis is typically by cystoscopy with tissue biopsies.[10] The staging of the cancer is determined by transurethral resection and medical imaging.[11–13] Treatment depends on the stage of cancer.[13] The overall BC survival was 66% for Japanese patients, 64% for Chinese patients, 61% for Caucasians, 59% for Filipino patients, and 52% for Hawaiian patients.[14] Japanese and Chinese BC patients had higher overall survival rates than Caucasians but had substantially lower survival than the United States (77%), Canada (75%), and Europe (68%).[15–17] However, the highest rate of BC occurs in Southern and Western Europe, followed by North America, with rates of 15, 13, and 12 cases per 100,000 people.[18] The highest rates of BC deaths were seen in Northern Africa and Western Asia, followed by Southern Europe.[18] We are thus motivated to examine whether the published BC-related articles in China are also higher than those in the United States.
1.2. Different article themes conducted in countries
Although a bulk of published articles have investigated BC treatments and risk factors in the literature,[19] the characteristics of BC articles remain unclear for citation trends on topical entities (e.g., authors, journals, affiliated institutes, and countries). However, it is rather difficult to give a broad outline of BC on entities in the development and evolution over the past years.
Bibliometric analysis helps further our knowledge of BC research, topics, and trends.[1] Accordingly, it is useful to identify the most influential articles (on an impactful beam plot (IBP)[20,21] rather than those articles listed in their personal biography[1,22]) that are pertinent to this field and help us better understand and manage the BC.
From the view of bibliometric analysis,[23] documents can be organized by theme (e.g., BC) on a topical entity (e.g., author or affiliated country) for a specific feature (e.g., citations and publications). The subthemes can be determined by clustering medical subject headings (MeSH terms)[24,25] using social network analysis (SNA).[26,27] The second motivation was to investigate what subthemes (denoted by MeSH terms) were different in proportional counts between China and the United States.
1.3. The temporal bar graph can be enhanced using the Sankey diagram
We frequently experience the entity arrival over time (e.g., evolution over the years on citations and publications). Strong temporal ordering of the content is necessary for making sense of it via the temporal bar graph (TBG),[28] referred to as particular trends of entities appearing, growing in intensity (namely, burst strength [BS] used in this study later), and then fading away again.[29] Nevertheless, the BS for topical entities on the TBG was not clearly explained in the traditional TBG tool,[30,31] except in these 2 studies.[32,33] We are thus motivated to illustrate the Sankey diagram[34,35] to enhance the traditional TBG (called Sankey TBG [STBG]) using the inflection point (IP) to express the hot spot (HS), the burst strength (BS) and the trend stages to highlight the development in the latest 4 time points.[36,37] The third research question was to demonstrate how the STBG can be applied to explore the trend of article citations in the BC field.
1.4. Study aims
Aims of the study are to investigate whether the research achievements (RAs) in China are higher than those in the United States, how the STBG can be used to evaluate the trend of article citations in the BC field, and which subthemes were significantly different between China and the United States.
2. Methods
2.1. Data source
Two steps were involved in arranging the data. First, the authors searched PubMed using the keywords (urology[Affiliation]) and (bladder cancer[MeSH Major Topic]) AND ((“2012”[Date - Publication]: “2021”[Date - Publication])) as of April 12, 2022, and downloaded 9885 abstracts since 2012. A total of 9885 articles were collected and analyzed in this study; see (Supplemental File 1, Supplemental Digital Content 1, http://links.lww.com/MD/H89).
Second, based on the article contents, we extracted 5 topical entities from abstracts, including (1) affiliated countries/regions, (2) journals, (3) medical subject headings (MeSH terms), (4) article identity numbers, and (5) individual authors, based on the article relative citation ratios (RCRs)[38] over the years.
The RCRs for each article were extracted from the icite analysis,[39] implying that the RCR values measure the scientific influence of each paper by field- and time-adjusting the citations it has received and benchmarking to the median for the National Institutes of Health publications.[38]
Because all data were obtained from a publicly available database, this study does not require ethical approval.
2.2. Using the Sankey to enhance the TBG
The Sankey flow diagram (Sankey),[34,35] named Captain Matthew Sankey in 1898, emphasizes the flow/movement/change from one state to another (or one time to another).[17,18] Sankey has been applied to visualize article features in bibliometrics,[40,41] but none on their trend evolutions over the years.
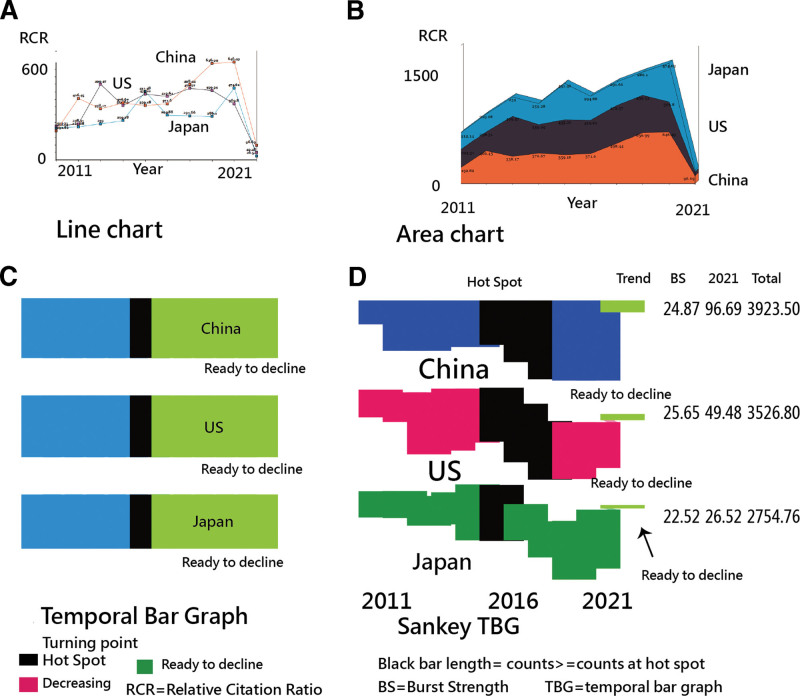
Line charts and area plots are frequently used to display data trends and evolution.[42,43] However, the HS and BS are not involved in them, as shown in TBGs[28,32,33] (to compare the 3 in panels 1 to 3 of Figure 1). The STBG was proposed in this study, including HS, BS, and the trend. The trend has been proposed in the study[36] (e.g., with 4 scenarios denoted by colors in the last column (see Fig. 1D).
Figure 1.
Comparison of trend analyses in visualization types. BS = burst strength, RCR = relative citations ratio, TBG = temporal bar graph.
2.3. Using the Sankey to display article features
.We often observed that numerous tables and figures were provided to readers without a quick look. A Sankey-based category plot (called Alluvial diagram[44,45]) was thus proposed to display all possible entities of the top 3 elements with their hT index[46,47] in a picture.
2.4. Cluster analysis of MeSH terms using SNA
Cluster analysis of MeSH terms[24,25] was performed using SNA.[26,27] We are concerned with the subthemes with the highest RCRs in each cluster. The proportional counts in subthemes were compared between the 2 countries of China and the United States using the forest plot.[48]
2.5. Geographical distributions of publications and RCRs on choropleth maps
Geographical distributions of publications based and the RCR were displayed on choropleth maps.[49] The darker areas indicate more counts/RCRs in countries/areas.
2.6. Hundred top-cited BC articles on impactful beam plot
The 100 top-cited BC articles denoted by each dot were displayed on the IBP, from the left to the right side, by normalized citations from 0 to 100 (i.e., using the MS Excel function of PercentRank[array, x, 1]×100). The red dot indicates the article related to clinical research. The IBP dashboard was shown on Google Maps. The article is immediately linked to PubMed once the dot is clicked on the dashboard.
2.7. Statistical tools and data analysis
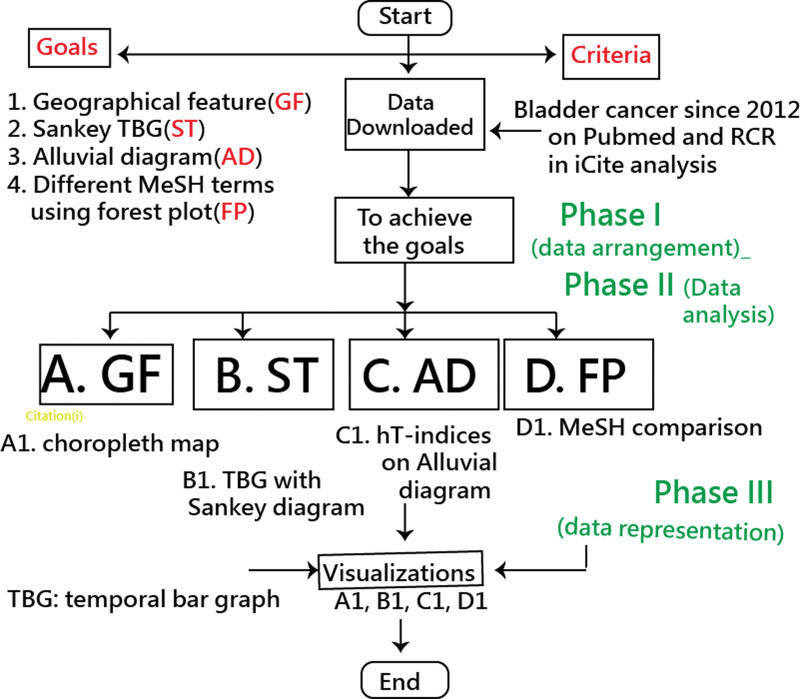
Visual representations of the STBG were drawn using the author-made modules in MS Excel. The significance level was set at Type I error (0.05). The study process is displayed in Figure 2. Data and the demonstration of STBG making are presented in Supplemental Files 1 and 2 (Supplemental Digital Content 1, http://links.lww.com/MD/H89 and Supplemental Digital Content 2, http://links.lww.com/MD/H90).
Figure 2.
Study flowchart. MeSH = medical subject headings, RCR = relative citations ratio, TBG = temporal bar graph.
3. Results
3.1. First objective: RAs in China higher than those in the United States
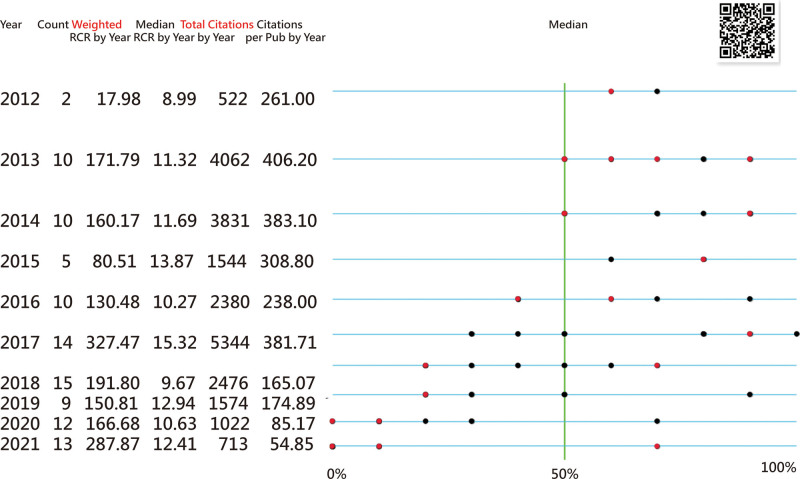
RAs in China higher than those in the United States have been verified in Figure 1D. We can see that the RCRs in 2021 were 96.69 and 49.48 and total numbers of 3923.50 and 3526.80 for China and the United States, respectively. The first research question was answered.
3.2. Second objective: Sankey-based TBGs and Alluvial diagram applied to examine the RA for each entity
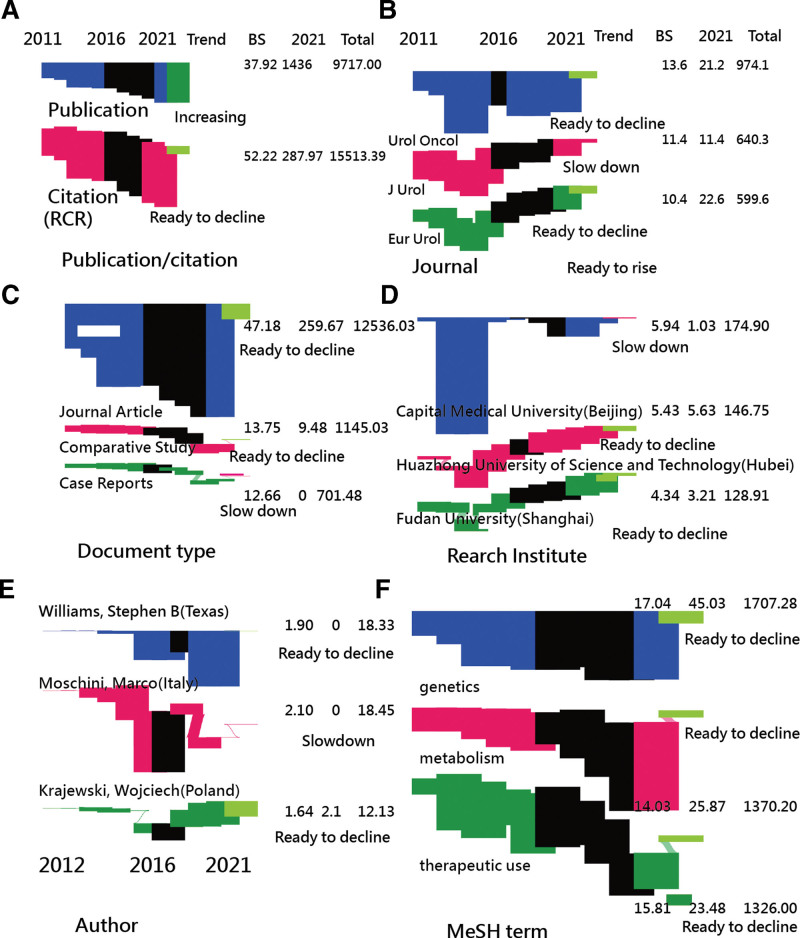
The most influential entities with higher hT indices were {China, the United States, Japan} of countries, {Urol Oncol, J Urol, Eur Urol} of journals, {Fudan University (Shanghai), Huazhong University of Science and Technology (Hubei), Capital Medical University (Beijing)} of institutes, {Zhang, P (Beijing), Namekawa, Takeshi (Japan), Takayama, Tatsuya (Japan)} of authors, and {Journal Article, Comparative Study, Case Reports} of document types. All of this information about the HB, BS, and the trend is simultaneously displayed on the STBGs in Figure 3. The second research question was answered.
Figure 3.
Comparison of RCR for each entity using the Sankey TBG. BS = burst strength, MeSH = medical subject headings, RCR = relative citations ratio, TBG = temporal bar graph.
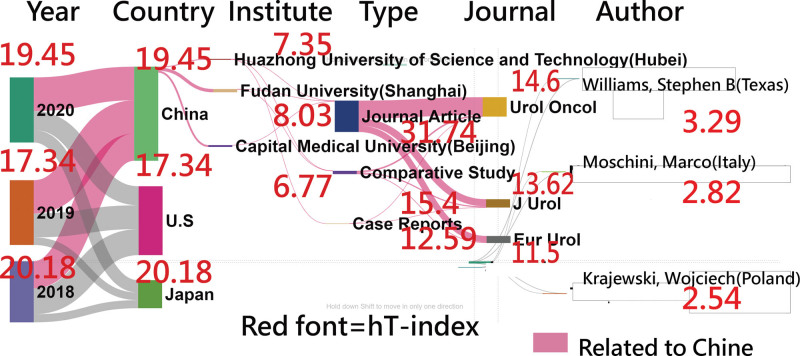
Six top-cited entities (i.e., year, country, institute, journal, author, and document type) with their hT indices are shown in Figure 4. Traditionally, we should provide more tables and figures to present the results.
Figure 4.
hT indices for entities shown on the Alluvial diagram.
3.3. Third objective: Subtheme differences in proportional counts between China and the United States
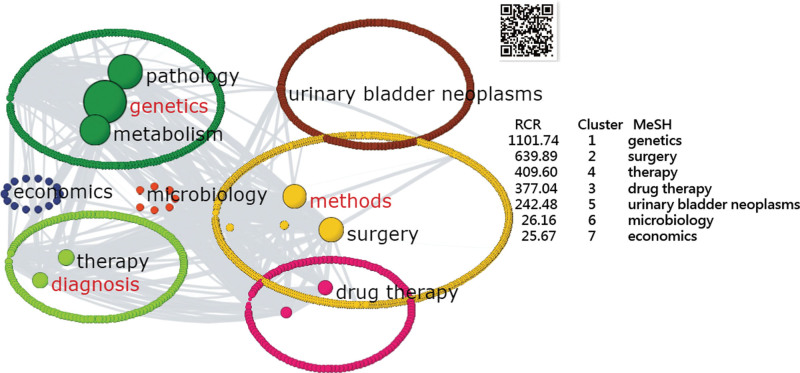
Seven MeSH clusters were separated in Figure 5 using SNA,[26,27] as shown in Figure 5. Next in Figure 6, we observe that the subtheme of genetics in China has significantly higher proportional counts (P < .001) in articles than those in the United States. No difference was found in microbiology (P = .311). The other 5 subthemes favor the United States, including surgery, therapy, drug therapy, urinary bladder neoplasms, and economics (Fig. 6). The third research question was answered.
Figure 5.
Cluster analysis of MeSH terms to be ten clusters based on RCR. MeSH = medical subject headings, RCR = relative citations ratio.
Figure 6.
Proportional counts of subthemes between China and the United States.
3.4. Additional visualizations in contrast to the traditional graphs
3.4.1. The region-based geographics rather than the traditional world map.
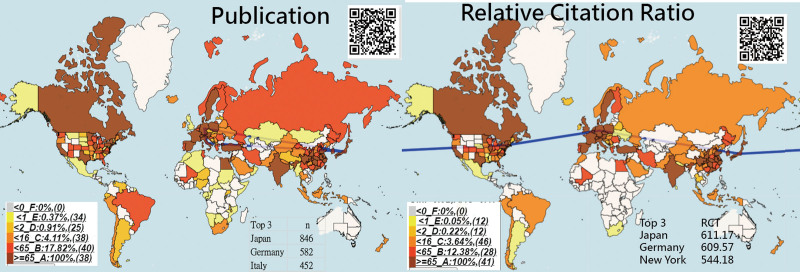
The publication and RCR-based choropleth map[49] are shown in Figure 7. We can see that the most productive and influential countries/regions (denoted by RCRs) were {Japan, Germany, and Italy} and {Japan, Germany, New York}, respectively when the US states and provinces/metropolitan cities/areas in China were separately compared to other countries/regions.
Figure 7.
Geographical distribution of publications and RCRs on BC articles since 2012. RCR = relative citations ratio.
3.4.2. IBP used to display 100 top-cited BC articles.
The 100 top-cited BC articles with dots are displayed on the IBP shown in Figure 8. The red dot indicates the clinical research. The article immediately appears on PubMed once the dot of interest is clicked. The article[50] authored by Babjuk et al from the Czech Republic was cited 621 times as of April 10, 2022. The article entitled the European Association of Urology (EAU) Guidelines on nonmuscle-invasive Urothelial Carcinoma of the Bladder and published by Eur Urol. in 2017.
Figure 8.
Hundred top-cited BC articles on the impactful beam plot. BC = bladder cancer, RCR = relative citations ratio.
3.6. Online dashboards shown on Google Maps
All dashboards in Figures 5 to 8 appear once the QR code is scanned or the links are clicked. Readers are advised to examine the details of the information for each entity. Links[51–54] are provided for better understanding of Figures 3 and 4/
4. Discussion
4.1. Principal findings
We observed that the RCRs in China were substantially higher than those in the United States since 2017, the STBG successfully explored the RCR trend of BC articles and was easier and simpler than the traditional ways using line charts, area plots, and TBGs, and the subtheme of genetics in China has a significantly higher proportion of articles than the United States. The most productive and influential countries/regions (denoted by RCRs) were {Japan, Germany, and Italy} and {Japan, Germany, New York}, respectively, when the US states and provinces/metropolitan cities/areas in China were separately compared to other countries/regions. The IBP used to display 100 top-cited articles is promising and novel in bibliometrics.
4.2. Trend analysis of topical entities in BC
The most-cited BC articles show that the most productive countries were China (24%), the United States (23%), and Japan (9%), different from the results of the United States (58%) and China (1%) reported from 100 top-cited BC articles since 1950.[1]
Japanese and Chinese BC patients had higher overall survival rates than Caucasians but had substantially lower survival than the United States (77%), Canada (75%), and Europe (68%).[15–17] More BC article were published in those countries that have lower BC survival rates.
The greatest number of articles in the top 100 were published in the Journal of Urology (n = 15), followed by the Journal of Clinical Oncology (n = 14) and European Urology (n = 13),[1] different from our findings of {Urol Oncol, J Urol, Eur Urol}(Fig. 4) based on the hT index instead of publications alone.
The most cited article authored by Babjuk et al[50] from the Czech Republic was cited 621 times since 2017, different from the finding[1] of the article (Stein et al[55] Journal of Clinical Oncology 2001, 851 citations in PubMed)
The article[1] used 2 tables and 6 figures to display study results in contrast to the current study using 2 figures in Methods and 6 figures in results, albeit more information was provided in this study, including the trend of each entity, geographical distribution of publications (and citations) in countries/regions, and comparison of subthemes between China and the United States based on the proportional counts observed in 9885 BC-related articles since 2012 in PubMed.
Importantly, publications have been increasing, and citations are ready to decline based on the last 4-year data shown in Figure 3A. However, the RCRs in several other entities increased (Fig. 3), indicating that the RCR trend in BC is viable and feasible when compared to the traditional total citations, dependent on the article age with a tendency toward a decreasing trend always on all entities.
It is worth mentioning that the enhanced TBG leads us to focus attention on the trend in addition to the HS shown in the traditional TBG.[28,32,33] For example, the RCRs were observed not only in the trend but also in the comparison of proportions among entities over the years. In addition, the HSs are a period of years instead of the turning point only, similar to a previous study[28] displaying HSs for keywords on TBGs.
4.3. Three most-cited articles
The most cited BC articles were {32360052, 27324428, 27375033} based on the article PubMed Unique Identifier with RCRs (124.92, 77.1, 57.39, respectively) rather than citations (198, 621, 450, respectively).
The top-ranked article was titled “European Association of Urology Guidelines on Muscle-invasive and Metastatic Bladder Cancer.”[56] It was cited 198 times, and RCR = 124.92, indicating that guidelines on muscle-invasive and metastatic BC are important to BC research.
The second-ranked article was cited 621 times with RCR = 77.1 and was titled “The European Association of Urology (EAU) Guidelines on Non-Muscle-Invasive Urothelial Carcinoma of the Bladder” and published by Eur Urol. in 2017.[50] The guidelines are also important to BC research.
The third-ranked article was cited 450 times with RCT = 57.39 in PubMed and titled “Updated 2016 EAU Guidelines on Muscle-Invasive and Metastatic Bladder Cancer,”[57] indicating that the guidelines are important to BC research as well.
4.4. Strengths and implications
The strengths and implications of the current study are listed below:
First, the enhanced TBG (called STBG) was demonstrated using the Sankey. We can easily examine the 3 major features: HS, BS, and the RCR trend, which are not mentioned in the traditional TBGs, line charts, and area plots.
Second, the Sankey category diagram (called the Alluvial diagram) is focused on the article entities and their category dimensions on the x-axis. One look is worth 1000 words. Traditionally, the results require ≥5 tables to display. Wikipedia says that an Alluvial diagram is a type of Sankey diagram “that uses the same kind of representation to depict how items regroup”.[44] Although the 2 terms are thus used interchangeably in practice, we prefer to use the name of Alluvial diagram shown in Figure 4, owing to dimensions rather than paths between related events (e.g., steps) on the x-axis.
Third, the traditional TBG[28,32,33] was enhanced through additional information provided for readers to understand the network features of BC articles, including HSs, BS, and the data trend. The STBG has the identical proportional feature as the area plot illustrated in Figure 1, but more information is provided from the Sankey than from line charts, area plots, and traditional TBGs.
Fourth, the hT index was used in this study. The reason is that the hT index is highly associated with the h-index[46,47] and has a higher discrimination power because of providing decimal values instead of integral numbers as the h-index has. The computation of the hT index is shown at the link.[58] Readers are invited to use the link to compute the hT index.
Fifth, the method used to conduct this study is deposited in (Supplemental File 2, Supplemental Digital Content 2, http://links.lww.com/MD/H90). Through this, we can easily understand how to draw the STBG on their own.
Sixth, BC is one of the top 10 most frequently occurring neoplasms worldwide and is the most frequently diagnosed malignancy in the urinary system.[1,2] The kind of bibliometric analysis of BC using STBG is modern and has never been seen before in the literature. Bibliometric analysis helps further our knowledge of BC research, topics, and trends.[1] It is useful to identify the most influential articles and their impact pertinent to the BC, particularly using the IBP to display the 100 top-cited articles on a dashboard. Furthermore, the STBG and Alluvial diagram are recommended for future research in bibliometrics.
4.5. Limitations and suggestions
Nonetheless, there are still some limitations in this study. First, the database was exclusively extracted from PubMed. The results of this study might be different from those of other major citation databases, such as Scopus, Web of Science, and Embase.
Second, the authors used the article RCRs instead of citations as indicators to measure the RAs. The results would be somewhat different from those studies using the citations. Nonetheless, the RCR is recommended for future studies because they have been adjusted and normalized, allowing citations to be compared by year and discipline. Otherwise, the citations would always show a decreasing trend because citations are increased by article age.
Third, the dashboards in Figures 5 to 8 are shown on Google Maps. The use of Google Maps is not free of charge using the application programming interface (API) with a paid project key. The limitation of the dashboard is not publicly accessible if no such API was applied. The process of making dashboards is provided in Appendix 2, which helps readers apply the procedures to other topics.
Fourth, the item-response-theory model was applied to determine the IP days (or locations) and the burst spot on the TBG.[28,32,33] Future studies are required to examine other mathematical models (instead of the Newton–Raphson Iteration Method, Newton–Raphson Iteration Method[59–62]) to determine the IPs on a given ogive curve for use in the Sankey.
Finally, the growth rate computed in studies[36,37] is set back to the last 4 years. Future studies can be adaptive to the practical need using appropriate conditions, such as 2, 6 years, or more, to define the growth of the TBG.
5. Conclusions
This study was the first to report the trend of the most cited entities in BC articles using Sankey-based TBGs. The results of this study provide a historical perspective on scientific evolution and disclose the research trends of topical entities in the BC field. This study identified 100 top-cited articles on the IBP and drew an Alluvial diagram to present the authors, affiliated countries, journals, and MeSH terms with the block; the higher means more hTs to evaluate the RAs contributed to the BC research. Research contributions assessed by the RCRs and visualized by the STBGs are suggested for use in future bibliographical studies.
Acknowledgments
We thank Enago (www.enago.tw) for the English language review of this article.
Authors contributions
YL and JC provided the concept and designed this study, TW interpreted the data, and YC monitored the process and the article. TW and YL drafted the article. All authors read the article and approved the final article.
Supplementary Material
Abbreviations:
- BC =
- bladder cancer
- BS =
- burst strength
- HS =
- hot spot
- IP =
- inflection point
- MeSH =
- medical subject headings
- RA =
- research achievement
- RCR =
- relative citations ratio
- SNA =
- social network analysis
- STBG =
- Sankey temporal bar graph.
How to cite this article: Lee Y-L, Chien T-W, Wang J-C. Using Sankey diagrams to explore the trend of article citations in the field of bladder cancer: Research Achievements in China higher than those in the United States. Medicine 2022;101:34(e30217).
The datasets generated during and/or analyzed during the current study are publicly available. All data used in this study are available in Supplemental Files.
Supplemental Digital Content is available for this article.
The authors declare that they have no competing interests.
The authors have no funding and conflicts of interest to disclose.
Contributor Information
Yen-Ling Lee, Email: yenpig8291@gmail.com.
Tsair-Wei Chien, Email: smile@mail.chimei.org.tw.
References
- [1].Mainwaring A, Bullock N, Ellul T, et al. The top 100 most cited manuscripts in bladder cancer: a bibliometric analysis (review article). Int J Surg. 2020;75:130–8. [DOI] [PubMed] [Google Scholar]
- [2].Li Y, Li G, Guo X, et al. Noncoding RNA in bladder cancer. Cancer Lett. 2020;485:38–44. [DOI] [PubMed] [Google Scholar]
- [3].Xu X, Liu K, Jiao B, et al. Mucoadhesive nanoparticles based on ROS activated gambogic acid prodrug for safe and efficient intravesical instillation chemotherapy of bladder cancer. J Control Release. 2020;324:493–504. [DOI] [PubMed] [Google Scholar]
- [4].Zhang M, Du H, Wang L, et al. Thymoquinone suppresses invasion and metastasis in bladder cancer cells by reversing EMT through the Wnt/β-catenin signaling pathway. Chem Biol Interact. 2020;320:109022. [DOI] [PubMed] [Google Scholar]
- [5].Wang X, Zhang C, Zhang X, et al. Design, synthesis and biological evaluation of tetrahydroquinoline-based reversible LSD1 inhibitors. Eur J Med Chem. 2020;194:112243. [DOI] [PubMed] [Google Scholar]
- [6].Liu HM, Suo FZ, Li XB, et al. Discovery and synthesis of novel indole derivatives-containing 3-methylenedihydrofuran-2(3H)-one as irreversible LSD1 inhibitors. Eur J Med Chem. 2019;175:357–372. [DOI] [PubMed] [Google Scholar]
- [7].Chen Y, Kim J, Zhang R, et al. Histone demethylase LSD1 promotes adipocyte differentiation through repressing Wnt signaling. Cell Chem Biol. 2016;23:1228–40. [DOI] [PubMed] [Google Scholar]
- [8].Karakaidos P, Verigos J, Magklara A. LSD1/KDM1A, a gate-keeper of cancer stemness and a promising therapeutic target. Cancers. 2019;11:1821. [DOI] [PMC free article] [PubMed] [Google Scholar]
- [9].Riveros C, Jazayeri SB, Chalfant V, et al. The geriatric nutritional risk index predicts postoperative outcomes in bladder cancer: a propensity score-matched analysis. J Urol. 2022;207:797–804. [DOI] [PubMed] [Google Scholar]
- [10].Tasleem AM, Grouse ED, Almushatat A. Keratinising squamous cell metaplasia: when is it safe to stop looking? BMJ Case Rep. 2018;2018:bcr2017223822. [DOI] [PMC free article] [PubMed] [Google Scholar]
- [11].CancerNet. Bladder cancer - stages and grades. Availableat: https://www.cancer.net/cancer-types/bladder-cancer/stages-and-grades. [access date April 10, 2022].
- [12].Uroweb. Nonmuscle-invasive bladder cancer. Available at: https://uroweb.org/guidelines/non-muscle-invasive-bladder-cancer. [access date April 11, 2022].
- [13].NIH. Bladder cancer treatment (PDQ®)–patient version. Available at: https://www.cancer.gov/types/bladder/patient/bladder-treatment-pdq. [access date April 11, 2022].
- [14].Hashibe M, Gao T, Li G, et al. Comparison of bladder cancer survival among Japanese, Chinese, Filipino, Hawaiian and Caucasian populations in the United States. Asian Pac J Cancer Prev. 2003;4:267–73. [PubMed] [Google Scholar]
- [15].NIH. Cancer stat facts: bladder cancer. Available at: https://seer.cancer.gov/statfacts/html/urinb.html. [access date April 11, 2022].
- [16].WCRF. Bladder cancer. Available at: https://www.wcrf.org/dietandcancer/bladder-cancer/. [access date April 11, 2022].
- [17].Canadian Cancer Society. Survival statistics for bladder cancer. Available at: https://cancer.ca/en/cancer-information/cancer-types/bladder/prognosis-and-survival/survival-statistics. [access date April 11, 2022].
- [18].WHO. The number of bladder cancer patients compared to other cancers. Available at: https://gco.iarc.fr/today/data/factsheets/cancers/30-Bladder-fact-sheet.pdf. [access date April 11, 2022].
- [19].PMC. Over 121 Article on BC treatments and risk factors. Available at: https://pubmed.ncbi.nlm.nih.gov/?term=bladder+cancer%5BMeSH+Major+Topic%5D+and++BC+treatments+and+risk+factors&sort=pubdate. [access date April 11, 2022].
- [20].WOS. Author impact beam plots in Web of Science Author Records. Available at: https://videos.webofsciencegroup.com/watch/6JXtExi8hRiTgJHSyGi6Vm [access date 14 January 2022].
- [21].Clarivate. New WOS February 25 release notes. Available at: https://clarivate.com/webofsciencegroup/release-notes/wos/new-wos-February-25-release-notes/. [access date 14 January 2022].
- [22].Zhang M, Zhou Y, Lu Y, et al. The 100 most-cited articles on prenatal diagnosis: a bibliometric analysis. Medicine (Baltim). 2019;98:e17236. [DOI] [PMC free article] [PubMed] [Google Scholar]
- [23].Block JH, Fisch C. Eight tips and questions for your bibliographic study in business and management research. Manag Rev Q. 2020;70:307–12. [Google Scholar]
- [24].Motamedi M, Carter SM, Degeling C. Women’s experiences of and perspectives on transvaginal mesh surgery for stress urine incontinency and pelvic organ prolapse: a qualitative systematic review. Patient. 2022;15:157–69. [DOI] [PMC free article] [PubMed] [Google Scholar]
- [25].Bhattarai AK, Zarrin A, Lee J. Applications of information and communications technologies to public health: a scoping review using the MeSH term: “public health informatics”. Online J Public Health Inform. 2017;9:e192. [DOI] [PMC free article] [PubMed] [Google Scholar]
- [26].Chien TW, Wang HY, Chang Y, et al. Using google maps to display the pattern of coauthor collaborations on the topic of schizophrenia: a systematic review between 1937 and 2017. Schizophr Res. 2019;204:206–13. [DOI] [PubMed] [Google Scholar]
- [27].Chien TW, Wang HY, Kan WC, et al. Whether article types of a scholarly journal are different in cited metrics using cluster analysis of MeSH terms to display: a bibliometric analysis. Medicine (Baltim). 2019;98:e17631. [DOI] [PMC free article] [PubMed] [Google Scholar]
- [28].Shen L, Xiong B, Li W, et al. Visualizing collaboration characteristics and topic burst on international mobile health research: bibliometric analysis. JMIR Mhealth Uhealth. 2018;6:e135. [DOI] [PMC free article] [PubMed] [Google Scholar]
- [29].Kleinberg J. Bursty and hierarchical structure in streams. Data Min Knowl Discov Vol. 2003;7:373–97. [Google Scholar]
- [30].Dehghanbanadaki H, Aazami H, Keshavarz Azizi Raftar S, et al. Global scientific output trend for akkermansia muciniphila research: a bibliometric and scientometric analysis. BMC Med Inform Decis Mak. 2020;20:291. [DOI] [PMC free article] [PubMed] [Google Scholar]
- [31].Team S. Science of science (Sci2) tool. Indian Univ SciTech Strat. 2009. [Google Scholar]
- [32].Chow JC, Chien TW, Chou W. Suggestions to the article: demonstrating the ascendancy of COVID-19 research using acronyms. Scientometrics. 2022;127:2897–9. [DOI] [PMC free article] [PubMed] [Google Scholar]
- [33].Ho SY, Chien TW, Shao Y, et al. Visualizing the features of inflection point shown on a temporal bar graph using the data of COVID-19 pandemic. Medicine (Baltim). 2022;101:e28749. [DOI] [PMC free article] [PubMed] [Google Scholar]
- [34].Lamer A, Laurent G, Pelayo S, et al. Exploring patient path through sankey diagram: a proof of concept. Stud Health Technol Inform. 2020;270:218–22. [DOI] [PubMed] [Google Scholar]
- [35].Yu B, Silva CT. VisFlow - web-based visualization framework for tabular data with a subset flow model. IEEE Trans Vis Comput Graph. 2017;23:251–60. [DOI] [PubMed] [Google Scholar]
- [36].Yang DH, Chien TW, Yeh YT, et al. Using the absolute advantage coefficient (AAC) to measure the strength of damage hit by COVID-19 in India on a growth-share matrix. Eur J Med Res. 2021;26:61. [DOI] [PMC free article] [PubMed] [Google Scholar]
- [37].Kan WC, Kuo SC, Chien TW, et al. Therapeutic duplication in taiwan hospitals for patients with high blood pressure, sugar, and lipids: evaluation with a mobile health mapping tool. JMIR Med Inform. 2020;8:e11627. [DOI] [PMC free article] [PubMed] [Google Scholar]
- [38].Hutchins BI, Yuan X, Anderson JM, et al. Relative Citation Ratio (RCR): a new metric that uses citation rates to measure influence at the article level. PLoS Biol. 2016;14:e1002541. [DOI] [PMC free article] [PubMed] [Google Scholar]
- [39].NIH. ICite tool. Available at: https://icite.od.nih.gov/analysis. [access date January 7, 2022].
- [40].Liu PC, Lu Y, Lin HH, et al. Classification and citation analysis of the 100 top-cited articles on adult spinal deformity since 2011: a bibliometric analysis. J Chin Med Assoc. 2022;85:401–8. [DOI] [PubMed] [Google Scholar]
- [41].Kuo YC, Chien TW, Kuo SC, et al. Predicting article citations using data of 100 top-cited publications in the journal Medicine since 2011: a bibliometric analysis. Medicine (Baltim). 2020;99:e22885. [DOI] [PMC free article] [PubMed] [Google Scholar]
- [42].Barnett A, Doubleday Z. The growth of acronyms in the scientific literature. Elife. 2020;9:e60080. [DOI] [PMC free article] [PubMed] [Google Scholar]
- [43].Sanyal T, Kaviraj A, Saha S. Deposition of chromium in aquatic ecosystem from effluents of handloom textile industries in ranaghat-fulia region of West Bengal, India. J Adv Res. 2015;6:995–1002. [DOI] [PMC free article] [PubMed] [Google Scholar]
- [44].Wiki. Alluvial diagram. Available at: https://en.wikipedia.org/wiki/Alluvial_diagram. [access date March 22, 2022].
- [45].Ribecca S. Sankey diagrams, parallel sets & alluvial diagrams. what’s the difference? Available at: https://datavizcatalogue.com/blog/sankey-diagrams-parallel-sets-Alluvial-diagrams-whats-the-difference/. [access date March 22, 2022].
- [46].Anderson TR, Hankin RKS, Killworth PD. Beyond the durfee square: enhancing the h-index to score total publication output. Scientometrics. 2008;76:577–88. [Google Scholar]
- [47].Hua PH, Wan JK, Wu JH. A perfect hirsch-type index? experiences using the tapered h-index (hT). Chin J Sci Tech Period. 2010;21:33–7. [Google Scholar]
- [48].Yan YH, Chien TW. The use of forest plot to identify article similarity and differences in characteristics between journals using medical subject headings terms: a protocol for bibliometric study. Medicine (Baltim). 2021;100:e24610. [DOI] [PMC free article] [PubMed] [Google Scholar]
- [49].Chien TW, Wang HY, Hsu CF, et al. Choropleth map legend design for visualizing the most influential areas in article citation disparities: a bibliometric study. Medicine (Baltim). 2019;98:e17527. [DOI] [PMC free article] [PubMed] [Google Scholar]
- [50].Babjuk M, Böhle A, Burger M, et al. EAU Guidelines on non-muscle-invasive urothelial carcinoma of the bladder: update 2016. Eur Urol. 2017;71:447–61. [DOI] [PubMed] [Google Scholar]
- [51].Chien TW. Figure 1 in this study. Available at: http://www.healthup.org.tw/aif/aif.asp?mname=F1fourcomparison-01&width=800. [access date July 4, 2022].
- [52].Chien TW. Figure 2 in this study. Available at: http://www.healthup.org.tw/aif/aif.asp?mname=F2%20chartflow-01&width=600 [access date July 4, 2022].
- [53].Chien TW. Figure 3 in this study. Available at: http://www.healthup.org.tw/aif/aif.asp?mname=F3datavisuaol-01-01&width=800 [access date July 4, 2022].
- [54].Chien TW. Figure 4 in this study. Available at: http://www.healthup.org.tw/aif/aif.asp?mname=F4%20Alluvial-01-01-01&width=1400. [access date July 4, 2022].
- [55].Stein JP, Lieskovsky G, Cote R, et al. Radical cystectomy in the treatment of invasive bladder cancer: long-term results in 1,054 patients. J Clin Oncol. 2001;19:666–75. [DOI] [PubMed] [Google Scholar]
- [56].Witjes JA, Bruins HM, Cathomas R, et al. European association of urology guidelines on muscle-invasive and metastatic bladder cancer: summary of the 2020 guidelines. Eur Urol. 2021;79:82–104. [DOI] [PubMed] [Google Scholar]
- [57].Alfred Witjes J, Lebret T, Compérat EM, et al. Updated 2016 EAU guidelines on muscle-invasive and metastatic bladder cancer. Eur Urol. 2017;71:462–75. [DOI] [PubMed] [Google Scholar]
- [58].Chien TW. The computation of hT-index on the website. Available at: http://www.healthup.org.tw/kpiall/hTindexurl.asp. [access date March 3, 2022].
- [59].Wang LY, Chien TW, Chou W. Using the IPcase index with inflection points and the corresponding case numbers to identify the impact hit by COVID-19 in China: an observation study. Int J Environ Res Public Health. 2021;18:1994. [DOI] [PMC free article] [PubMed] [Google Scholar]
- [60].Shao Y, Chien TW. The determination of inflection point on a given ogive curve using the item response theory(IRT) model. J Bibliograph Anal Stat. 2021;18:31–3. [Google Scholar]
- [61].Linacre JM. Rasch estimation: iteration and convergence. Rasch Measure Trans. 1987;1:7–8. [Google Scholar]
- [62].Shao Y, Nadkarni S, Niu K, et al. Understanding of the newton–raphson iteration method in rasch model. J Bibliograph AnalStat. 2021;18:71–6. [Google Scholar]
Associated Data
This section collects any data citations, data availability statements, or supplementary materials included in this article.


