Abstract
Morphological control in oxide nanocomposites presents enormous opportunities for tailoring the physical properties. Here, we demonstrate the strong tunability of the magnetic and optical properties of Bi-based layered supercell (LSC) multiferroic structures, i.e., BiAl1−xMnxO3, by varying the Al : Mn molar ratio. The microstructure of the LSC structure evolves from a supercell structure to Al-rich pillars in the supercell structure as the Al molar ratio increases. The LSC structures present excellent multiferroic properties with preferred in-plane magnetic anisotropy, a tunable band gap and anisotropic dielectric permittivity, all attributed to the microstructure evolution and their anisotropic microstructure. Three different strain relaxation mechanisms are identified that are active during thin film growth. This study provides opportunities for microstructure and physical property tuning which can also be explored in other Bi-based LSC materials with tailorable multiferroic and optical properties.
Morphology tuning of Bi-based layered structures by varying the Al : Mn molar ratio leads to tunable magnetic and optical properties.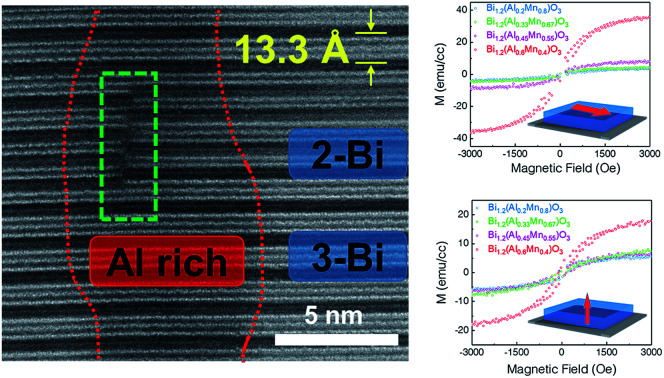
Introduction
The tunability of magnetic and relative dielectric properties of materials is of both scientific and technological importance owing to their wide applications in data storage, sensors, high frequency phase shifters, and microwave transmitters and receivers.1–4 Such property tuning can be achieved by applying an electric bias or magnetic field as well as with temperature changes, holding significant promise for the design and fabrication of electronic devices.5 For example, ferroelectric materials show very high tunability of their dielectric permittivity near the Curie temperature while tuning of magnetic properties with an electric field and vice versa have been demonstrated in multiferroic materials.6–10 However, single-phase multiferroic materials are rare due to the contradictory requirements for the co-existence of ferroelectricity and ferromagnetism and offer limited tunability.11 Recent efforts to discover new multiferroic materials have been focused on the exploration of novel nanocomposites or layered oxide materials.12–17
The nanocomposite approach requires combining a ferromagnetic material with a ferroelectric material to achieve multiferroic properties. Different two-phase vertically aligned nanocomposite (VAN) thin films including BiFeO3–CoFe2O4, BaTiO3–YMnO3 and BaTiO3–CoFe2O4 have been demonstrated as multiferroic materials.12,16,18 Both the ferroelectric and ferromagnetic properties are enhanced due to the vertical strain coupling between the two phases. Tuning of the properties in VANs has been explored by changing the relative density, ordering, geometry, and crystallographic orientation of the phases.19–24 Recently, self-assembled layered supercell (LSC) structure thin films have been demonstrated as a new family of materials with room temperature multiferroic properties.15,25–27 For example, layered supercell structures including Bi2FeMnO6, Bi2AlMnO6 and Bi2NiMnO6 have shown excellent room-temperature multiferroicity.15,26–28 The ferromagnetism arises from the coupled Mn–M (M = Fe, Al and Ni) cations while ferroelectricity comes from the lone-pair electrons of Bi cations. The formation of the supercell structure in these systems is attributed to the strain relaxation mechanism.29 Such layered materials containing Aurivillius and Ruddlesden–Popper phases have various applications in piezoelectricity, superconductivity, water splitting and thermoelectricity.30–33 These self-assembled LSC structures offer great possibilities for tailoring the physical properties by varying the elemental molar ratio and the number of layers. Despite the limited success in obtaining new LSC structures by varying the element of M cations, the underlying mechanism(s) for the formation of the LSC structure is still under investigation and the application of tunable physical properties in LSC systems is limited, largely due to the challenges in the growth of these of LSC systems.15,25,26,34
In this work, we demonstrate that it is possible to tune the microstructure and resulting physical properties in LSC systems. The tunable physical properties include magnetization, optical band gap and anisotropic dielectric permittivity. We selected BiAl1−xMnxO3 (BA1−xMxO) layered supercell thin films with various Al : Mn molar ratios, deposited on SrTiO3 (STO) (001) substrates using pulsed laser deposition (PLD), to study the different strain relaxation mechanisms and to demonstrate the tunable physical properties. These LSC structures are stabilized by the alternating Bi-based slabs and Al/Mn layers. Besides, different growth mechanisms are also investigated as a function of composition tuning. Thin films show distinct microstructural changes for the four different compositions (x = 0.4, 0.55, 0.67, and 0.8), with a mixture of LSC and vertically aligned nanocomposite (VAN) structures, which are correlated to their tunable physical properties. This composition tuning offers a new and easy approach for microstructure and physical property tuning in LSC systems beyond the prior approach of varying the M elements.
Results and discussion
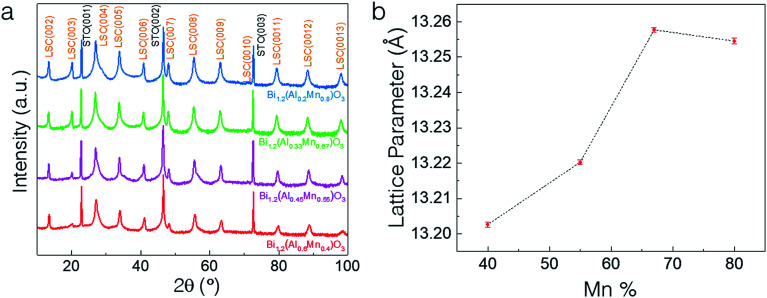
The microstructure and morphology of BAMO thin films with different Al/Mn molar ratios are compared using X-ray diffractometry (XRD), high-angle annular dark field scanning transmission electron microscopy (HAADF-STEM) and electron diffraction. The film composition for all the samples was determined using energy-dispersive X-ray spectroscopy (EDS) in scanning electron microscopy mode (SEM). The Bi/(Al + Mn) ratio for all the films was found to be ∼1.2 (Table S1, ESI†), making the effective chemical formula Bi1.2Al1−xMnxO3 (BA1−xMxO), with the presence of excessive Bi, which will be discussed in more detail later. Specifically, four different thin film samples with Mn percentages of 40%, 55%, 67% and 80% were fabricated on an STO(001) substrate. Fig. 1a shows the XRD θ–2θ scans of the BA1−xMxO thin films, indicating the highly (00l) textured growth of BA1−xMxO films for all the compositions. The peaks marked with S (00l) belong to the layered supercell (LSC) structure, arising from the Bi3O3 sublattices along the out-of-plane direction. Since the crystal structure (i.e., layered oxide structure) and crystalline quality of all the films are similar, the XRD results show a very similar diffraction pattern for all the different compositions. It is noted that the composition BiAlO3 (BAO) did not show the formation of the supercell structure, as evidenced in ESI Fig. S1.† This suggests that the Mn composition plays an important role in the formation of the supercell structure. Interestingly, the intensity of the LSC peaks continuously increases with the increase of the Mn molar ratio, implying that Mn makes the LSC structure formation favorable. Additionally, the LSC peak gradually shifts to the right with the decreasing Mn content. Fig. 1b shows the increase in the out-of-plane d-spacing of the LSC structures ranging from 13.19 Å to 13.26 Å with the increase of the Mn content. The out-of-plane d-spacing for x = 0.67 and x = 0.8 is 13.257 Å and 13.254 Å, respectively. This minor increase is within the error limit and thus can be assumed to be almost similar. It is also noted that a mix of 2-Bi and 3-Bi structures in the x = 0.8 sample could also contribute to the minor increase of the c-lattice parameter compared to that of the x = 0.67 structure. Therefore, Mn in the film plays a critical role in tailoring the microstructure as observed in the (S)TEM images.
Fig. 1. (a) XRD θ–2θ scans of the BA1−xMxO thin films, indicating the highly (001) textured growth for all the compositions deposited on the SrTiO3 (001) substrate and (b) increase in the out-of-plane d-spacing of the layered supercell structures with the increase in the Mn content.
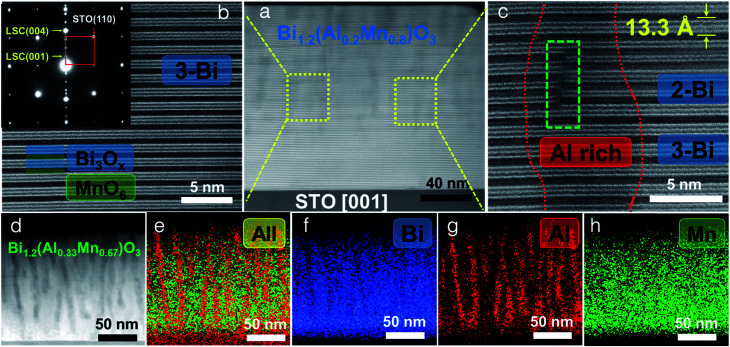
The microstructure and phase distribution of the different layered BA1−xMxO thin films were characterized using HAADF-STEM, EDS and electron diffraction. The cross-sectional STEM image taken under HAADF conditions clearly shows the layered film growth up to a critical thickness (∼40 nm for x = 0.8 and ∼10 nm for x = 0.67) as shown in Fig. 2a. Interestingly, vertical pillars within the BA1−xMxO matrix begin to form above the critical thickness. A line scan across the pillars (shown in Fig. S2, ESI†) shows the pillars to be Al-rich, formed within the BA1−xMxO matrix. Since the STEM image contrast is proportional to Zn (n ∼ 1.7), the corresponding high-resolution STEM (HR-STEM) image in Fig. 2b shows the LSC structure with bright contrast representing Bi-based slabs (ZBi = 83) and dark contrast representing Al and Mn (ZAl = 13 and ZMn = 25). Above the critical thickness, the film segregates into Al-rich and Mn-rich regions. Interestingly, the phase segregation causes the Bi-based layers to separate into 3-Bi and 2-Bi regions, however, still maintaining the supercell structure. Therefore, the film forms a unique structure with a mix of 3-Bi and 2-Bi structures, and some Al or Mn is lost to give rise to this structure, yielding a Bi/(Al + Mn) ratio of ∼1.2, as reported previously in other systems.25 On further increasing the Al content (x = 0.67), the critical thickness decreases, and the Al-rich regions segregate as vertically aligned pillars as shown in Fig. 2d. The corresponding EDS elemental maps of Bi, Al and Mn are presented in Fig. 2e–h. EDS mapping confirms that Mn is uniformly distributed throughout the film while Al shows phase segregation as a vertically aligned pillar structure in the BiMnO3 (BMO)-based matrix. The selected area electron diffraction (SAED) pattern, taken along the substrate [100] zone axis, confirms the highly epitaxial growth of the layered structures. The out-of-plane d spacing calculated from the HR-STEM image (shown in Fig. 2c) is estimated to be about 13.3 Å, which is well consistent with the XRD measurements.
Fig. 2. Microstructural characterization. (a) Cross-sectional STEM HAADF image of the BA1−xMxO (x = 0.8) thin film obtained along the STO[001] zone axis. (b) HR-STEM image of the marked region in (a). The inset shows the selected area electron diffraction (SAED) pattern. (c) HR-STEM image of the marked region in (a) showing the Al-rich region along with two-atomic layer thick and three-atomic layer thick Bi-based slabs. (d)–(h) Cross-sectional STEM image of a BA1−xMxO (x = 0.67) thin film with the corresponding EDS maps.
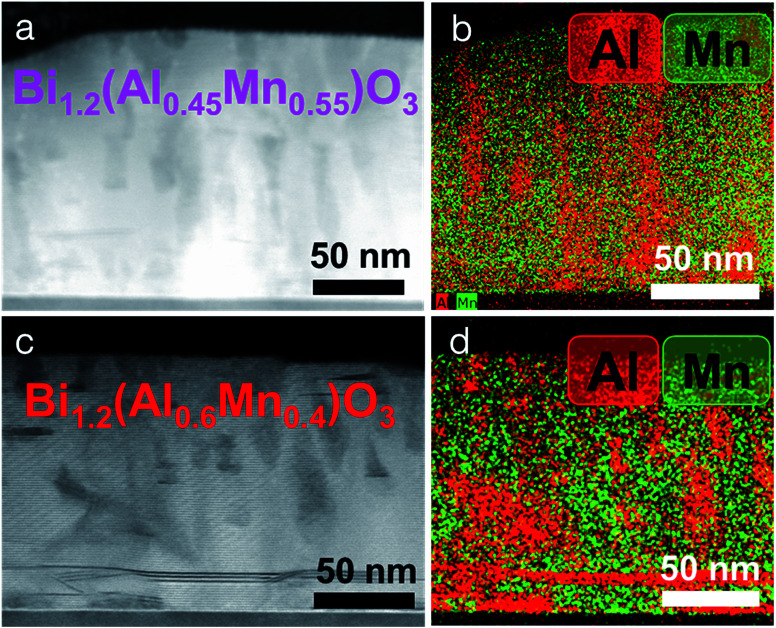
Further increasing the Al content (x = 0.55 and x = 0.40) creates an even more disordered structure as shown in Fig. 3. However, the samples maintain the same crystalline structure as shown earlier in Fig. 1a. Although Al-rich phase segregation starts at the film/substrate interface, the BMO matrix shows a layered structure. The composition of all the films was analyzed by EDS in SEM (shown in Table S1, ESI†). The analysis showed that the molar ratio of Al : Mn in the film was always less than the ratio in the corresponding target, making the film Al deficient. This might be due to the 200 mTorr oxygen pressure, used during the deposition, which preferentially scatters the lighter elements like Al, making the film Al deficient.35 Another possibility is the segregation of the film into Al-rich and Al-deficient regions, which may change the film stoichiometry as compared to the target. Such composition dependent morphology tuning of the LSC structure allows the investigation of the different strain relaxation mechanisms that are active during growth. When increasing the Al molar ratio, the thin film structure changes from a perfect LSC to LSC + Al-vertical pillars to LSC + Al-disordered pillars. For x = 0.8, a pseudo-cubic interlayer of 2–3 nm is formed at the film/substrate interface. This interlayer region is very thin with the LSC structure formed on top of it. Finally, the film segregates into Al-rich and Al-deficient regions that further help in strain relaxation. Interestingly, for the higher Al molar ratio film, the Al-rich regions change from ordered vertical pillars to disordered pillars. Moreover, the pseudo-cubic interlayer region is not observed for higher Al molar ratio films. Therefore, the following three strain relaxation mechanisms have been observed: (i) pseudo-cubic interlayer formation, (ii) layered supercell structure formation and (iii) phase segregation into Al-rich and Al-deficient regions.
Fig. 3. Cross-sectional STEM image of the BA1−xMxO thin film. (a) x = 0.55 and (c) x = 0.4 and their corresponding elemental EDS maps, (b) and (d).
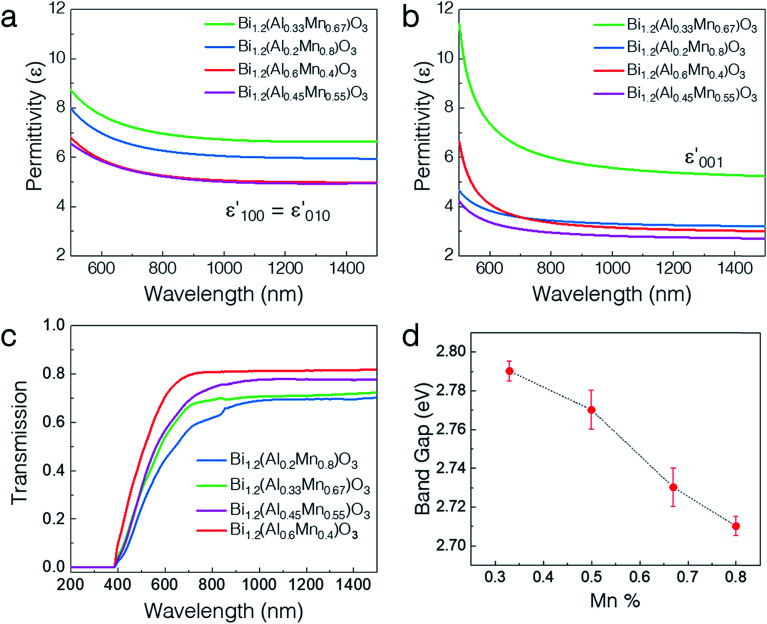
The optical properties vary drastically with the different microstructures of the thin films including the phase separation. Owing to the extreme anisotropy in the microstructure, all the thin films were fitted with an anisotropic uniaxial model using an angular dependent spectroscopic ellipsometer. The in-plane (ε‖) and out-of-plane (ε⊥) permittivity components were modeled using the Kramers–Kronig consistent general oscillator model (see the Experimental methods section). The permittivities for the four different film compositions are shown in Fig. 4a and b. Overall, both the in-plane and out-of-plane permittivities show normal dispersion characteristic of a dielectric for all the samples. The real-part ε‖ and ε⊥ values vary from ∼5–7 and ∼3–6 at 1000 nm, respectively, over the composition range by varying the Al : Mn ratio. The permittivity shows relatively larger tuning in the out-of-plane direction (∼2-fold) than in the in-plane direction (∼1.5-fold) possibly owing to the formation of vertical pillars of Al-rich regions. Notably, the x = 0.67 composition shows the maximum ε′001 among all the samples. Such high polarizability might be due to the formation of well-ordered vertically aligned pillars, while the disordered structures (x = 0.55 and x = 0.4) show lower ε′001. Therefore, the permittivity can be tuned over a wide range by varying the composition. Fig. 4c shows the UV-vis-near infrared (NIR) transmission spectra at normal incidence for all the different compositions. Clearly, the absorption edge presents a blueshift from ∼750 nm to ∼720 nm as the Mn percentage is increased. Detailed band gap calculations using the Tauc plot confirm the continuous decrease of the band gap from 2.79 eV to 2.71 eV on increasing the Mn content. The increase in the Mn percentage changes the band structure of the material and the band gap value comes closer to the value for BMO as reported earlier.25 Moreover, the Al-rich regions have a larger bulk band gap as compared to the Al-deficient regions.36 Therefore, all the samples present highly tunable optical properties as demonstrated by their permittivity and band gap.
Fig. 4. Tunable optical properties. (a) Real part of the in-plane permittivity and (b) out-of-plane permittivity for the four different film compositions. (c) Transmittance spectra and the (d) corresponding band gaps calculated using the Tauc plot for the four different film compositions.
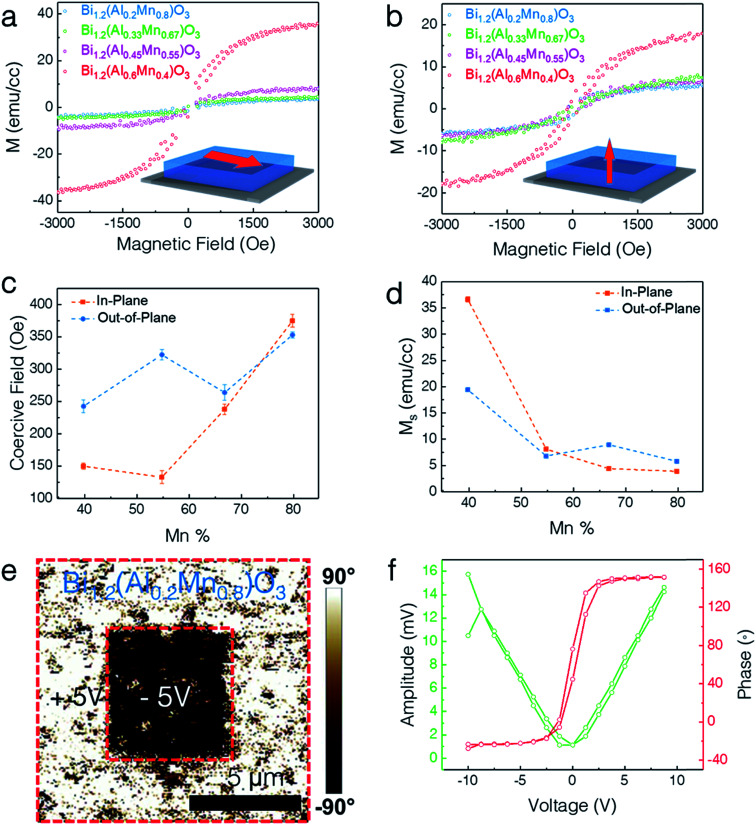
The lone-pair electrons of Bi cations give rise to ferroelectricity while the coupled Mn–Al cations exhibit ferromagnetism. The multiferroic response of the LSC structures was measured using a vibrating sample magnetometer (VSM) in a Physical Property Measurement System (PPMS) for magnetic properties and Piezoresponse Force Microscopy (PFM) for ferromagnetic and ferroelectric responses. Fig. 5 presents the multiferroic properties of different LSC structures. Fig. 5a and b show the in-plane (IP) and out-of-plane (OP) magnetic hysteresis (M–H) loops for all the different compositions, respectively. All the films exhibit obvious ferromagnetic responses in both IP and OP directions. X-ray photoelectron spectroscopy (XPS) analysis of two extreme compositions (x = 0.8 and x = 0.4) reveals that Mn ions exist in both Mn3+ and Mn4+ oxidation states with binding energies of 641.9 eV and 643.5 eV, respectively (Fig. S3, ESI†). Therefore, a possible origin of the ferromagnetism in the LSC structure is the double–exchange interaction between the Mn3+ and Mn4+ ions. The saturation magnetization (Ms) is determined to be ∼37 emu cm−3, ∼8 emu cm−3, ∼5 emu cm−3, and ∼4 emu cm−3 for x = 0.4, 0.55, 0.67, and 0.8, respectively, at 10 K and 3 kOe along the IP direction, exhibiting a 10-fold increase. In addition, the Ms along the OP direction is measured to be ∼20 emu cm−3, ∼7 emu cm−3, ∼9 emu cm−3, and ∼6 emu cm−3 for x = 0.4, 0.55, 0.67, and 0.8 respectively, showing a 3-fold increase. The corresponding coercive field (Oe) and Ms are plotted in Fig. 5c and d, respectively. Interestingly, the composition for x = 0.4 shows the highest Ms among all the compositions. This could possibly arise from the combined effect of superexchange coupling and the spin-canting effect. The Al3+–Mn3+ superexchange increases the magnetization while Mn3+–O2−–Mn3+ superexchange together with the canted Mn spins (due to the zig-zag shaped rows of Al and Mn cations) decreases the Ms. The optimum composition is found at x = 0.6 where Al3+–Mn3+ superexchange is at the maximum and the spin-canting of Mn is at the minimum. Clearly, all the samples show a highly anisotropic magnetic response with the in-plane axis as the easy magnetocrystalline axis.
Fig. 5. Multiferroic properties. (a) In-plane (IP) and (b) out-of-plane (OP) magnetization hysteresis (M–H) loops for the four different film compositions. (c) IP and OP coercive field along with (d) saturation magnetization as a function of the increasing Mn%. (e) PFM vertical phase map of BA1−xMxO (x = 0.8) obtained after poling with +5 V (bright contrast) and −5 V (dark contrast) over an area of 5 × 5 μm2. (f) Phase and amplitude switching behavior as a function of tip bias.
The ferroelectric properties of the BA1−xMxO LSC thin films were explored using piezoresponse force microscopy (PFM) as shown in Fig. 5e and f. The breaking of the center of symmetry is the origin of the ferroelectricity in this structure. In Bi-based materials, the Bi3+ ion forms a strong covalent bond with the oxygen anion, causing the 6s2 lone pair in Bi to shift from its centrosymmetric position due to electrostatic repulsion, thus breaking the spatial inversion symmetry.15 The composition of x = 0.8 was chosen for demonstrating the ferroelectric switching. Specifically, a 5 × 5 μm2 square box domain pattern was first written with a +5 V tip bias using a conductive tip followed by a 2 × 2 μm2 central area scan with a −5 V tip bias. The distinct contrast obtained in the phase image (shown in Fig. 5e) shows the out-of-plane domain switching. The PFM phase and amplitude shown in Fig. 5f confirm the switchable and ferroelectric nature of the LSC structure. The ferroelectric properties did not vary much with the compositional variation and all the samples present very similar ferroelectric properties (ESI Fig. S4†), with the x = 0.4 sample presenting the highest coercive field.
The composition dependence study of BA1−xMxO provides opportunities for fabricating tailorable multiferroic materials. It also helps understand the critical parameters responsible for the formation of the supercell structure in Bi-based structures. From the observed morphology evolution upon increasing the Mn percentage, Mn stabilizes the layered supercell structure. The optical bandgap, anisotropic dielectric permittivity and magnetic properties show obvious tuning on varying the Al : Mn molar ratio. These tuning effects are attributed to the anisotropic microstructure and different magnetization mechanisms such as spin canting and superexchange. The tunable optical dielectric properties can find applications in electro-optic waveguide modulators and on-chip device sensing. Additionally, other elements besides Al, such as Fe, Co and Ni, can be introduced to explore the formation of new layered structures for integrated electronic and magnetic applications.
Conclusions
In summary, morphology tuning of Bi-based layered structures by varying the Al : Mn molar ratio has presented as an effective approach to achieving tunable microstructures and properties. It also offers opportunities in exploring the different growth and strain relaxation mechanisms that are active during thin film growth. The microstructure evolves from a supercell structure to the formation of Al-rich nanopillars on increasing the Al molar ratio. Such microstructure evolution effectively tunes the physical properties including magnetization, optical band gap and anisotropic dielectric permittivity. This study provides opportunities for the design and tuning of the LSC microstructure and achieving physical property tunability. These approaches can be applied to other Bi-based layered structure materials.
Experimental section
Composite film growth
The composite BiAl1−xMnxO3 targets with different Al : Mn molar ratios were prepared by mixing Bi2O3, Al2O3 and Mn2O3 in specific ratios followed by sintering at 750 °C for 3 hours. The different LSC BA1−xMxO thin films were deposited on single-crystal STO (001) substrates using pulsed laser deposition (PLD) (with a KrF excimer laser, Lambda Physik COMPex Pro 205, λ = 248 nm). The substrate temperature was maintained at 600 °C and an oxygen pressure of 200 mTorr was maintained during the deposition. A laser frequency of 2 Hz was used, and all the films were cooled at 10 °C min−1 under 200 torr O2 following deposition.
Structural and optical characterization
The crystallinity and microstructure of the films were investigated by XRD (PANalytical Empyrean XRD), TEM and high-resolution STEM (FEI TALOS 200X operated at 200 kV). TEM samples were prepared using the standard manual grinding and thinning process followed by dimpling and ion milling using a precision ion polishing system (PIPS II, Gatan). Transmission measurements were obtained using a UV-vis-NIR absorption spectrophotometer (PerkinElmer Lambda 1050). The chemical composition of the LSC films was investigated using FEI Nova NanoSEM and XPS (Kratos Axis Ultra DLD) with monochromatic Al Kα radiation (1486.6 eV).
Permittivity measurements
The effective refractive index and optical dielectric permittivity of the films were evaluated using spectroscopic ellipsometry (JA Woollam RC2). The ellipsometer parameters ψ and Δ, related by the equation rp/rs = tan(ψ) e(iΔ) (where rp and rs are the reflection coefficients for the p-polarized and s-polarized light, respectively), were fitted using appropriate models using CompleteEASE software. The incident angle was varied from 35° to 75° with a step size of 10°. The ψ and Δ are measured at different angles to improve the accuracy of the fitted model. All the samples were assumed to be anisotropic since the films show a multilayer structure. The in-plane permittivity of the uniaxial model was modeled using two Tauc–Lorentz oscillators and the permittivity along the z direction was modeled using a single Tauc–Lorentz oscillator. The mean squared error (MSE) of all the fits was around 5.
Magnetic and electrical measurements
The magnetic properties were examined using a vibrating sample magnetometer (VSM) in a Physical Property Measurement System (PPMS 6000, Quantum Design). The piezoelectric properties were measured using a conductive Pt–Ir coated Si tip (model: SCM-PIT V2) with a Bruker Dimension Icon AFM.
Conflicts of interest
The authors declare no conflict of interest.
Supplementary Material
Acknowledgments
This work was partially supported by the College of Engineering Start-up Fund and Basil R. Turner Professorship at Purdue University. S. M. and H. W. acknowledge the support from the U.S. Office of Naval Research (N00014-16-1-2465). The high resolution TEM/STEM imaging work was funded by the U.S. National Science Foundation (DMR-1565822).
Electronic supplementary information (ESI) available: STEM HAADF EDS line scan, SEM EDS thin film composition, and XPS data. See DOI: 10.1039/c9na00566h
References
- Tagantsev A. K. Sherman V. O. Astafiev K. F. Venkatesh J. Setter N. J. Electroceram. 2003;11:5–66. doi: 10.1023/B:JECR.0000015661.81386.e6. [DOI] [Google Scholar]
- Liu B. M. Obi O. Lou J. Chen Y. Cai Z. Stoute S. Espanol M. Lew M. Situ X. Ziemer K. S. Harris V. G. Sun N. X. Adv. Funct. Mater. 2009;19:1826–1831. doi: 10.1002/adfm.200801907. [DOI] [Google Scholar]
- Lee C. Orloff N. D. Birol T. Zhu Y. Goian V. Rocas E. Haislmaier R. Vlahos E. Mundy J. A. Kourkoutis L. F. Nie Y. Biegalski M. D. Zhang J. Bernhagen M. Benedek N. A. Kim Y. Brock J. D. Uecker R. Xi X. X. Gopalan V. Nuzhnyy D. Kamba S. Muller D. A. Takeuchi I. Booth J. C. Fennie C. J. Schlom D. G. Nature. 2013;502:532–536. doi: 10.1038/nature12582. [DOI] [PubMed] [Google Scholar]
- Gao R. Jiang Y. Abdelaziz S. Opt. Lett. 2013;38:1539–1541. doi: 10.1364/OL.38.001539. [DOI] [PubMed] [Google Scholar]
- Eerenstein W. Mathur N. D. Scott J. F. Nature. 2006;442:759–765. doi: 10.1038/nature05023. [DOI] [PubMed] [Google Scholar]
- Cheong S.-W. Mostovoy M. Nat. Mater. 2007;6:13–20. doi: 10.1038/nmat1804. [DOI] [PubMed] [Google Scholar]
- Gajek M. Bibes M. Fusil S. Bouzehouane K. Fontcuberta J. Barthelemy A. Fert A. Nat. Mater. 2007;6:296–302. doi: 10.1038/nmat1860. [DOI] [PubMed] [Google Scholar]
- Gao T. Zhang X. Ratcli W. Maruyama S. Murakami M. Varatharajan A. Yamani Z. Chen P. Wang K. Zhang H. Shull R. Bendersky L. A. Unguris J. Ramesh R. Takeuchi I. Nano Lett. 2017;17:2825–2832. doi: 10.1021/acs.nanolett.6b05152. [DOI] [PubMed] [Google Scholar]
- Ramesh R. Spaldin N. Nat. Mater. 2007;6:21–29. doi: 10.1038/nmat1805. [DOI] [PubMed] [Google Scholar]
- Kimura T. Goto T. Shintani H. Ishizaka K. Arima T. Tokura Y. Nature. 2003;426:55–58. doi: 10.1038/nature02018. [DOI] [PubMed] [Google Scholar]
- Rao C. N. R. Rayan C. J. Mater. Chem. 2007;17:4931–4938. doi: 10.1039/B709126E. [DOI] [Google Scholar]
- Zheng H. Wang J. Lofland S. E. Ma Z. Zhao T. Shinde S. R. Ogale S. B. Bai F. Viehland D. Jia Y. Schlom D. G. Wuttig M. Roytburd A. Ramesh R. Science. 2004;303:661–663. doi: 10.1126/science.1094207. [DOI] [PubMed] [Google Scholar]
- Su Q. Zhang W. Lu P. Fang S. Khatkhatay F. Jian J. Li L. Chen F. Zhang X. MacManus-Driscoll J. L. Chen A. Jia Q. Wang H. ACS Appl. Mater. Interfaces. 2016;8:20283–20291. doi: 10.1021/acsami.6b05999. [DOI] [PubMed] [Google Scholar]
- Li Y. Wang Z. Yao J. Yang T. Wang Z. Hu J. Chen C. Sun R. Tian Z. Li J. Chen L. Viehland D. Nat. Commun. 2015;6:1–7. doi: 10.1038/ncomms7680. [DOI] [PubMed] [Google Scholar]
- Li L. Boullay P. Lu P. Wang X. Jian J. Huang J. Gao X. Misra S. Zhang W. Perez O. Steciuk G. Chen A. Zhang X. Wang H. Nano Lett. 2017;17:6575–6582. doi: 10.1021/acs.nanolett.7b02284. [DOI] [PubMed] [Google Scholar]
- Gao X. Li L. Jian J. Wang H. Fan M. Huang J. Wang X. Wang H. ACS Appl. Nano Mater. 2018;1:2509–2514. doi: 10.1021/acsanm.8b00614. [DOI] [Google Scholar]
- Zhang W. Chen A. Jian J. Zhu Y. Chen L. Lu P. Jia Q. Macmanus-driscoll J. L. Zhang X. Wang H. Nanoscale. 2015:13808–13815. doi: 10.1039/C5NR03231H. [DOI] [PubMed] [Google Scholar]
- Zheng H. Straub F. Zhan Q. Yang P. Hsieh W. Zavaliche F. Chu Y. Dahmen U. Ramesh R. Adv. Mater. 2006;18:2747–2752. doi: 10.1002/adma.200601215. [DOI] [Google Scholar]
- Zhang W. Chen A. Bi Z. Jia Q. Macmanus-driscoll J. L. Wang H. Curr. Opin. Solid State Mater. Sci. 2014;18:6–18. doi: 10.1016/j.cossms.2013.07.007. [DOI] [Google Scholar]
- Misra S. Li L. Zhang D. Jian J. Qi Z. Fan M. Chen H. Zhang X. Wang H. Adv. Mater. 2019;31:1806529. doi: 10.1002/adma.201806529. [DOI] [PubMed] [Google Scholar]
- Misra S. Li L. Jian J. Huang J. Wang X. Zemlyanov D. Jang J.-W. Ribeiro F. H. Wang H. ACS Appl. Mater. Interfaces. 2018;10:32895–32902. doi: 10.1021/acsami.8b12210. [DOI] [PubMed] [Google Scholar]
- Huang J. Jin T. Misra S. Wang H. Qi Z. Dai Y. Sun X. Li L. Okkema J. Chen H. Lin P. Zhang X. Wang H. Adv. Opt. Mater. 2018:1–9. [Google Scholar]
- Sun X. Huang J. Jian J. Fan M. Wang H. Li Q. Macmanus-Driscoll J. L. Lu P. Zhang X. Wang H. Mater. Horiz. 2018;5:536–544. doi: 10.1039/C8MH00216A. [DOI] [Google Scholar]
- Chen Z. Gao R. Xu R. Lee Y. Zhang X. Yao J. Martin L. W. ACS Nano. 2016;10:10237–10244. doi: 10.1021/acsnano.6b05736. [DOI] [PubMed] [Google Scholar]
- Li L. Boullay P. Cheng J. Lu P. Wang X. Steciuk G. Huang J. Jian J. Gao X. Zhang B. Misra S. Zhang X. Yang K. Wang H. Mater. Today Nano. 2019;6:100037. doi: 10.1016/j.mtnano.2019.100037. [DOI] [Google Scholar]
- Chen A. Zhou H. Bi Z. Zhu Y. Luo Z. Bayraktaroglu A. Phillips J. Choi E. Macmanus-driscoll J. L. Pennycook S. J. Narayan J. Jia Q. Zhang X. Wang H. Adv. Mater. 2013;25:1028–1032. doi: 10.1002/adma.201203051. [DOI] [PubMed] [Google Scholar]
- Zhang W. Li M. Chen A. Li L. Zhu Y. Xia Z. Lu P. Boullay P. Wu L. Zhu Y. Macmanus-driscoll J. L. Jia Q. Zhou H. Narayan J. Zhang X. Wang H. ACS Appl. Mater. Interfaces. 2016;8:16845–16851. doi: 10.1021/acsami.6b03773. [DOI] [PubMed] [Google Scholar]
- Azuma M. Takata K. Saito T. Ishiwata S. Shimakawa Y. Takano M. J. Am. Chem. Soc. 2005;127:8889–8892. doi: 10.1021/ja0512576. [DOI] [PubMed] [Google Scholar]
- Zhu Y. Chen A. Zhou H. Zhang W. Narayan J. Macmanus-driscoll J. L. Jia Q. Wang H. APL Mater. 2013;1:050702. doi: 10.1063/1.4828936. [DOI] [Google Scholar]
- Wu M. K. Ashburn J. R. Torng C. J. Phys. Rev. Lett. 1987;58:908–910. doi: 10.1103/PhysRevLett.58.908. [DOI] [PubMed] [Google Scholar]
- Du H. Shi X. J. Phys. Chem. Solids. 2011;72:1279–1283. doi: 10.1016/j.jpcs.2011.07.023. [DOI] [Google Scholar]
- Ida S. Ishihara T. J. Phys. Chem. Lett. 2014;5:2533–2542. doi: 10.1021/jz5010957. [DOI] [PubMed] [Google Scholar]
- Choi W. S. Ohta H. Lee H. N. Adv. Mater. 2014;26:6701–6705. doi: 10.1002/adma.201401676. [DOI] [PubMed] [Google Scholar]
- Chen A. Zhou H. Zhu Y. Li L. Zhang W. Narayan J. Wang H. Jia Q. J. Mater. Res. 2016;31:3530–3537. doi: 10.1557/jmr.2016.391. [DOI] [Google Scholar]
- Ojeda-g-p A. Döbeli M. Lippert T. Adv. Mater. Interfaces. 2018;5:1–16. [Google Scholar]
- French R. H. J. Am. Ceram. Soc. 1990;73:477–489. doi: 10.1111/j.1151-2916.1990.tb06541.x. [DOI] [Google Scholar]
Associated Data
This section collects any data citations, data availability statements, or supplementary materials included in this article.


