Abstract
We present a study on the formation of silver (Ag) and bimetallic silver–gold (AgAu) nanoparticles monitored by in situ SAXS as well as by ex situ TEM, XRD and UV-vis analysis in a flow reactor at controlled reaction temperature. The formation mechanism of the nanoparticles is derived from the structural parameters obtained from the experimental data. The evolution of the average particle size of pure and alloyed nanoparticles shows that the particle growth occurs initially by a coalescence mechanism. The later growth of pure silver nanoparticles is well described by Ostwald ripening and for the alloyed nanoparticles by a process with a significantly slower growth rate. Additionally, the SAXS data of pure silver nanoparticles revealed two major populations of nanoparticles, the first one with a continuous crystal growth to a saturation plateau, and the second one probably with a continuous emergence of small new crystals. The particle sizes obtained by SAXS agree well with the results from transmission electron microscopy and X-ray diffraction. The present study demonstrates the capability of an in situ investigation of synthesis processes using a laboratory based SAXS instrument. Online monitoring of the synthesis permitted a detailed investigation of the structural evolution of the system.
In situ investigation of metallic nanoparticle synthesis with an online monitoring of the system by SAXS. Determination of structural parameters and growth processes. Ag-NP synthesis presented a bimodal system with the presence of small particles (∼3 nm).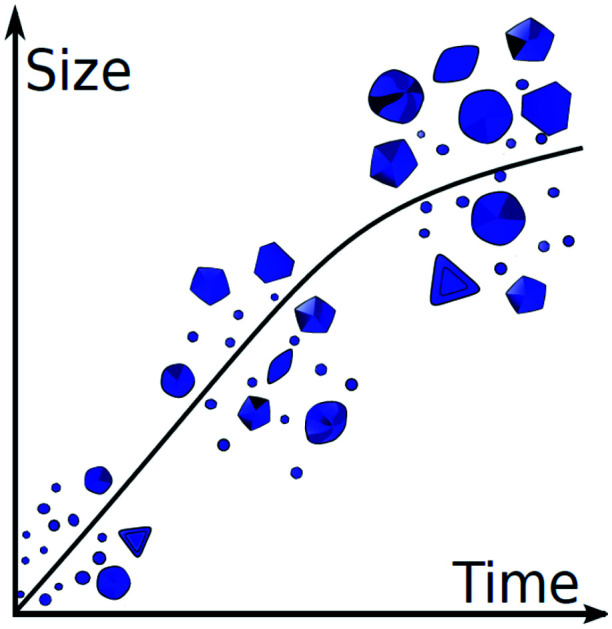
1. Introduction
There is increasing interest in nanoparticles because of their remarkable properties and synergetic effects depending on their size, shape and chemical composition. One can find several studies in the literature on promising applications and advances in this field.1–3 Silver nanoparticles can be used to control the antibacterial and cytotoxic properties of colloids, and gold nanoparticles have unique optical properties, chemical stability and catalytic reactivity.4,5 Alloyed silver–gold nanoparticles can potentially combine these properties in a controllable way.6
An understanding of the mechanism of nanoparticle formation is fundamental for proper control of the final morphology of the nanoparticle system. In addition, since the initial particle nucleation represents the very first stage of any crystallization process, it is very important to correctly characterize the nucleation process.7 Therefore, it is necessary to use experimental methods that allow in-depth structural characterization of the system.
By scanning and transmission electron microscopy (SEM/TEM) and X-ray powder diffraction (XRD), Banerjee et al.8 investigated the formation of silver nanoparticles during the reduction with glucose, together with a colloidal stabilization with poly(N-vinylpyrrolidone) (PVP). They monitored the evolution of the particles and their internal crystallites for 3500 minutes of synthesis, resulting in particle sizes up to 75 nm. In addition, electron microscopy provided information on the shape, size and inner structure of the produced nanoparticles. The synthesis of bimetallic nanoparticles offers new options to tune the properties of metallic nanoparticles, e.g. for plasmonic or biomedical applications.9–18
Small angle X-ray scattering (SAXS) is a very useful technique for the investigation of the formation and growth mechanisms of nanoparticles, in situ, under realistic synthesis conditions.19,20 The unique feature of SAXS is the possibility of online monitoring of the system during the measurements21 and it is demonstrated in a number of publications in the literature. Harada and Katagiri22 have reported an in situ SAXS study on the formation of silver nanoparticles by photoreduction. The average particle size was followed during the synthesis process, and a model for the growth mechanism was formulated based on Ostwald ripening and Lifshitz–Slyozov–Wagner (LSW) theory. This approach was extended to palladium systems where a similar behavior in aggregative particle growth and Ostwald ripening was also found by Harada and Ikegami.23 In both Ag and Pd nanoparticles synthesized by reduction in water-in-oil microemulsions, different stages in the metal nanoparticle formation were found, starting with a diameter of 8–10 nm and followed by an initial fast crystal growth rate with a lower rate at later stages, where the particles almost double in size in the saturation region.
Polte et al.24 studied the formation mechanism of silver nanoparticles using silver perchlorate as a precursor and sodium borohydride as a reducing agent. They also analyzed the influence of the steric stabilizing agent poly(N-vinylpyrrolidone), PVP. Using SAXS and ultra-violet visible spectroscopy (UV-vis), the authors concluded that coalescence is the main growth process during the synthesis of metallic nanoparticles in which the monomer-supplying chemical reaction is faster than the particle growth. The authors also made a comparison between the growth process of silver and gold nanoparticles,21 where a step-like formation mechanism was deduced, with coalescence being the main growth process. Similar results for the particle aggregation into regular assemblies were also reported by Chen et al.5 and Koerner et al.25 who investigated the formation of gold nanoparticles by in situ SAXS/WAXS and UV-vis spectroscopy in the size range of about 2–6 nm.
Singh et al. studied the formation and growth of bimetallic Ag–Cu nanoparticles by co-reduction of silver nitrate and copper nitrate in water.26 Using SAXS, localized surface plasmon resonance (LSPR) and TEM, the authors showed a bimodal size distribution describing the formed spherical particles as a mixture of smaller (15–18 nm) and larger particles (56–59 nm), pointing to a cluster aggregation and their restructuring. Wu et al. investigated the formation of bimetallic PtSn nanoparticles by seed-mediated synthesis at elevated temperature.27 By in situ synchrotron X-ray scattering (SAXS) supported by WAXS and HRTEM, the authors showed the transformation of the initially formed Pt nanoparticles (fcc), reduced from Pt(ii), to hexagonal PtSn nanocrystals by a fast diffusion of Sn into the Pt lattice. A volume increase of the nanocrystals to a saturation plateau as a function of the reaction time was also found.
Based on the available information from the literature, it can be concluded that the knowledge about the crystal formation and growth of metallic and bimetallic nanoparticles is of high interest, but the growth process is still not well understood. Some authors have observed a step-like development in the crystal growth of the formed particles via variable growth rates starting from small crystal seeds,24,28 but have neither focused on nor provided evidence for the co-existence of the smaller seeds during the whole synthesis. Furthermore, such a reduction synthesis is typically carried out at elevated temperature and therefore temperature fluctuations must be minimized in the system.
In our work, the synthesis routes are based on the so-called ‘wet chemical process’ which is a bottom-up strategy.4 A detailed study of the synthesis of pure silver and alloyed silver–gold nanoparticles, followed by in situ SAXS and ex situ TEM, XRD and UV-vis, is presented. Special care was given to the temperature control in the reaction vessel using thermally isolated tubes in order to have fully isothermal conditions in the sample holder of the SAXS device. The investigation of the early crystal growth stages of mono- and bimetallic nanoparticles in a wide size range during a well-controlled and reproducible synthesis is the main focus of this article. Besides the detailed structural characterization of the investigated systems, the current work demonstrates the possibility of a careful online monitoring of synthesis processes using a laboratory-based SAXS system.
2. Experimental conditions
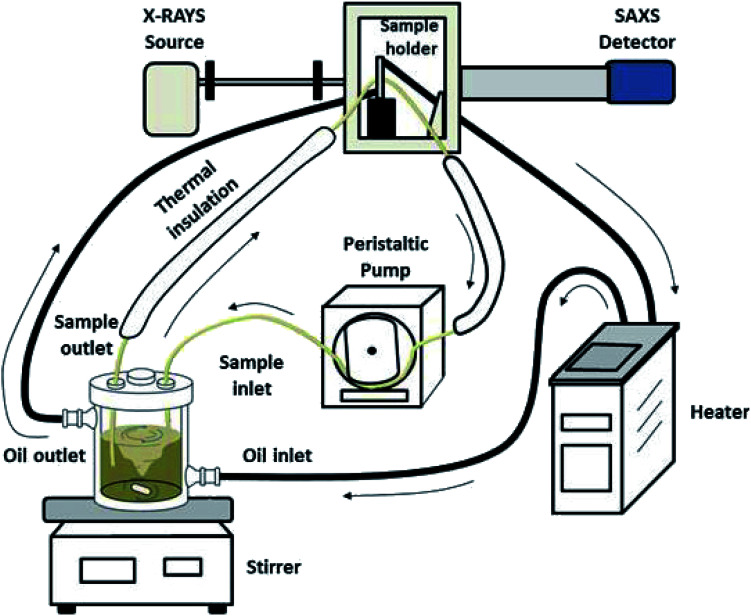
The experimental setup used for the in situ SAXS experiments is shown in Fig. 1. The synthesis was performed in a double-walled glass reactor (volume about 500 mL) which was held at the desired temperature by means of a circulating silicon oil bath. The sample holder was also thermally controlled with the same circulating line and consisted of a quartz capillary glued into a stainless-steel case which allowed a direct connection between the inlet and outlet tubes. The reaction solution in the glass reactor was vigorously stirred with a magnetic bar and continuously pumped through the sample holder with a peristaltic pump in a closed loop. All connecting tubes were thermally well isolated to minimize temperature gradients. The total volume in the tubes was about 20 mL. The glass reactor was closed with a PTFE cover with a good fixation of the inlet and outlet tubes to avoid the evaporation of water.
Fig. 1. Schematic representation of the experimental setup for the in situ SAXS experiments.
The silver nanoparticle samples were synthesized following a procedure described by Banerjee et al.8 The SAXS measurements were performed during the synthesis: first, 16 g of glucose and 8 g of poly(N-vinylpyrrolidone), PVP, were dissolved in 320 mL water at 90 °C. Then, 4 g AgNO3, dissolved in 8 mL water, was quickly added. The temperature in the solution and in the sample holder was controlled at 90 °C. After the mixing, the SAXS measurements were immediately started by taking frames at intervals of 1 min for up to 70 minutes up to a particle size of ∼40 nm. Four aliquots for ex situ investigations (i.e. TEM, UV/vis and XRD) were taken by quickly opening and closing a small lid in the cover of the glass reactor. For each aliquot, 15 mL of sample was taken using a glass pipet and immediately quenched by immersion in an ice bath. The aliquots were then centrifuged at 29 400g for 30 minutes and redispersed in pure water. This centrifugation procedure was repeated three times.
At the end of the stated observation period, no further significant changes in the SAXS curves were detected. It is notable that silver nanoparticles still continue to grow, as shown in previous works,8 but the larger sizes were not accessible by our SAXS device.
The synthesis of the AgAu particles was adapted from Ristig et al.6 300 mL ultra-pure water was heated to 100 °C. Then, silver nitrate (1.5 mL; 10 mM; 15 μmol) and gold(iii) chloride trihydrate (1.5 mL; 10 mM; 15 μmol) were added under vigorous stirring, followed by a quick addition of a trisodium citrate dihydrate solution (3 mL; 58 mM; 174 μmol). This enabled the synthesis of bimetallic nanoparticles with the nominal molar composition Ag : Au = 50 : 50. At first, the SAXS experiments were carried out at 100 °C, but the early stages of the crystal growth turned out to occur too fast to be followed in detail (data not shown). Therefore, the temperature was lowered to 70 °C in order to slow down the crystal growth and to precisely study the development of the alloyed particles. The in situ SAXS measurements were carried out for up to 157 minutes at 1 min intervals, resulting in final particle diameters of ∼20 nm.
All chemicals were purchased from Sigma-Aldrich. Ultra-pure water was obtained from a Milli-Q system from Millipore®.
Small angle X-ray scattering data collection was performed on the laboratory-based SAXS equipment Xenocs XEUSS™ at the Institute of Physics, University of São Paulo. The scattering intensity is expressed as a function of the reciprocal space momentum transfer modulus q = 4π sin(θ)/λ, where 2θ is the scattering angle and λ the radiation wavelength. The radiation was generated by a GENIX™ source (Cu Kα edge, λ = 1.54 Å) with the beam focused by FOX2D™ optics. The beam collimation was performed using two sets of scatterless slits (Xenocs 2.0). In the high flux mode, the flux was ∼1 × 10⁸ photons s−1 with a beam size of 1 × 1 mm2. The 2D SAXS data were collected with a Dectris Pilatus™ 300k detector. The sample-to-detector distance was approximately 0.90 m, resulting in a range of 0.015 < q < 0.4 Å−1. The scattering data were normalized to an absolute scale with water as the primary standard. A measurement of a quartz capillary filled with water heated to the temperature of the experiments was used as the background in the data correction procedure. The data treatment was performed using standard procedures.29
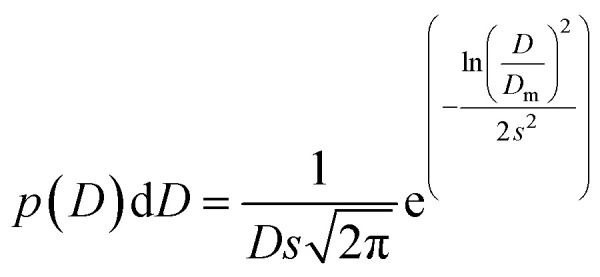
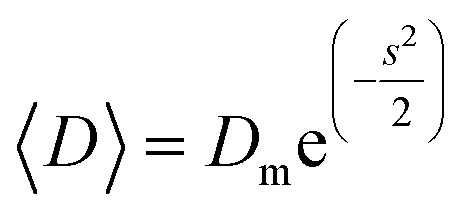
The transmission electron microscopy investigation was performed using a JEOL 2100 instrument equipped with a LaB6 filament, a high-resolution (HR) pole piece, and an energy dispersive X-ray spectroscopy (EDS) system (Thermo EDS detector). The microscope was operated at 200 kV to achieve high-resolution imaging (0.23 nm). The samples were dispersed in water, and a few droplets of the suspension were transferred onto a carbon-coated collodion film copper grid. In order to obtain the particle size distribution from TEM micrographs (considering ∼150 particles), the images were pre-treated with ImageJ30,31 for noise reduction with a smoothing filter and finally analyzed by Huang's thresholding method.32 Size-histograms were fitted to a log-normal distribution given by eqn (1)
 |
1 |
where Dm and s are optimized values obtained from the fit. The mean diameter D and the standard deviation of particle size σ were determined from eqn (2) and (3):
 |
2 |
 |
3 |
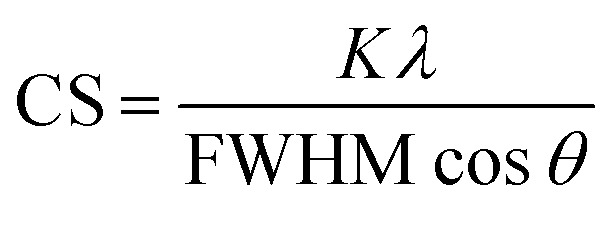
For the crystallographic characterization of the formed Ag and AgAu nanoparticles, an X-ray powder diffractometer (XRD, Bruker D8 Advance) with Cu Kα radiation (λ = 1.54 Å; 40 kV, 40 mA; Bragg–Brentano geometry) was used.33 The colloidal samples were placed and dried on a silicon single crystal to minimize scattering and investigated up to 90 °2θ with a step size of 0.03° and a counting time of 6 seconds at each step. The qualitative phase analysis was performed with software Diffrac Suite EVA V1.2 (Bruker). The patterns of silver (Ag, #04-0783) and silver chloride (AgCl, #31-1238) from the ICDD database were used as references. Software TOPAS 4.2 (Bruker) was used for quantitative analysis by Rietveld refinement to calculate the lattice parameters and the average crystallite size from diffraction peak broadening (using the Scherrer equation):34
 |
4 |
where CS is the crystallite size, K is a form factor set to 0.89 (for spheres), FWHM is the full width at half maximum of each peak (in radians), and θ is the diffraction angle. For each Rietveld refinement, the instrumental correction was determined with a LaB6 standard powder sample obtained from NIST (SRM 660b).
Ultraviolet-visible spectroscopy (UV-vis) was used to measure the plasmonic properties of the nanoparticles. The measurements were performed using a Mikropack DH-2000-BAL light source and two Ocean Optics diffractometers USB4000. Plastic cuvettes with a sample volume of about 1 mL were used.
3. Theoretical SAXS model
In spite of some similarities, the two nanoparticle samples studied constitute systems with important structural differences. Therefore, two different approaches were necessary to fit the SAXS data. In both cases, a system of polydisperse spheres was assumed, which is a good approximation for the shape of the formed nanoparticles as confirmed by TEM.
Monte Carlo (MC) model
In this approach, a Monte Carlo optimization method was used to obtain the particle size distribution of spheres that provided the best fit of the experimental data. Mathematical and computational details can be found in Martelli and Di Nunzio35 and Pauw et al.36 In general, the method provides a histogram-like size distribution and uncertainties for each histogram bar. The quality of the fit is evaluated using the chi-square test. From the obtained particle size distributions, further analyses can be performed, e.g. the identification of different particle populations and the calculation of volume fractions, average sizes and standard deviations.
The overall equation of the MC model is36
 |
5 |
where B is a constant describing the background, Sc is an overall scale factor, Ns is the number of spheres considered by the model, Psphi(q,Ri) is the form factor of a sphere with radius Ri, and pc is a stabilization parameter.
The form factor Psph(q,R) of a sphere with radius R is given by37
 |
6 |
The parameter pc has typical values in the range 2 < pc < 3.3 in order to ensure the stability of the fitting procedure.36 One of the main features of this approach is the fact that the obtained distribution is model-free, i.e. it can adopt any shape, similar to standard Indirect Fourier Transformation (IFT) approaches,38,39 but with the advantage of an easy inclusion of additional contributions to the theoretical intensity.
Model of aggregated polydisperse spheres (APSs)
In this approach it is assumed that we have a polydisperse system of spheres which can form large aggregates. The scattering intensity is described as40
 |
7 |
where SC is a global scale factor, R is the radius of the spheres, V(R) is the volume of the spheres, σ is the size polydispersity, SG(q,RG) is the structure factor of the aggregates having an overall radius of gyration (RG), and B is a constant for the background.
The form factor of the spheres Psph(q,R) is the same as in eqn (6), and the number distribution is given by a Schulz–Zimm function D(x,z) which is useful due to its ability to describe asymmetric distributions:40
 |
8 |
where xc is the central value of the distribution, Γ(x) is the gamma function, and z is defined as z = 1/(σ/R)2 − 1. σ is the polydispersity of the spheres in the system.
The presence of large aggregates is included in the model by a Guinier Structure Factor (SG):
 |
9 |
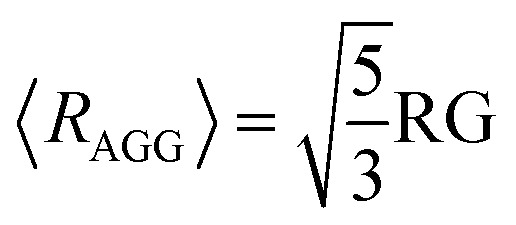
where the scale factor SGC is related to the fraction of aggregates.41,42 In this case, we consider that at low q values, the scattering intensity is given by the Guinier law.43 If the aggregates are assumed to be spherical, their average radius is related to the obtained RG as follows:
 |
10 |
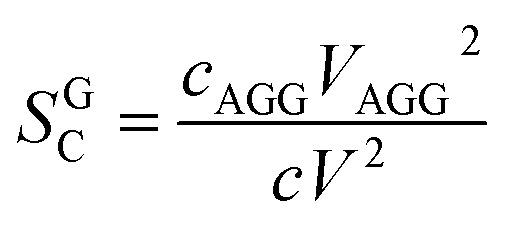
It can be shown that the scale factor SGC is given by the ratio of the number concentration c times the squared volume V of the particles of the two populations:42
 |
11 |
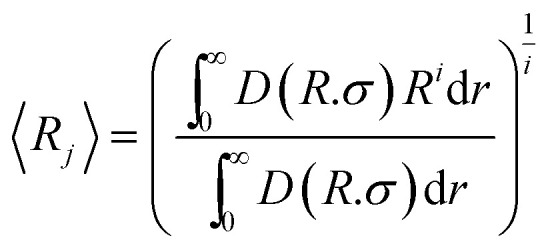
Finally, the average radius was calculated using the equation40
 |
12 |
If i = 1 the average is weighted by number (j = number) and if i = 3 the average is weighted by volume (j = volume). For the evolution of the particle sizes, a model proposed by Carpena et al.44 was used, where the function is described by the integral of the Boltzmann sigmoidal equation:
 |
13 |
where F0 is the value of F(x) at x = 0, A1 is the slope of the first stage, A2 is the slope of the second stage, Δx is the width of the transition between the two stages and x0 is the central value of the transition. This equation enables a precise description of the growth of Ag and AgAu nanoparticles as a function of time as well as the determination of rates and transition points.
4. Coalescence and Ostwald ripening
In order to gain further insights into the growth mechanism of the nanoparticles, one can investigate the evolution of the number-average size as a function of time. Several authors have proposed a hypothesis on the growth mechanism (coarsening processes) in terms of the diffusion-limited Ostwald ripening and dynamic coalescence. This approach is based on the temporal evolution rate of the average radius, which follows a power-law function of time: R ∝ tx.22 If exponent x has a value of 0.50 the growth is dominated by dynamic coalescence.45 On the other hand, if x is 0.33, then the growth is controlled by Ostwald ripening (diffusion-limited ripening), as stated by Lifshitz–Slyozov–Wagner (LSW) theory.22,46 There are other models based on the average radius growth rate and the so-called dynamic cluster coalescence (see Sholl & Skodje (1996)47 and Woehl et al. (2014)48). However, since other authors used LSW theory to describe silver and silver–gold nanoparticles,21,24 the same approach was used in the current work.
5. Silver nanoparticles
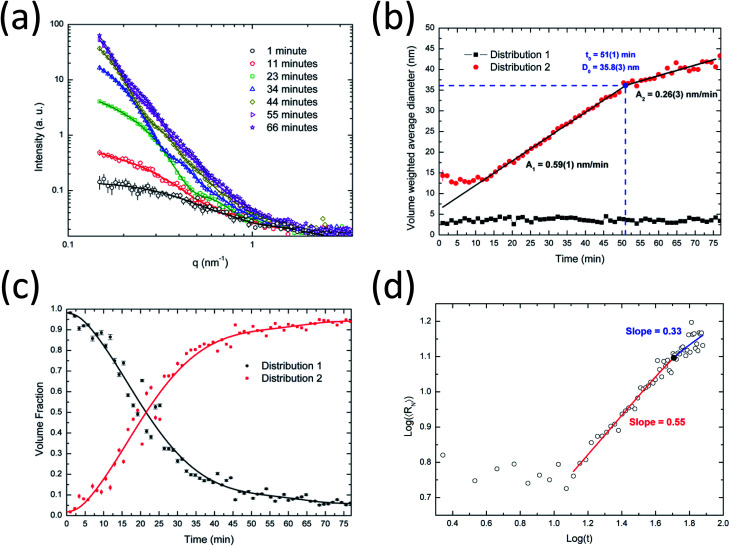
In Fig. 2a the experimental in situ SAXS data acquired during the synthesis of silver nanoparticles are shown together with the MC model fits. For a better visualization of the time evolution of the scattering intensity, only selected frames are presented. In Fig. S1a,† the full dataset and MC model fits are shown. The proposed model provides a very good fit for the full dataset. The forward scattering increases over time, indicating a continuous increase in particle sizes and concentration.
Fig. 2. SAXS results for Ag nanoparticle synthesis. (a) Experimental in situ SAXS data (symbols) and theoretical curves (lines) recorded during the synthesis of silver nanoparticles at 90 °C, (b) volume weighted average diameter of distributions 1 and 2, (c) temporal evolution of the volume fractions and (d) log–log plot of the number weighted average radius as a function of time.
The data analysis indicates that the system of silver nanoparticles can be described as consisting of two major populations. The size distributions determined after 7 and 72 min of synthesis are shown in Fig. S2a and b.† From a visual inspection of these distributions, two different particle populations can be clearly distinguished. One consists of smaller nanoparticles with a diameter of ∼3 nm (distribution 1) and another one consists of larger nanoparticles with a diameter from 10 to 40 nm (distribution 2). This behavior is clearly seen in the full series of the MC distributions shown in Fig. S1b.† Therefore, for the calculations of average sizes, volume fractions and polydispersity, the following criterion was used to distinguish these two different distributions: distribution 1: particle size smaller than or equal to 9 nm, distribution 2: particle size larger than 9 nm.
From the fitting of all SAXS curves the evolution of the average particle sizes for both large and small populations were obtained and are shown as a function of the synthesis time (Fig. 2b). Interestingly, the results indicate that the average size of the small particles remains almost constant (∼3–4 nm) during the whole synthesis. It is necessary to stress that there must be ultrasmall nanoparticles or seeds (<2 nm) in the system as well, but their contribution to the total scattering is masked by the constant background. This background results from the scattering intensity of the dissolved reactants in the solution, including ultrasmall nanoparticles and seeds.
At the same time, the evolution of larger particles from 10 to 40 nm is observed. The growth happens in different states, as clearly indicated for the volume-weighted average diameter curve in Fig. 2b. The results indicate two major kinetic rates: faster at the beginning (0.59 nm min−1) and slower at the end (0.26 nm min−1). This behavior can be described by the Carpena model in eqn (13) that provides the identification of the critical particle size (∼36 nm) at a synthesis time of about 51 min. After this time, the particle growth seems to reach a saturation level, probably caused by a different crystal growth mechanism or by a balance between the reduction of the silver ions in the solution and the oxidation processes on the surface of the nanoparticles.49 Banerjee et al.8 and Ahlberg et al.49 found a plateau-like behavior for the crystal growth and the dissolution of silver nanoparticles as a function of time, respectively.
The volume fraction occupied by the two nanoparticle populations is shown in Fig. 2c. At the beginning of the synthesis, the system is dominated by smaller nanoparticles (distribution 1) which continuously grow to larger particles (distribution 2) and contribute to the volume fraction change. It is interesting to see that at a synthesis time of about 27 min, the volume fractions for the two distributions are similar, corresponding to a diameter of ∼20 nm for the larger nanoparticles. Furthermore, a saturation plateau is also observed at around 40 min in the volume fraction plot.
Fig. 2d shows a log–log plot of the number weighted radius as a function of time. From 15–51 minutes, an exponent x of about 0.55 was obtained and after this point, an exponent of 0.33. Therefore, the initial growth has the predominance of coalescence which is then followed by Ostwald ripening. Coalescence has been found to be the main growth mechanism of several nanoparticle systems.21,22,50 Even though the obtained results strongly suggest Ostwald ripening as the growth mechanism for the late stage of the nucleation of the silver nanoparticles, there is no general agreement about this in the literature. Polte28 states that Ostwald ripening is an unlikely process because metallic clusters and nanoparticles are thermodynamically stable even at high temperatures. However, several authors show results that support the assumption of Ostwald ripening. In any case, we found a decrease in the exponent value and the inclination close to 1/3 suggests that Ostwald ripening may be dominant in this stage of the synthesis.
Since the synthesis is initially dominated by coalescence it can be concluded that the smaller particles found in the system are coalescing to form the larger ones. However, since the presence of smaller nanoparticles is observed throughout the synthesis they may be continuously formed and replaced by newly formed crystals that have reached the size required to be detectable by SAXS.
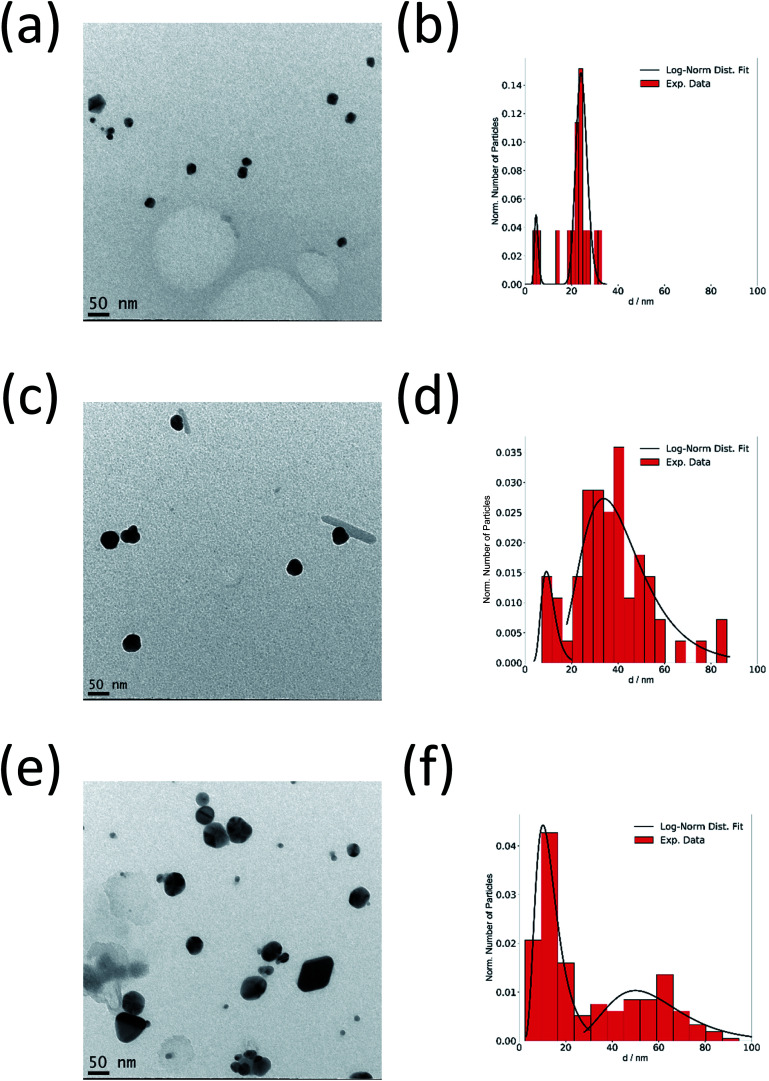
Fig. 3a–f show the TEM images of silver nanoparticles taken from the reaction mixture at different times together with the obtained size distributions. In good agreement with SAXS results, there are both small and large nanoparticles in the system. This confirms the crystal growth of particles from ∼20 nm up to ∼60 nm with increasing synthesis time while the size of the small particles remains at about 5 nm.
Fig. 3. Ex situ TEM investigation of the synthesis of silver nanoparticles at 90 °C. TEM micrographs and particle size distribution of silver nanoparticles obtained after 24 min (a and b), 36 min (c and d) and 72 min (e and f) reaction time.
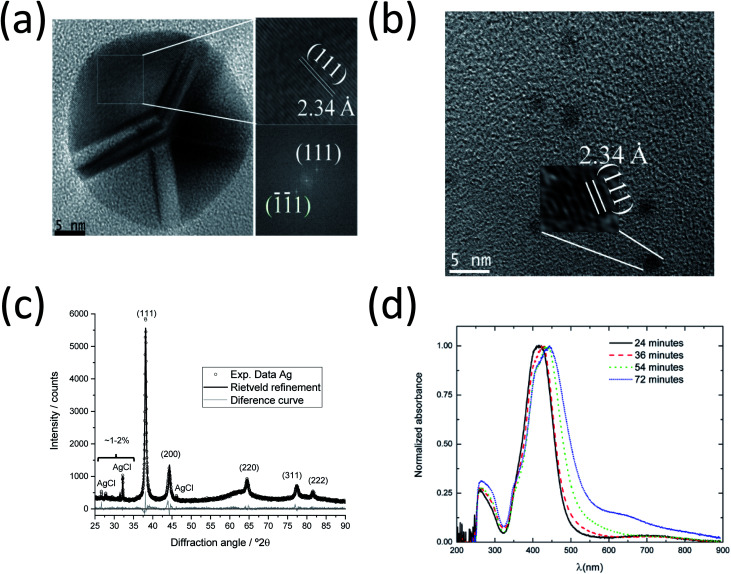
In order to investigate the inner structure of the nanoparticles, high-resolution TEM (HR-TEM) experiments and fast Fourier transform (FFT) of the micrographs were performed (Fig. 4a and b). Large silver nanoparticles with a diameter of ∼30 nm consisting of several crystallites or domains with a size of ∼10 nm were found. This polycrystallinity with a fivefold symmetry and a ratio of crystallite size : particle diameter of 1 : 3 is in excellent agreement with earlier studies.8,51,52
Fig. 4. HRTEM, XRD and UV/Vis investigations of the synthesis of silver nanoparticles at 90 °C. (a) Micrographs for larger (left) and smaller (right) silver nanoparticles, showing an interplanar distance of 2.34 Å. (b) FFT analysis results indicating the (111) planes. (c) XRD data with Rietveld refinement of silver nanoparticles obtained after 70 min. Peaks and Miller indices of silver and byproduct AgCl are indicated. (d) UV/Vis spectra of silver nanoparticles taken after 24, 36, 54 and 72 min during SAXS experiments.
A detailed analysis of the HRTEM micrograph and the corresponding FFT analysis show the presence of (111) crystallographic planes inside one domain with an interplanar distance (dhkl) of 2.34 Å (ICDD card 04-0783).6,53 The smaller nanoparticles with a diameter of 2–3 nm are also crystalline with the same interplanar distance (2.34 Å), which corresponds to the (111) plane. The determined interplanar distances were also in agreement with the values (ca. 2.4 Å) found in HRTEM investigations for the (111) planes of silver54 and gold.55 The presented dominance of the (111) crystallographic planes in the twinned Ag nanoparticles also agrees well with the tetrahedral configuration of each individual domain in fcc silver as shown by Helmlinger et al.8,51,52 Furthermore, a preferred orientation of (111) was also detected by XRD (see Fig. 4c), where the intensity ratio of the planes was found with I(111) : I(200) = 100 : 17 compared to untextured silver I(111) : I(200) = 100 : 41, as from ICDD card 04-0783.
Fig. 4c shows an X-ray powder diffractogram with Rietveld refinement for the silver nanoparticles taken during the SAXS experiments after 70 min. The computed lattice parameter of silver a(Ag) = 4.087(1) Å agrees well with the ICDD database. Trace amounts of the synthesis byproduct AgCl (about 4–5 wt% and crystallite size 143 nm according to Rietveld refinement) are detectable, as reported earlier for a similar synthesis.6 The crystallite size for the silver nanoparticles of 22(1) nm is about half the particle size (50 nm) determined by SAXS and TEM, indicating that the silver nanoparticles are polycrystalline (twinned), again in good agreement with the TEM data reported here and earlier.8,52 It is important to note that the XRD results only represent the larger particles because the ultra-small silver nanoparticles and seeds (2–3 nm) are too small to contribute to the diffraction signal.
Fig. 4d shows the UV-vis spectra of silver nanoparticles from the aliquots taken during the SAXS synthesis. The absorption maxima for all samples are in the characteristic range for silver nanoparticles with a spherical shape.6,56 They become broader and shift from 410 to 440 nm with increasing synthesis time. This indicates an increasing particle size and polydispersity in the system, supporting the SAXS and HRTEM results. The absorbance at higher wavelengths (λ > 550 nm) also increases with time, indicating the formation of larger particles or aggregates. The bands at 260 nm are due to the PVP ligand.
6. Silver–gold nanoalloys
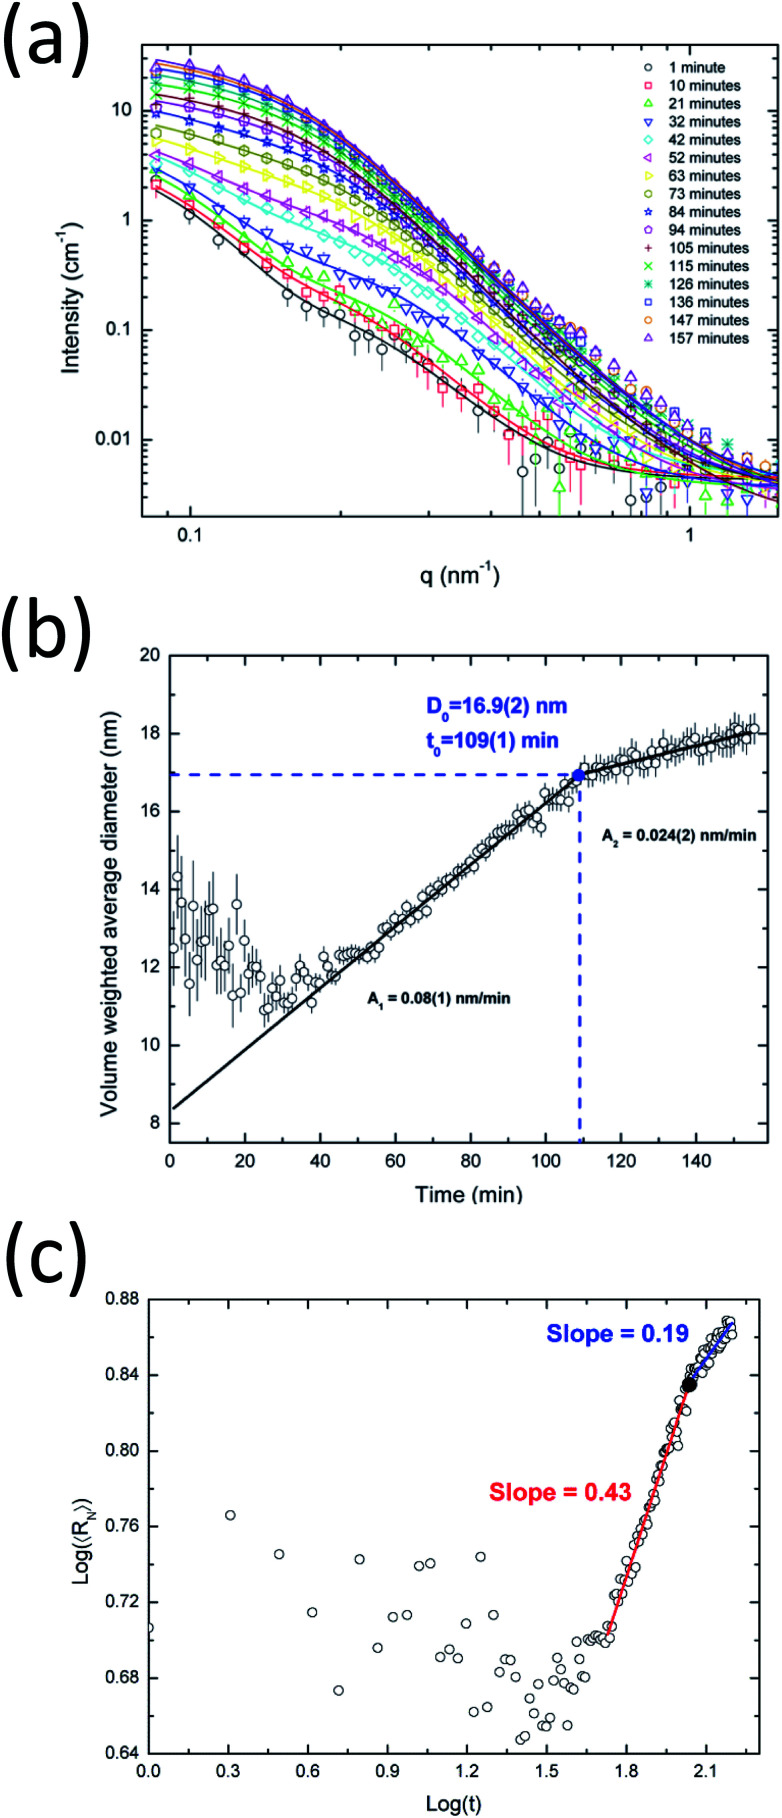
Fig. 5a shows the in situ SAXS results for the synthesis of alloyed silver–gold nanoparticles. In Fig. S3a† the full dataset of SAXS intensities is shown. The proposed model provides a very good fit for the full dataset. Interestingly, there is a clear upturn on the SAXS intensity at low angles (q < 0.15 nm−1) already after one minute, which suggests the presence of large aggregates. Since it is not realistically possible to have large AgAu nanoparticles at the beginning of the reaction, the presence of such aggregates in small amounts is probably due to the byproduct AgCl from AgNO3 and HAuCl4 as was shown by Ristig et al.6 The further evolution of the SAXS scattering intensity confirms that these initial byproducts do not influence the detection of the slowly growing AgAu nanoparticles. After ∼60 min, the evolution of the SAXS curves is dominated by the formation and further growth of AgAu nanoparticles.
Fig. 5. In situ investigations of the synthesis of alloyed silver–gold nanoparticles. (a) Recorded experimental in situ SAXS data. The experimental data points (symbols) and theoretical curves (lines) of a few frames are shown for clarity. (b) Evolution of the volume weighted average diameter. (c) log–log plot of the number weighted average radius of the silver–gold nanoalloys as a function of time.
The presence of the byproducts makes the MC analysis difficult because they strongly affect the particle size distribution. Therefore, the APS analysis was more suitable for the detection of the time-dependent growth of AgAu nanoparticles because it can explicitly include the presence of byproducts in a very easy way. The size distributions obtained from the APS fitting are shown in Fig. S3b.†
The APS analysis indicated that the average radius of gyration of the byproducts was about 23 nm, which corresponds to a particle size of about 60 nm (see eqn (10)). As shown later in the text (Fig. 6e), the effect of these aggregates is superseded by the formation of AgAu nanoparticles.
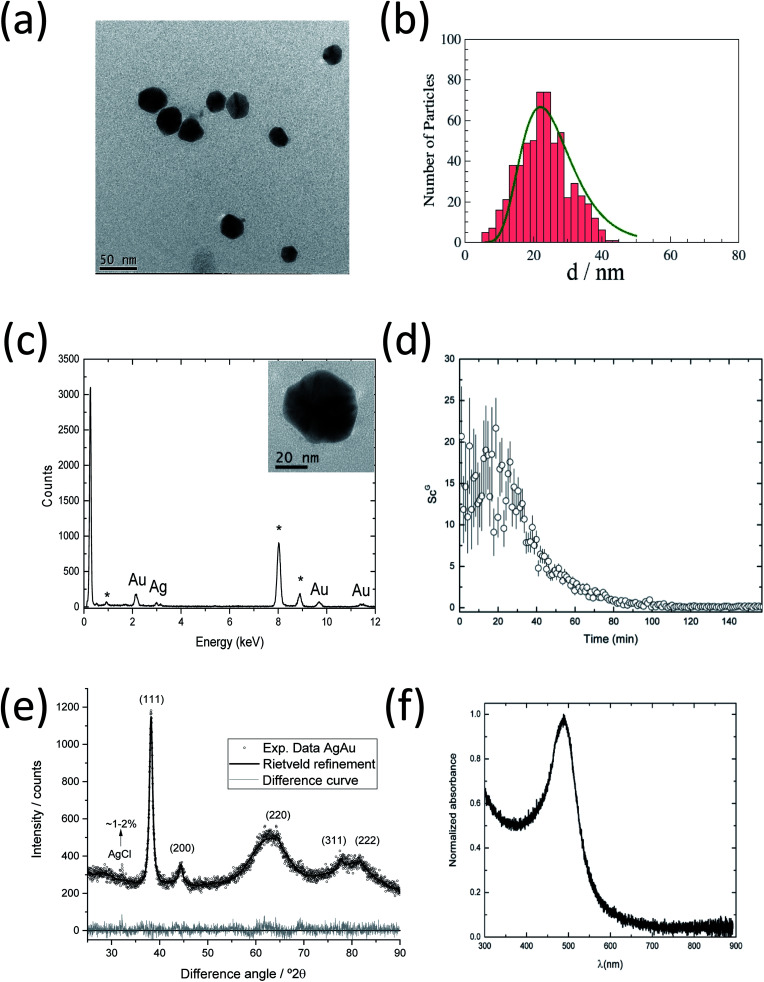
Fig. 6. Ex situ investigations of the silver–gold nanoparticles. (a) Representative TEM image and (b) size distribution of the alloyed silver–gold nanoparticles. An aliquot was taken at the end of the experiment (157 min). (c) EDS spectrum of the inset area, containing a single silver–gold nanoparticle, taken after 157 min synthesis time. In this plot, * denotes peaks of Cu from the copper TEM grid. (d) Time evolution of the aggregation parameter SGC during the synthesis of silver–gold nanoparticles, showing that the amount of AgAu nanoparticles is increasing in the system while the byproduct phase is constant. (e) XRD data and representative Rietveld refinement of AgAu nanoparticles after 157 min during SAXS synthesis. Miller indices of the AgAu phase and a small peak of the synthesis byproduct AgCl are indicated. (f) UV/Vis spectrum of AgAu nanoparticles, taken after 157 min synthesis time.
Fig. 5b shows the time evolution of the volume-weighted average diameter of the growing AgAu nanoparticles. During the first 20 minutes of the synthesis, nanoparticles with a constant diameter of about 12 nm are observed which then start to increase their size continuously. One can speculate that this may be due to some kind of electrochemical equilibration between the more noble gold and the less noble silver. During this reduction process the formed particles seem to undergo a structural change (e.g. building of the gradient structures6,56 caused by the possible electron exchange between Au and Ag) which seems to keep the size nearly constant before the systematic crystal growth. By using the Carpena model (eqn (13)) we obtained an initially faster growth rate of ∼0.08 nm min−1 followed by a slower rate of ∼0.024 nm min−1. It can be clearly seen that the saturation plateau for AgAu nanoparticles starts at ∼107 min with a critical diameter of ∼17 nm. Interestingly, the presence of a plateau seems to be characteristic for the investigated wet-chemical synthesis (reduction), pure Ag and alloyed AgAu.
Fig. 5c shows the evolution of the number-average radius as a function of time in logarithmic scales. Following the previous comparison with LSW theory, the estimation of exponent x as an indicator for the growth process was ∼0.43 for the fast-growth region, strongly suggesting the occurrence of coalescence in this stage. The x value for the slow-growth region is 0.19 which is reasonably smaller than the value expected for Ostwald ripening (1/3). Therefore, the late stage of the growth evolution for the silver–gold sample cannot be directly described by coarsening mechanisms, probably due to the complex equilibrium and the consumption of precursors at the end of the synthesis. These nanoparticles are expected to be spherical with a more or less defined state between an alloy and a core–shell. Therefore, the growth mechanism of the nanoparticles may follow a complex mechanism that cannot be uniquely associated with a specific process.
Fig. 6a and b show a TEM image of AgAu nanoparticles taken at the end of the observation period (157 min), together with the particle size distribution. The average size of the AgAu nanoparticles is ∼22 nm, in good agreement with the final size determined by SAXS analysis (∼18 nm). A monomodal distribution was observed (no small nanoparticles), which is different from the synthesis of pure Ag nanoparticles (Fig. 3).
To ensure the bimetallic composition of the nanoparticles, EDS analyses were performed on aliquots taken at the end of the synthesis (157 min) and ten different AgAu nanoparticles were analysed. Fig. 6c shows a spectrum of the inset area, containing a single nanoparticle with a diameter of ∼46 nm. This spectrum is representative of the spectra recorded for other nanoparticles, indicating the presence of both metals, silver and gold, in the same nanoparticle. This supports the formation of the silver–gold alloy.
Fig. 6d shows the time evolution of the scale factor SGC. As explained above, this factor provides a direct indication of the ratio between the scattering power (product of concentration and squared volume) of the aggregated species and the smaller particles. During the first 20 min the values of the scale factor varies with high uncertainty, with a tendency to increase. In this region it was also possible to see unclear effects on the average diameter (Fig. 5b) which can be associated with some sort of equilibration in the system. After this period, one can see a systematic decrease in the scale factor SGC. According to eqn (11) this may be a result of an increase in the concentration of growing AgAu nanoparticles, while the amount of the initial byproducts remains constant in the system. This behavior of SGC can also indicate an increase in the electronic contrast due to the incorporation of the gold and silver atoms during the formation of the gradient structures.
Fig. 6e shows an X-ray powder diffractogram with Rietveld refinement for the AgAu nanoparticles, taken after 157 min. The lattice parameter a(AgAu) = 4.082(8) Å indicates the formation of an alloy.57 As in the synthesis of silver nanoparticles, a small amount of the synthesis byproduct AgCl (1–2%) was found. The computed crystallite size of AgAu nanoparticles of 10(1) nm is again about half the particle size (22 nm) as determined by SAXS and TEM. This indicates the formation of polycrystalline (twinned) AgAu nanoparticles, in good agreement with earlier results.56 Notably, the crystallite size of AgAu nanoparticles (CS = 10 nm) is smaller than in the case of silver nanoparticles (22 nm) but has the same ratio to the particle diameter (about 1 : 2).
Fig. 6f shows the UV-vis curves for the AgAu nanoparticles taken after 157 min. The absorption maximum at 480 nm indicates the formation of nanoparticles, typical of alloyed spherical AgAu nanoparticles of a comparable size, in good agreement with the EDS measurements and earlier results.6,56 In the case of two independent Ag and Au phases or the formation of a core–shell structure, two separate plasmon resonance bands would be detected.58
7. Conclusions
In situ SAXS investigations of the nucleation process of pure silver and alloyed silver–gold nanoparticles were performed. The analysis of the data indicates that silver nanoparticles develop into two characteristic size fractions, i.e. smaller and larger nanoparticles. For the silver–gold nanoparticles, only one growing fraction was found with simultaneous detection of the remaining byproduct (AgCl). The crystal growth of both Ag and AgAu nanoparticles can be described by two main features: faster growth at the beginning and slower at the end, reaching a saturation plateau. By modeling the number weighted radius as a function of time with the expression R ∝ tx one could associate the dynamic coalescence as the growth mechanism for the beginning of both Ag and AgAu nanoparticle syntheses. At the end of the Ag synthesis, the results indicated that Ostwald ripening could be the possible mechanism. On the other hand, at the end stage of the AgAu synthesis there is a strong decrease in the exponent, making difficult its association with LSW predicted growth mechanism.
The in situ SAXS results were confirmed by ex situ TEM images, giving the particle size distributions. HRTEM, FFT, EDX and XRD analyses revealed the crystal structure and the chemical composition of the formed nanoparticles. By combination of these in situ and ex situ analyses it was possible to investigate the continuous growth of the metallic nanoparticles in detail during the wet-chemical reduction synthesis, starting at the early nucleation stage.
For Ag nanoparticles it was possible to detect two particle fractions (distributions) during the synthesis, one with smaller size, almost constant throughout the synthesis and another one, which grows over time. Both distributions were also visible in the TEM micrographs. Dynamic coalescence was found in previous investigations of Ag nanoparticle synthesis,22,28 and the results shown in this work suggest that the smaller particles visible in the system are coalescing to form the larger particles. Therefore, the initial nanoparticles in the system grow up to ∼3 nm in diameter before being absorbed in the larger particles. This process evolves up to an aggregate size of ∼36 nm. At this point, there is a decrease in the growth rate which, based on the LSW analysis, suggested a change in the coarsening process from coalescence to Ostwald ripening. This change may be attributed to variations in the free-energy of the system since after a certain radius one growth process is more favorable.59,60 For the AgAu alloy nanoparticle synthesis, a dynamic coalescence was also observed as the main growth process but only one distribution was found in the SAXS data. This suggests that the small particles coalescing into larger ones have sizes smaller than the minimum detectable size in our experiments. In this case, for particles larger than ∼17 nm, a change in the growth mechanism was found, with an important decrease of the growth rate. The obtained exponent could not be easily explained by any of the usual coarsening processes. This suggests a complex equilibrium in the system, either by the variations of the free energy or by the exhausting of the components for the particle formation in the system.
Overall, the investigation strategy proposed in this article provides a systematic description of the in situ growth process for Ag and AgAu systems, which allowed a detailed and precise determination of structural parameters with comprehensive comparisons among several experimental techniques. The results also demonstrate the high quality of the obtained SAXS data on a laboratory based SAXS instrument, coupled with advanced modeling tools and a careful experimental setup for temperature control and in situ investigations.
Author contributions
Author contributions: PRAFG carried out in situ SAXS experiments, fit the SAXS data and wrote the manuscript draft. VG and KP contributed to the synthesis. LO collected HRTEM and EDX data. WW evaluated the particle size distribution by TEM. OP performed X-ray powder diffraction analysis and Rietveld refinement. OP, ME, and CLPO supervised the experiments, interpreted the results and critically reviewed the manuscript.
Funding sources
C. L. P. Oliveira was supported by CAPES (grant 431/15), CNPq (grant 304861/2015-4) and the São Paulo Research Foundation (FAPESP – grants 2016/24531-3, 2018/16092-5). P. R. A. F. Garcia was supported by CAPES, under CAPES-DAAD project no. 431/15. Matthias Epple thanks the DFG for funding (project Ep 22/44-1) and DAAD/CAPES (2015-2018, No 57139595). We are grateful to the Deutscher Akademischer Austauschdienst for generous funding within the joint DAAD-PROBRAL exchange programme. This study was financed in part by the Coordenação de Aperfeiçoamento de Pessoal de Nível Superior – Brasil (CAPES) – Finance Code 001.
Conflicts of interest
The authors state that there are no conflicts to declare.
Supplementary Material
Acknowledgments
We would like to thank all the technicians of the Complex Fluid Group involved in the realization of the experiments, especially Dennys Reis, whose assistance was fundamental to the success of the experiments.
Electronic supplementary information (ESI) available. See DOI: 10.1039/c9na00569b
References
- Jain P. K. Huang X. El-Sayed I. H. El-Sayed M. A. Review of Some Interesting Surface Plasmon Resonance-enhanced Properties of Noble Metal Nanoparticles and Their Applications to Biosystems. Plasmonics. 2007;2(3):107–118. doi: 10.1007/s11468-007-9031-1. [DOI] [Google Scholar]
- Daniel M. C. Astruc D. Gold nanoparticles: assembly, supramolecular chemistry, quantum-size-related properties, and applications toward biology, catalysis, and nanotechnology. Chem. Rev. 2004;104:293–346. doi: 10.1021/cr030698+. [DOI] [PubMed] [Google Scholar]
- Sozer N. Kokini J. L. Nanotechnology and its applications in the food sector. Trends Biotechnol. 2009;27(2):82–89. doi: 10.1016/j.tibtech.2008.10.010. [DOI] [PubMed] [Google Scholar]
- Banerjee S. Loza K. Meyer-Zaika W. Prymak O. Epple M. Structural Evolution of Silver Nanoparticles during Wet-Chemical Synthesis. Chem. Mater. 2014;26(2):951–957. doi: 10.1021/cm4025342. [DOI] [Google Scholar]
- Chen X. Schröder J. Hauschild S. Rosenfeldt S. Dulle M. Förster S. Simultaneous SAXS/WAXS/UV-Vis Study of the Nucleation and Growth of Nanoparticles: A Test of Classical Nucleation Theory. Langmuir. 2015;31(42):11678–11691. doi: 10.1021/acs.langmuir.5b02759. [DOI] [PubMed] [Google Scholar]
- Ristig S. Prymak O. Loza K. Gocyla M. Meyer-Zaika W. Heggen M. Raabe D. Epple M. Nanostructure of wet-chemically prepared, polymer-stabilized silver–gold nanoalloys (6 nm) over the entire composition range. J. Mater. Chem. B. 2015;3(23):4654–4662. doi: 10.1039/C5TB00644A. [DOI] [PubMed] [Google Scholar]
- Harada M. Tamura N. Takenaka M. Nucleation and Growth of Metal Nanoparticles during Photoreduction Using In Situ Time-Resolved SAXS Analysis. J. Phys. Chem. C. 2011;115(29):14081–14092. doi: 10.1021/jp203119a. [DOI] [Google Scholar]
- Banerjee S. Loza K. Meyer-Zaika W. Prymak O. Epple M. Structural evolution of silver nanoparticles during wet-chemical synthesis. Chem. Mater. 2014;26:951–957. doi: 10.1021/cm4025342. [DOI] [Google Scholar]
- Saw E. N. Grasmik V. Rurainsky C. Epple M. Tschulik K. Electrochemistry at single bimetallic nanoparticles – using nano impacts for sizing and compositional analysis of individual AgAu alloy nanoparticles. Faraday Discuss. 2016;193(Single Entity Electrochemistry):327–338. doi: 10.1039/C6FD00112B. [DOI] [PubMed] [Google Scholar]
- Guisbiers G. Mendoza-Cruz R. Bazán-Díaz L. Velázquez-Salazar J. J. Mendoza-Perez R. Robledo-Torres J. A. Rodriguez-Lopez J. L. Montejano-Carrizales J. M. Whetten R. L. José-Yacamán M. Electrum, the gold–silver alloy, from the bulk scale to the nanoscale: synthesis, properties, and segregation rules. ACS Nano. 2016;10:188–198. doi: 10.1021/acsnano.5b05755. [DOI] [PMC free article] [PubMed] [Google Scholar]
- Xu Y. Chen L. Wang X. Yao W. Zhang Q. Recent advances in noble metal based composite nanocatalysts: colloidal synthesis, properties, and catalytic applications. Nanoscale. 2015;7:10559–10583. doi: 10.1039/C5NR02216A. [DOI] [PubMed] [Google Scholar]
- McNamara K. Tofail S. A. Nanosystems: the use of nanoalloys, metallic, bimetallic, and magnetic nanoparticles in biomedical applications. Phys. Chem. Chem. Phys. 2015;17:27981–27995. doi: 10.1039/C5CP00831J. [DOI] [PubMed] [Google Scholar]
- Calvo F. Thermodynamics of nanoalloys. Phys. Chem. Chem. Phys. 2015;17:27922–27939. doi: 10.1039/C5CP00274E. [DOI] [PubMed] [Google Scholar]
- Ristig S. Kozlova D. Meyer-Zaika W. Epple M. An easy synthesis of autofluorescent alloyed silver–gold nanoparticles. J. Mater. Chem. B. 2014;2:7887–7895. doi: 10.1039/C4TB01010H. [DOI] [PubMed] [Google Scholar]
- Intartaglia R. Das G. Bagga K. Gopalakrishnan A. Genovese A. Povia M. Di Fabrizio E. Cingolani R. Diaspro A. Brandi F. Laser synthesis of ligand-free bimetallic nanoparticles for plasmonic applications. Phys. Chem. Chem. Phys. 2013;15:3075–3082. doi: 10.1039/C2CP42656K. [DOI] [PubMed] [Google Scholar]
- Liu X. Wang D. Li Y. Synthesis and catalytic properties of bimetallic nanomaterials with various architectures. Nano Today. 2012;7(5):448–466. doi: 10.1016/j.nantod.2012.08.003. [DOI] [Google Scholar]
- DeSantis C. J. Sue A. C. Bower M. M. Skrabalak S. E. Seed-mediated co-reduction: A versatile route to architecturally controlled bimetallic nanostructures. ACS Nano. 2012;6:2617–2628. doi: 10.1021/nn2051168. [DOI] [PubMed] [Google Scholar]
- Guo S. J. Wang E. K. Functional micro/nanostructures: simple synthesis and application in sensors, fuel cells, and gene delivery. Acc. Chem. Res. 2011;44:491–500. doi: 10.1021/ar200001m. [DOI] [PubMed] [Google Scholar]
- Mourdikoudis S. Pallares R. M. Thanh N. T. K. Characterization techniques for nanoparticles: comparison and complementarity upon studying nanoparticle properties. Nanoscale. 2018;10(27):12871–12934. doi: 10.1039/C8NR02278J. [DOI] [PubMed] [Google Scholar]
- Li T. Senesi A. J. Lee B. Small Angle X-ray Scattering for Nanoparticle Research. Chem. Rev. 2016;116(18):11128–11180. doi: 10.1021/acs.chemrev.5b00690. [DOI] [PubMed] [Google Scholar]
- Polte J. Ahner T. T. Delissen F. Sokolov S. Emmerling F. Thünemann A. F. Kraehnert R. Mechanism of Gold Nanoparticle Formation in the Classical Citrate Synthesis Method Derived from Coupled In Situ XANES and SAXS Evaluation. J. Am. Chem. Soc. 2010;132(4):1296–1301. doi: 10.1021/ja906506j. [DOI] [PubMed] [Google Scholar]
- Harada M. Katagiri E. Mechanism of Silver Particle Formation during Photoreduction Using In Situ Time-Resolved SAXS Analysis. Langmuir. 2010;26(23):17896–17905. doi: 10.1021/la102705h. [DOI] [PubMed] [Google Scholar]
- Harada M. Ikegami R. In Situ Quick X-ray Absorption Fine Structure and Small-Angle X-ray Scattering Study of Metal Nanoparticle Growth in Water-in-Oil Microemulsions during Photoreduction. Cryst. Growth Des. 2016;16(5):2860–2873. doi: 10.1021/acs.cgd.6b00173. [DOI] [Google Scholar]
- Polte J. Tuaev X. Wuithschick M. Fischer A. Thuenemann A. F. Rademann K. Kraehnert R. Emmerling F. Formation Mechanism of Colloidal Silver Nanoparticles: Analogies and Differences to the Growth of Gold Nanoparticles. ACS Nano. 2012;6(7):5791–5802. doi: 10.1021/nn301724z. [DOI] [PubMed] [Google Scholar]
- Koerner H. MacCuspie R. I. Park K. Vaia R. A. In Situ UV/Vis, SAXS, and TEM Study of Single-Phase Gold Nanoparticle Growth. Chem. Mater. 2012;24(6):981–995. doi: 10.1021/cm202633v. [DOI] [Google Scholar]
- Singh M. Sinha I. Singh A. K. Mandal R. K. LSPR and SAXS studies of starch stabilized Ag–Cu alloy nanoparticles. Colloids Surf., A. 2011;384:668–674. doi: 10.1016/j.colsurfa.2011.05.037. [DOI] [Google Scholar]
- Wu L. Fournier A. P. Willis J. J. Cargnello M. Tassone C. J. In Situ X-ray Scattering Guides the Synthesis of Uniform PtSn Nanocrystals. Nano Lett. 2018;18(6):4053–4057. doi: 10.1021/acs.nanolett.8b02024. [DOI] [PubMed] [Google Scholar]
- Polte J. Fundamental growth principles of colloidal metal nanoparticles – a new perspective. CrystEngComm. 2015;17(36):6809–6830. doi: 10.1039/C5CE01014D. [DOI] [Google Scholar]
- Oliveira C. L. P., Vorup-Jensen T., Andersen C. B. F., Andersen G. R. and Pedersen J. S., Discovering New Features of Protein Complexes Structures by Small-Angle X-Ray Scattering, in Applications of Synchrotron Light to Scattering and Diffraction in Materials and Life Sciences, 2009, pp 231–244 [Google Scholar]
- Rueden C. T. Schindelin J. Hiner M. C. DeZonia B. E. Walter A. E. Arena E. T. Eliceiri K. W. ImageJ2: ImageJ for the next generation of scientific image data. BMC Bioinf. 2017;18(1):529. doi: 10.1186/s12859-017-1934-z. [DOI] [PMC free article] [PubMed] [Google Scholar]
- Baumgard J., Pohl M.-M., Kragl U. and Steinfeldt N., Preparation of tailor-made supported catalysts using asymmetric flow field flow fractionation and their application in hydrogenation, In Nanotechnology Reviews, 2014, Vol. 3, p. 87 [Google Scholar]
- Huang L.-K. Wang M.-J. J. Image thresholding by minimizing the measures of fuzziness. Pattern Recognit. 1995;28(1):41–51. doi: 10.1016/0031-3203(94)E0043-K. [DOI] [Google Scholar]
- Prymak O. Ristig S. Meyer-Zaika V. Rostek A. Ruiz L. Gonzalez-Calbet J. M. Vallet-Regi M. Epple M. X-Ray powder diffraction as a tool to investigate the ultrastructure of nanoparticles. Russ. Phys. J. 2014;56:1111–1115. doi: 10.1007/s11182-014-0149-2. [DOI] [Google Scholar]
- Scherrer P. Bestimmung der Größe und der inneren Struktur von Kolloidteilchen mittels Röntgenstrahlen. Nachr. Ges. Wiss. Goettingen, Math.-Phys. Kl. 1918;2:98–100. [Google Scholar]
- Martelli S. Di Nunzio P. E. Particle size distribution of nanospheres by Monte Carlo fitting of small angle X-ray scattering curves. Part. Part. Syst. Charact. 2002;19(4):247–255. doi: 10.1002/1521-4117(200208)19:4<247::AID-PPSC247>3.0.CO;2-8. [DOI] [Google Scholar]
- Pauw B. R. Pedersen J. S. Tardif S. Takata M. Iversen B. B. Improvements and considerations for size distribution retrieval from small-angle scattering data by Monte Carlo methods. J. Appl. Crystallogr. 2013;46:365–371. doi: 10.1107/S0021889813001295. [DOI] [PMC free article] [PubMed] [Google Scholar]
- Svergun D. I., Feigin L. A. and Taylor G. W.., Structure analysis by small-angle X-ray and neutron scattering, Springer, 1987 [Google Scholar]
- Glatter O. Determination of Particle-Size Distribution-Functions From Small-Angle Scattering Data by Means of the Indirect Transformation Method. J. Appl. Crystallogr. 1980;13(FEB):7–11. doi: 10.1107/S0021889880011429. [DOI] [Google Scholar]
- Semenyuk A. V. Svergun D. I. GNOM – A Program Package for Small-Angle Scattering Data-Processing. J. Appl. Crystallogr. 1991;24:537–540. doi: 10.1107/S002188989100081X. [DOI] [Google Scholar]
- Lindner P. and Zemb T., Neutron, X-ray and light scattering: introduction to an investigative tool for colloidal and polymeric systems, 1991 [Google Scholar]
- Oliveira C. L. P. Santos P. R. Monteiro A. M. Neto A. M. F. Effect of oxidation on the structure of human low- and high-density lipoproteins. Biophys. J. 2014;106:2595–2605. doi: 10.1016/j.bpj.2014.04.049. [DOI] [PMC free article] [PubMed] [Google Scholar]
- Oliveira C. L. P. Monteiro A. M. Figueiredo Neto A. M. Structural modifications and clustering of low-density lipoproteins in solution induced by heating. Braz. J. Phys. 2014;44:753–764. doi: 10.1007/s13538-014-0273-z. [DOI] [Google Scholar]
- Guinier A., X-ray diffraction in crystals, imperfect crystals, and amorphous bodies, Courier Corporation, 1994 [Google Scholar]
- Carpena P. Aguiar J. Bernaola-Galvan P. Ruiz C. C. Problems associated with the treatment of conductivity-concentration data in surfactant solutions: Simulations and experiments. Langmuir. 2002;18(16):6054–6058. doi: 10.1021/la025770y. [DOI] [Google Scholar]
- Conti M. Meerson B. Peleg A. Sasorov P. V. Phase ordering with a global conservation law: Ostwald ripening and coalescence. Phys. Rev. E: Stat., Nonlinear, Soft Matter Phys. 2002;65(4):0461171–04611713. doi: 10.1103/PhysRevE.65.046117. [DOI] [PubMed] [Google Scholar]
- Lifshitz I. M. Slyozov V. V. The Kinetics of Precipitation From Supersaturated Solid Solutions. J. Phys. Chem. Solids. 1961;19(1–2):35–50. doi: 10.1016/0022-3697(61)90054-3. [DOI] [Google Scholar]
- Sholl D. S. Skodje R. T. Late-stage coarsening of adlayers by dynamic cluster coalescence. Phys. A. 1996;231(4):631–647. doi: 10.1016/0378-4371(96)00112-4. [DOI] [Google Scholar]
- Woehl T. J. Park C. Evans J. E. Arslan I. Ristenpart W. D. Browning N. D. Direct Observation of Aggregative Nanoparticle Growth: Kinetic Modeling of the Size Distribution and Growth Rate. Nano Lett. 2014;14(1):373–378. doi: 10.1021/nl4043328. [DOI] [PMC free article] [PubMed] [Google Scholar]
- Ahlberg S. Antonopulos A. Diendorf J. Dringen R. Epple M. Flöck R. Goedecke W. Graf C. Haberl N. Helmlinger J. Herzog F. Heuer F. Hirn S. Johannes C. Kittler S. Köller M. Korn K. Kreyling W. G. Krombach F. Lademann J. Loza K. Luther E. M. Malissek M. Meinke M. C. Nordmeyer D. Pailliart A. Raabe J. Rancan F. Rothen-Rutishauser B. Rühl E. Schleh C. Seibel A. Sengstock C. Treuel L. Vogt A. Weber K. Zellner R. PVP-coated, negatively charged silver nanoparticles: A multi-center study of their physicochemical characteristics, cell culture and in vivo experiments. Beilstein J. Nanotechnol. 2014;5:1944–1965. doi: 10.3762/bjnano.5.205. [DOI] [PMC free article] [PubMed] [Google Scholar]
- Shields S. P. Richards V. N. Buhro W. E. Nucleation Control of Size and Dispersity in Aggregative Nanoparticle Growth. A Study of the Coarsening Kinetics of Thiolate-Capped Gold Nanocrystals. Chem. Mater. 2010;22(10):3212–3225. doi: 10.1021/cm100458b. [DOI] [Google Scholar]
- Banerjee S. Liu C. H. Lee J. D. Kovyakh A. Grasmik V. Prymak O. Koenigsmann C. Liu H. Wang L. Abeykoon A. M. M. Wong S. S. Epple M. Murray C. B. Billinge S. J. L. Improved models for metallic nanoparticle cores from atomic pair distribution function (PDF) analysis. J. Phys. Chem. C. 2018;122:29498–29506. doi: 10.1021/acs.jpcc.8b05897. [DOI] [Google Scholar]
- Helmlinger J. Prymak O. Loza K. Gocyla M. Heggen M. Epple M. On the crystallography of silver nanoparticles with different shapes. Cryst. Growth Des. 2016;16:3677–3687. doi: 10.1021/acs.cgd.6b00178. [DOI] [Google Scholar]
- Rodríguez-León E. Iñiguez-Palomares R. Navarro R. E. Herrera-Urbina R. Tánori J. Iñiguez-Palomares C. Maldonado A. Synthesis of silver nanoparticles using reducing agents obtained from natural sources (Rumex hymenosepalus extracts) Nanoscale Res. Lett. 2013;8:318. doi: 10.1186/1556-276X-8-318. [DOI] [PMC free article] [PubMed] [Google Scholar]
- Liu H. Yang J. Bimetallic Ag–hollow Pt heterodimers via inside-out migration of Ag in core–shell Ag–Pt nanoparticles at elevated temperature. J. Mater. Chem. A. 2014;2(19):7075–7081. doi: 10.1039/C4TA00243A. [DOI] [Google Scholar]
- Chen D. Li C. Liu H. Ye F. Yang J. Core–shell Au@Pd nanoparticles with enhanced catalytic activity for oxygen reduction reaction via core–shell Au@Ag/Pd constructions. Sci. Rep. 2015;5:11949. doi: 10.1038/srep11949. [DOI] [PMC free article] [PubMed] [Google Scholar]
- Grasmik V. Rurainsky C. Loza K. Evers M. V. Prymak O. Heggen M. Tschulik K. Epple M. Deciphering the surface composition and the internal structure of alloyed silver–gold nanoparticles. Chem. - Eur. J. 2018;24:9051–9060. doi: 10.1002/chem.201800579. [DOI] [PubMed] [Google Scholar]
- Prymak O. Jakobi J. Rehbock C. Epple M. Barcikowski S. Crystallographic characterization of laser-generated, polymer-stabilized 4 nm silver–gold alloyed nanoparticles. Mater. Chem. Phys. 2018;207:442–450. doi: 10.1016/j.matchemphys.2017.12.080. [DOI] [Google Scholar]
- Shore M. S. Wang J. Johnston-Peck A. C. Oldenburg A. L. Tracy J. B. Synthesis of Au(core)/Ag(shell) nanoparticles and their conversion to AuAg alloy nanoparticles. Small. 2011;7:230–234. doi: 10.1002/smll.201001138. [DOI] [PubMed] [Google Scholar]
- Talapin D. V. Rogach A. L. Haase M. Weller H. Evolution of an ensemble of nanoparticles in a colloidal solution: theoretical study. J. Phys. Chem. B. 2001;105(49):12278–12285. doi: 10.1021/jp012229m. [DOI] [Google Scholar]
- Jones R. A. L.., Soft condensed matter, Oxford University Press, Oxford, 2002 [Google Scholar]
Associated Data
This section collects any data citations, data availability statements, or supplementary materials included in this article.


