Abstract
Rational design and synthesis of efficient electrodes with pronounced energy storage properties are crucial for supercapacitors. Herein, we report thin NiCr-layered double hydroxide nanoflakes (NiCr-LDNs) for a high-performance supercapacitor. These fabricated NiCr-LDNs, with various Ni2+/Cr3+ ratios, are one-step controllably synthesized through ultrasonication coupled with mechanical agitation, without hydrothermal treatment or extra exfoliation using organic solvents. Through comparison of different Ni2+/Cr3+ ratios, the Ni2Cr1-LDNs with a 4.7 nm thickness exhibited a superb capacitance performance of 1525 F g−1 at 2 A g−1, which is competitive with most previously reported layered double hydroxide (LDH)-based electrodes. These thin nanoflake structures have the potential to reduce the energy barrier and enhance the capture ability of electrolyte ions. Besides, an asymmetric supercapacitor (ASC) assembled using Ni2Cr1-LDNs achieved a remarkable energy density of 55.22 W h kg−1 at a power density of 400 W kg−1 and maintained high specific capacitance (over 81%), even after 5000 cycles. This work offers an efficient and facile route to fabricating LDH nanoflakes for boosting energy storage capabilities.
Rational design and synthesis of efficient electrodes with pronounced energy storage properties are crucial for supercapacitors.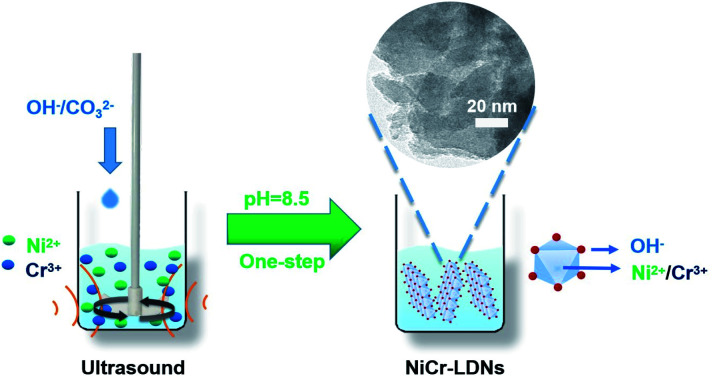
Introduction
Layered double hydroxides (LDHs), also called hydrotalcite-like materials, are a family of two-dimensional anionic compounds formed by the orderly arrangement of anions between layers and positively charged laminates.1,2 The formula of LDHs is expressed as follows: M1−x2+Mx3+(OH)2(An−)x/n·mH2O, where M2+, M3+ and An− represent divalent metal ions, trivalent metal ions and intercalated anions, respectively.1–6 LDHs are alkaline and thermally stable, can exchange anions, and have a controllable composition and structure.7–9 On the one hand, the unique spatial structure of LDHs provides a large surface area to transfer charge and capture electrons.8,10 On the other hand, the high dispersion of variable valence metal ions on the lamella can provide abundant electrochemically active sites, resulting in high pseudocapacitance.11–13 Over the past few decades, LDHs have attracted considerable attention for use as electrochemical supercapacitors. For example, Liu et al. fabricated NiO/NiMn-LDHs by a facile two-step approach and reported a specific capacitance of 937 F g−1 at a current density of 0.5 A g−1.14 Li et al. fabricated NiFe-LDHs/graphene for use as a supercapacitor with a good specific capacitance of 1462.5 F g−1 at 5 A g−1.15 Zhang et al. synthesized a NiAl-LDH pseudo-capacitor electrode, which exhibited a specific capacitance of 1.040 C cm−2 at 1.68 mA cm−2.16
However, LDHs still have their own intrinsic shortcomings, for example, the accumulation of layers and the blocked interlayer space limit electrolyte ion access to internal active sites.17,18 In order to facilitate the diffusion of ions and enhance electronic conductivity, researchers have developed several fabrication strategies to reduce the thickness of layers and increase the distance between layers. One of the most common methods is chemical stripping. In a pioneering study, Hu et al. investigated the synthesis of CoCo-, NiFe- and NiCo-LDH nanosheets by dispersing LDH powder into 100 mL of formamide and stirring for 24 h.19 Zhong et al. studied the exfoliation of CoAl-LDHs by stirring for 2 days in formamide.20 Du et al. synthesized NiAl-LDHs in a formamide solution by stirring for 3 days under nitrogen protection.20 In addition, some new exfoliation methods (e.g., Ar-plasma, nitrogen-plasma, and solid-phase exfoliation techniques) were used to synthesize thin LDHs.17,22,23 Our previous studies have also shown that ultrasonication-assisted hydrothermal synthesis is a good approach to fabricate thin CoMn-LDHs and NiCo-LDHs in several steps, enhancing the catalytic performance of oxygen evolution in comparison with bulk LDH precursors.17,24 However, these exfoliation methods still have several steps and, therefore, suffer from low efficiency and complexity, are time-consuming and require a large amount of chemical reagents. Besides, the energy storage performance and durability of the previously reported LDHs still need to be improved.17,24 Developing a one-step, facile method to fabricate thin LDHs with a controllable morphology for boosting energy storage capacity is still a challenge.
Inspired by the advanced studies, we endeavored to control the synthesis of thin NiCr-layered double hydroxide nanoflakes (NiCr-LDNs) with different Ni2+/Cr3+ ratios in one step, and these fabricated LDNs served as a superior pseudocapacitive electrode for energy storage. This alternative construction strategy shows great potential for the large-scale production of nanoflakes. Several types of NiCr-LDNs with different Ni2+/Cr3+ ratios were successfully designed and evaluated with electrochemical tests. The Ni2Cr1-LDN electrode achieved a remarkable specific capacitance of 1525 F g−1 at a current density of 2 A g−1 in a 6 M KOH electrolyte using the three-electrode system. Besides, the Ni2Cr1-LDNs were used as a positive electrode to assemble an asymmetric supercapacitor, which provided a relatively outstanding energy density of 55.22 W h kg−1 at a power density of 400 W kg−1, retaining 81.1% of the original specific capacitance even after 5000 cycles. Furthermore, Ni2Cr1-LDNs exhibited low resistance, fast kinetics and long durability. This work provides a facile and efficient way to fabricate LDH nanoflakes to largely enhance capacitance.
Experimental
Synthesis of NiCr-LDNs
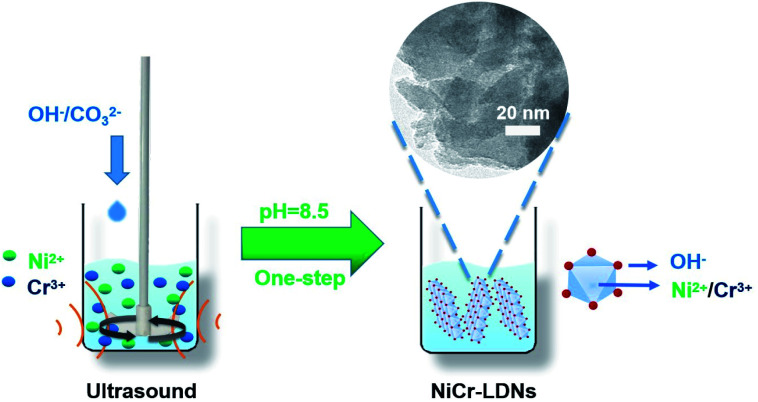
All of the chemicals were used without any purification. Nickel chloride hexahydrate (NiCl2·6H2O), chromium chloride hexahydrate (CrCl3·6H2O), sodium hydroxide (NaOH), and sodium carbonate (Na2CO3) were bought from Macklin Chemical Reagent Co. Ltd. The general synthesis procedure is depicted in Fig. 1. NiCl2·6H2O and CrCl3·6H2O were dissolved in distilled water to prepare 1 M aqueous solutions. Then, NiCl2 (1 M) and CrCl3 (1 M) were added to a beaker to achieve mixed solution A (10 mL, the molar ratios of Ni2+ and Cr3+ in solution A ranged from 3 : 1 to 1 : 2). Solution A was mechanically stirred (200 rpm) and ultrasonicated (40 kHz) simultaneously. About 0.2 mol of Na2CO3 and 0.8 mol of NaOH were dissolved in distilled water (1 L), and then the mixture (solution B) was slowly titrated into solution A to adjust the pH to 8.5 and held for 1 h. After centrifugation and vacuum drying at 50 °C for 14 h, the powder products were collected and denoted as Ni3Cr1-LDNs, Ni2Cr1-LDNs, Ni1Cr1-LDNs, and Ni1Cr2-LDNs corresponding to a Ni2+/Cr3+ ratio of 3 : 1, 2 : 1, 1 : 1, and 1 : 2, respectively. The reference Ni2Cr1-LDHs were synthesized in the same way without ultrasonic treatment.
Fig. 1. Schematic illustration of the facile synthesis of NiCr-LDNs in one-step.
Electrode characterization
X-ray diffraction (XRD) characterization was conducted on a D/max-2200vpc (Rigaku, Japan) at 40 kV and 26 mA with Cu Kα1 radiation of 1.54060 Å. The 2-theta degree ranged from 5° to 70°, and the scan rate was 10° min−1. Transmission electron microscopy (TEM) was used to identify the microstructure and the morphologies of the samples (coated on Cu grids) and was performed using a JEM-2100F (JEOL, Japan) operated at 200 kV. Scanning electron microscopy (SEM, ZEISS, SIGMA 500, GER) and corresponding energy-dispersive X-ray spectrometry (EDS, Bruker, GER) were used to characterize the microstructures and element distribution of the products at 10 kV. X-ray photoelectron spectroscopy (XPS) analysis was carried out using an ESCALab 250 imaging X-ray photoelectron spectrometer system (Thermo Scientific, USA) with monochromatic Al Kα X-rays as the excitation source (E = 1486.6 eV) and a pass energy of 20 eV. Atomic force microscopy (AFM) was used to obtain the thickness of samples and was performed on a Dimension Edge (Bruker, USA) in tapping mode. For AFM, the samples were dispersed in an ethanol solvent and dripped onto a mica plate for testing. N2 adsorption–desorption isotherms of the samples were analyzed by using a Micromeritics ASAP 2020 nitrogen adsorption apparatus (USA) at 77 K, whereas the physical activation was performed at 150 °C for 10 h before measurements. The specific surface area was obtained from the adsorption isotherm curve. Pore size distributions were calculated using the Barrett–Joyner–Halenda (BJH) method, for both the adsorption and desorption curves. The total volume was estimated from the adsorbed amount at a relative pressure P/P0 of 0.995.
Electrochemical characterization and tests
Galvanostatic charge–discharge (GCD), cyclic voltammetry (CV) and electrochemical impedance spectroscopy (EIS) tests of the samples were conducted using a CHI760E electrochemical workstation with an alkaline electrolyte (6 M KOH) in a three-electrode system. A platinum filament (CHI115) and saturated calomel electrode (SCE, CHI150) worked as the counter and reference electrodes, respectively. Then 70 wt% active materials, a 15 wt% polytetrafluoroethylene emulsion (PTFE, Aladdin) and 15 wt% supercarbon (Alfa Aesar) were mixed to prepare the working electrode. The mixture was then stirred and pressed onto nickel foam (1 cm2) under 10 MPa and dried at 70 °C for 12 h. The loaded mass of the active material was controlled at 3–4 mg cm−2. The specific capacitance of the electrode material was calculated using the formula:25,26
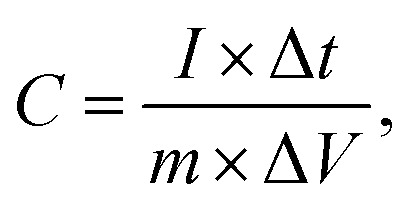 |
1 |
where I, ΔV, Δt, and m represent the discharge current (A), the voltage window (V), the discharge time (s) and the quantity of the active material (g), respectively.
Assembly and test of the asymmetric supercapacitor
The asymmetric supercapacitor was fabricated using Ni2Cr1-LDNs as the positive electrode, active carbon (AC, Kuraray) as the negative electrode, and cellulose paper as the separator in a 6 M KOH electrolyte. The preparation of the AC electrode was similar to that of the Ni2Cr1-LDN electrode. The energy density (E, W h kg−1) and power density (P, W kg−1) of Ni2Cr1-LDNs//AC were estimated according to the following equations:15,21
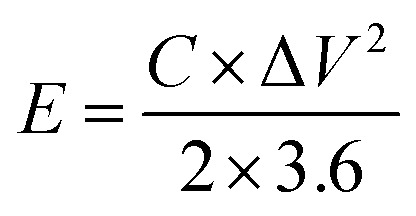 |
2 |
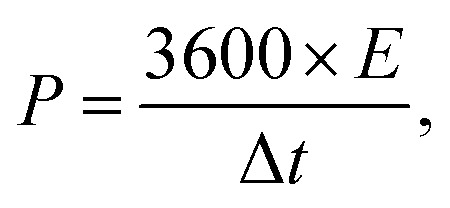 |
3 |
where ΔV, Δt and C represent the potential window (V), the discharge time (s) and the capacitance (F g−1), respectively.
Results and discussion
Structural and morphological characterization
The crystal structures of the five materials with different Ni2+/Cr3+ ratios were identified by powder X-ray diffraction. Fig. S1† shows a series of crystal planes (003), (006), (012) and (110) of the Ni2Cr1-LDN samples at 11°, 23°, and 35° that were indexed to the characteristic peaks of LDHs synthesized without ultrasonication (PDF#89-7111). In the one-step synthesis by ultrasonication coupled with mechanical stirring, the typical layers of LDHs were exfoliated into thin nanoflakes with lower intensity and broader peaks, as indicated by the XRD patterns.27–29
Fig. S2† presents the morphology differences between the Ni2Cr1-LDHs and Ni2Cr1-LDNs by SEM. After the ultrasonication treatment, brucite-like layers of Ni2Cr1-LDHs were exfoliated into fragments with thin nanoflakes. The structure with thin nanoflakes could facilitate the diffusion of electrolyte ions into internal active sites to provide significant capacitance. Moreover, the corresponding EDS mapping confirmed that the Ni and Cr elements were well dispersed in Ni2Cr1-LDNs (Fig. S3†), showing the effect of ultrasonication during co-precipitation.
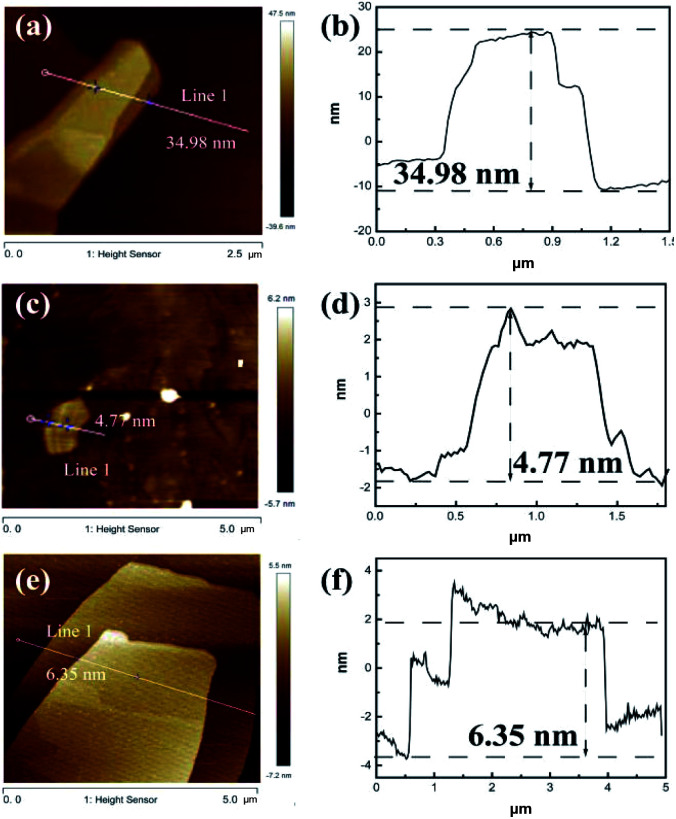
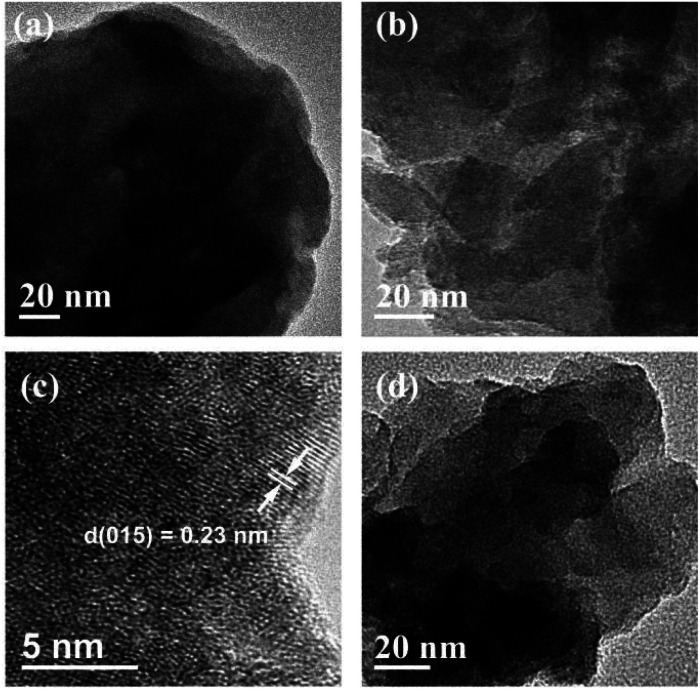
AFM is a technique used to directly measure the thickness, as shown in Fig. 2, S4 and S5.† A thickness of 4.77 nm for Ni2Cr1-LDN single layer was measured, while, in comparison, the Ni2Cr1-LDHs synthesized without ultrasonication had a thickness of 34.98 nm, confirming the important role of ultrasonication in producing nanoflakes. Different NiCr-LDN nanoflakes with various Ni2+/Cr3+ ratios were also synthesized under identical conditions. Ni1Cr1-LDNs (Fig. S5†) and Ni3Cr1-LDNs (Fig. 2e and f) had 16.61 nm and 6.35 nm thicknesses, respectively. A TEM study was further conducted to analyze the microstructure of the as-prepared samples. From Fig. 3, it is clear that bulk Ni2Cr1-LDHs had several stacked layers, while the Ni2Cr1-LDN nanoflakes were successfully synthesized with thin layers (Fig. 3b). Besides, a typical lattice spacing of 0.20 nm was indexed to the (107) plane of Ni2Cr1-LDNs (PDF#89-7111).30,31 By comparing Ni3Cr1-LDNs (Fig. 3d) with Ni1Cr1-LDNs (Fig. S6†), it was further confirmed that ultrasonication could efficiently peel off the bulk LDH structure and form nanoflakes. According to Table S1 and Fig. S7,† the specific surface areas of Ni1Cr1-LDNs, Ni1Cr1-LDNs and Ni1Cr1-LDNs were 62.5, 73.4, and 63.3 m2 g−1, respectively. The total pore volumes of Ni1Cr1-LDNs, Ni1Cr1-LDNs and Ni1Cr1-LDNs were 0.065, 0.073, and 0.068 cm3 g−1, respectively. The nanoflake structure provides a larger surface area and allows the flow of ions between laminates, which is favorable for energy storage.30,31
Fig. 2. AFM images and height profile of (a and b) Ni2Cr1-LDHs, (c and d) Ni2Cr1-LDNs, and (e and f) Ni3Cr1-LDNs.
Fig. 3. TEM images of (a) Ni2Cr1-LDHs, (b and c) Ni2Cr1-LDNs and (d) Ni3Cr1-LDNs.
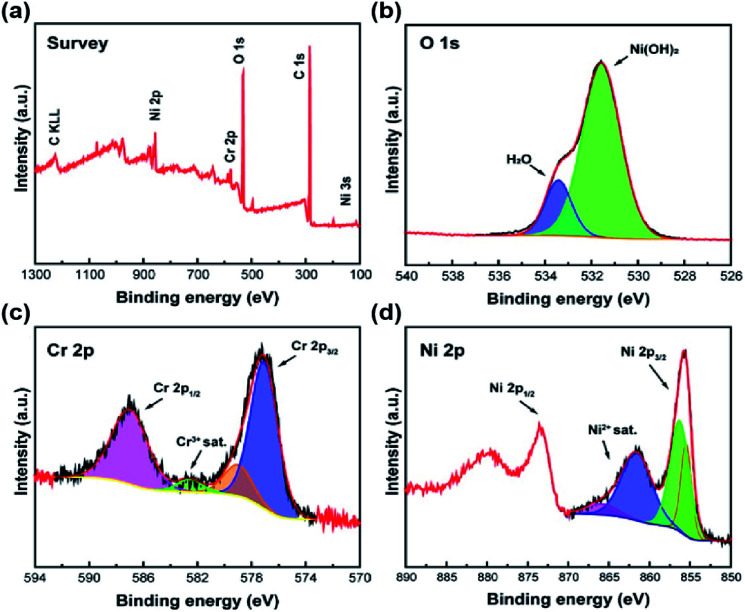
XPS was further conducted to analyze the chemical state and composition of Ni2Cr1-LDNs. Fig. 4a shows the survey scan of the Ni2Cr1-LDNs, in which Ni, Cr, O and C elements existed. Fig. 4b illustrates that the O element is mainly in the form of Ni(OH)2 (531.5 eV).32 The O 1s lattice oxides for Cr(OH)3 and Cr2O3 were not distinguished due to the overlap of Ni2+ and Cr3+.32 From the split spin–orbit peaks of Cr 2p in Fig. 4c, it was observed that Cr(OH)3 can be fitted with a single 2p3/2 peak at 577.0 eV, and a corresponding 2p1/2 peak located at 586.9 eV.33 A lower peak at 578.9 eV was attributed to the partial oxidation of Cr3+. Typical Ni 2p3/2 peaks for Ni(OH)2 were fitted with the main peak (855.5 eV) and the secondary peak (856.3 eV).32–35 A satellite peak for Ni 2p3/2 was obviously displayed at 861.6 eV (Fig. 4d).32
Fig. 4. XPS spectra of Ni2Cr1-LDNs: survey (a), and fitting spectra of O 1s (b), Cr 2p (c) and Ni 2p (d).
Electrochemical evaluation
The electrochemical properties of the samples were investigated through CV, GCD, and EIS. In order to study the capacitive performance of the NiCr-LDN electrodes, CV and GCD curves of the pure nickel foam electrode, Cr(OH)3 electrode, Ni(OH)2 electrode, and NiCr-LDN electrode are shown in Fig. S8a–c.† Obvious redox peaks were observed in the CV curves of the Ni(OH)2 electrode and the NiCr-LDN electrode. The equilibrium potential of the redox peaks was 0.3–0.4 V vs. SCE, which could be the faradaic redox reaction of Ni(OH)2 as follows:36,37
| Ni(OH)2 + OH− ↔ NiOOH + H2O + e−. | 4 |
The result indicates that Ni(OH)2 contributed most to the capacitance of the NiCr-LDN electrode, whereas pure nickel foam and Cr(OH)3 contributed very little. Furthermore, compared with the Ni(OH)2 electrode, the higher current density of the redox peaks of the NiCr-LDN electrode clearly demonstrates that interactions between Ni and Cr could improve the electrochemical performance. According to Fig. S8c,† the specific capacitance of the Ni2Cr1-LDN electrode was 1525 F g−1, which was higher than that of the Ni(OH)2 electrode (812 F g−1).
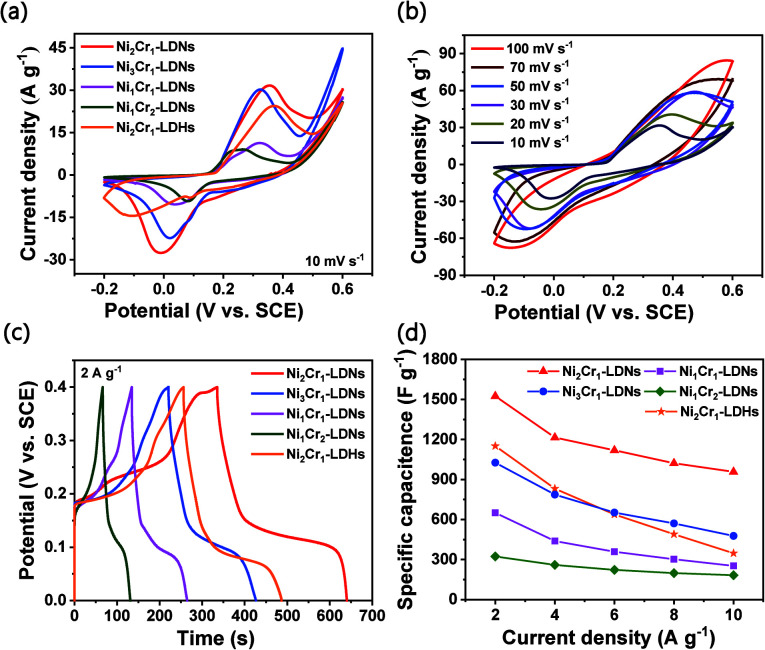
The CV curves of the Ni2Cr1-LDN, Ni3Cr1-LDN, Ni1Cr1-LDN, Ni1Cr2-LDN, and Ni2Cr1-LDH electrodes at 10 mV s−1 in the potential range of −0.2 to 0.6 V are compared in Fig. 5a. Notably, Ni2Cr1-LDNs exhibited much higher redox peaks than the other four samples, illustrating that Ni2Cr1-LDNs possess the highest specific capacitance. In addition, the reduction peak of Ni2Cr1-LDHs shifted to a lower potential due to the stacking of layers, which affects the transfer of ions and charge.38Fig. 5b displays the CV curves of Ni2Cr1-LDNs at various scan rates. The anodic peak shifted to a positive potential and the cathodic peak shifted to a negative potential as the scan rate increased because the Ni2Cr1-LDN electrode is quasi-reversible and polarizable. According to the CV curves, the apparent heterogeneous electron transfer rate constant (ks) was estimated using the formula:39,40
 |
5 |
where ΔEp is the peak potential separation, n represents the number of electrons transferred in the faradaic reaction, v represents the scan rate, and T, R, F, and a represent constants. The average ks value of the Ni2Cr1-LDN electrode was 0.595 cm s−1, which is higher than that of the Ni2Cr1-LDH electrode (0.307 cm s−1). These results indicated that exfoliation of the layered structure contributed to fast ion transfer.
Fig. 5. (a) CV curves of LDN and LDH electrodes at a scan rate of 10 mV s−1, (b) CV curves of Ni2Cr1-LDNs at various scan rates from 5 to 100 mV s−1, (c) GCD curves of LDNs and LDHs at a current density of 2 A g−1, and (d) specific capacitances of LDN and LDH electrodes at different current densities.
Fig. 5c gives the GCD curves of the Ni2Cr1-LDN, Ni3Cr1-LDN, Ni1Cr1-LDN, Ni1Cr2-LDN, and Ni2Cr1-LDH electrodes at 2 A g−1. The LDNs had the highest discharge time when the ratio of Ni2+ to Cr3+ was 2 : 1. Fig. S8d† shows the GCD curves of the Ni2Cr1-LDN electrode at various current densities. The GCD curve had flat discharge and charge platforms, and the charge time was basically the same as the discharge time, which suggests that the electrode had good coulombic efficiency and reaction reversibility.40Fig. 5d presents the calculated specific capacitances of the five electrodes at various discharge current densities. When the current density was set at 2 A g−1, the specific capacitances of the Ni2Cr1-LDN, Ni3Cr1-LDN, Ni1Cr1-LDN, and Ni1Cr2-LDN electrodes were 1525, 1027, 651, and 324 F g−1. When the current density was gradually increased to 10 A g−1, their specific capacitances diminished correspondingly to 957, 477, 253, and 183 F g−1, and the capacitance retentions reached up to 62.8%, 46.4%, 41.1%, and 56.5%, respectively. The specific capacitance of Ni2Cr1-LDHs only retained 29.0% (347.5 F g−1) at 10 A g−1versus 1198 F g−1 at 2 A g−1, showing the minimum performance rate among the five samples. This is because the accumulation of layers blocked the flow of ions, while the partial peeling of the laminates after ultrasonication facilitated the rapid flow of ions. When the current density increased and the transfer of ions and charge sped up, the influence of the stacked laminate structure of LDHs became more obvious.
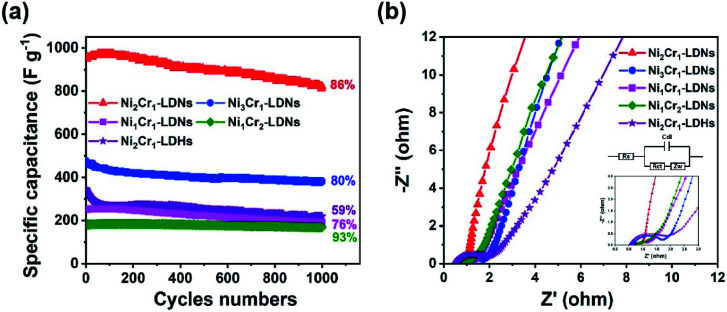
The cyclability of the five electrodes is displayed in Fig. 6a. The capacitance retentions of the Ni2Cr1-LDN, Ni3Cr1-LDN, Ni1Cr1-LDN, Ni1Cr2-LDN, and Ni2Cr1-LDH electrodes were 86%, 80%, 76%, 93%, and 59% after 1000 cycles, suggesting that the LDNs exfoliated by ultrasound had a higher cycling stability. EIS was introduced to study the resistance of the NiCr-LDN electrodes (Fig. 6b). The diameter of the semicircle in the high-frequency range reflects the charge transfer resistance (Rct). The Rct values of Ni2Cr1-LDNs, Ni1Cr2-LDNs, Ni1Cr1-LDNs, Ni3Cr1-LDNs and Ni2Cr1-LDHs were 0.26, 0.50, 0.64, 1.32, and 1.57 Ω, respectively, and the charge transfer resistance of Ni2Cr1-LDNs was the lowest. A low Rct was important for enhancing the electrical conductivity and excellent rate capability. This result was associated with the reduced thickness of the layers and the increased specific surface area, which could facilitate the diffusion of electrolyte ions and fast kinetics. As listed in Table 1, the electrochemical performance of Ni2Cr1-LDNs was comparable with or superior to that of LDH-based materials in the literature. Therefore, this material is a promising electrode material for high-performance supercapacitors.
Fig. 6. (a) Cycle stability of LDN and LDH electrodes at 10 A g−1, and (b) Nyquist plots of LDN and LDH electrodes.
Comparison of the electrochemical performance of LDH-based materials.
| Materials | Specific capacitance | Current density | Electrolyte | Ref. |
|---|---|---|---|---|
| GO/CoAl-LDHs | 825 F g−1 | 1 A g−1 | 6 M NaOH | 20 |
| CoAl-LDHs | 838 F g−1 | 1 A g−1 | 6 M KOH | 41 |
| NiMn-LDHs/C | 1634 F g−1 | 1 A g−1 | 6 M KOH | 42 |
| NiMn-LDHs | 1202 F g−1 | 5 A g−1 | 1 M KOH | 12 |
| NiCo-LDHs/GO | 1489 F g−1 | 1 A g−1 | 6 M KOH | 43 |
| NiCo2O4@NiFe-LDHs | 1160 F g−1 | 1 A g−1 | 2 M KOH | 44 |
| NiO/NiMn-LDHs | 937 F g−1 | 0.5 A g−1 | 3 M KOH | 14 |
| NiFe-LDHs | 1462.5 F g−1 | 5 A g−1 | 2 M KOH | 15 |
| CoAl-LDHs/rGO | 1492 F g−1 | 1 A g−1 | 6 M KOH | 22 |
| NiMn-LDHs | 733.8 F g−1 | 1 A g−1 | 1 M LiOH | 45 |
| NiMn-LDHs/Ni foam | 1511 F g−1 | 2.5 A g−1 | 1 M KOH | 46 |
| NiCoAl-LDHs | 1137 F g−1 | 0.5 A g−1 | 6 M KOH | 7 |
| NiCo-LDHs | 1410 F g−1 | 2 A g−1 | 6 M KOH | 47 |
| CoSx/Ni–Co LDHs | 1562 F g−1 | 1 A g−1 | 2 M KOH | 10 |
| Ni2Cr1-LDNs | 1525 F g−1 | 2 A g−1 | 6 M KOH | This work |
In general, the main reasons for the remarkable performance of the Ni2Cr1-LDNs could be attributed to the following features: first, the process of ultrasonication during co-precipitation resulted in the exfoliation of LDHs and the formation of nanoflakes.5 LDH nanoflakes had more active sites than the stacked LDHs, which facilitated rapid ion transport, leading to more efficient charging/discharging.25,26 Second, the Cr3+ ion had a special electronic configuration (t32ge0g).48,49 The introduction of Cr3+ into LDNs could promote electron capture and charge transfer.48–50 However, the Cr3+ ion itself did not take part in the faradaic redox reaction. When more Cr3+ ions were dropped into the LDNs, the capacitance performance decreased instead. Thus, a suitable Ni2+/Cr3+ ratio (2 : 1) was essential for achieving high capacitance.
Electrochemical characterization of the asymmetric supercapacitor
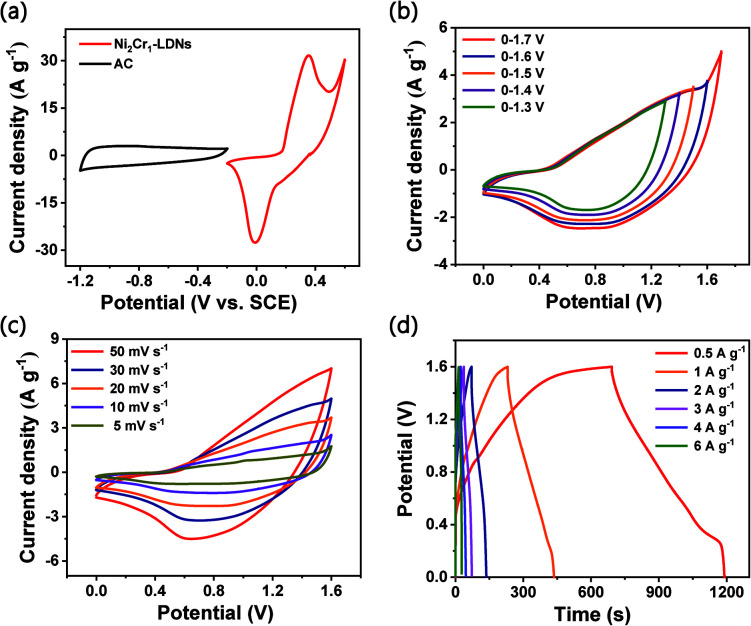
An asymmetric supercapacitor (ASC) device was assembled to demonstrate the practical applications of the Ni2Cr1-LDN electrodes. The device wass denoted as the Ni2Cr1-LDN//AC ASC. The related electrochemical characteristics of the AC electrode in a 6 M KOH electrolyte are shown in Fig. S9.†Fig. 7a exhibits the CV curves of the Ni2Cr1-LDN electrode and AC electrode at a scan rate of 10 mV s−1. Fig. 7b shows the CV curves of Ni2Cr1-LDN//AC ASC in different voltage windows. Polarization occurred when the operating potential was higher than 1.6 V. Therefore, 0–1.6 V was selected as the suitable operating potential window of the Ni2Cr1-LDN//AC ASC. Fig. 7c exhibits the CV curves of the Ni2Cr1-LDN//AC ASC at scan rates from 5 to 50 mV s−1. They presented strong redox peaks, indicating the pseudocapacitive behaviour of the ASC. Fig. 7d shows the GCD curves of the Ni2Cr1-LDN//AC ASC at various current densities with a voltage range from 0 to 1.6 V, which also revealed the pseudocapacitive behaviour. The specific capacitance of the Ni2Cr1-LDN//AC ASC reached 155 F g−1 at 0.5 A g−1, and 49.5 F g−1 was retained at 6 A g−1 with a capacitance retention of 31.9%.
Fig. 7. (a) CV curves of Ni2Cr1-LDNs and AC at a scan rate of 10 mV s−1, (b) CV curves of the ASC performed in different potential windows at 20 mV s−1, (c) CV curves at different scan rates from 5 to 50 mV s−1, and (d) GCD curves at different current densities.
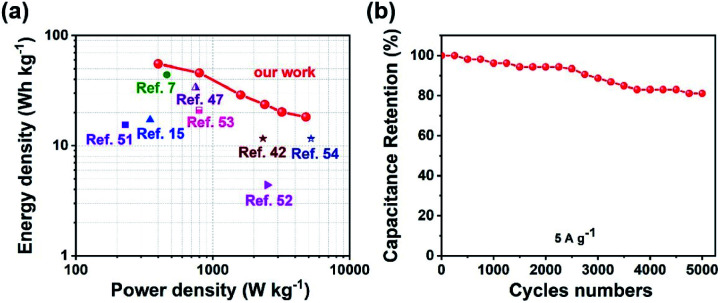
Fig. 8a shows the Ragone plots of the Ni2Cr1-LDN//AC ASC. The Ni2Cr1-LDN//AC ASC presented a maximum energy density of 55.33 W h kg−1 at 400 W kg−1. Besides, the energy density of the Ni2Cr1-LDN//AC ASC was maintained at 18.27 W h Kg−1, even at a power density of 4800 W kg−1. These values were comparable with or superior to those of most reported ASCs, such as NiFe LDHs/rGO/NF//MC (17.71 W h kg−1 at 348.49 W kg−1),15 NiAl-LDHs/rGO//AC (15.4 W h kg−1 at 230 W kg−1),51 CC@NiCo2Al-LDHs//CC@ZPC (44 W h kg−1 at 462 W kg−1),7 CoMn-LDHs//AC (4.4 W h kg−1 at 2500 W kg−1),52 NiCo-LDHs/graphene/nickel foam//AC (33.75 W h kg−1 at 750 W kg−1),47 NiMn-LDHs/PC//AC (11.65 W h kg−1 at 2330.16 W kg−1),42 NiAl-LDHs//AC (21 W h kg−1 at 800 W kg−1),53 and NiCo2O4//AC (11.6 W h kg−1 at 5220 W kg−1),54 shown in Fig. 8a. Moreover, the Ni2Cr1-LDN//AC ASC exhibited good cycling stability (Fig. 8b), with 81.1% of the capacitance retained, even after 5000 cycles.
Fig. 8. (a) Ragone plot related to the energy and power density of the ASC, (b) cycling performance of the ASC.
Conclusions
We have successfully synthesized thin NiCr-LDN nanoflakes for a supercapacitor with various Ni2+/Cr3+ ratios in one-step, efficient synthesis without hydrothermal treatment or extra exfoliation using organic solvents. These as-prepared LDH nanoflakes, with a 4–5 nm thickness, displayed increased contact area and enhanced capacitance and facilitated the diffusion of ions. The optimal Ni2Cr1-LDN (4.7 nm thickness) nanoflakes displayed an excellent specific capacitance of 1525 F g−1 at a current density of 2 A g−1, and a low charge transfer resistance of 0.26 Ω. Besides, the assembled Ni2Cr1-LDN//AC ASC delivered an outstanding energy density of 55.22 W h kg−1 at a power density of 400 W kg−1 and retained 81.1% of the original specific capacitance, even after 5000 cycles. This work provides a facile approach to efficiently synthesize LDH nanoflakes for energy storage.
Conflicts of interest
There are no conflicts to declare.
Supplementary Material
Acknowledgments
The authors acknowledged the financial supports from Key-Area Research and Development Program of Guangdong Province (2019B110209003), Guangdong Basic and Applied Basic Research Foundation (2019B1515120058, 2020A1515011149), National Key R&D Program of China (2018YFD0800700), National Ten Thousand Talent Plan, National Natural Science Foundation of China (21776324), the Fundamental Research Funds for the Central Universities (19lgzd25), and Hundred Talent Plan (201602) from Sun Yat-sen University.
Electronic supplementary information (ESI) available: XRD patterns of Ni3Cr1-LDNs, Ni2Cr1-LDNs, Ni1Cr1-LDNs, Ni1Cr2-LDNs and Ni2Cr1-LDHs; SEM images of the synthesized Ni2Cr1-LDHs and Ni2Cr1-LDNs; SEM image of the Ni2Cr1-LDNs and the corresponding EDS mapping images of O, Cr and Ni elements; AFM image and the corresponding height profile of Ni1Cr1-LDNs; transmission electron microscopy image of Ni1Cr1-LDNs; and N2 adsorption/desorption isotherms of Ni1Cr1-LDNs, Ni2Cr1-LDNs and Ni3Cr1-LDNs. CV curves of Ni2Cr1-LDNs and pure nickel foam, CV curves of Ni2Cr1-LDNs, Ni(OH)2 and Cr(OH)3, GCD curves of Ni2Cr1-LDNs, Ni(OH)2 and Cr(OH)3, GCD curves of Ni2Cr1-LDNs at various current densities from 2 to 10 A g−1, CV curves of AC at scan rates from 5 to 50 mV s−1, and GCD curves of AC at various current densities from 1 to 10 A g−1. See DOI: 10.1039/d0na00178c
References
- Wang Q. O'Hare D. Chem. Rev. 2012;112:4124–4155. doi: 10.1021/cr200434v. [DOI] [PubMed] [Google Scholar]
- Sideris P. J. Nielsen U. G. Gan Z. Grey C. P. Science. 2008;321:113–117. doi: 10.1126/science.1157581. [DOI] [PubMed] [Google Scholar]
- Fan G. L. Li F. Evans D. G. Duan X. Chem. Soc. Rev. 2014;43:7040–7066. doi: 10.1039/C4CS00160E. [DOI] [PubMed] [Google Scholar]
- Feng J. He Y. Liu Y. Du Y. Li D. Chem. Soc. Rev. 2015;44:5291–5319. doi: 10.1039/C5CS00268K. [DOI] [PubMed] [Google Scholar]
- Li R. Liu Y. Li H. Zhang M. Lu Y. Zhang L. Xiao J. Boehm F. Yan K. Small Methods. 2019;3:1800344. doi: 10.1002/smtd.201800344. [DOI] [Google Scholar]
- Yan K. Lafleur T. Chai J. Jarvis C. Electrochem. Commun. 2016;62:24–28. doi: 10.1016/j.elecom.2015.11.004. [DOI] [Google Scholar]
- Gao X. Liu X. Wu D. Qian B. Kou Z. Pan Z. Pang Y. Miao L. Wang J. Adv. Funct. Mater. 2019;29:1903879. doi: 10.1002/adfm.201903879. [DOI] [Google Scholar]
- Liu Y. Zhang M. Hu D. Li R. Hu K. Yan K. ACS Appl. Energy Mater. 2019;2:1162–1168. doi: 10.1021/acsaem.8b01717. [DOI] [Google Scholar]
- Chen H. Hu L. Chen M. Yan Y. Wu L. Adv. Funct. Mater. 2014;24:934–942. doi: 10.1002/adfm.201301747. [DOI] [Google Scholar]
- Guan X. Huang M. Yang L. Wang G. Guan X. Chem. Eng. J. 2019;372:151–162. doi: 10.1016/j.cej.2019.04.145. [DOI] [Google Scholar]
- Zhang M. He Y. Yan D. Xu H. Wang A. Chen Z. Wang S. Luo H. Yan K. Nanoscale. 2019;11:22255–22260. doi: 10.1039/C9NR07564J. [DOI] [PubMed] [Google Scholar]
- Wang X. Zhang J. Yang S. Yan H. Hong X. Dong W. Liu Y. Zhang B. Wen Z. Electrochim. Acta. 2019;295:1–6. doi: 10.1016/j.electacta.2018.10.021. [DOI] [Google Scholar]
- Wang W. Zhang N. Shi Z. Ye Z. Gao Q. Zhi M. Hong Z. Chem. Eng. J. 2018;338:55–61. doi: 10.1016/j.cej.2018.01.024. [DOI] [Google Scholar]
- Liu P. F. Zhou J. J. Li G. C. Wu M. K. Tao K. Yi F. Y. Zhao W. N. Han L. Dalton Trans. 2017;46:7388–7391. doi: 10.1039/C7DT00932A. [DOI] [PubMed] [Google Scholar]
- Li M. Jijie R. Barras A. Roussel P. Szunerits S. Boukherroub R. Electrochim. Acta. 2019;302:1–9. doi: 10.1016/j.electacta.2019.01.187. [DOI] [Google Scholar]
- Zhang H. Usman Tahir M. Yan X. Liu X. Su X. Zhang L. Chem. Eng. J. 2019;368:905–913. doi: 10.1016/j.cej.2019.03.041. [DOI] [Google Scholar]
- Zhang M. Liu Y. Liu B. Chen Z. Xu H. Yan K. ACS Catal. 2020;10:5179–5189. doi: 10.1021/acscatal.0c00007. [DOI] [Google Scholar]
- Yuan P. Zhang N. Zhang D. Liu T. Chen L. Liu X. Ma R. Qiu G. Chem. Commun. 2014;50:11188–11191. doi: 10.1039/C4CC05057F. [DOI] [PubMed] [Google Scholar]
- Song F. Hu X. Nat. Commun. 2014;5:4477. doi: 10.1038/ncomms5477. [DOI] [PubMed] [Google Scholar]
- Zhong Y. Liao Y. Gao A. Hao J. Shu D. Huang Y. Zhong J. He C. Zeng R. J. Alloys Compd. 2016;669:146–155. doi: 10.1016/j.jallcom.2016.01.251. [DOI] [Google Scholar]
- Du Q. Su L. Hou L. Sun G. Feng M. Yin X. Ma Z. Shao G. Gao W. J. Alloys Compd. 2018;740:1051–1059. doi: 10.1016/j.jallcom.2018.01.069. [DOI] [Google Scholar]
- Li J. Zhang P. Zhao X. Chen L. Shen J. Li M. Ji B. Song L. Wu Y. Liu D. J. Colloid Interface Sci. 2019;549:236–245. doi: 10.1016/j.jcis.2019.04.062. [DOI] [PubMed] [Google Scholar]
- Wang Y. Xie C. Zhang Z. Liu D. Chen R. Wang S. Adv. Funct. Mater. 2018;28:1703363. doi: 10.1002/adfm.201703363. [DOI] [Google Scholar]
- Yi Z. Ye C. Zhang M. Lu Y. Liu Y. Zhang L. Yan K. Appl. Surf. Sci. 2019;480:256–261. doi: 10.1016/j.apsusc.2019.02.227. [DOI] [Google Scholar]
- Chen D. Yan S. Chen H. Yao L. Wei W. Lin H. Han S. Electrochim. Acta. 2018;292:374–382. doi: 10.1016/j.electacta.2018.07.042. [DOI] [Google Scholar]
- Jagadale A. D. Guan G. Li X. Du X. Ma X. Hao X. Abudula A. Chem. Eng. J. 2018;336:562–569. doi: 10.1016/j.cej.2017.12.055. [DOI] [Google Scholar]
- Debecker D. P. Gaigneaux E. M. Busca G. Chem.–Eur. J. 2009;15:3920–3935. doi: 10.1002/chem.200900060. [DOI] [PubMed] [Google Scholar]
- Hunter B. M. Hieringer W. Winkler J. R. Gray H. B. Müller A. M. Energy Environ. Sci. 2016;9(5):1734–1743. doi: 10.1039/C6EE00377J. [DOI] [Google Scholar]
- Liu X. Y. Gao Y. Q. Yang G. W. Nanoscale. 2016;8(7):4227–4235. doi: 10.1039/C5NR09145D. [DOI] [PubMed] [Google Scholar]
- Tao Y. Zaijun L. Ruiyi L. Qi N. Hui K. Yulian N. Junkang L. J. Mater. Chem. 2012;22:23587–23592. doi: 10.1039/C2JM35263J. [DOI] [Google Scholar]
- Cai Z. Zhou D. Wang M. Bak S. Wu Y. Wu Z. Tian Y. Xiong X. Li Y. Liu W. Siahrostami S. Kuang Y. Yang X. Q. Duan H. Feng Z. Wang H. Sun X. Angew. Chem., Int. Ed. 2018;57:9392–9396. doi: 10.1002/anie.201804881. [DOI] [PubMed] [Google Scholar]
- Ali-Löytty H. Louie M. W. Singh M. R. Li L. Sanchez Casalongue H. G. Ogasawara H. Crumlin E. J. Liu Z. Bell A. T. Nilsson A. Friebel D. J. Phys. Chem. C. 2016;120:2247–2253. doi: 10.1021/acs.jpcc.5b10931. [DOI] [Google Scholar]
- Biesinger M. C. Payne B. P. Grosvenor A. Lau L. W. M. Gerson A. Smart R. S. C. Appl. Surf. Sci. 2011;257:2717–2730. doi: 10.1016/j.apsusc.2010.10.051. [DOI] [Google Scholar]
- Biesinger M. C. Payne B. P. Lau L. W. M. Gerson A. Smart R. S. C. Surf. Interface Anal. 2009;41:324–332. doi: 10.1002/sia.3026. [DOI] [Google Scholar]
- Chen S. Huang Y. Han X. Wu Z. Lai C. Wang J. Deng Q. Zeng Z. Deng S. Chem. Eng. J. 2018;352:306–315. doi: 10.1016/j.cej.2018.07.012. [DOI] [Google Scholar]
- Guo Y. Hong X. Wang Y. Li Q. Meng J. Dai R. Liu X. He L. Mai L. Adv. Funct. Mater. 2019;29:1809004. doi: 10.1002/adfm.201809004. [DOI] [Google Scholar]
- Yan A. L. Wang X. C. Cheng J. P. Nanomaterials. 2018;8:747. doi: 10.3390/nano8100747. [DOI] [PMC free article] [PubMed] [Google Scholar]
- Ma W. Ma R. Wu J. Sun P. Liu X. Zhou K. Sasaki T. Nanoscale. 2016;8:10425–10432. doi: 10.1039/C6NR00988C. [DOI] [PubMed] [Google Scholar]
- Laviron E. J. Electroanal. Chem. Interfacial Electrochem. 1979;101:19–28. doi: 10.1016/S0022-0728(79)80075-3. [DOI] [Google Scholar]
- Tao Y. Ruiyi L. Lin Z. Chenyang M. Zaijun L. Electrochim. Acta. 2015;176:1153–1164. doi: 10.1016/j.electacta.2015.07.160. [DOI] [Google Scholar]
- Zai J. Liu Y. Li X. Ma Z. F. Qi R. Qian X. Nano-Micro Lett. 2017;9:21. doi: 10.1007/s40820-016-0121-5. [DOI] [PMC free article] [PubMed] [Google Scholar]
- Yu M. Liu R. Liu J. Li S. Ma Y. Small. 2017;13:1702616. doi: 10.1002/smll.201702616. [DOI] [PubMed] [Google Scholar]
- Yang J. Yu C. Hu C. Wang M. Li S. Huang H. Bustillo K. Han X. Zhao C. Guo W. Zeng Z. Zheng H. Qiu J. Adv. Funct. Mater. 2018;28:1803272. doi: 10.1002/adfm.201803272. [DOI] [Google Scholar]
- Luo G. Teh K. S. Xia Y. Li Z. Luo Y. Zhao L. Jiang Z. J. Alloys Compd. 2018;767:1126–1132. doi: 10.1016/j.jallcom.2018.07.188. [DOI] [Google Scholar]
- Guo X. L. Zhang J. M. Xu W. N. Hu C. G. Sun L. Zhang Y. X. J. Mater. Chem. A. 2017;5:20579–20587. doi: 10.1039/C7TA04382A. [DOI] [Google Scholar]
- Guo X. L. Liu X. Y. Hao X. D. Zhu S. J. Dong F. Wen Z. Q. Zhang Y. X. Electrochim. Acta. 2016;194:179–186. doi: 10.1016/j.electacta.2016.02.080. [DOI] [Google Scholar]
- Bai Y. Wang W. Wang R. Sun J. Gao L. J. Mater. Chem. A. 2015;3:12530–12538. doi: 10.1039/C5TA01804H. [DOI] [Google Scholar]
- Yan K. Liu Y. Lu Y. Chai J. Sun L. Catal. Sci. Technol. 2017;7:1622–1645. doi: 10.1039/C7CY00274B. [DOI] [Google Scholar]
- Yan K. Chen A. Energy. 2013;58:357–363. doi: 10.1016/j.energy.2013.05.035. [DOI] [Google Scholar]
- Yang Y. Dang L. Shearer M. J. Sheng H. Li W. Chen J. Xiao P. Zhang Y. Hamers R. J. Jin S. Adv. Energy Mater. 2018;8:1703189. doi: 10.1002/aenm.201703189. [DOI] [Google Scholar]
- Ge X. Gu C. Yin Z. Wang X. Tu J. Li J. Nano Energy. 2016;20:185–193. doi: 10.1016/j.nanoen.2015.12.020. [DOI] [Google Scholar]
- Jagadale A. D. Guan G. Li X. Du X. Ma X. Hao X. Abudula A. J. Power Sources. 2016;306:526–534. doi: 10.1016/j.jpowsour.2015.12.097. [DOI] [Google Scholar]
- Zhang L. Yao H. Li Z. Sun P. Liu F. Dong C. Wang J. Li Z. Wu M. Zhang C. Zhao B. J. Alloys Compd. 2017;711:31–41. doi: 10.1016/j.jallcom.2017.03.348. [DOI] [Google Scholar]
- Li X. Jiang L. Zhou C. Liu J. Zeng H. NPG Asia Mater. 2015;7:e165. doi: 10.1038/am.2015.11. [DOI] [Google Scholar]
Associated Data
This section collects any data citations, data availability statements, or supplementary materials included in this article.


