Abstract
Macrophages can be polarized to M1 or M2 type with pro-inflammatory or anti-inflammatory properties. Nanoparticles have recently been found to be a promising platform to polarize macrophages to desired phenotypes. This article explores the usage of cell membrane-derived nanoparticles (nanoghosts) for reprogramming macrophages. The efficacy and efficiency of this technology are examined via cytokine analysis and immunostaining of the nanoghost-treated cells. We find that several cytokines/chemokines are highly expressed on nanoghosts. In addition, a 2D wound healing model is deployed to reveal their potential application in clinical settings.
This study reports the synthesis of nanoghosts for reprogramming M0 macrophages to the M2 type. They are non-toxic, execute reprogramming through surface-bound cytokines/chemokines, and could help the wound healing process by stimulating M2 conversion.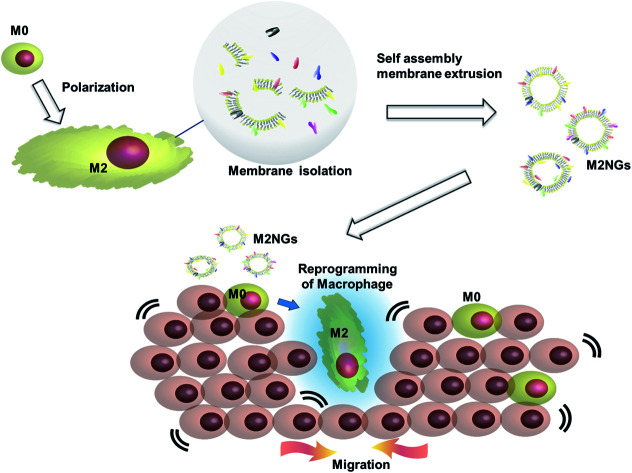
Introduction
Macrophages are key players in tissue homeostasis and are involved in major diseases such as infection, cancer, neurodegenerative diseases, and wound healing.1 They are mainly deemed either pro-inflammatory (M1 type) or anti-inflammatory (M2 type).2 M1 macrophages are characterized by the release of inflammatory cytokines such as IL-6, IL-1β, and tumor necrosis factor alpha (TNF-α) and the expression of proteins like CD11b+, CD 38, and iNOS, while M2 macrophages are characterized by IL-10, IL-4, CD206, and Arg-1 (ref. 3 and 4). The anti-inflammatory M2 macrophages promote wound healing and angiogenesis, while the M1 macrophages can kill tumor cells via nitric oxide (NO) and TNF-α.5,6
Currently the activation or reprogramming of macrophages is mainly done through the addition of exogenous macrophages or through the delivery of key factors such as cytokines (IL-4, IL-10, and IL-13), chemokines (CXCL5, CXCL9, CXCL10, CCL2, CCL17, CCL22, and CCL24) and other molecules (TGF-beta, LPS, and galectin-9).7 However, the direct introduction of exogenous cells might result in immune imbalance, causing excessive healing/killing, and growth factors are limited by their short half-life. To overcome these limitations, new strategies based on nanoparticles are emerging.8
The capability of nanoparticles to reprogram macrophages comes from their unique physicochemical properties (e.g. size, surface charge, chemical composition, and surface coating),9 which trigger various polarization pathways.10 For example, in the presence of LPS/IFN-γ and IL-4/IL-13, the uptake of pristine nanocellulose enhanced the expression of M1 phenotype markers (e.g. CXCL9, IL-6, IL-1β, TNF-α and NOS2) and the secretion of pro-inflammatory cytokines and chemokines, while decreasing M2 markers (Ear11 and CD206).11 Graphite nanofibers were found to induce high secretion of TNF-α and IL-1β in macrophage-like THP-1 cells.12
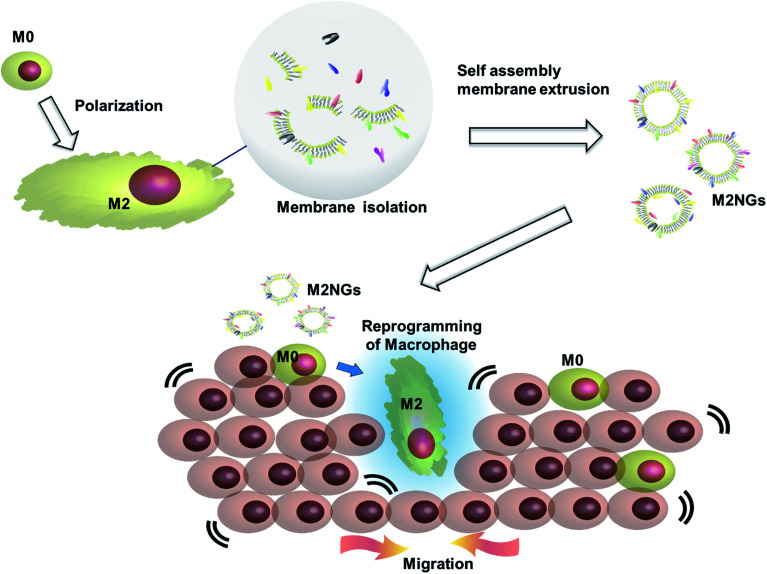
Cell membrane derived vesicles (nanoghosts) are a new class of nanoparticles with good biocompatibility and low cytotoxicity.13 Their sizes are controllable during the synthesis by manipulating the reassembly process of the disrupted cell membrane.13–15 The potential of this platform has been demonstrated in the fields of drug delivery,16 cancer therapy,17 and vaccination.18 This study explores the potential usage of nanoghosts for reprogramming macrophages, so we can broaden the tool box. As a proof-of-concept, we synthesized nanoghosts from the M2 macrophage cell membrane (M2NGs). Their capability for macrophage polarization was evaluated in cell experiments via cytokine analysis and immunostaining of reprogrammed cells (Fig. 1). This study reports the synthesis of nanoghosts from the M2 polarized macrophage membrane for reprogramming M0 macrophages toward the M2 type. We discover that these particles are non-toxic to mammalian cells and their reprogramming capability comes from the cytokines/chemokines that are associated with the membrane of nanoghosts. They can potentially help the wound healing process by stimulating the M2 conversion. In addition, a 2D wound healing model is used to reveal the potential application of M2NGs in clinical settings.
Fig. 1. Illustration of the synthesis of macrophage cell membrane-derived nanoghosts for macrophage reprogramming and their application; M0 macrophages are polarized by a conventional method before the cell membrane is extruded and isolated. M2NGs are prepared via self-assembly of the M2 polarized macrophage membrane. These M2NGs, carrying cytokines and chemokines, are able to reprogram M0 toward M2 macrophages, which could promote cell migration and proliferation in wound healing.
Materials and methods
Materials
Biolegend (USA) provided INF-γ, LPS, IL-4, IL-10, anti-mouse IL-4 antibodies, anti-mouse iNOS antibodies, anti-mouse CD206 antibodies, anti-mouse CD38 antibodies, anti-mouse iNOS antibodies, and the assay kits (IL-10, IL-4, TNF-α, and IL-6 ELISA). A western blotting kit, RNase inhibitor, and Mix-n-Stain™ protein labeling kit were purchased from Sigma-Aldrich (Singapore). A mouse multiplex kit was purchased from Bio-Rad (Singapore). Other agents unless specifically mentioned were purchased from Thermo Fisher Scientific (Singapore).
Cell culture
Raw 264.7 cells (ATCC® TIB-71™), J744A1 cells (ATCC 27294), human mesenchymal stem cells (hMSCs) and Normal Human Dermal Fibroblasts (NDFs) were purchased from CellResearch Corp (Singapore). Mouse fibroblasts were purchased from ATCC (NIH-3T3, ATCC® CRL-1658™). The cell culture medium consisted of Dulbecco's Modified Eagle's Medium (DMEM, low glucose DMEM for hMSCs) supplemented with 1% penicillin/streptomycin and 10% fetal bovine serum.
Macrophage polarization
Both J744A1 and Raw 264.7 cells were polarized using the same protocol. Briefly, cells at a concentration of 5 × 10⁵ cells per mL were seeded in a T-75 flask and treated with 400 ng mL−1 LPS and 20 ng mL−1 INF-γ for M1 polarization, and 40 ng mL−1 IL-4 and IL-10 for M2 polarization. The whole process took 4 days, in which there was no medium replacement.
Fluorescence-activated cell sorting (FACS) analysis
Cells were fixed with 1% paraformaldehyde (PFA) and washed three times with FACS buffer. Next, the fixed cells were blocked with 5% BSA for 1 hour before being labeled with 1 : 500 diluted antibodies (PE-anti-iNOS, FITC-anti-CD38, PE-anti-Arg-1, and FITC-anti-CD206) at 4 °C overnight. Later, the cells were resuspended in FACS buffer and examined with a BD FACSCanto II or BD LSRII Flow Cytometer.
Western blotting
Cells were homogenized in radioimmunoprecipitation assay (RIPA) buffer with 20 μg mL−1 protease inhibitors. After centrifugation, the supernatant was collected, and the amount of total protein was determined by bicinchoninic acid assay (BCA assay). Later, protein was denatured at 95 °C for 5 minutes, resolved by 12% SDS-PAGE, and transferred onto a nitrocellulose membrane for 1 hour at 100 V. The membrane was blocked in 5% skimmed milk for 1 hour, and incubated with primary antibodies overnight and HRP-conjugated secondary antibodies (1 : 5000) for 4 hours at 4 °C. The imaging was done on a Bio-Rad Image Lab system. Glyceraldehyde 3-phosphate dehydrogenase (GAPDH) acted as the reference, and densitometric analysis was done using ImageJ software.
Confocal imaging
Macrophages were identified as either M1 or M2 polarization by expressing CD38 and iNOS for M1, and CD206 and Arg-1 for M2. After 4 days of stimulant treatment, the cells were washed with PBS, fixed with 4% PFA, and permeated with 1% triton X-100. Then, the cells were blocked with 5% BSA for 1 hour before being labeled with antibodies (1 : 500 dilution) for 16 hours. Finally, 1 mL of 3 nM DAPI working solution (4′,6-diamidino-2-phenylindole) was added to stain the nuclei of cells. Confocal imaging was carried on a Carl Zeiss LSM 710 laser-scanning microscope (Germany).
Synthesis of nanoghosts
Macrophages (1 × 10⁷ cells) were harvested with a scraper and washed twice with ice-cold Tris-magnesium buffer (TM buffer, 0.01 M Tris, 0.001 M MgCl2, pH 7.4). The cells were re-suspended in 10 mL of TM buffer for 5 minutes at 4 °C and then homogenized (IKA T10 basic homogenizer) by mild sonication for 30 seconds (VCX 130). The contents were centrifuged at 4000 rpm for 5 minutes at 4 °C. And the supernatant was then collected and centrifuged at 12 800 rpm for 35 minutes at 4 °C. The subsequent supernatant was collected again and ultra-centrifuged at 450 000g (60 000 rpm, Beckman, sw-60ti) for 60 minutes at 4 °C. The pellet was stored in 1 mL of PBS. Then, the suspension was extruded through 0.1 μm polycarbonate membranes using a mini extruder at 37 °C (Avanti polar Lipids, Inc, USA). Finally, the protein concentration in the solution was quantified by the BCA method.
Characterization of nanoghosts
The hydrodynamic diameter and zeta potential of nanoghosts were analyzed with a dynamic light-scattering system (Zetasizer, Malvern).
Cytotoxicity and proliferation assays
Cells at a concentration of 5 × 10⁴ cells per mL were incubated with different concentrations of nanoghosts (0, 0.02, 0.1, 0.3, 1, 5, and 20 μg protein per mL) for 24 hours. Next, 100 μL of 1 : 20 diluted CCK-8 solution (CCK-8: DMEM, v/v) was added to each well and incubated for 4 hours. The number of live and dead cells was spectrophotometrically analyzed at 450 nm by using a Cell Counting Kit-8/Cell Proliferation kit (CCK-8).
Scratch assay
The experiment was performed in a transwell plate (0.4 μm pore size, Thermo Fisher Scientific). Raw 264.7 cells at a concentration of 5 × 10⁵ cells per mL were seeded in the upper compartment. NIH-3T3 or NDFs at a concentration of 1 × 10⁵ cells per mL were seeded in the lower compartment. 24 hours later, nanoghosts at a final protein concentration of 5 μg mL−1 were added to the upper compartment. After another 24 hours, the medium was replaced with fresh one. Next, scratch was done on the lower compartment with 200 μL pipette yellow tips. Cell migration was recorded with a phase contrast microscopy (×4) at time points hour 0, 12, and 24.
Quantification of cytokines was done through an enzyme-linked immunosorbent assay (ELISA) and cytokine multiplex assay. The ELISA assay was done according to the protocol from the manufacturer. Each assay used 100 μL of sample at a protein concentration of 50 μg mL−1. The cytokine multiplex assay was done according to the kit protocols as well (Bio-Rad, Singapore). The concentration of each sample was diluted with PBS buffer to a final protein concentration of 50 μg mL−1. The concentration of cytokines in samples was marked as NA, low, middle, and high (SD: standard deviation, NA: not applicable; low = measured mean value of the lowest concentration sample; middle = measured mean value of the sample > mean value of the lowest concentration sample + (5 × SD); high = measured mean value of the sample > mean value of the lowest concentration sample + (10 × SD)).
Quantification of CD38 and CE206 was done through ELISA. Briefly, purified nanoghosts (100 μL of each sample at a protein concentration of 50 μg mL−1) were applied in a 96-well plate for 16 hours at 4 °C, followed by washing and blocking. Next, 1 : 500 diluted antibodies (FITC-anti-CD38 and FITC-anti-CD206) were added to the plate and measured at 520 nm.
Statistical analysis
GraphPad Prism software was used for statistical analysis and graphical representation of data. Student's t-tests were performed to evaluate the significance. Non-significant values are shown as “ns” in the Results section, while *, **, ***, and **** describe p-values <0.05, <0.01, <0.001, and <0.0001, respectively.
Results
Polarization of macrophages with stimulants and synthesis of nanoghosts
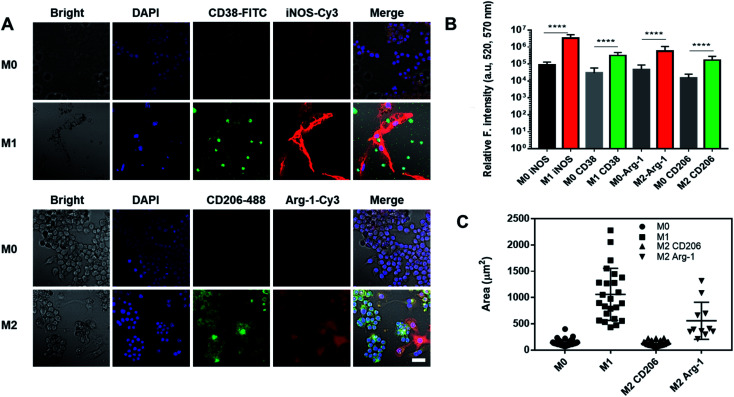
Nanoghosts were made from two kinds of macrophages, mouse Raw 264.7 (Fig. 2) and J744A1 (ESI Fig. 1†). This is to ensure that the protocol can be extended to different cell lines. The M0 macrophages were polarized to M1 and M2 types with LPS/INF-γ and IL-4/IL-10, respectively. M1 Raw 264.7 macrophages expressed significantly higher iNOS and CD38 than M0, while M2 Raw 264.7 macrophages expressed significantly higher Arg-1 and CD206 (Fig. 2A and B). In addition, M1 macrophages were bigger in size up to 2000 μm2 per cell (25-fold) than M0 and M2 macrophages (Fig. 2A and C). Particularly, a morphological change was observed in Arg-1 positive M2 macrophages compared to CD206 positive M2 cells, which showed a more than 4-fold increase in size compared to M0 (Fig. 2C). Similar changes were observed in J744A1 macrophages. Polarized J744A1 macrophages expressed significantly higher iNOS and CD38 for the M1 type, and higher Arg-1 and CD206 for the M2 phenotype (ESI Fig. 1B and C†). However, there was no morphological difference in different phenotypes of J744A1 macrophages (ESI Fig. 1A†). We also confirmed M1 and M2 polarization of J744A1 macrophages by FACS analysis (ESI Fig. 1D, E, 4C and D†).
Fig. 2. Characterization of polarized Raw 264.7 macrophages. (A) Immunofluorescence staining of M1 and M2 macrophages. Cells were stained with anti-CD38 antibodies (green) and anti-iNOS antibodies (red) for M1, anti-CD206 antibodies (green) and anti-Arg-1 antibodies (red) for M2. Scale bar is 20 μm. (B) Quantification of iNOS and CD38 expression on M1 macrophages, and Arg-1 and CD206 expression on M2 macrophages (****P < 0.0001). (C) Quantification of the size of M1 and M2 macrophages by ImageJ (n = 17).
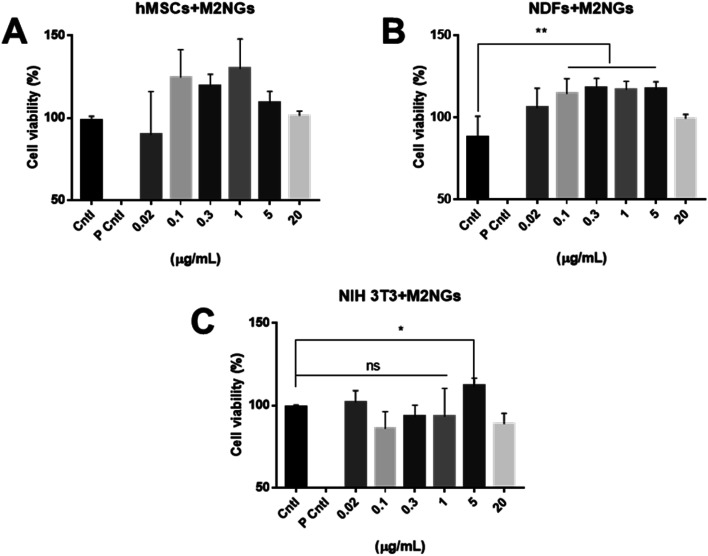
Nanoghosts were synthesized through the self-assembly of the purified cell membrane. And their sizes (ESI Fig. 2A†) were controlled to be around 100 nm through the extrusion step (polycarbonate membrane with 0.1 μm pores was used). Nanoghosts synthesized from M1 and M2 macrophages showed different expression of CD38 and CD206, which was confirmed through ELISA. CD38's expression was higher in M1NGs than in M2NGs while CD206's level was higher on M2NGs (ESI Fig. 2C†). Regardless of the origin, all nanoghosts had similar zeta potentials (∼−7 mV, ESI Fig. 2B†). The cytotoxicity of nanoghosts was examined with three different types of cells (i.e. hMSCs, NDFs, and NIH-3T3). As shown in Fig. 3, there was a noticeable change in cell viability when the concentration of M2NGs was between 0.02 and 20 μg mL−1 (protein concentration). Additionally, to maximize the reprogramming efficiency, we chose the optimized concentration of nanoghosts at 5 μg mL−1. M2NGs seem to promote cell proliferation compared to M0NGs and M1NGs in the range from 0.1 to 5 μg mL−1. Particularly, proliferation of mouse-fibroblast cells (NIH-3T3) was increased by 5 μg mL−1 M2NGs (Fig. 3B and C). We expected that this phenomenon was due to high levels of cytokines, chemokines, and protein on M2NGs.19 We also examined the cytotoxicity of M0NGs and M1NGs at a protein concentration of 20 μg mL−1 (ESI Fig. 3†). No cytotoxic effect was observed.
Fig. 3. Cytotoxicity of nanoghosts derived from M2 Raw 264.7 macrophages. Viability of (A) hMSCs, (B) NDFs, and (C) NIH-3T3 cells treated with different concentrations of nanoghosts (Cntl = control without any treatment, P Cntl = positive control with 1% triton-x treatment).
Macrophage reprogramming with nanoghosts
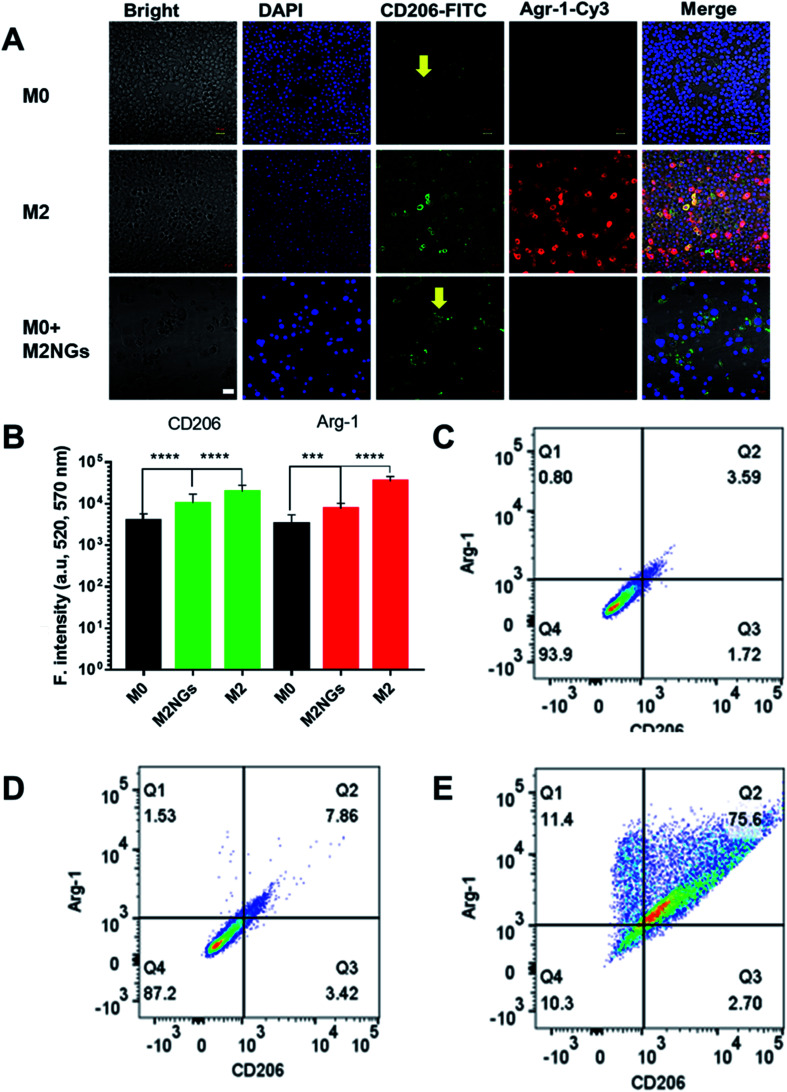
The polarization using nanoghosts was done with a similar protocol to the conventional method (i.e. IL-4/IL-10). After 4 days of stimulation, M0 macrophages were successfully polarized to the M2 phenotype (Fig. 4A). Although relatively lower than those for the positive control (M2), the expressions of CD206 and Arg-1 on M2NG treated cells were 3-fold and 2-fold higher than those of the negative control, respectively (M0, Fig. 4B). FACS analysis further confirmed the enhanced expression of CD206 in both positive control and M2NG treated cells (Fig. 4C–E). Similar to Raw 264.7, J774A1 derived M2NGs could also polarize M0-type J774A1 macrophages (ESI Fig. 4A and B†).
Fig. 4. Raw 264.7 macrophage polarization with nanoghosts: (A) immunofluorescence staining of macrophages with anti-CD206 antibodies (green) and anti-Arg-1 antibodies (red). The arrows indicate reprogrammed macrophages. Scale bar is 20 μm. (B) Quantification of fluorescence signals related to Arg-1 and CD206 expression on macrophages in A (***P < 0.001, ****P < 0.0001). FACS analysis of CD206 positive ones in (C) M0 macrophages, (D) M2 macrophages polarized with the conventional method, and (E) M2 macrophages programmed by M2NGs.
Analysis of cytokines on nanoghosts
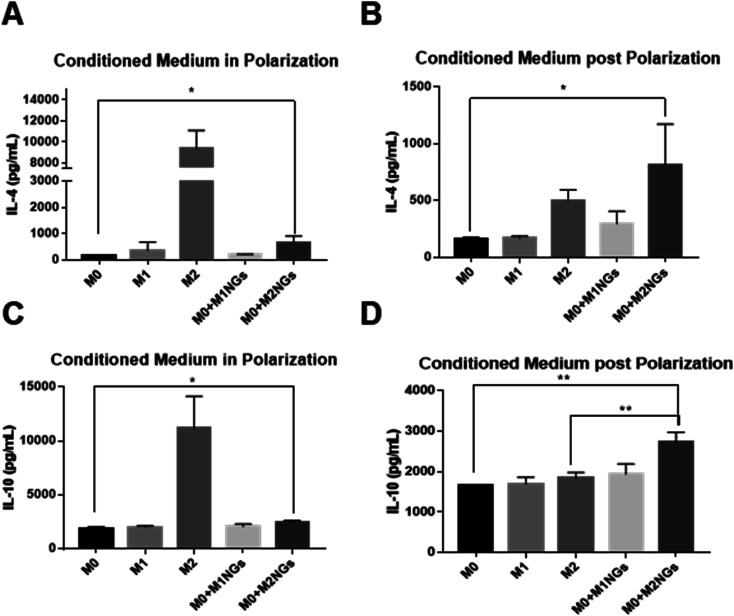
We quantified IL-4 and IL-10 in conditioned media (culture media) using ELISA as they are the indicators of the M2 phenotype.4 During the M2 polarization stage, conditioned media from M2 macrophages and M0 macrophage-treated with M2NGs (M0 + M2NGs) showed higher concentrations of IL-4 and IL-10 (Fig. 5A and C). There was sustained release of IL-4 and IL-10 from M2 and M0 macrophages treated with M2NGs (M0 + M2NGs) post polarization (Fig. 5B and D). This confirmed that the M0 macrophages were successfully polarized to the M2 phenotype by M2NGs. On the other hand, there was no difference in IL-6 release before and after treatment with nanoghosts while the expression of TNF-α was improved (10% increase) in M0 macrophages that were treated with MNGs (M0 + M1NGs and M2NGs) post polarization (ESI Fig. 5†).
Fig. 5. ELISA analysis of cytokines (IL-4 and IL-10) in the conditioned media from M0, M1, M2 macrophages and M0 macrophages treated with M1NGs and M2NGs (A and C) at the 4th day of polarization. Conditioned media post polarization at day 2 post the medium replacement (B and D) (ns = not significant, *P < 0.05, and **P < 0.01).
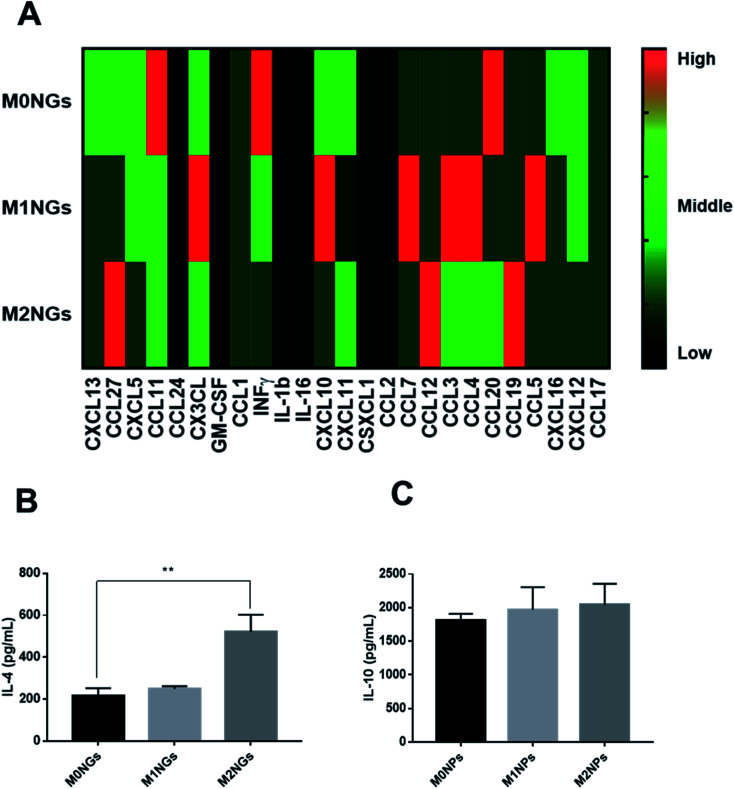
Multiplex assays were further used to provide a thorough analysis of cytokines/chemokines in nanoghosts (Fig. 6A). There were higher expressions of CCL12, CCL19, and CCL27 on M2NGs than those on M0NGs and M1NGs. CCL12 is responsible for the recruitment of fibroblasts.20 CCL19 facilitates macrophage participation in lymphangiogenesis,21 while CXCL12 is involved in angiogenesis.22 CCL27 accelerates skin regeneration by accumulating bone marrow-derived keratinocytes.23 Combined with IL-4 and IL-10 (Fig. 6B and C), there were 6 cytokines that showed higher concentrations in M2NGs than in M0NPs and M1NGs. They are all responsible for cell migration and proliferation.
Fig. 6. (A) Multiplex assay of cytokines on nanoghosts (final protein concentration of 50 μg mL−1 in nanoghosts). Heat map scale: black = N/A, dark green = low, green = middle, red = high. ELISA analysis of (B) IL-4 and (C) IL-10 on nanoghosts (ns = not significant, *P < 0.05, and **P < 0.01).
Reprogramming macrophages with nanoghosts in a wound healing model
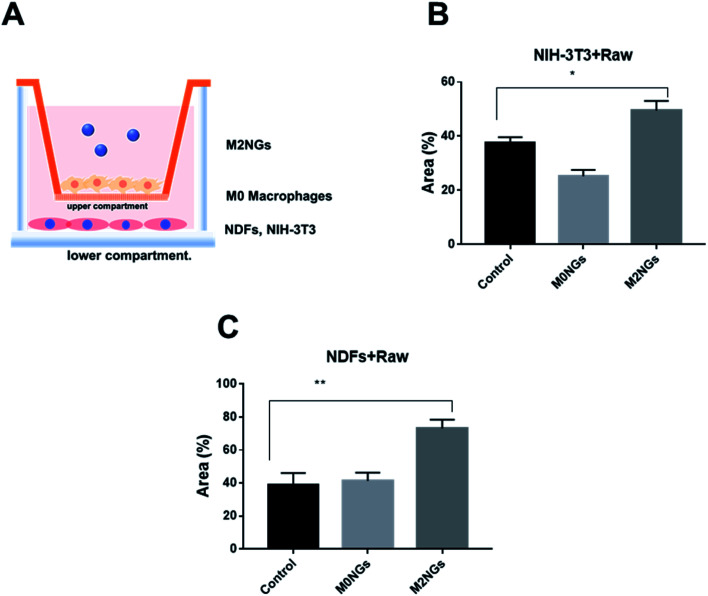
Macrophages play critical roles in the wound healing process.24 Reprograming macrophages to the M2 phenotype has been suggested to help the inflammatory phase and promote wound repair.25 Here we utilized the scratch assay to evaluate the potential roles of M2NGs to program macrophages in the wound healing process. Briefly, NDFs or NIH-3T3 cells were placed on the lower compartment of a transwell and M0 macrophages were seeded on the upper compartment (Fig. 7A). The scratch was carried on the NDFs or the NIH-3T3 monolayer before M2NGs were added to the upper compartment. In general, M2NG treated samples healed faster than the untreated and M0NG-treated ones for both NDFs and NIH-3T3. In the case of NIH-3T3 samples (ESI Fig. 6A and 7B†), 50% wound area was recovered in 24 hours compared to the control group (37%) and M0NP-treated one (25%). For the NDF samples (ESI Fig. 6B and 7C†), there were 75%, 40%, and 42% recoveries for M2NG-treated, control, and M0NP-treated groups. Therefore, the presence of M2NGs had led to a better wound healing in this 2D model.
Fig. 7. Reprogramming macrophages with nanoghosts in the scratch assay. (A) Illustration of the transwell setup. Wound closure expressed as the recovering area covered by (B) NIH-3T3 cells and (C) NDF cells that were treated with nanoghosts (*p < 0.05, **p < 0.01).
Discussion
This study explores the utilization of cell membrane derived nanoparticles (i.e. nanoghosts) for polarizing macrophages. We synthesized nanoghosts from either native (M0) or pre-polarized (M1 and M2) macrophages. The size of the nanoghosts was around 100 nm, which is controlled through the membrane pore size in the extrusion process. They shared the same surface biomarkers as their precursor cells (CD38/iNOS and CD206/Arg-1 for M1 and M2 macrophages, respectively, Fig. 2 and ESI Fig. 2†). They are non-toxic to all three types of mammalian cells even at a concentration of 20 μg mL−1.
The most interesting finding was the polarization of M0 macrophages to the M2 phenotype when M2NGs were present (Fig. 4 and ESI Fig. 4†). Polarized macrophages using M2NGs showed higher expressions of CD206 and Arg-1 (3-fold and 2-fold higher than those of the negative control, respectively). There were more IL-4 and IL-10 released from these polarized M2 macrophages as well (Fig. 5). We expect that this reprogramming capability of M2NGs comes from the trapped cytokines/chemokines on M2NGs. Cytokines are originally expressed as the membrane-bound form and then processed to the secretory form. Several cytokines, when they are in a natural form, including IL-1, IL-2, IL-4, IL-12, IL-15, M-CSF, Flt3-ligand, TNF-α, LTα, fractalkine, TGF-β, and IFN-γ, are expressed as the membrane-associated form as well as the secretory form.26 Also, there might be receptors on the membrane of nanoghosts that capture IL-4 and IL-10 released from M2 macrophages during the nanoghost synthesis.26 To verify this hypothesis, we analyzed cytokines/chemokines on nanoghosts. ELISA analysis showed that the concentration of IL-4 was up to 600 pg mL−1 on M2NGs, which was 2.5-fold higher than that on M0NGs and M1NGs. Additionally, a slightly higher concentration of IL-10 was observed on M2NGs (Fig. 6).
Another possible contributing factor is the presentation of bioactive ligands on nanoghosts. According to studies, the Arg–Gly–Asp (RGD) peptide, the integrin binding site, could temporally regulate the adhesion and polarization of macrophages.27,28 Peroxisome proliferator-activated receptors (PPARs) were present in adipose tissue, colon and macrophages, which were involved in M2 polarization.29 We observed that specific ligands were significantly different among M2NGs, M0NGs and M1NGs (Fig. 6A). M2NGs showed higher levels of ligands, such as C–C motif chemokine or ligand 27 (CCL27: accelerates skin regeneration by accumulating bone marrow-derived keratinocytes23) and CCL19 (CCL19: facilitates macrophage participation in lymphangiogenesis). These ligands on M2NGs may play a critical role in reprogramming macrophages.
Finally, M2NGs were used to polarize M0 macrophages in the wound healing model. The successful conversion of M0 to M2 macrophages promoted the cell migration in the scratch assay. Further in vivo experiments will be carried out to further confirm this concept.
Conclusion
This study introduced the synthesis of nanoghosts from polarized macrophage membranes for macrophage reprogramming. These particles were non-toxic to mammalian cells and executed the reprogramming through the surface-bound cytokines/chemokines. They can potentially help the wound healing process by stimulating the M2 conversion.
Author's contributions
J. H. and C. X. designed the project and experiments. J. H, C. W. and M. Z. performed the experiments and analyzed the data. J. H., L. Y., and C. X. wrote the manuscript.
Abbreviations
- DAPI
4′,6-Diamidino-2-phenylindole
- FITC
Fluorescein isothiocyanate
- IL-4
Interleukin-4
- IL-6
Interleukin-6
- IL-10
Interleukin-10
- TNF-α
Tumor necrosis factor alpha
- LPS
Lipopolysaccharide
- CCL
C–C motif chemokine
- CXCL
C–X–C motif chemokine ligand
- IFNγ
Interferon gamma
- NOS2
Nitric oxide synthase 2
- Ear11
Eosinophil-associated ribonuclease A family member 11
Conflicts of interest
The authors declare no competing interest.
Supplementary Material
Acknowledgments
C. X. acknowledges the funding support from the Singapore Agency for Science, Technology and Research (A*STAR) Science and Engineering Research Council Additive Manufacturing for Biological Materials (AMBM) program (A18A8b0059) and internal grant from the City University of Hong Kong (#9610472). J. H. appreciates the support from the Basic Science Research Program through the National Research Foundation of Korea (NRF) of Ministry of Education (NRF-2019R1A6A3A03034115).
Electronic supplementary information (ESI) available. See DOI: 10.1039/d0na00572j
References
- Haney M. J. Zhao Y. Harrison E. B. Mahajan V. Ahmed S. He Z. Suresh P. Hingtgen S. D. Klyachko N. L. Mosley R. L. PloS One. 2013;8:e61852. doi: 10.1371/journal.pone.0061852. [DOI] [PMC free article] [PubMed] [Google Scholar]
- Barros M. H. M. Hauck F. Dreyer J. H. Kempkes B. Niedobitek G. PloS One. 2013;8(11):e80908. doi: 10.1371/journal.pone.0080908. [DOI] [PMC free article] [PubMed] [Google Scholar]
- Italiani P. Boraschi D. Front. Immunol. 2014;5:514. doi: 10.3389/fimmu.2014.00514. [DOI] [PMC free article] [PubMed] [Google Scholar]
- Mantovani A. Sica A. Sozzani S. Allavena P. Vecchi A. Locati M. Trends Immunol. 2004;25:677–686. doi: 10.1016/j.it.2004.09.015. [DOI] [PubMed] [Google Scholar]
- Ma S.-F. Chen Y.-J. Zhang J.-X. Shen L. Wang R. Zhou J.-S. Hu J.-G. Lü H.-Z. Brain Behav. Immun. 2015;45:157–170. doi: 10.1016/j.bbi.2014.11.007. [DOI] [PubMed] [Google Scholar]
- Sridharan R. Cameron A. R. Kelly D. J. Kearney C. J. O'Brien F. J. Mater. Today. 2015;18:313–325. doi: 10.1016/j.mattod.2015.01.019. [DOI] [Google Scholar]
- Owen J. L. Mohamadzadeh M. Front. Physiol. 2013;4:159. doi: 10.3389/fphys.2013.00159. [DOI] [PMC free article] [PubMed] [Google Scholar]
- Zanganeh S. Hutter G. Spitler R. Lenkov O. Mahmoudi M. Shaw A. Pajarinen J. S. Nejadnik H. Goodman S. Moseley M. Nat. Nanotechnol. 2016;11:986. doi: 10.1038/nnano.2016.168. [DOI] [PMC free article] [PubMed] [Google Scholar]
- Kango S. Kalia S. Celli A. Njuguna J. Habibi Y. Kumar R. Prog. Polym. Sci. 2013;38:1232–1261. doi: 10.1016/j.progpolymsci.2013.02.003. [DOI] [Google Scholar]
- Miao X. Leng X. Zhang Q. Int. J. Mol. Sci. 2017;18:336. doi: 10.3390/ijms18020336. [DOI] [PMC free article] [PubMed] [Google Scholar]
- Erdem J. S. Alswady-Hoff M. Ervik T. K. Skare Ø. Ellingsen D. G. Zienolddiny S. Biomaterials. 2019;203:31–42. doi: 10.1016/j.biomaterials.2019.02.025. [DOI] [PubMed] [Google Scholar]
- Kinaret P. A. S. Scala G. Federico A. Sund J. Greco D. Small. 2020;16:1907609. doi: 10.1002/smll.201907609. [DOI] [PubMed] [Google Scholar]
- Toledano Furman N. E. Lupu-Haber Y. Bronshtein T. Kaneti L. Letko N. Weinstein E. Baruch L. Machluf M. Nano Lett. 2013;13:3248–3255. doi: 10.1021/nl401376w. [DOI] [PubMed] [Google Scholar]
- Kim H. Wang S. Y. Kwak G. Yang Y. Kwon I. C. Kim S. H. Adv. Sci. 2019;6:1900513. doi: 10.1002/advs.201900513. [DOI] [PMC free article] [PubMed] [Google Scholar]
- Kaneti L. Bronshtein T. Malkah Dayan N. Kovregina I. Letko Khait N. Lupu-Haber Y. Fliman M. Schoen B. W. Kaneti G. Machluf M. Nano Lett. 2016;16:1574–1582. doi: 10.1021/acs.nanolett.5b04237. [DOI] [PubMed] [Google Scholar]
- Krishnamurthy S. Gnanasammandhan M. Xie C. Huang K. Cui M. Chan J. Nanoscale. 2016;8:6981–6985. doi: 10.1039/C5NR07588B. [DOI] [PubMed] [Google Scholar]
- Xuan M. Shao J. Dai L. He Q. Li J. Adv. Healthcare Mater. 2015;4:1645–1652. doi: 10.1002/adhm.201500129. [DOI] [PubMed] [Google Scholar]
- Cheng L. Wang Y. Huang L. Mol. Ther. 2017;25:1665–1675. doi: 10.1016/j.ymthe.2017.02.007. [DOI] [PMC free article] [PubMed] [Google Scholar]
- Hesketh M. Sahin K. B. West Z. E. Murray R. Z. Int. J. Mol. Sci. 2017;18:1545. doi: 10.3390/ijms18071545. [DOI] [PMC free article] [PubMed] [Google Scholar]
- Moore B. B. Murray L. Das A. Wilke C. A. Herrygers A. B. Toews G. B. Am. J. Respir. Cell Mol. Biol. 2006;35:175–181. doi: 10.1165/rcmb.2005-0239OC. [DOI] [PMC free article] [PubMed] [Google Scholar]
- Yamashita M. Iwama N. Date F. Shibata N. Miki H. Yamauchi K. Sawai T. Sato S. Takahashi T. Ono M. Hum. Pathol. 2009;40:1553–1563. doi: 10.1016/j.humpath.2009.03.021. [DOI] [PubMed] [Google Scholar]
- Teicher B. A. Fricker S. P. Clin. Canc. Res. 2010;16:2927–2931. doi: 10.1158/1078-0432.CCR-09-2329. [DOI] [PubMed] [Google Scholar]
- Inokuma D. Abe R. Fujita Y. Sasaki M. Shibaki A. Nakamura H. McMillan J. R. Shimizu T. Shimizu H. Stem Cell. 2006;24:2810–2816. doi: 10.1634/stemcells.2006-0264. [DOI] [PubMed] [Google Scholar]
- Koh T. J. DiPietro L. A. Expet Rev. Mol. Med. 2011;13:e23. doi: 10.1017/S1462399411001943. [DOI] [PMC free article] [PubMed] [Google Scholar]
- Eming S. A. Werner S. Bugnon P. Wickenhauser C. Siewe L. Utermöhlen O. Davidson J. M. Krieg T. Roers A. Am. J. Pathol. 2007;170:188–202. doi: 10.2353/ajpath.2007.060370. [DOI] [PMC free article] [PubMed] [Google Scholar]
- Kim Y. S. Immune Netw. 2009;9:158–168. doi: 10.4110/in.2009.9.5.158. [DOI] [PMC free article] [PubMed] [Google Scholar]
- Kang H. Jung H. J. Kim S. K. Wong D. S. H. Lin S. Li G. Dravid V. P. Bian L. ACS Nano. 2018;12:5978–5994. doi: 10.1021/acsnano.8b02226. [DOI] [PubMed] [Google Scholar]
- Kang H. Yang B. Zhang K. Pan Q. Yuan W. Li G. Bian L. Nat. Commun. 2019;10:1–14. doi: 10.1038/s41467-018-07882-8. [DOI] [PMC free article] [PubMed] [Google Scholar]
- Lefèvre L. Galès A. Olagnier D. Bernad J. Perez L. Burcelin R. Valentin A. Auwerx J. Pipy B. Coste A. PLoS One. 2010;5:e12828. doi: 10.1371/journal.pone.0012828. [DOI] [PMC free article] [PubMed] [Google Scholar]
Associated Data
This section collects any data citations, data availability statements, or supplementary materials included in this article.


