Abstract
Seven undescribed carotane sesquiterpenoids named fusanoids A–G (1–7), along with one known analog (8) and two known sesterterpenes (9 and 10), were isolated from the fermentation broth of the desert endophytic fungi Fusarium sp. HM166. The structures of the compounds, including their absolute configurations, were determined by spectroscopic data, single-crystal X-ray diffraction analysis, and ECD calculations. Compound 10 showed cytotoxic activities against human hepatoma carcinoma cell line (Huh-7) and human breast cell lines (MCF-7 and MDA-MB-231), and compound 2 showed cytotoxic activity against MCF-7, while compounds 4–9 were inactive against all the tested cell lines. Compounds 4 and 10 showed potent inhibitory activities against the IDH1R132h mutant.
Seven undescribed carotane sesquiterpenoids were isolated from the endophytic fungi Fusarium sp. HM166. Single-crystal X-ray diffraction and ECD defined absolute configurations. Cytotoxicity for Huh-7, MCF-7, and MDA-MB-231 cancer cell lines and IDH1R132h mutant were studied.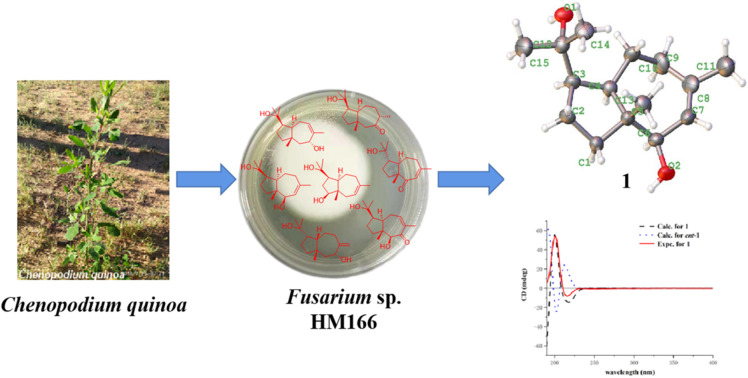
Introduction
It is still very popular to use the synthetic structure of natural products or natural products to discover or develop solid drugs.1,2 A large number of natural product drugs synthetic variations are actually produced by microbial and/or microbial interactions with the host, so the scope of research in the field of natural products should be expanded.3 Endophytic fungi are the fungi that live in different tissues or organs of host plants. They also include saprophytic fungi that live on the surface at a certain stage of their life cycle, as well as latent proto fungi and mycorrhizal fungi that do not harm the host temporarily.4,5
Studies have shown that endophytic fungi may play a potential role in tolerance to plant host stress.6 Deserts are characterized by very limited availability of water and nutrients, extreme temperatures, long periods of sunshine, and strong winds and high ultraviolet (UV) radiation. Desert habitats represent one of the most challenging environments for the growth of plants.6–8 Desert plants adapt to harsh environmental conditions and play an important role in ecosystems. Compared with plant endophytic fungi in common areas, desert microorganisms have different species, functions, and strong resistance to stress, and can grow in water shortage environments. In recent years, a large number of novel secondary metabolites, such as polyketides, alkaloids, terpenes, have been discovered from desert plant endophytic fungus. These metabolites have a variety of potent biological activities and ecological effects, such as cytotoxic, antivirus, and antifungal.9–13
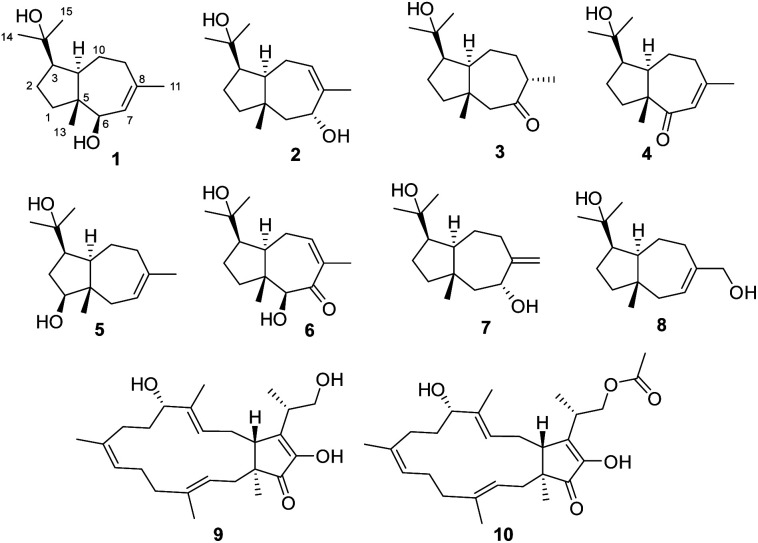
In the search for undescribed bioactive natural products from desert endophytic fungi, we studied Fusarium sp. HM166, which was isolated from the small quinoa in the Inner Mongolia Autonomous Region of Western China. As a result, eight terpenoids, including seven undescribed sesquiterpenes (1–7), and three known compounds, (+)-schisanwilsonene A (8),14 (−)-terpestacin (9), and fusaproliferin (10),15 were isolated and identified (Fig. 1). Herein, the isolation, structural elucidation, and bioactivity of these compounds were reported.
Fig. 1. Structures of compounds 1–10.
Results and discussion
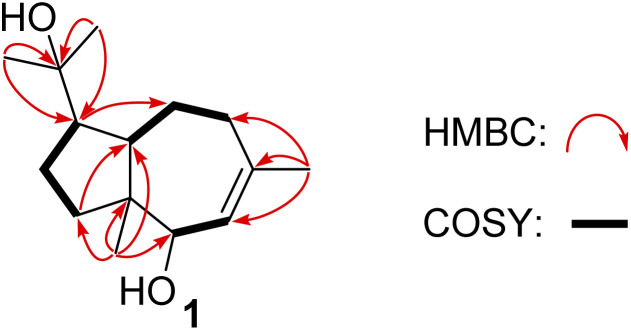
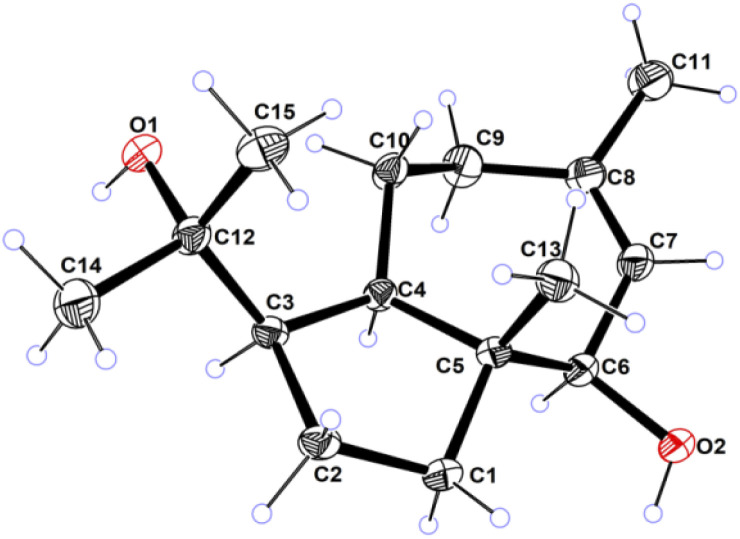
Compound 1 was obtained as colorless needles, had the molecular formula C15H26O2, as established by its positive HRESIMS spectrum at m/z 261.1825 (calcd for C15H26O2Na), indicating three degrees of unsaturation. The infrared (IR) spectrum showed the presence of hydroxy (3362 cm−1) and olefin (2964 cm−1) groups. The 1H NMR and 13C NMR spectra (Tables 1 and 2), in association with the HSQC spectrum, indicated 15 carbon signals, including four methyls (δC/H 27.1/1.74, Me-11; 14.4/0.80, Me-13; 32.3/1.14, Me-14; 26.8/1.17, Me-15), four methylenes (δC 39.5, C-1; 27.8, C-2; 36.9, C-9; 24.1, C-10), four methines (δC 54.2, C-3; 55.2, C-4; 81.7, C-6; 131.7, C-7), and three quaternary carbons (δC 48.8, C-5; 136.6, C-8; 75.0, C-12). The 1H NMR signal at δH 5.25 and 13C NMR signals at δC 131.7 and 136.6 suggested a trisubstituted double bond. The other two degrees of unsaturation were due to the presence of two rings in the structure. The presence of 5/7 bicyclic ring system was determined by COSY correlations (Fig. 2) of H2-1/H2-2/H-3/H-4/H2-10/H2-9 and H-7/H-6 as well as HMBC correlation from H3-13 to C-1, C-4, C-5, and C-6 and H3-11 to C-7, C-8, and C-9, which also assigned the locations of CH3-13 and CH3-11 at C-5 and C-8, respectively. The presence of a hydroxyl at C-6 was deduced by the chemical shifts of CH-6 (δC/H 81.7/3.86). The presence of a 2-hydroxypropan-2-yl group at C-3 was suggested by the HMBC correlations from both H3-14 and H3-15 to C-3 and C-12. ROESY correlations (Fig. 3) of H3-14 with H2-10 and H-6 with H-4 and H-1 suggested the same orientations of H-3, H-4, and H-6 as well as the opposite orientations of H3-13 to H-4. This was confirmed by ECD spectrum calculation by the TDDFT methodology at the CAM-B3LYP/6-311++G(2d,P) level in MeOH, the result of which showed good agreement with the experimental one (Fig. 5). Finally, this inference was further confirmed by the X-ray diffraction experiment using the anomalous scattering of Cu Kα radiation, which also indicating the (3R,4R,5R,6R)-1 absolute configuration (Fig. 4).
The 1H NMR data for 1–7.
| 1a | 2a | 3b | 4a | 5a | 6a | 7a | |
|---|---|---|---|---|---|---|---|
| δ H (J in Hz) | δ H (J in Hz) | δ H (J in Hz) | δ H (J in Hz) | δ H (J in Hz) | δ H (J in Hz) | δ H (J in Hz) | |
| 1a | 1.31, overlap | 1.31, m | 1.43, overlap | 1.72, overlap | 3.51, dd (6.6, 11.2) | 1.58, m | 1.30, overlap |
| 1b | 1.66, m | 1.47, m | 1.48, overlap | 1.74, overlap | 1.79, m | 1,44, overlap | |
| 2a | 1.33, overlap | 1.43, m | 1.57, overlap | 1.40, m | 1.39, m | 1.47, m | 1.69, m |
| 2b | 1.74, overlap | 1.68, m | 1.79, overlap | 1.77, m | 1.93, m | 1.75, m | 1.48, m |
| 3 | 2.43, m | 2.34, m | 2.42, overlap | 2.34, m | 2.25, overlap | 2.46, m | 2.30, m |
| 4 | 1.82, m | 1.85, ddd (12.3, 12.3, 2.7) | 1.98, m | 2.41, m | 1.87, dd (11.6, 12.5) | 2.47, m | 1.88, ddd (3.9, 12.5, 13.4) |
| 6a | 3.86, br s | 1.38, dd (11.7, 11.7) | 2.54, d (14.5) | 1.67, br d (13.8) | 3.88, s | 1.23, dd (10.3, 13.1) | |
| 6b | 1.96, dd (4.1, 11.7) | 2.48, d (14.5) | 2.21, overlap | 2.11, dd (6.4, 13.1) | |||
| 7 | 5.25, br s | 4.28, br d (11.7) | 5.81, s | 5.40, m | 4.17, dd (6.4, 10.3) | ||
| 8 | 2.48, overlap | ||||||
| 9a | 1.89, m | 5.54, d (8.1) | 1.44, overlap | 2.28, m | 2.09, m | 6.50, br d (7.4) | 2.23, m |
| 9b | 2.06, m | 1.93, m | 2.41, m | 1.96, m | 2.29, m | ||
| 10a | 1.42, m | 2.15, m | 1.72, m | 2.02, m | 2.26, m | 3.17, m | 1.57, m |
| 10b | 2.33, m | 2.81, ddd (2.7, 8.6, 16.8) | 2.57, m | 2.56, m | 1.53, m | 2.50, m | 2.39, m |
| 11a | 1.74, s | 1.76, s | 1.08,d (7.2) | 1.89, s | 1.73, s | 1.88, s | 4.88, br s |
| 11b | 5.04, br s | ||||||
| 13 | 0.80, s | 0.93, s | 0.97, s | 1.16, s | 0.72, s | 0.77, s | 0.91, s |
| 14 | 1.14, s | 1.16, s | 1.19, s | 1.25, s | 1.14, s | 1.23, s | 1.16, s |
| 15 | 1,17, s | 1.18, s | 1.22, s | 1.27, s | 1.18, s | 1.24, s | 1.19, s |
1H (600 MHz) NMR data in CD3OD.
1H (600 MHz) NMR data in CDCl3.
The 13C NMR data for 1–7.
| Position | 1a | 2a | 3b | 4a | 5a | 6a | 7a |
|---|---|---|---|---|---|---|---|
| δ C | δ C | δ C | δ C | δ C | δ C | δ C | |
| 1 | 39.4, CH2 | 43.3, CH2 | 43.1, CH2 | 35.8, CH2 | 79.9, CH | 39.6, CH2 | 43.8, CH2 |
| 2 | 27.8, CH2 | 28.0, CH2 | 28.4, CH2 | 27.0, CH2 | 35.8, CH2 | 28.0, CH2 | 28.2, CH2 |
| 3 | 54.2, CH | 53.9, CH | 53.5, CH | 52.1, CH | 49.0, CH | 54.0, CH | 54.0, CH |
| 4 | 55.2, CH | 51.5, CH | 56.1, CH | 44.3, CH | 55.8, CH | 49.1, CH | 53.1, CH |
| 5 | 48.8, C | 43.4, C | 42.3, C | 56.3, C | 45.4, C | 47.5, C | 43.9, C |
| 6 | 81.5, CH | 52.5, CH2 | 58.1, CH2 | 208.0, C | 40.8, CH2 | 87.3, CH | 51.5, CH2 |
| 7 | 131.7, CH | 70.6, CH | 218.6, C | 127.1, C | 123.5, CH | 204.3, C | 74.1, CH |
| 8 | 136.6, C | 141.4, C | 48.4, CH | 152.2, C | 140.6, C | 134.9, C | 155.0, C |
| 9 | 36.9, CH2 | 126.3, CH | 27.1, CH2 | 35.5, CH2 | 37.0, CH2 | 143.4, CH | 34.0, CH2 |
| 10 | 24.1, CH2 | 27.8, CH2 | 18.9, CH3 | 22.8, CH2 | 24.3, CH2 | 29.9, CH2 | 27.7, CH2 |
| 11 | 27.1, CH3 | 23.5, CH3 | 74.1, C | 28.3, CH3 | 27.4, CH3 | 21.9, CH3 | 113.1, CH2 |
| 12 | 75.0, C | 74.8, C | 21.2, CH3 | 73.9, C | 74.8, C | 74.3, C | 74.6, C |
| 13 | 14.4, CH3 | 18.9, CH3 | 11.1, CH3 | 20.1, CH3 | 13.5, CH3 | 14.0, CH3 | 19.7, CH3 |
| 14 | 32.3, CH3 | 32.4, CH3 | 32.1, CH3 | 32.5, CH3 | 32.1, CH3 | 32.9, CH3 | 32.0, CH3 |
| 15 | 26.8, CH3 | 27.2, CH3 | 27.3, CH3 | 27.2, CH3 | 27.1, CH3 | 27.1, CH3 | 27.7, CH3 |
13C (150 MHz) NMR data in CD3OD.
13C (150 MHz) NMR data in CDCl3.
Fig. 2. Key 1H–1H and HMBC correlations of 1.
Fig. 3. Key ROESY correlations of 1.
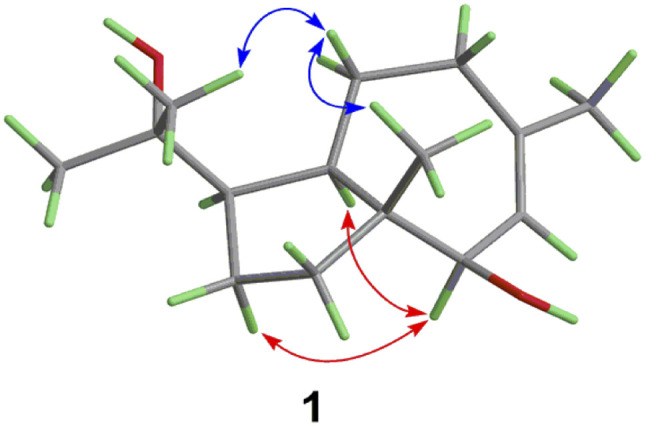
Fig. 5. Calculated and experimental ECD spectra of 1.
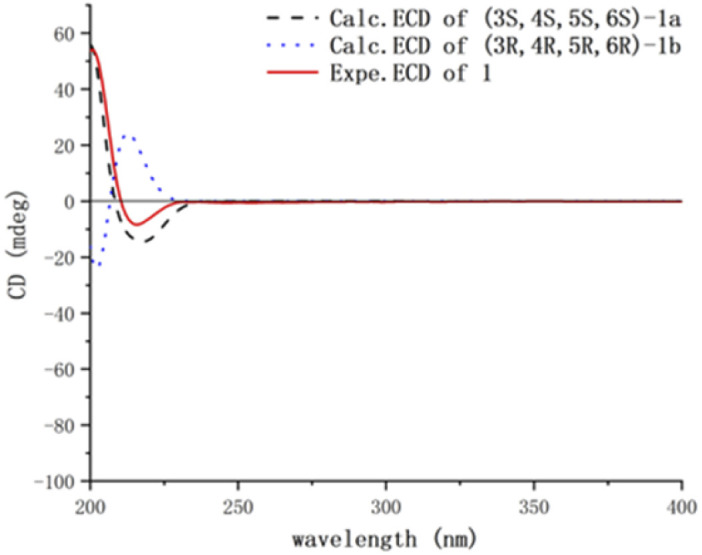
Fig. 4. ORTEP drawing of compound 1.
Compound 2 was obtained as a colorless oil. The molecular formula of 2 was established to be the same as that of 1 according to its positive HRESIMS spectrum, with three degrees of unsaturation. The 1H and 13C NMR data (Tables 1 and 2) were also quite similar to those of 1, indicating that they shared the same carbon skeleton. Detailed analysis of the 2D NMR data (Tables 1 and 2) of 2 revealed HMBC correlations from H3-13 to C-1, C-4, C-5, and the sp3 methylene carbon C-6 as well as COSY correlations of H2-6 with the hydroxylated methine C-7 (δC/H 70.6/4.28) and H2-10 with the olefinic methine proton H-9 (δC/H 126.3/5.54). These data suggested the presence of C-8/C-9 double bond and C-7 hydroxyl, which were different from those of compound 1. Consequently, the planar structure of 2 was established as shown in Fig. 1. ROESY correlations (Fig. S10†) of H3-14/H-10a, H3-13/H-10a, and H3-13/H-7 led to the assignment of the relative configuration of 2. The absolute configuration for 2 was also proposed by a comparison of the experimental ECD spectrum with the calculated ECD spectra (Fig. S11†) for 2 and ent-2. The experimental ECD spectrum of 2 was nearly identical to the calculated ECD one for 2, clearly indicating the (3S,4R,5S,6R)-absolute configuration.
Compound 3 was obtained as a yellow oil, had the molecular formula C15H26O2 on the basis of HRESIMS, same as that of 2. The 13C NMR data of 3 were also similar to those of 2, suggesting that they bear similar structure. However, in the NMR spectra of 3, the signals for the C-7 hydroxyl methine and the C-8/C-9 double bond of 2 were missing. Instead, a ketone carbonyl (δC 218.5), a sp3 methine (δC/H 48.4/2.48), and a sp3 methlene (δC/H 27.1/1.44, 1.93) were observed, suggesting the replacement of the C-7 hydroxyl methine and C-8/C-9 double bond of 2 by C-7 ketone carbonyl and CH-8/CH2-9 unit of 3, respectively. This was further confirmed by COSY correlations (Fig. S9†) of H3-11/H-8/H2-9 and HMBC correlations from H3-11 to C-8, C-9, and the ketone carbonyl C-7 in the NMR spectra of 3. Thus, the planar structure of 3 was assigned. ROESY correlations (Fig. S10†) of H3-13/H-10a/H3-14 suggesting their cofacial relationship, while ROESY correlations of H-10b/H3-11 suggested that they were on the face opposite to H3-13. To determine the absolute configuration of 3, its ECD spectrum was collected in MeOH and simulated at the B3LYP/6-311++G(2d,P) level after conformational optimization at the same level via Gaussian 05 software. The Boltzmann-weighted ECD curve for 3 agreed well with the experimental one (Fig. S11†), assigning its absolute configuration as (3S,4R,5S,8S)−.
Compound 4 had the molecular formula C15H26O2, as established by its positive HRESIMS spectrum at m/z 261.1821 (calcd for C15H26O2Na), indicating four degrees of unsaturation. The 13C NMR and DEPT data of 4 showed the carbon resonances similar to those of 1. Detailed comparison of the NMR data between 1 and 4 revealed that the main structural difference between them was the replacement of the C-6 hydroxyl methine in 1 by the C-6 conjugated ketone carbonyl in 4, as supported by the HMBC correlations (Fig. 2) from both H3-13 and H-7 to C-6 carbonyl. ROESY correlations (Fig. 3) of H3-14/H-10a, H3-13/H-10a indicated the same direction of H-3 and H-4 and the different direction of H3-13. The calculated ECD spectrum for 4 match well with the experimental one (Fig. 5), thus assigning the absolute configuration of 4 as (3S,4R,5R)−.
Compound 5 was a colorless oil, had the same molecular formula C15H26O2 as that of 1, as established by its positive HRESIMS spectrum at m/z 261.1824 (calcd for C15H26O2Na). The 1H and 13C NMR data of 5 were quite similar to those of 1. Detailed analysis of the NMR data of 5 revealed that the hydroxyl at C-6 in 1 was shifted to C-1 in 5, as suggested by HMBC correlations from H3-13 to the oxymethine carbon C-1 at δC 79.9 and the sp3 methylene carbon C-6 at δC 40.8 and COSY correlations of H-7/H2-6. The remaining substructure of 5 was determined to be the same as that of 1 by analysis of its 2D NMR data (Tables 1 and 2). In the ROESY spectrum, correlations (Fig. S10†) of H3-14/H-10a/H3-13 suggested the cofacial relationship of H3-14 and H3-13. ROESY correlations of H-6/H-4 indicated that they were on the face opposite to H3-13. The Boltzmann-weighted calculated ECD curve of 5 agreed well with the experimental one (Fig. S11†), assigning its absolute configuration as (1S,3R,4R,5S)−.
Compound 6 was obtained as a colorless oil, had the molecular formula C15H24O3 on the basis of HRESIMS, which indicated four degrees of unsaturation. The 13C NMR spectral data of 6 were very similar to those of 2 except for the replacement of the hydroxyl methine C-7 and the methylene C-6 signals in 2 by signals at δC 204.3 and 87.3 corresponding to a conjugated ketone and a hydroxylated methine, respectively, in 6. The above data, together with the HMBC correlations from H3-13 to the hydroxylated methine C-6 and both H3-11 and H-6 to the conjugated ketone C-7, indicated the –COH(6)–CO(7)- fragment. The remaining substructure of 6 was found to be identical to that of 2, conjugated ketone C-7, indicated the –COH(6)–CO(7)- fragment. The remaining substructure of 6 was found to be identical to that of 2, as confirmed by detailed interpretation of the 2D NMR data (Fig. S9†).
The relative configuration was established by analysis of the ROESY data (Fig. S10†). Correlations of H-6/H-4 revealed their cofacial relationship, while correlations of H3-14/H-10/H3-13 suggested that these protons were on the face opposite to H-4. The Boltzmann-weighted ECD curve for 6 agreed well with the experimental one (Fig. S11†), assigning its absolute configurations as 3R, 4R,5R, and 6S.
Compound 7 was obtained as a white powder, had the molecular formula C15H26O2, as established by its positive HRESIMS spectrum at m/z 261.1829 (calcd for C15H26O2Na), indicating three degrees of unsaturation. The 1H and 13C NMR data of 7 were comparable to those of 2, except for the appearance of signals for a terminal alkenyl group (δC/H 113.1/4.88, 5.04) and a sp3 methylene (δC/H 34.0/2.23, 2.29) and the disappearance of signals for the trisubstituted double bond C-8/C-9 and the C-11 methyl. COSY correlations (Fig. 2) of H-4/H2-10/H2-9 and H2-6/H-7 and HMBC correlations from the olefinic protons H2-11 to the hydroxylated methine C-7 and C-9 suggested that the double bond at C-8/C-9 in 2 shifted to C-8/C-11 in 7. The remaining substructure of 7 was determined to be the same as that of 2 by analysis of the 2D NMR data (Fig. S9†). ROESY correlations (Fig. S10†) of H3-14/H-10/H3-13/H-7 led to the assignment of the relative configuration of 7 as shown in Fig. 3. The absolute configuration of 7 was assigned to be (3S,4S,5S,7R)− by comparison of its experimental ECD curve with the calculated one (Fig. S11†).
Biological activity
The cytotoxic activity of compounds 1–10 was tested against Huh-7 (human hepatoma carcinoma cell line), MCF-7 (human breast cancer cell line), MDA-MB-231 (human breast cancer cell line), A549 (human lung carcinoma cell line) and IDH1R132h mutant by using the MTT method.16 Compound 10 showed cytotoxic to Huh-7, MCF-7, MDA-MB-231 cell lines and IDH1R132h mutant, with IC50 values of 47.03 ± 2.48, 38.33 ± 2.04, 49.06 ± 1.81, and 13.99 μM, respectively. Compound 2 showed cytotoxic to MCF-7, with IC50 value of 43.38 ± 7.22 μM. Whereas the corresponding positive control DDP showed IC50 values of 7.55 ± 2.94, 1.27 ± 0.18, and 2.84 ± 0.47 μM, respectively. Compounds 1 and 3–9 were inactive against the tested cell lines at 50 μM. Compound 4 and 9 showed potent inhibitory activities against the IDH1R132h mutant, with IC50 value of 22.27 ± 0.24 μM and 13.99 ± 0.37 μM.
Conclusions
In conclusion, seven undescribed carotane sesquiterpenoids named fusanoid A–G (1–7), along with one known analog (8) and two known sesterterpenes (9 and 10), and were isolated from the fermentation broth of the desert endophytic fungi Fusarium sp. HM166. Their chemical structures, including their absolute configurations, were determined by spectroscopic data, single-crystal X-ray diffraction analysis, and ECD calculations. In addition, this research provided a series of carotane sesquiterpenoids from the desert endophytic fungi. Our findings further suggested that the desert endophytic fungi is a rich source of bioactive secondary metabolites, and thus worthy of in-depth investigations.
Experimental
General experimental procedures
Optical rotation was measured at room temperature on a JASCO P-2000 polarimeter (JASCO, Easton, PA, USA) using a 1 cm cell. The IR spectra were obtained on with a Nicolet iS10. The NMR spectra were recorded on a Bruker AM-600 spectrometer with TMS as an internal standard. HREIMS data were acquired on a Thermo Scientific LTQ Orbitrap XL spectrometer. Semi-preparative HPLC was performed on an Ultimate 3000 chromatographic system with a Thermo Hypersil Gold (10 × 250 mm, 3 mL min−1). Thin-layer chromatography (TLC) and column chromatography (CC) were carried out on precoated silica gel (60–80 mesh, Qingdao Marine Chemical Inc., Qingdao, China) and silica gel (200–300 mesh, Qingdao Marine Chemical Inc., Qingdao, China), respectively.
Fungal material
The strain Fusarium sp. HM166 was isolated from Chenopodium quinoa, collected from Inner Mongolia Autonomous Region of west China, which was identified based on the rDNA ITS1–4 gene sequences (GenBank accession No. MK478900, ESI†) of the single colonies. A reference culture of Fusarium sp. HM166 is deposited in our laboratory and which maintained at −80 °C. The strain was grown on PDA plates at 28 °C for 5 days, then it was cut into small pieces and cultured in PDA liquid at 28 °C for 4 days to afford a seed culture. The fungus was cultured in 200 × 500 mL Erlenmeyer flasks each containing 200 mL of liquid medium (20 g mannitol, 20 g maltose, 10 g glucose, 10 g monosodium glutamate, 3 g yeast extract, 0.5 g corn meal, 0.5 g KH2PO4, 0.3 g MgSO4).
Extraction and isolation
The fermented cultures were extracted with three-fold volumes of EtOAc, then the EtOAc solutions were combined and evaporated under reduced pressure to produce a dark brown solid crude extract. The extract was fractionated by a silica gel VLC column using different solvents of increasing polarity, from EtOAc–petroleum to yield thirteen fractions (Frs. 1–13). Fraction 2 was applied to octadecylsilane (ODS) silica gel with gradient elution of MeOH–H2O (20 : 1, 30 : 1, 50 : 1, 60 : 1, 70 : 1, 1 : 0) to subfractions (Fr.2-1–Fr.2–6). Fr.2–5 was subjected to semipreparative HPLC (Thermo Hypersil Gold, 5 μm; 10 × 250 mm; 55% MeOH–H2O; 3 mL min−1) to give compound 3 (tR 15 min; 10.0 mg). Fr.2–6 was subjected to semipreparative HPLC (Thermo Hypersil Gold, 5 μm; 10 × 250 mm; 40% MeCN–H2O; 3 mL min−1) to give compound 6 (tR 32 min; 12.0 mg). Fraction 4 was applied to ODS silica gel with gradient elution of MeOH–H2O (20 : 1, 30 : 1, 50 : 1, 60 : 1, 70 : 1, 80 : 1, 1 : 0) to subfractions (Fr.4-1–Fr.4-6). Fr.4-3 was subjected to semipreparative HPLC (Thermo Hypersil Gold, 5 μm; 10 × 250 mm; 56% MeCN–H2O; 3 mL min−1) to give compounds 5 (tR 22.8 min; 9.3 mg) and 8 (tR 32.6 min; 8.0 mg). Fr.4-4 was subjected to semipreparative HPLC (Thermo Hypersil Gold, 5 μm; 10 × 250 mm; 53% MeOH–H2O; 3 mL min−1) to give compounds 1 (tR 34 min; 4.4 mg) and 7 (tR 36.0 min; 6.8 mg). Fr.4–6 was subjected to semipreparative HPLC (Thermo Hypersil Gold, 5 μm; 10 × 250 mm; 78% MeOH–H2O; 3 mL min−1) to give compounds 9 (tR 11.4 min; 18.9 mg) and 10 (tR 14.1 min; 30.9 mg). Fraction 7 was applied to octadecylsilane (ODS) silica gel with gradient elution of MeOH–H2O (20 : 1, 30 : 1, 50 : 1, 60 : 1, 70 : 1, 80 : 1, 1 : 0) to subfractions (Fr.7-1–Fr.7-6). Fr.7-1 was subjected to semipreparative HPLC (Thermo Hypersil Gold, 5 μm; 10 × 250 mm; 43% MeCN–H2O; 3 mL min−1) to give compounds 2 (tR 12 min; 21 mg) and 4 (tR 14 min; 3.2 mg).
Fusanoid A (1)
Colorless oil; [α]25D + 40.1 (c 0.1, MeOH); UV (MeOH) λmax (log ε): 201.0 (1.97); IR (KBr) νmax (cm−1): 3362, 2964, 2875, 1450, 1377, 1165, 1032, 1017. 1H and 13C NMR data, Tables 1 and 2; HRESIMS m/z 261.1825 [M + Na]+ (calcd for C15H26O2 Na, 261.1825).
Fusanoid B (2)
Colorless oil; [α]25D − 47.3 (c 0.1, MeOH); UV (MeOH) λmax (log ε): 202.5 (2.38); IR (KBr) νmax (cm−1): 3360, 2960, 2891, 1453, 1379, 1155, 1038, 1027. 1H and 13C NMR data, Tables 1 and 2; HRESIMS m/z 261.1820 [M + Na]+ (calcd for C15H26O2 Na, 261.1825).
Fusanoid C (3)
Colorless oil; [α]25D + 90.8 (c 0.1, MeOH); UV (MeOH) λmax (log ε): 240.0 (1.54); IR (KBr) νmax (cm−1): 3447, 2966, 2874, 1694, 1450, 1378, 1054. 1H and 13C NMR data, Tables 1 and 2; HRESIMS m/z 261.1821 [M + Na]+ (calcd for C15H26O2 Na, 261.1825).
Fusanoid D (4)
Yellow oil; [α]25D − 30.0 (c 0.1, MeOH); UV (MeOH) λmax (log ε): 240.0 (2.27); IR (KBr) νmax (cm−1): 3455, 2966, 1652, 1640, 1442, 1376, 1157. 1H and 13C NMR data, Tables 1 and 2; HRESIMS m/z 259.1661 [M + Na]+ (calcd for C15H24O2Na, 259.1669).
Fusanoid E (5)
Colorless oil; [α]25D − 7.9 (c 0.1, MeOH); UV (MeOH) λmax (log ε): 201.0 (2.32); IR (KBr) νmax (cm−1): 3420, 2966, 1678, 1594, 1456, 1373, 1140, 1032. 1H and 13C NMR data, Tables 1 and 2; HRESIMS m/z 261.1824 [M + Na]+ (calcd for C15H26O2Na, 261.1825).
Fusanoid F (6)
Yellow oil; [α]25D + 60.9 (c 0.1, MeOH); UV (MeOH) λmax (log ε): 243.5 (2.29); IR (KBr) νmax (cm−1): 3433, 2967, 1709, 1450, 1379, 1157, 1018. 1H and 13C NMR data, Tables 1 and 2; HRESIMS m/z 275.1615 [M + Na]+ (calcd for C15H24O3Na, 275.1615).
Fusanoid G (7)
Yellow oil; [α]25D − 30.4 (c 0.1, MeOH); UV (MeOH) λmax (log ε): 240.0 (2.27); IR (KBr) νmax (cm−1): 3346, 2967, 1700, 1460, 1382, 1154. 1H and 13C NMR data, Tables 1 and 2; HRESIMS m/z 259.1661 [M + Na]+ (calcd for C15H24O2Na, 259.1669).
X-ray crystallography
Data for compound 1
C15H26O2, M = 238.18, a = 6.4271(19) Å, b = 8.2638(2) Å, c = 30.7804(11) Å, α = 90.00°, β = 90.00°, γ = 90.00°, V = 1634.81(9) Å3, T = 293 K, space group P212121, Z = 4, μ(Cu Kα) = 0.580, 2784 reflections measured, 2921 independent reflections (Rint = 0.0427). The final wR(F2) values were 0.1133 (all data). CCDC: 2080924 (https://www.ccdc.cam.ac.uk (accessed on 29 April 2021)).
Cytotoxicity bioassays
All cells were purchased from the type culture collection of the Chinese Academy of Sciences (Shanghai, China). Cell proliferation rates were assessed using the MTT assay. Briefly, cells were seeded into 96-well plates at a density of 5000 cells per well. The experimental groups were treated with different concentrations of compounds ranging from 6.25 μM to 50 μM on the basis of glucose stimulation. After 48 h, MTT was added into each well at a concentration of 100 μg per well, incubated for 4 h and then replaced with 100 μL Tris–HCl. The number of viable cells was evaluated by measuring the absorbance at an OD of 570 nm using a Microplate Reader (Tecan, Mannedorf, Switzerland).16
Enzyme inhibition assays
Determination of the activity and inhibition of IDH1R132H was based on the initial linear consumption of NADPH in the reaction. The enzyme activity assay was performed in a 96-well microplate by using the purified IDH1 mutant (0.4 μM) in a buffer containing 1 M α-KG, 2 mM NADPH (≫Km for NADPH) and 15 mM WST-8. For the inhibition assay, triplicate samples of the compounds were incubated with the protein for 5 min, before adding α-KG to initiate the reaction. The absorption peak was detected at 450 nm using a microplate reader, the experimental data were analyzed, and the IC50 of each compound was calculated using GraphPad Prism.17,18
Conflicts of interest
There are no conflicts to declare.
Supplementary Material
Acknowledgments
This research was funded by grants from National Key Research and Development Program of China (2017YFD0201401) and Changjiang Scholars and Innovative Research Team in University (IRT_15R16).
Electronic supplementary information (ESI) available: UV, IR, HRESIMS, NMR spectra of compounds 1–7; ECD calculations of compounds 1–7. CCDC 2080924. For ESI and crystallographic data in CIF or other electronic format see https://doi.org/10.1039/d2ra02762c
Notes and references
- Cherif A. Tsiamis G. Compant S. Borin S. BioMed Res. Int. 2015:289457. doi: 10.1155/2015/289457. [DOI] [PMC free article] [PubMed] [Google Scholar]
- He J. Wijeratne E. M. K. Bashyal B. P. Zhan J. Seliga C. J. Liu M. X. Pierson E. E. Pierson L. S. VanEtten H. D. Gunatilaka A. A. L. J. Nat. Prod. 2004;67:1985–1991. doi: 10.1021/np040139d. [DOI] [PubMed] [Google Scholar]
- Newman D. J. Cragg G. M. J. Nat. Prod. 2020;83:770–803. doi: 10.1021/acs.jnatprod.9b01285. [DOI] [PubMed] [Google Scholar]
- Zhang H. W. Song Y. C. Tan R. X. Nat. Prod. Rep. 2006;23:753–771. doi: 10.1039/B609472B. [DOI] [PubMed] [Google Scholar]
- Ding G. Sonng Y. C. Chen J. R. Xu C. Ge H. M. Wang X. T. Tan R. X. J. Nat. Prod. 2006;69:302–304. doi: 10.1021/np050515+. [DOI] [PubMed] [Google Scholar]
- González-Teuber M. Vilo C. Bascuñán-Godoy L. Genomics Data. 2017;11:109–112. doi: 10.1016/j.gdata.2016.12.015. [DOI] [PMC free article] [PubMed] [Google Scholar]
- Murgia M. Fiamma M. Barac A. Deligios M. Mazzarello V. Paglietti B. Cappuccinelli P. Al-Qahtani A. Squartini A. Rubino S. Al-Ahdal M. N. MicrobiologyOpen. 2018:e00595. doi: 10.1002/mbo3.595. [DOI] [PMC free article] [PubMed] [Google Scholar]
- Noy-Meir I. Annu. Rev. Ecol. Syst. 1973;4:25–51. doi: 10.1146/annurev.es.04.110173.000325. [DOI] [Google Scholar]
- Clarke J. D. A. Geomorphol. 2006;73:101–114. doi: 10.1016/j.geomorph.2005.06.008. [DOI] [Google Scholar]
- Wang X. N. Bashyal B. P. Wijeratne E. M. K. U'Ren J. M. Liu M. X. Gunatilaka M. K. Arnold A. E. Gunatilaka A. A. L. J. Nat. Prod. 2011;74:2052–2061. doi: 10.1021/np2000864. [DOI] [PMC free article] [PubMed] [Google Scholar]
- Li Y. Y. Tan X. M. Wang Y. D. Yang J. Zhang Y. G. Sun B. D. Gong T. Guo L. P. Ding G. J. Nat. Prod. 2020;83:1488–1494. doi: 10.1021/acs.jnatprod.9b01148. [DOI] [PubMed] [Google Scholar]
- Tan X. M. Zhang X. Y. Yu M. Yu Y. T. Guo Z. Gong T. Niu S. B. Qin J. C. Zou Z. M. Ding G. Phytochemistry. 2020;164:154–161. doi: 10.1016/j.phytochem.2019.05.012. [DOI] [PubMed] [Google Scholar]
- Bashyal B. P. Wellensiek B. P. Ramakrishnan R. Faeth S. H. Ahmad N. Gunatilaka A. A. L. Bioorg. Med. Chem. 2014;22:6112–6116. doi: 10.1016/j.bmc.2014.08.039. [DOI] [PMC free article] [PubMed] [Google Scholar]
- Ma W. H. Huang H. Zhou P. Chen D. F. J. Nat. Prod. 2009;72:676–678. doi: 10.1021/np8007864. [DOI] [PubMed] [Google Scholar]
- Guo D. L. Zhao M. Xiao S. J. Xia B. Wan B. Gu Y. C. Ding L. S. Zhou Y. Phytochem. Lett. 2015;14:260–264. doi: 10.1016/j.phytol.2015.10.024. [DOI] [Google Scholar]
- Liu Z. Tian Y. Chen Q. Zhang G. Li C. Luo D. Anti-Cancer Agents Med. Chem. 2020;20:417–428. doi: 10.2174/1871520619666191212150322. [DOI] [PubMed] [Google Scholar]
- Liu Y. X. Hua W. W. Li Y. Xian X. R. Zhao Z. Liu C. Zou J. J. Li J. Xian J. F. Zhu Y. B. Biochem. Pharmacol. 2015;14:260–264. [Google Scholar]
- He Y. Zheng M. Z. Li Q. Hu Z. Zhu H. C. Liu J. J. Wang J. P. Xue Y. B. Li H. Zhang Y. H. Org. Chem. Front. 2013:1–4. [Google Scholar]
Associated Data
This section collects any data citations, data availability statements, or supplementary materials included in this article.


