Abstract
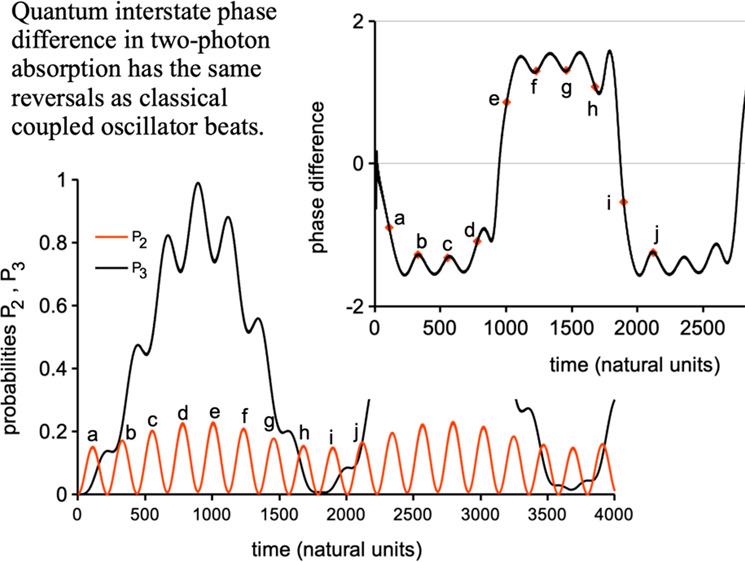
Whether quantum state transitions occur by instantaneous jumps (a la Bohr) or deterministic dynamics (Schrödinger’s preference) has been intensely debated. Recent experimental measurements of shelved electrons have reignited the debate. We examine aspects of the time-dependent numerical solutions of the Schrödinger equation in quantum systems with two and three levels perturbed by a sinusoidal field. A geometrical construction involving quantum state phase differences illuminates the role of interstate phase differences in a deterministic, rather than random, process of multiphoton absorption. Alternate halves of the Rabi cycle exhibit phase reversals much like the classical beats of coupled oscillators. For non-zero detuning, population inversion does not occur because the exciting field drifts out of the proper phase before inversion is complete. A close correspondence with classical, coupled oscillator beats offers insights for interpretation of deterministic quantum dynamics and suggests an experimental test for the correctness of this picture depending on the long-time phase stability of exciting fields.
I. Introduction
Whether transitions between atomic-level quantum states occur as rapid, random “quantum jumps” or as continuously evolving dynamics has been intensely disputed. A review by Dick1 summarizes recent arguments. Experimental evidence of jumps using shelved-electron detection has accumulated since the 1980s.2 Recently publicized experiments have renewed interest in the time-dependence of “quantum jumps.” For example, Minev et at.3 observed absorption and emission in an artificial “atom” engineered using superconducting qubits and documented dynamics that appeared to be more deterministic. According to Dick,1 resolution of the controversy in favor of jumps requires quantization of the field and appropriate asymptotic scattering states. However, both these experiments and their theoretical interpretation require spontaneous and well as stimulated emission. Sidestepping this controversy, this paper explores the continuous evolution of stimulated absorption and emission using numerical solutions of the Schrödinger equation to clarify the importance of phase relations between quantum states and the field.
The response of a multilevel quantum system to an oscillating perturbation is one of the most important subjects in chemistry or physics, subsuming all areas of spectroscopy. Most spectroscopies deal with absorption or emission of a single photon, but several modern techniques involve two or more photons.4 These include Raman spectra5 (including coherent anti-Stokes Raman spectroscopy or CARS), double resonance techniques, second harmonic generation, infrared multiple photon absorption, optical parametric oscillation, and multiphoton ionization. This paper introduces a simple theoretical tool in numerical simulations of one- and two-photon processes, revealing a key dependence on interstate phase differences.
A sinusoidally perturbed quantum system can be described theoretically on several different levels. Although the quantum mechanical description of both the system and the perturbing field has certain advantages, the most common treatment describes the field as an externally imposed perturbation (i.e., a classical field). Some call this a semiclassical6 or neoclassical analysis since the system is treated quantum mechanically and the field is treated classically. Herein we avoid this terminology because the term semiclassical is also used to describe approximate quantum treatments such as the JWKB method,7 EBK quantization,8 or the Heisenberg correspondence principle approximation of matrix elements.9
We analyze a quantum system with discrete states in the Schrödinger picture10 as described by the time-dependent Schrödinger equation11
| 1 |
where ℏ is Planck’s constant divided by 2π, H is the Hamiltonian operator for the system, and Ψ is the wave function. Equation 1 describes the interaction of a quantum system with an externally imposed sinusoidal field, most often an electromagnetic field, by dividing the Hamiltonian into two parts, H = H0+H1, where H0 contains all of the time-independent description of the system (i.e., the discrete bound states) and H1 contains the time-dependent part of the Hamiltonian describing the interaction of the system with the external field. Assuming that the eigenfunctions, ψn0, and eigenvalues, En0, of H0 are known, the general solution of eq 1 can be expanded as a linear combination of ψn012
| 2 |
where q represents the coordinates of the system and where the second equality exhibits the natural, oscillatory, time dependence of the linear expansion coefficients, cn(t), that result from eq 1. If H contains only the internal Hamiltonian, H0, then the an coefficients are time-independent. However, if the perturbing Hamiltonian, H1, is included, then the cn coefficients may not have the simple oscillatory time dependence indicated in eq 2, or equivalently, the an coefficients must be allowed to vary in time. In either case, the amplitude coefficients describe the probability of the system being in the nth quantum state at time t:
| 3 |
By substituting the wave function from eq 2 into the time-dependent Schrödinger equation, eq 1, the time-dependent Schrödinger equation is reduced to a set of first-order, coupled differential equations for the coefficients cn(t) or an(t) in terms of the matrix elements of the perturbing Hamiltonian13
| 4 |
| 5 |
where ⟨n|H1(t)|k⟩ is the matrix element of H1 coupling states n and k and ωnk= (En0 – Ek0)/ℏ is the transition frequency between state k and state n. We explore the continuous dynamics of these equations for which instantaneous quantum jumps are not really an allowed result.
Methods for solving eq 4 or eq 5 include (1) numerical solution as an initial value problem, (2) Fourier analysis (Floquet theory),14 or (3) perturbation theory. We chose option 1, numerically integrating eq 4 from t = 0 to a sufficiently large time using a standard integrator15 which returns real and imaginary parts of {c1, c2, ... cn}(where n is the number of states) at uniformly spaced time intervals. The amplitude and phase of cn are then reconstructed using
| 6 |
where ATAN2 is the two-argument inverse tangent function defined on (-π,π] (argument order for ATAN2 lacks a uniform standard). The relationship between cn and an with the phase θn is
| 7 |
where rn = |cn| = |an|. The phase of an can also be defined
| 8 |
where
| 9 |
The most useful information comes, not from these phases, but from the difference in phases between two states as discussed below.
The time-dependent Schrödinger equation, eq 1, requires solutions which have both real and imaginary parts, and the complex-valued nature of quantum wave functions is a fundamental difference between classical mechanics and quantum mechanics. When combined with the fact that the wave function represents a complex amplitude rather than a probability, complex wave functions result in the strikingly nonclassical effect of interference. Consider the form of eq 4. The first term in the square brackets results in the oscillating nature of the cn coefficients. Because the zero-order eigenvalues, En0, are real, the contribution of this first term to the time derivative of cn always differs in phase from cn by π/2 (e.g., – i = e–iπ/2), so this term can never cause a change in the probability. For real perturbations, even the diagonal term from H1 only causes cn to rotate, rather than change in length. The terms that cause changes in probability are those terms for which the ck coefficients are near ± π/2 out of phase with cn such that the contribution of the whole term is in phase with cn. Thus, we conclude that transitions between quantum states in this picture are phase sensitive, and an analysis of the phase relationships between states is necessary to understand transitions, although few previous treatments have explicitly examined their role. In this paper, we examine the phase relationships between the time-dependent coefficients and develop an instructive geometrical method to understand the absorption and emission process.
We use the Morse oscillator as a useful approximate description of the stretching motion of a diatomic molecule, as described in the Supporting Information, Section 1, but the results presented here are much more general and applicable to any multilevel quantum system among whose levels transitions may be induced. We ignore spontaneous emission, which does not appear unless the field is quantized.16
II. Two Level Systems: The Rabi Solution
Insight into the dynamics of energy absorption and emission usually grows from an understanding of simplified model systems.17 The Rabi solution to the two-level system in the rotating-wave approximation is perhaps the classic example of Schrödinger picture dynamics.
For physical reasons, we restrict this discussion to real-valued perturbations. For an oscillating field of angular frequency ω, the matrix elements of H1 will be given by
| 10 |
where Vnk is real and γ is the initial phase. We have chosen the negative sign because, for our applications, H1 is given by – μ·E, the electric dipole coupling, and Vnk = μnkE0/2 (see Supporting Information, Section 2).
II.A. Two-Level Rabi Solution and Rotating-Wave Approximation
We denote the two levels as 1 and 2 where state 2 is the highest in energy (i.e., E20 > E10). Since diagonal matrix elements of H1 cannot cause transitions, we temporarily neglect ⟨1|H1|1⟩ and ⟨2|H1|2⟩. The only additional term we need consider is
| 11 |
Since V12 is the only such quantity for two states, we call it simply V. The Rabi solution is obtained by retaining only the first of the two exponentials in eq 11. The neglect of the second, counter-rotating term is called the rotating-wave approximation (RWA).18,19 The resulting coupled equations are
| 12 |
where δ = ω – ω21 is the detuning. The detuning is zero if the perturbation frequency is equal to the frequency of the transition, in other words, on resonance. If probability is entirely in state 1 at t = 0 (i.e., a1(0) = 1, a2(0) = 0), eqs 12 have an analytic solution
| 13 |
where Ω = [δ2/4 + V2]1/2 is the Rabi frequency.20 The time dependence of the probability of being in the second state is given by
| 14 |
When the perturbing field is on resonance (zero detuning), the maximum probability in state 2 is unity and probability oscillates between the states with frequency 2Ω = 2V and period T = π/Ω. This oscillation is illustrated in Figure 1 where we plot the results of a numerical calculation for two states without making any approximations. For this computation, an electric field equivalent to a light intensity of 1.0 TW/cm2 perturbs a hydrogen fluoride molecule (HF). For this field, V = 0.005494ℏω0 for which the period of the oscillation should be 571.81 in units such that the harmonic oscillation period is 2π (hereafter called natural units) and the harmonic frequency is ω0. This prediction agrees with the numerically determined period to five decimal places. The first half of this oscillation corresponds to stimulated absorption of radiation, but after the maximum is reached, no more absorption is possible, and stimulated emission occurs.
Figure 1.
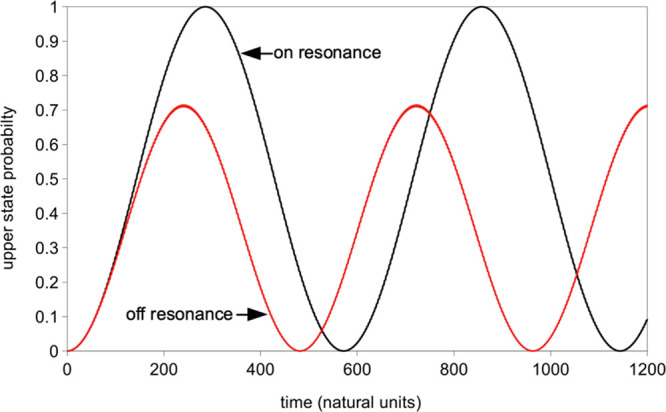
Probability as a function of time for the upper state of a two-level system with V = 0.005495ℏω0 determined by numerical integration of eq 5 showing that the Rabi solution gives the proper frequencies and probability maximum on resonance (black) and off resonance (red line).
The maximum probability in the upper state as a function of radiation frequency has a familiar resonance (Lorentzian) shape. As the detuning deviates from zero in either direction, the maximum probability in the second state decreases, and the Rabi oscillation frequency increases. The half-width of maximum P2 at half-maximum as a function of frequency is 2V, and the maximum value of P2 falls as the inverse of the square of the detuning. The period of oscillation as a function of exciting frequency also has a resonance shape with half-width at half-maximum of 121/2V, falling as the inverse of the absolute detuning. For the detuning used in Figure 1 (δ = −0.007), the predicted period is 482 time units and the predicted maximum probability is 0.7113, both in excellent agreement with the numerical calculation.
How can a photon cause a jump to an energy level for which it does not supply the correct energy (δ ≠ 0)? The answer can come from the time-energy uncertainty principle. The higher level state is occupied for only a limited time and with only a small probability.
Note that the second exponential term in the perturbation described by eq 11 has a detuning of about −1.9 ω0, for which the amplitude of maximum probability would be only 3 × 10⁻⁵. This result justifies our neglect of the counter-rotating term because it is rotating in the wrong direction (wrong sign) and thus is oscillating too fast to cause significant excitation. Its effect, to the extent that the two terms can be treated independently, must be rapidly oscillating and of low amplitude compared to the first term.
A close examination of stimulated absorption and emission into and out of the second state shows the effects of the counter-rotating wave (see Figure 2). In Figure 2, we compare a numerical solution of the differential equations from Figure 1 to the Rabi solution, eq 14, on a zoomed scale for greater detail. The counter-rotating wave causes small oscillations in the absorption that are absent from the Rabi solution. For zero detuning, the slope of P2(t) is always greater than or equal to zero when the second state is absorbing, and less than or equal to zero when the second state is emitting. The counter-rotating wave can be considered to alternate between constructive and destructive interference with the rotating wave. When it interferes destructively with the rotating wave, the slope of P2(t) is zero, and when it interferes constructively, the slope of P2(t) is twice that of the Rabi solution. Similar oscillations are also seen for nonzero detuning (Figure 2). Additional corrections to the Rabi solution can be obtained by perturbation theory using the Rabi solution as the zero-order approximation (see the Supporting Information, Section 3). Although more accurate solutions beyond the RWA may be interesting for high intensities, the counter-rotating wave has little effect on the overall absorption of energy of the system at low to moderate intensity levels, providing only a small amplitude, rapidly oscillating perturbation. Likewise, the diagonal matrix elements of H1 add an additional correction seen as rapid oscillation in the an phases. Our plotted results compare numerically exact results (including both counter-rotating terms and diagonal dipole matrix elements) to analytic results obtained using the RWA. The diagonal matrix elements for a molecule with a permanent dipole moment can be quite large (see the table in the Supporting Information, Section 5).
Figure 2.
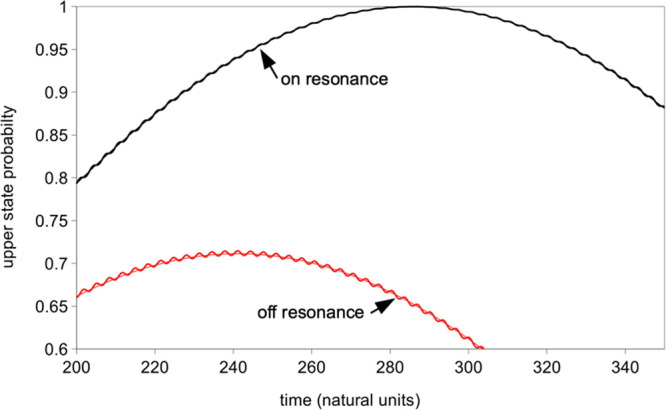
Higher resolution comparison of the Rabi solution (dashed lines) with the numerical solution of the two-level system from Figure 1. The fast oscillations result from the counter-rotating term and diagonal terms in the dipole moment.
Note that the initial phase of the field, γ, does not appear in the probability expression for the Rabi solution. Its sole effect is to change the relative phases by a constant amount (see eq 13). The initial field phase also changes the phase of the counter-rotating wave oscillations, but again, this has little consequence on the overall dynamics for weak to moderate fields.
II.B. Inter-Level Phase Difference Defined
For two states using RWA, the differential equation for the time derivative of a2 is eq 12. In the expression for the time derivative of a2 in eq 12, the phase of the right-hand side is mod(π/2 + φ1 – δt – γ)2π. Likewise, from eq 12 for the time derivative of a1, the phase of the right-hand side mod(π/2 + φ2 + δt + γ)2π. Thus, we define the phase difference between a1 and a2 and their time derivatives as
| 15 |
The effect of state 2 on state 1 is proportional to the projection of the time derivative of a1 on a1, leading to the definition of angle d12 whose cosine determines the rate of change of the length of a1. The effect of state 1 on state 2 is likewise proportional to the cosine of angle d21. Note that d12 = −d21 ± π, so only one of the two phase differences is independent, a kind of quantum analogy to Newton’s Third Law.
The time evolution of the quantities r1, r2, and d21 is expressed by substitution into eq 12 and simplifying:
 |
16 |
Equation 16 clarifies the effect of the interstate phase angles on the dynamics. When −π/2 < d12 < π/2, r1 increases due to stimulated emission from state 2. When π/2 < d12 < 3π/2, r1 decreases due to stimulated absorption into state 2. If d12 ≈ 0, r1 increases most rapidly. If d12 ≈ π, r1 decreases most rapidly. For d12 ≈ ± π/2, the interaction between the two states only serves to change the relative phases. Similarly, V r1 cos d21 is the rate of change of r2 due to interaction with state 1. The solutions to the differential equations of eq 16 may be transformed from eq 13. The form of d21 is given by
| 17 |
The first term in eq 17 is just the phase of a2 (0 or π) determined by the sign of the term sin(Ωt). The second term comes from the phase of the first term of the formula for a1 in eq 13. We have defined d21 so that all other contributions cancel. Equation 17 agrees well with the results of numerical calculations exhibited in figures and which do not use the RWA. For numerical calculations, it is useful to define interstate phase differences in terms of the cn variables using eq 15 and eq 9:
| 18 |
In Figure 3, we have plotted d21 as a function of time for two states with the field on resonance (ω = ω21 or δ = 0) (black line). Again, this plot was generated numerically without the RWA. The relative phase, d21, remains near 0 during the first half of the Rabi cycle (absorption), and then d21 abruptly shifts to near π for the second half of the cycle. This abrupt shift can be attributed to the term with r1 in the denominator in the second line of eq 16. When r1 passes near zero, d21 changes by π. The high frequency oscillations in Figure 3 about 0 and π (barely visible on the scale of the figure) are primarily due to diagonal terms in eq 5 because of the large permanent dipole moment of HF. Except for these oscillations, eq 17 is very accurate.
Figure 3.
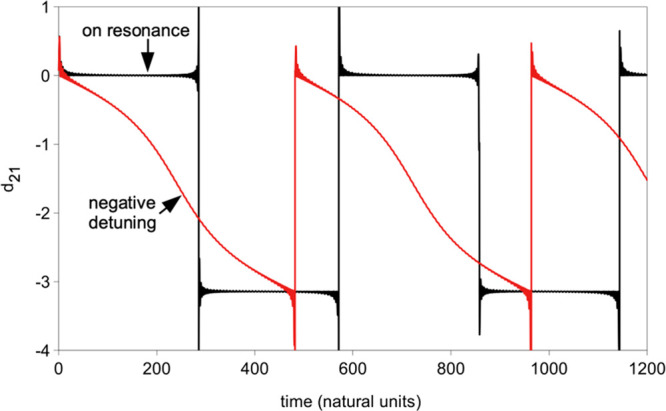
Quantum interstate phase difference, d21, versus time. When the perturbation is resonant (black line), the phase switches between 0 and π for alternate halves of the Rabi oscillation. When the perturbation is not resonant, the d21 drifts out of an absorption relationship before complete population inversion can occur (red line).
When δ < 0, the first term in eq 16, line 2, causes d21 to drift downward from zero until it makes a rapid shift back to zero when it reaches −π (see red line in Figure 3) due to the second term in eq 16, line 2. When δ > 0, d21 drifts upward to π where it makes a shift downward by π (not shown). In all three of these cases, the rapid shifts by π can be understood as due to a change in either φ1 or φ2 through π as the corresponding amplitude passes through (or near to) zero in the complex plane.
This analysis explains why absorption is limited when the perturbing frequency is off-resonant: the two states drift out of proper phase relationship for absorption before much probability is transferred. In fact, when d21 becomes greater than π/4 or less than −π/4, the interaction acts primarily to drive the phases apart and limit absorption even more (see the rapid change in d21 near the midpoint of the off-resonance absorption or emission process in Figure 3). If two states remain in phase (because of zero detuning), the value of P2 eventually reaches unity. However, when the phases drift apart due to nonzero detuning, the maximum probability is less than one. In other words, reduced excitation occurs when relative phases stay in proper relationship for a shorter time.
The relationship between quantum phases represented by d21 corresponds in detail to the phase relationship between coupled classical oscillators which undergo classical beats. This correspondence is reviewed in Supporting Information, Section 4. This same correspondence with classical oscillators is shown in the period for energy exchange, the maximum probability in the excited state for quantum systems, and phase reversals by π in opposite halves of the beat cycle. The dynamics of single and multiphoton processes can be easily and clearly understood in terms of this correspondence between the quantum Rabi cycles and classical beats. The clearer analogy may actually be the classical-quantum correspondence for coupled oscillators where the field is treated as a second oscillator in a conservative system (similar to a dressed state picture);21 however, we confine the present discussion to a forced oscillator view of the excitation for simplicity.
II.C. Geometric Complex Phase Plane Defined
The importance of the interlevel phase difference, d21, is illuminated if we plot the phase in the complex plane with
| 19 |
so r2 cos d21 is plotted on the x-axis (real axis), and r2 sin d21 is plotted on the y-axis (imaginary axis) as in Figure 4. In this polar representation, the radial coordinate is r2, and the angular coordinate is d21. During the first half of the Rabi cycle with a resonant perturbation, d21≈ 0 and the graphed point moves to the right along the real axis as absorption occurs. (A complementary polar plot of r1 and d12 would start with r1 = 1 and d12 = π with the graphed point moving rightward along the negative real axis.) When r2 reaches its maximum, r1 ≈ 0 and φ1 decreases almost instantly from π to 0. Consequently, d12 changes from π to 0, and d21 changes from 0 to π. The second half of the Rabi cycle proceeds with the two graphs exchanging roles. The small oscillations in Figure 4 are primarily due to the diagonal dipole terms whose effects are magnified when r1 is very small because of the large oscillations in φ1.
Figure 4.
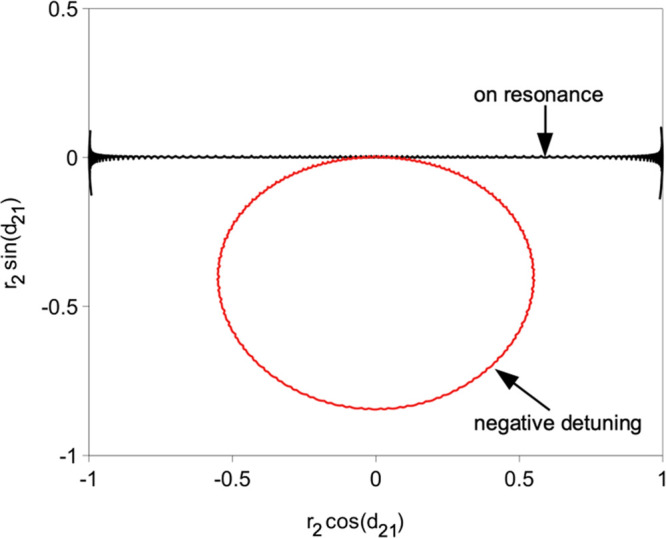
Geometric quantum phase plane showing the phase differences in Figure 3 as the polar angle and (P2)1/2 as the radius. Angles between – π/2 and + π/2 indicate absorption. Angles between π/2 and 3π/2 indicate emission.
In summary, when the field is exactly on resonance (δ = 0), d21 oscillates between zero and π in alternate halves of the Rabi oscillation. If the detuning is negative (ω < ω21), the graphed point circles downward and clockwise through negative angles in the plane (see Figure 4). If the detuning is positive (ω > ω21), the graphed point circles upward and counterclockwise through positive angles in the complex plane (not shown). This circling motion is due to the term δ = ω – ω21 in the definition of d21, shown in the first term on the right-hand side of line 2 in eq 16.
Regardless of the sign of δ, the position of the point z describes the system geometrically. When the point is in quadrants I and IV, absorption takes place from the first state into the second state, and (in the absence of other states) r2 increases. When z is in quadrants II and III, emission from the second state to the first state occurs, and r2 decreases. Furthermore, the square of the radial distance is the probability of the molecule being in the second state. A phase shift of π is caused by either of the graphed points passing near the origin and represents a reversal of the relative phase analogous to two coupled oscillators which alternatively drive each other in classical beats with periodic phase reversal.22 This construction provides a geometric picture of the phase relationship between two states involved in a transition and can be augmented to show the time evolution which is not seen in the polar plots by including time as a third dimension, in which case the off-resonance curve becomes a spiral and the resonant curve is a sawtooth line.
III. Multiphoton Processes Involving Three or More Levels
The possibility of multiphoton processes was first discussed by Göppert-Mayer.23 A two-photon absorption usually involves two photons of the same frequency, ω.24 Sometimes, two photon excitation is described as a simultaneous absorption of two photons; however, it has also been described as absorption of one photon to an energy halfway to the second excited state, but not exactly into the first excited state (a virtual state),25 followed quickly by absorption of a second photon into the second excited state (see Figure 5). In fact, the dynamics of a two-photon process as described by the time-dependent Schrödinger equation, eq 1, is not simple and involves phase relationships between the states similar to those described above for two states. Interlevel phase differences defined in the previous section illuminate this important but easily visualized relationship.
Figure 5.
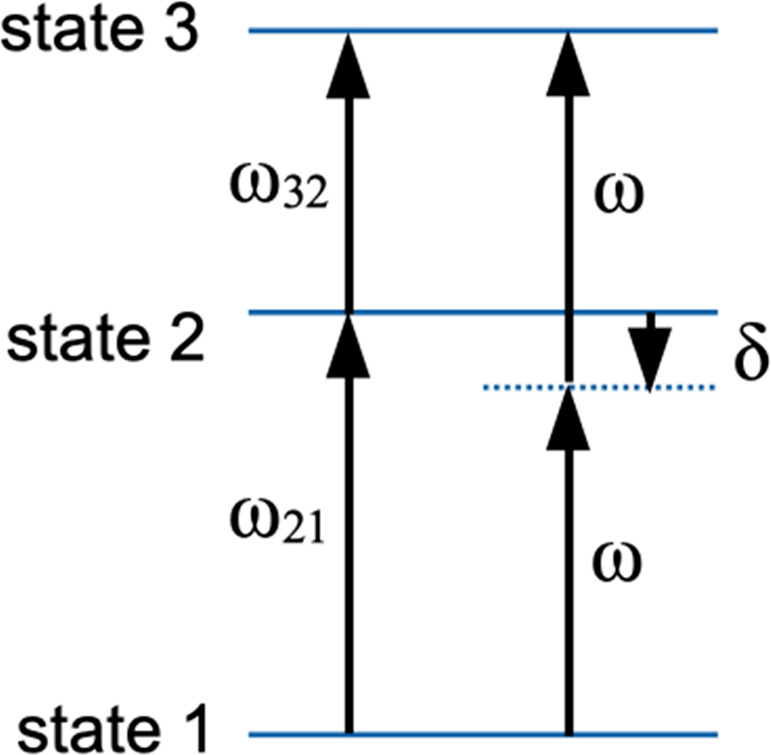
Energy states in a two-photon absorption. The excitation initially is to an energy halfway from the ground state to the second excited state and thence into the second excited state. The first excited state must be near the “virtual state,” state 1. For the Morse oscillator, the energy gap between the ground and the first excited state is greater than between the first and second excited states so the detuning is negative.
Some would argue that eq 1 describes only the probability of an ensemble as a function of time and does not describe the dynamics of absorption by individual molecules. We leave this discussion to experts in quantum measurement theory and philosophy of science. We will concentrate on the solution and clarification of the dynamics described by eq 1 and await experiments to confirm or refute the results. Electron shelving experiments,1−3 for example, involve single atoms and cannot easily be described using optical Bloch equations and density matrices of ensembles.
Temporarily neglecting again any diagonal elements of H1 (which do not cause transitions) and ⟨1|H1|3⟩ because its detuning is large, the differential equations, eq 5, for three states excited by a monochromatic field at the two-photon resonance frequency (meaning 2ω = ω21 + ω32, see Figure 5) are
 |
20 |
where we have used the RWA and the following notation: H(1)12 = ℏV1ei(ωt+γ), H(1)23 = ℏV2ei(ωt+γ), H(1)21 = H(1)12*, H(1)32 = H(1)23*, and δ = ω – ω21 = ω32 – ω. These equations yield the following solutions if a1(0) = 1
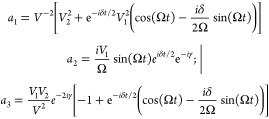 |
21 |
where Ω = (δ2/4 + V2)1/2, and V = (V12 + V22)1/2. The probability of being in each state is given by
 |
22 |
The probability in the third state includes three frequencies: a slow oscillation (frequency Ω – |δ|/2) that describes the overall absorption of probability into the third state; a second oscillation frequency that is due to the interaction of the second state with its neighbors (frequency 2Ω) and is similar to the Rabi frequency in the two level system; and a third oscillation frequency (Ω + |δ|/2) which may be smaller or larger than 2Ω. Figure 6 shows about two oscillations of the low frequency oscillation as determined numerically (without making the RWA or neglecting diagonal matrix elements). For this simulation, V1 was the same as in Figures 1–3 and V2 = 0.007653ℏω0. For these parameters, the predicted slow oscillation has period 1775 time units, in good agreement with the simulation.
Figure 6.
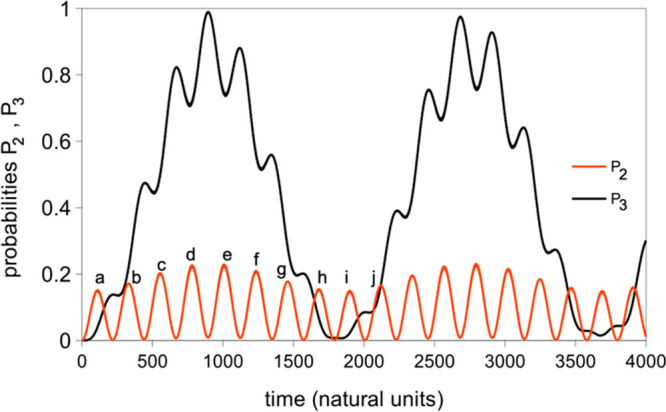
Probability in the second and third states shown in Figure 5 versus time during a two-photon absorption as determined numerically. Population in the intermediate state oscillates with a period of approximately 223. The first 10 probability maxima are labeled a–j for future reference. The probability in the third state oscillates with a maximum near 1.0 with a period approximately 1840. The field frequency in these units is 0.936554ω0.
The probability in state 2 in Figure 6 oscillates with a low amplitude oscillation similar to that in a two-level system excited off-resonance. The major difference between P2(t) from eq 14 for two levels and P2(t) from eq 22 for three levels is that the one-photon Rabi frequency, Ω, for the latter case involves both coupling matrix elements V1 and V2. In addition, the numerically determined P2(t) has a modulation frequency Ω – |δ|/2 in the amplitude of the oscillation of frequency 2Ω, which is not present in the RWA solution, eq 22. The probability P3(t) undergoes a low frequency oscillation similar to the Rabi oscillation of the two-level problem on resonance (similar in that the probability reaches nearly unity each oscillation). Superimposed on this low-frequency oscillation are faster oscillations of frequency 2Ω which correspond to the oscillations in P2(t). When P2(t) is significant, the relative interlevel phases can either act to cause stimulated emission back to the initial state or further excitation up to the higher state. If these phases were random, one would expect that each would be equally likely, and that the odds of accumulating probability into the upper state would be remote. The fact that a periodic oscillation occurs as exhibited in Figure 6 shows that the mechanism of multiphoton excitation combines the interstate phases precisely in such a way to make the absorptions sequentially reinforcing.
III.A. Inter-Level Phase Differences with Three Or More States
The interlevel phase difference, dnk, can be generalized for more than two states as was done in eq 21 by expressing the solutions in polar form and specifying the phase of the term containing ak on the right-hand side of eq 5 less the phase of an onto which it is projected
 |
23 |
where δij = ω – ωij. When specified in this form, dnk represents the phase difference between an and the time derivative of an due to the term containing ak in eq 5. The magnitude of the term multiplied by cos dnk then gives the time derivative of rn due to interaction with the state ak. Note also that dnk + dkn = π. For the three state problem of the previous section, the equations may be reduced to the following set (within the RWA):
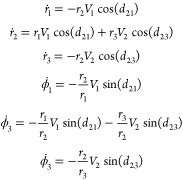 |
24 |
The definitions of d21 and d23 from eq 23 can be used to obtain their time derivatives
 |
25 |
where we have assumed two-photon resonance where δ = δ21 = −δ32 (note that δ is negative for the Morse oscillator example). Unlike the two-state model described by eq 16, with three states there are two terms that affect each phase difference.
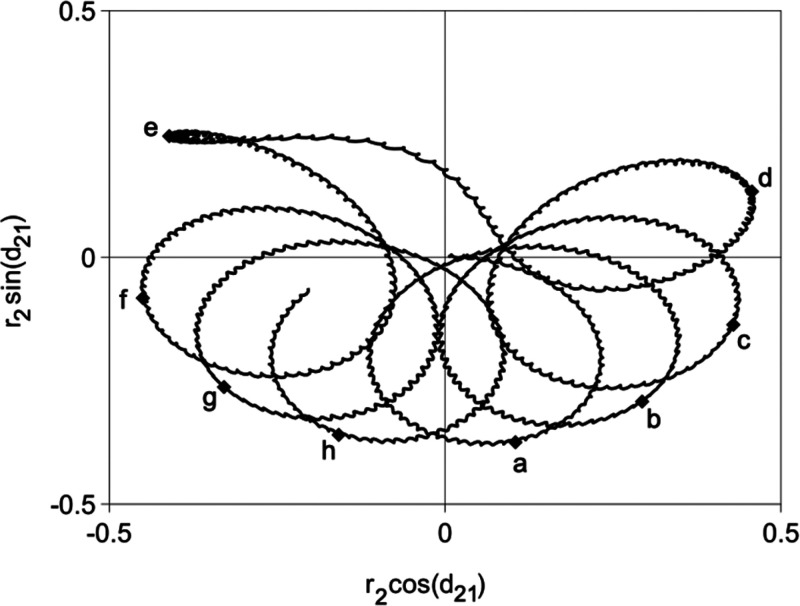
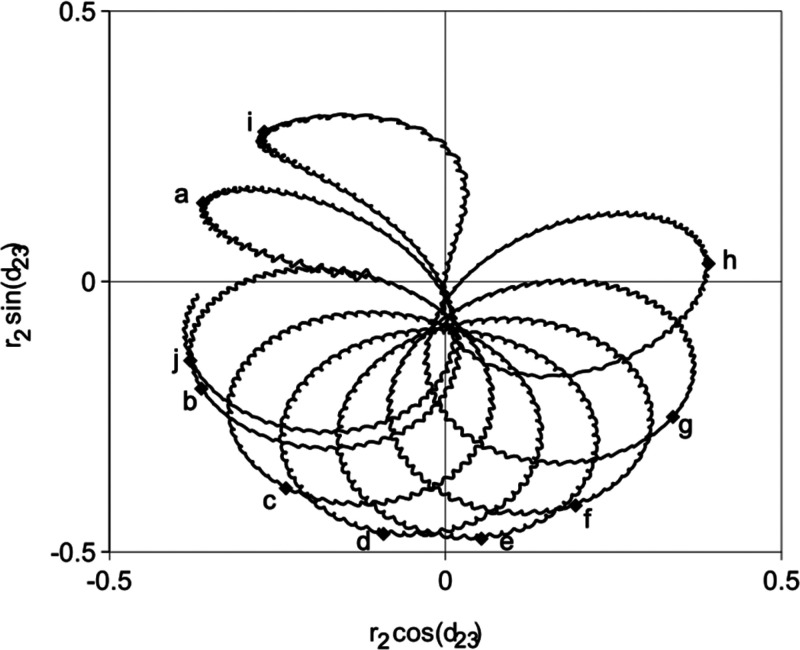
To understand the phase relationships in the two-photon absorption, we examine the motion of two points in the complex a2 plane. Complex amplitudes were obtained numerically for the first three states of the Morse oscillator from the numerical results was used to produce Figure 6. In Figure 7 we plot d21 and d23 as a function of time. In Figures 8 and 9, r2eid21 and r2eid23 are plotted in the complex plane to show the relative phases. Since δ is negative, d21 and d23 have general negative slope (see Figure 7) in a time plot. For the same reason, d21 and d23 generally circle clockwise in the complex plane (Figures 8–9). Whenever r2 approaches zero, d21 and d23 have a simultaneous positive jump in the time plot (Figure 7). However, eq 25 has an additional coupling term not found in the corresponding eq 16. If it were not for the term in eq 25, line 2, involving d23, r2eid21would continue to execute a closed circle in the complex plane. The additional term causes the circle to precess in a direction dependent on the sign of sin d23. The motion of d23 is likewise affected by the term involving d21. The result of these coupling terms in the complex plane is a precession of the circling motion in the positive direction through which the positive jumps by approximately π more than offset the negative drift and the resultant clockwise circling.
Figure 7.
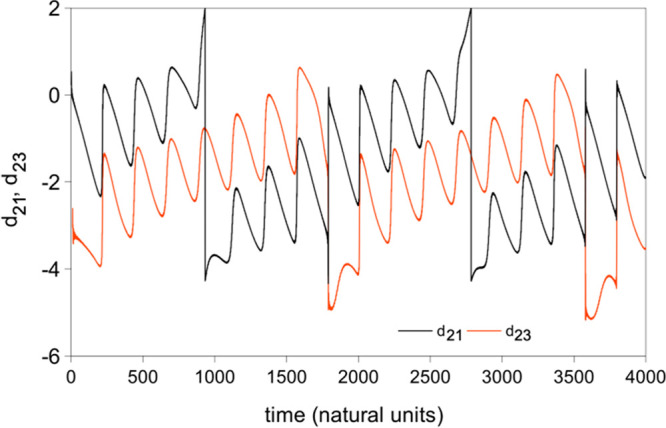
Phase difference d21 (black line) and d23 (red line) versus time for the same calculation as Figure 6. Note the phase reversals twice each Rabi cycle.
Figure 8.
Geometric phase difference plot of z21 for the same calculation as in Figures 6 and 7. Points labeled a–h correspond to maxima similarly labeled in Figure 6. Motion in time describes a clockwise circling with a superimposed counterclockwise precession. Note the shift in phase by nearly π between d and e.
Figure 9.
Geometric phase difference plot of z23 for the same calculation as Figures 6–7. Points labeling a–j correspond to maxima similarly labeled in Figure 6. Motion in time describes a clockwise circling with a superimposed counterclockwise precession. Note the shift in phase by nearly π between h and i.
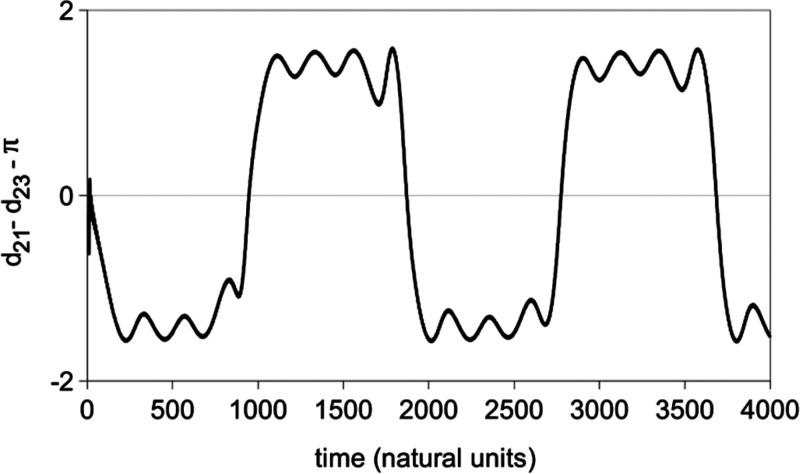
A third type of motion occurs when either r1 or r3 approach zero. When this occurs, it causes a jump by π in the corresponding phase difference and reverses the relationship of the two interlevel phase differences. When state 2 is absorbing from state 1 and emitting into state 3, d21 remains + π/2 ahead of d23. When the system changes from stimulated absorption into the third state to stimulated emission from the third state (at t ≈ 940 time units in Figures 6–9), the relationship between d21 and d23 changes. Where d21 had lead by π/2, it jumps + π and then trails d23 by π/2, and d23 now leads. This is clearly illustrated by the graph of the difference in phase differences (see Figure 10), where d21 – d23 – π is plotted as a function of time. In Figure 10, it is easy to see that the difference between the phase differences oscillates between + π/2 and – π/2 just as d21 – π/2 does in the one-photon case shown in Figure 3. During absorption into the third state, the difference d21 – d23 – π is negative and near – π/2. This plot shows, now for a two-photon absorption, the clear correspondence with classical beats reviewed in Supporting Information, Section 4. When P3(t) nears its maximum of unity and stimulated emission begins, the difference d21 – d23 – π jumps by π and oscillates around + π/2. Throughout the cycle, the two phase differences remain π/2 out of phase, and only one of the states is in phase to absorb probability from the intermediate state. The oscillations in r2 stay in phase because the angle drift term is the same for both points, δ. Thus, the fact that δ21 = −δ32 = δ keeps the absorption-emission cycle in phase until a π shift occurs to reverse the phase relationship.
Figure 10.
Quantity d21 – d23 – π versus time for the numerical integration in Figures 6 and 7 showing the phase reversal behavior between quantum state phase differences that allows the coherent two-photon absorption process to occur.
When the laser frequency is not adjusted to the resonant frequency for two-photon absorption then a second detuning may be defined as
| 26 |
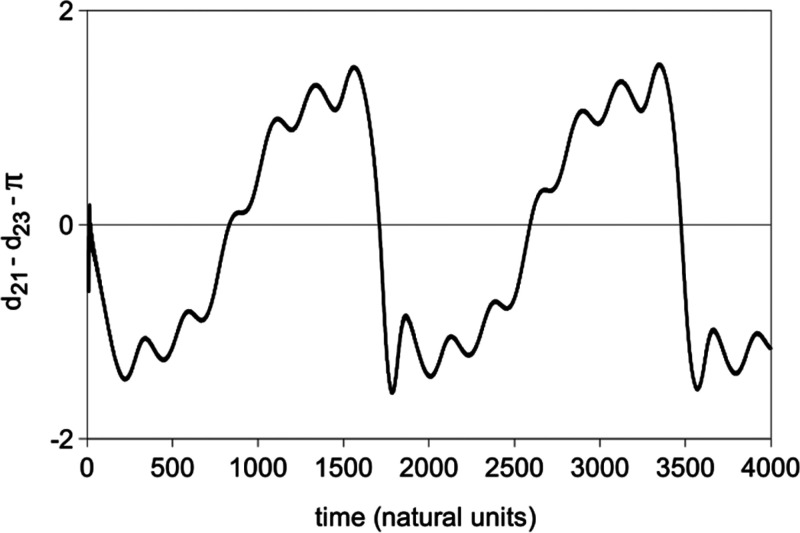
When δ̃ is positive, the system tends to act more and more like a two level system since δ21 is closer to zero (for negative detuning), increasing the maximum probability in state 2. At the same time, δ32 gets larger so the probability in state 3 quickly decreases. Because δ21 is still negative, d21 drifts downward in time, but at a different rate than d23. The overall phase angle difference, d21 – d23, drifts upward in time and makes more and more π shifts as drift due to δ̃ allows less and less probability to be absorbed into the third state (see Figure 11). Because P3(t) does not come close to one as δ̃ increases, the π shifts in d21 do not occur. The effects of the third state, however, do cause the phase plots in the complex plane to go more gradually through + π/2 or – π/2.
Figure 11.
Quantity d21 – d23 – π versus time showing the phase relationships between quantum state phases when the field is slightly detuned from the two-photon absorption resonance. The upward drift is due to detuning from the 2-photon maximum. The field frequency is 0.937148 ω0.
If δ̃ is negative (not shown), the response is similar. The π jumps in d21 stop and those in d23 become more frequent. Because the detuning δ is already large for the one photon absorption into the second state, P2(t) drops off quickly as does the radius of the real-imaginary plane plot of d21. It circles close to zero in a negative direction. This behavior corresponds again to that of classical oscillators as reviewed in Supporting Information, Section 4.
The frequency of beating and the maximum probability in state 3 have behavior similar to the two-state Rabi frequency defined eq 13 and eq 14. For two-photon resonance, however, the frequency half-width at half-height of the maximum value of P3 is approximately V1V2/δ, and the period of low-frequency oscillation as a function of driving frequency has half-width at half height approximately (3)1/2V1V2/δ. Even though classical systems do not exhibit “multiphoton transitions”, the resonance analogy to classical beats is still clear in the phase reversals and resonance shapes of both period and excitation probability plots. Moreover, the analogy to classical beats can be generalized to systems with more than three levels, For example, in preliminary calculations, we have found that four-state three-photon absorption also shows equally strong correspondence with classical coupled oscillator beats. In this case, the overall phase angle showing the beats is d21 – d23 – d34.
IV. Discussion and Comparison with Other Multiphoton Models
The possibility for multiphoton absorption is often presented using a conservation of energy argument stating that the sum of the energies of the two photons must add up to the total energy difference between the initial and final energy levels. Because the energy of a quantum state controls the phase of the Schrödinger amplitudes (eq 2 or 5), we have recast this fact as an argument in terms of frequency and phase differences. The proper phase relationship is maintained only when the driving frequencies are adjusted to maintain proper phase. Thus, the geometrical phase difference we have defined does not contain any new physics; rather it is a conceptual tool to aid in heightening intuition concerning the processes.
The Feynman–Vernon–Hellwarth (pseudospin vector) treatment26 is a common, useful picture that describes the absorption of light between two levels in terms of a three-dimensional vector precessing and nutating under the perturbation resulting from the radiation. Hioe and Eberly27 have generalized the Feynman–Vernon–Hellwarth picture from the SU(2) picture appropriate for a two level system to the full SU(N) picture for an N-level system. This picture requires an 8-dimensional space for three levels and N2 – 1 dimensions for the general N-level system. Many elegant results may be derived using this formalism,28 but the phase difference construction defined here may be advantageous in that it requires only two or three (if time is included) dimensional constructions more amenable to graphical presentation and is more intuitive than the coherence vectors defined by Hioe and Eberly.
The description of multiphoton absorption described here is consistent with the time-dependent Schrödinger equation but may be claimed to be inconsistent with the granularity of radiation fields as described as a collection of discrete photons. The common perception of multiphoton processes is that of several discrete photons being absorbed more or less simultaneously. The picture described here is of a continuous process taking place over a relatively long time, perhaps hundreds or thousands of field oscillations—and which requires suitable phase relationships to be maintained throughout. If the physics described by the phase difference picture is correct, the phase stability of radiation fields that induce multiphoton transitions must be maintained throughout the excitation process to induce population inversion. A phase change in either the field or the system will upset the phase relationship required to continue the process and inhibit excitation to the highest state. However, if multiphoton processes can be detected experimentally in a system with short phase coherence time (whether limited by the phase coherence time of the field or by collisions that destroy the phase of system states) compared to the time for population inversion, our picture may need revision. However, experiments by Zou et al.29 have shown the importance of phase relationships in laser fields, and calculations by Pollnau30 show phase relationships in emission and absorption similar to our results. In addition, experiments by Minov et al.3 and many others1,2 and can often be interpreted in terms of a deterministic dynamics for quantum transitions similar to those we have demonstrated here.
Electron shelving experiments on trapped, single atoms rely on interrupted fluorescence seen at right angles to the exciting field’s propagation. This fluorescence is at least partially due spontaneous emission because conservation of momentum arguments confine stimulated emission to the direction of the field propagation. Thus, our analysis concerning stimulated emission has little application to such experiments. In addition, phase information is much more difficult to access experimentally than energy level information. However, our analysis may be more directly useful for those exploring numerical simulation of quantum dynamics for which phase information is accessible.
Acknowledgments
This work was supported by a grant from the Brigham Young University College of Physical and Mathematical Sciences. J.S.W. was also the recipient of a BYU Research and Creative Arts Award. We acknowledge useful comments, suggestions, and encouragement by Prof. Karl Sohlberg, Drexel University.
Supporting Information Available
The Supporting Information is available free of charge at https://pubs.acs.org/doi/10.1021/acsomega.2c04554.
Morse oscillator as an illustrative model for vibrational excitation; derivation of electric dipole coupling; perturbation theory beyond the rotating wave approximation; description of beats between classical coupled oscillators; list of calculated hydrogen fluoride dipole moment matrix elements (PDF)
Author Present Address
† A2 Biotherapeutics, Agoura Hills, CA 91301
The authors declare no competing financial interest.
Supplementary Material
References
- Dick R. Quantum jumps, superpositions, and the continuous evolution of quantum states. Studies in History and Philosophy of Modern Physics 2017, 57, 115–125. 10.1016/j.shpsb.2016.10.003. [DOI] [Google Scholar]
- Itano W. M.; Bergquist J. C.; Wineland D. J. Early observations of macroscopic quantum jumps in single atoms. Int. J. Mass Spectrom. 2015, 377, 403–409. 10.1016/j.ijms.2014.07.005. [DOI] [Google Scholar]
- Minev Z. K.; Mundhada S. O.; Shankar S.; Reinhold P.; Gutiérrez-Jáuregui R.; Schoelkopf R. J.; Mirrahimi M.; Carmichael H. J.; Devoret M. H. To catch and reverse a quantum jump mid-flight. Nature 2019, 570, 200–204. 10.1038/s41586-019-1287-z. [DOI] [PubMed] [Google Scholar]
- Steinfeld J. I.Molecules and Radiation, 2nd ed.; MIT Press: Cambridge, MA, 1985. [Google Scholar]
- Herzberg G.Infrared and Raman Spectra; Van Nostrand: New York, 1945. [Google Scholar]
- Schiff L. I.Quantum Mechanics, 3rd ed.; McGraw-Hill: New York, 1968; p 397. [Google Scholar]
- Landau L. D.; Lifshitz E. M.. Quantum Mechanics; Pergamon: New York, 1977. [Google Scholar]
- Percival I. C. Semiclassical Theory of Bound States. Adv. Chem. Phys. 1977, 36, 1–61. [Google Scholar]
- Shirts R. B. Use of Classical Fourier Amplitudes as Quantum Matrix Elements: A Comparison of Morse Oscillator Fourier Coefficients with Quantum Matrix Elements. J. Phys. Chem. 1987, 91, 2258–2267. 10.1021/j100293a011. [DOI] [Google Scholar]
- One may equivalently use the Heisenberg picture:; Shore B. W.The Theory of Coherent Atomic Excitation; Wiley, New York, 1990; p 385. [Google Scholar]
- For example, see:; Levine I. N.Quantum Chemistry, 4th ed.; Prentice-Hall: New York, 1991; p 12. [Google Scholar]
- Reference (11), p 250.
- Cohen-Tannoudji C.; Diu B.; Laloë F.. Quantum Mechanics; Wiley, New York, 1977, Vol. 2, p 1287. [Google Scholar]
- Shirley J. H. Solution of the Schrodinger Equation with a Hamiltonian Periodic in Time. Phys. Rev. 1965, 138, B979–B987. 10.1103/PhysRev.138.B979. [DOI] [Google Scholar]
- Shampine L. F.; Gordon M. K.. ODE. Computer Solution of Ordinary Differential Equations; Freeman, San Francisco, 1975. [Google Scholar]
- Reference (6), p 413.
- See ref (10) for an exhaustive collection of model systems and examples.
- Reference (4), p 17.
- Reference (10), p 235.
- Some authors differ from our definition by a factor of 2. In our definition, the Rabi frequency is the frequency of amplitude oscillation. The frequency of probability oscillation is twice this frequency and is called the Rabi frequency by some authors.
- Reference (10), p 216.
- Shirts R. B.; Davis T. F. Classical Resonance Analysis of Conservative Models of Infrared Multiphoton Absorption. J. Phys. Chem. 1984, 88, 4665–4671. 10.1021/j150664a045. [DOI] [Google Scholar]
- Göppert-Mayer M. On elementary processes with two quantum jumps. Ann. Physik 1931, 401, 273–294. 10.1002/andp.19314010303. [DOI] [Google Scholar]; english translation. Ann. Phys. (Berlin, Ger.) 2009, 521, 466 - 479.10.1002/andp.200952107-804
- See, however:; Dibble B. G.; Shirts R. B. Theoretical Prediction of Ultrahigh Vibration Excitation Using Picosecond IR Pulse Trains: Coherent Absorption of Several Photons Each of Different Frequency. J. Chem. Phys. 1991, 94, 3451–3467. 10.1063/1.459767. [DOI] [Google Scholar]
- Reference (10), p 809.
- Feynman R. P.; Vernon F. L. Jr.; Hellwarth R. W. Geometrical Representation of the Schrödinger Equation for Solving Maser Problems. J. Appl. Phys. 1957, 28, 49–52. 10.1063/1.1722572. [DOI] [Google Scholar]; See also ref (4), pp 337–347, and ref (3), pp 447–453.
- Hioe F. T.; Eberly J. H. N-Level Coherence Vector and Higher Conservation Laws in Quantum Optics and Quantum Mechanics. Phys. Rev. Lett. 1981, 47, 838–841. 10.1103/PhysRevLett.47.838. [DOI] [Google Scholar]
- Hioe F. T. Analytic solutions of density-matrix evolutions with the use of Racah tensorial decompositions. Phys. Rev. A 1984, 30, 3097–3106. 10.1103/PhysRevA.30.3097. [DOI] [Google Scholar]; See also references cited therein.
- Zou J.; Hu X.; Cheng G.; Li X.; Du D. Inhibition of two-photon absorption in a three-level system with a pair of bichromatic fields. Phys. Rev. A 2005, 72, 055802. 10.1103/PhysRevA.72.055802. [DOI] [Google Scholar]
- Pollnau M. Phase aspect in photon emission and absorption. Optica 2018, 5, 465–474. 10.1364/OPTICA.5.000465. [DOI] [Google Scholar]
Associated Data
This section collects any data citations, data availability statements, or supplementary materials included in this article.


