Abstract
Epidemiological and toxicological studies continue to demonstrate correlative and causal relationships between exposure to traffic-related air pollution and various metrics of adverse pulmonary, cardiovascular, and neurological health effects. The key challenge for in vivo studies is replicating real-world, near-roadway exposure dynamics in laboratory animal models that mimic true human exposures. The advantage of animal models is the accelerated time scales to show statistically significant physiological and/or behavioral response. This work describes a novel exposure facility adjacent to a major freeway tunnel system that provides a platform for real-time chronic exposure studies. The primary conclusion is that particulate matter (PM) concentrations at this facility are routinely well below the National Ambient Air Quality Standards (NAAQS), but studies completed to date still demonstrate significant neurological and cardiovascular effects. Internal combustion engines produce large numbers of ultrafine particles that contribute negligible mass to the atmosphere relative to NAAQS regulated PM2.5 but have high surface area and mobility in the body. It is posited here that current federal and state air quality standards are thus insufficient to fully protect human health, most notably the developing and aging brain, due to regulatory gaps for ultrafine particles.
Keywords: traffic related air pollution, near-roadway exposure, real-time exposure studies, chronic inhalation exposure, freeway tunnel systems, health effects of air pollution
Graphical Abstract
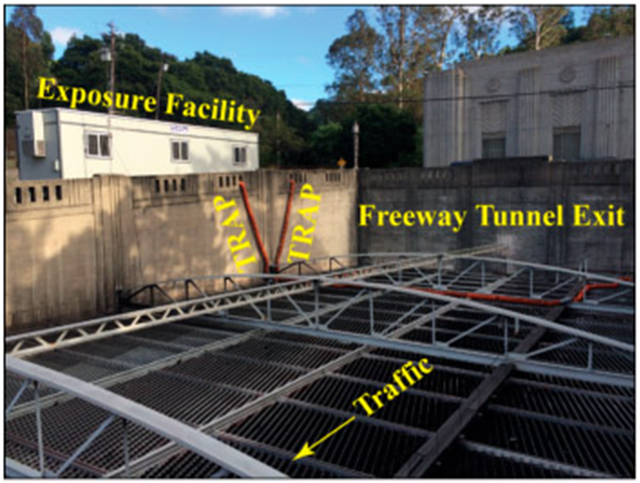
INTRODUCTION
Living near heavily trafficked roadways poses severe health risks. Epidemiological studies have associated living near roadways with a wide range of diseases and adverse health indicators including low birth weight,1 preterm birth,2 breast cancer,3 childhood central nervous system tumors,4 childhood leukemia,5 asthma,6 reduced lung function,7 myocardial infarction,8 atherosclerosis,9 Parkinson’s disease,10 autism spectrum disorder (ASD),11,12 dementia,13,14 and Alzheimer’s disease (AD).15,16 As populations worldwide are increasingly concentrated in urban areas, the number of people exposed to traffic-related air pollution (TRAP) increases with concomitant concern for the health effects associated with such exposures. These and many other epidemiological studies demonstrate associations between TRAP exposure and adverse health effects yet causal links are needed. Are the health effects related to TRAP exposure or are there other confounders? Which vehicles are responsible: light-duty cars or heavy-duty trucks? Which pollutants are responsible: particles, gases, or potential synergies between them? How do these pollutants interact with cells, tissues, and organs to lead to these observed health impacts? How can we faithfully model air pollution exposure in animal models to explore these many questions? Answering these questions can lead to mitigations, such as appropriate regulation.
Air pollution exposures have been modeled in several ways that have been used to assess their toxicity. Bolus exposures, such as insufflation, instillation, and aspiration, have been used to evaluate the toxicity of aerosol particles collected on filters or impactors in rodent models.17 These exposures are more acute than ambient ones and at substantially higher dosing concentrations, they do not include gaseous copollutants, and anesthesia is required, which may elicit outcomes in the developing brain that obscure neurodevelopmental outcomes arising from the exposure. Yet, bolus exposures have value in screening for toxicity when ambient exposures are not possible.18
Particle concentrators have been used to expose humans and animal models to air pollution wherein the particle concentration has been enhanced by a factor of 10–20.19,20 Since the particles are concentrated, health outcomes are expressed sooner or more intensely then at ambient concentrations, which is the intention. These concentrated ambient particles (CAPs) exposures do not concentrate all particle sizes to the same level and do not concentrate vapor copollutants21 so the concentrated mixture does not necessarily represent the ambient mixture. These particle concentrators can operate for extended periods of time, but it is not realistic to operate them for months at a time which is needed for the health effects of chronic exposures.
Air pollutants can also be generated in the laboratory to mimic emissions from individual sources.22-25 The concentrations of these exposures are typically much higher than ambient, which like CAPs has the potential benefit of amplifying health outcomes and eliciting them sooner, and the particle and gas mixtures represent a specific source that can then be regulated if toxic. Yet, laboratory generated emissions do not undergo atmospheric processing or include copollutants, both of which may alter their toxicity. TRAP is a complex mixture of gases and particle from real-world vehicular fleet mixtures that is not readily modeled in the laboratory.
To overcome the shortcomings of these more conventional exposure paradigms, we have built a facility immediately adjacent to a major freeway tunnel system specifically for exposing murine models in real-time to real-world TRAP. It is intended to model exposure dynamics—that is, the frequency, timing, and duration of exposure as a function of pollutant concentration and composition—for people living, working, or going to school in heavily trafficked, near-roadway environments. Emissions from this tunnel system have been studied for decades to quantify emission factors for current fleet mixtures.26-35 Several published studies have been completed at this facility so far showing significant neurological and cognitive impacts.36-39 These types of studies would not be possible without this facility. The purpose of this paper is to quantify the pollutant exposures during experiments conducted from August 2017 to January 2019, prior to the dramatic shifts in traffic occurring during the COVID shutdown.
MATERIALS AND METHODS
Caldecott Tunnel Exposure Facility (CTEF).
This is an Institutional Animal Care and Use Committee (IACUC) approved core exposure facility capable of accommodating acute and chronic TRAP inhalation exposure studies. The CTEF is located on a 3200 sq. ft. Caltrans-owned vacant lot immediately adjacent to the eastbound exit of the Caldecott tunnel system (latitude = 37.861, longitude = −122.209). Air drawn from bores 1 and 2 is delivered unaltered and in real-time to exposure chambers housed inside an onsite vivarium. Emissions control technologies are used to provide clean filtered air (FA) for negative control groups. The Caldecott tunnel consists of four bores with two-lanes per bore and is situated along State Route 24 connecting Contra Costa County suburbs east of the Berkeley Hills to the Oakland and San Francisco urban centers to the west. Two bores service eastbound traffic (bores 1 and 2) and the other two westbound (bores 3 and 4). The bores are approximately 1.1 km long with a 4.2% incline from west to east. Commuters head west into the city for work in the morning and then back east toward home in the evening. Traffic volumes through bores 1 and 2 during peak evening commute are roughly 3000 and 4000 vehicles/hour, respectively.27-30 Schematics of the tunnel ventilation systems can be found elsewhere.26 A photo montage of the facility is shown in Supporting Information (SI) Figure S1 and a brief, systems-level synopsis follows.
Onsite Office Trailer.
As shown in SI Figure S2, a 3-room 400 sq. ft. mobile office trailer that houses (1) an instrumentation room for all air sampling and measurement instrumentation, sampling ports, sampling train, and computer systems; (2) a vivarium with two large exposure chambers; and (3) general laboratory space for supply storage, animal care, and other activities.
TRAP Supply Lines.
Independent sampling ports are situated immediately above the exits of bores 1 and 2 on top of a honeycomb-style shade grating, as shown in the upper left-hand panel of SI Figure S1. The ports are plumbed across the shade grating, up the sides of the parapet wall and through holes at the top of the wall to the air flow control systems beneath the office trailer. The outlet of the air flow control system is plumbed up the trailer wall and to the interior through flanged ports secured to the boarded-up window of the instrumentation room. These supply lines are then split into multiple sampling ports: (i) exposure chambers in the vivarium, (ii) PM samplers in the instrumentation room, and (iii) sampling train for continuous emissions monitoring.
Clean Filtered Air (FA) Supply Lines.
Clean filtered air for negative control exposure groups originates in a storage shed immediately adjacent to the office trailer and is subjected to a series of emissions control technologies before being plumbed to the air flow control systems beneath the trailer and then through the window to the interior sampling ports, identical to the TRAP supply lines. Emission controls include coarse filtration for removing large debris and dust, inline activated carbon for removing volatile organic compounds (VOCs), barium oxide-based catalytic converters for removing nitrogen oxides (NOx), and a custom 6-parallel-port ultrahigh-efficiency particle filtering system for removing ultrafine, fine, and coarse mode particulate matter (PM).
Air Flow Control Systems.
Facility-level air flow and control is achieved via a combination of blowers, variable frequency drives (VFDs), flowmeters, and custom-made sound dampening mufflers. In brief, VFDs control motor speed through a proportional-integral-derivative (PID) control loop with a continuous flow rate monitor to maintain a constant flow rate set point that satisfies IACUC specifications for air exchange rates through the exposure chambers. Blowers are placed upstream of the exposure chambers, ultrahigh-efficiency particle filtering system, and sampling ports to maintain positive pressure throughout the system so that any leaks are outward, not inward which would dilute TRAP and contaminate FA supply lines. Air flow through all other instrumentation is achieved via independent pumps and a centralized air sampling train.
Air Sampling Train.
This is a custom-built sampling train designed to handle all the various air flow control needs of the instrumentation suite and sampling package associated with characterizing the TRAP and FA exposure atmospheres. A schematic is shown in SI Figure S3. Multiple atmospheres cannot be monitored simultaneously with a single instrument, so a system of computer-controlled solenoid valves has been implemented to switch between the various supply lines sequentially on a preprogrammed sampling schedule to allow different atmospheres to be cycled through individual instruments. Furthermore, the sampling train is immediately upstream of the exposure chambers to avoid any contaminating PM and gases from animal activity in their cages.
Exposure Chambers.
Two custom-built, airtight, IACUC-approved exposure chambers are housed in the office trailer vivarium, as shown in SI Figure S1. Each exposure chamber is further divided into three fully isolated subchambers with 36-cage capacities for a total facility capacity of six exposure groups at 36 cages per group. Exposure atmospheres are pumped through custom-built, fully automated air cooling and heating systems prior to delivery to the animals to ensure IACUC temperature specifications are maintained. Air delivery is through a series of orifice plates and diffusers at the top of the exposure chambers to ensure evenly balanced and well-mixed flows and then exhausted through the bottom of the chambers. Environmental variables inside the exposure chambers are continuously monitored and archived, including pressure, temperature, flow rates, and relative humidity.
Particle Measurements.
Real-time PM1, PM2.5, PM4, and PM10 mass concentrations were measured continuously at 1 s resolution for the duration of the 18-month study via duplicate optical particle counters (TSI Inc. DustTrak model 8533 DRX). The size distribution of particle number concentration in the electrical mobility diameter range of 10–700 nm was measured continuously at 3 min resolution for the study duration via a scanning mobility particle sizer (SMPS: TSI Inc. 3080 EC, 3081 DMA, and 3775 CPC). Sampling successively alternated between TRAP and FA flows at 15 min intervals to characterize both exposure atmospheres in parallel. For the data presented here, only emissions from bore 1, which includes light- and heavy-duty vehicles, were sampled and measured. Bore 2 emissions, which is light-duty vehicles only, were not included in this study since they do not generally represent true near-roadway environments.
Data Analysis.
To quantify exposure dynamics at the CTEF, all particle data was binned by sampling interval (time of day) and day of the week (Sunday–Saturday) and then bin-averaged across the entire study. This provides a statistical snapshot of the weekly trend in the timing and duration of exposure as a function of particle size and number and mass concentration. The frequency distribution of particle exposure–that is, the study-averaged amount of time per day that animals are exposed to a certain PM mass concentration or particle size distribution (PSD)—were also determined. For PM mass concentration, all data points were simply binned according to mass concentration and the frequency of observation per bin then translated to exposure duration using a 24 h period. PSDs were first subjected to cluster analysis and the frequency of observation per PSD cluster was then used to determine daily exposure duration, as discussed below.
Data Distributions.
Since standard statistical measures are being used to describe the central value (average) and spread (standard deviation) of the data being presented, it is important to understand the data distribution in terms of skewness and kurtosis to correctly interpret these metrics. To facilitate this, all data sets were independently binned according to sampling interval, as discussed above, and study-long frequency distributions constructed for each interval to calculate skewness and kurtosis, which were then averaged over all sampling intervals. Results are shown in Table 1.
Table 1.
Skewness and Kurtosis in the Study-Long Distribution of PM Mass Concentration and PSD data for TRAP and FA Reported As Average (Avg) and Standard Error in the Mean (SEM)
| PM mass concentrations |
particle size distributions |
|||||||
|---|---|---|---|---|---|---|---|---|
| skewness |
kurtosis |
skewness |
kurtosis |
|||||
| source | avg | SEM | avg | SEM | avg | SEM | avg | SEM |
| TRAP | 1.23 | 0.02 | 5.7 | 0.1 | 3.13 | 0.01 | 17.26 | 0.06 |
| FA | 1.47 | 0.02 | 13.3 | 0.4 | 3.54 | 0.01 | 17.53 | 0.05 |
For normal distributions, skewness and kurtosis are 0 and 3, respectively, showing that these data are positively skewed and largely leptokurtic. This has two implications: (i) although the reported standard deviations still measure the spread in the data, that spread is highly skewed toward values larger than the average rather than evenly distributed about it and (ii) the distributions are heavily tailed so there are more extreme and larger numbers of outliers than the normal distribution. Both observations are substantially more pronounced for the PSD data, which is attributed to transient ultrafine particle bursts from heavily polluting vehicles that are not measured by the optical particle counters due to size detection limits (Dp ~ 300 nm) and/or are of insufficient mass to deviate the PM concentrations substantially from average. For these reasons, all data sets have been filtered for outliers prior to averaging when characterizing exposure dynamics so these transient events do not bias the underlying temporal trends. They are included, however, in assessing exposure frequency to quantify their magnitude and duration, as shown later.
Cluster Analysis.
To evaluate the exposure frequency as a function of PSD, the data must first be clustered into groups of similar PSDs and then the frequency of observation per cluster can be translated into a study-average exposure duration based on a 24 h period. Treating each PSD as an n-dimensional vector where n is the number of size bins (ΔDp) in the distribution and the magnitude of each vector element corresponds to the particle number concentration at that size bin (dN/dlog Dp), then the similarity S between two PSDs and can be expressed as the sum of weighted square differences between vector elements k using weighting vectors and
| (1) |
In cases that the relative distribution of signal among vector elements is more important than differences in absolute magnitude between two vectors at any given element when quantifying similarity, the vector set is typically normalized to unity. Conversely, the unnormalized vector set is used when absolute magnitudes are an important distinguishing factor. In the current application, however, both the shape of the PSDs and the magnitude of particle number concentration are important so the unnormalized vector set is used and then weighted by the fraction of total number concentration per size bin according to the following equation:
| (2) |
The clustering is seeded with a random vector and proceeds iteratively using a similarity threshold determined from the average similarity between all vectors of a statistical subsample of the data set. During each iteration, the similarity between each vector and all clusters is calculated, the minimum value is selected and then compared to the threshold. If less than the threshold, then the vector is added to the cluster average and the algorithm moves to the next vector. If greater than the threshold, then the vector seeds a new cluster. From iteration to iteration, if a vector is more similar to a different cluster than the previous iteration, it is removed from the previous cluster and averaged into the new one. At the end of each iteration, the similarity between all clusters is calculated and cluster pairs below a cluster similarity threshold are merged. The algorithm is terminated when the number of vectors shifting between clusters and new cluster mergers drops to zero. Clusters are represented by the average and variance of all member vectors.
RESULTS AND DISCUSSION
Exposure Dynamics.
Critical factors in accurately modeling exposure over the human lifecycle are the timing, duration, and frequency of exposure as a function of gas and particle concentration and composition, referred to here as exposure dynamics. This is an inherently rich and complex problem that is not readily tractable or replicable. The CTEF was designed to model exposure dynamics for populations living, working, or going to school in near-roadway or heavily trafficked environments. To characterize and quantify this model, study-averaged temporal trends in PM mass concentration and particle size distribution and their associated variance are employed.
Particle Size Distribution.
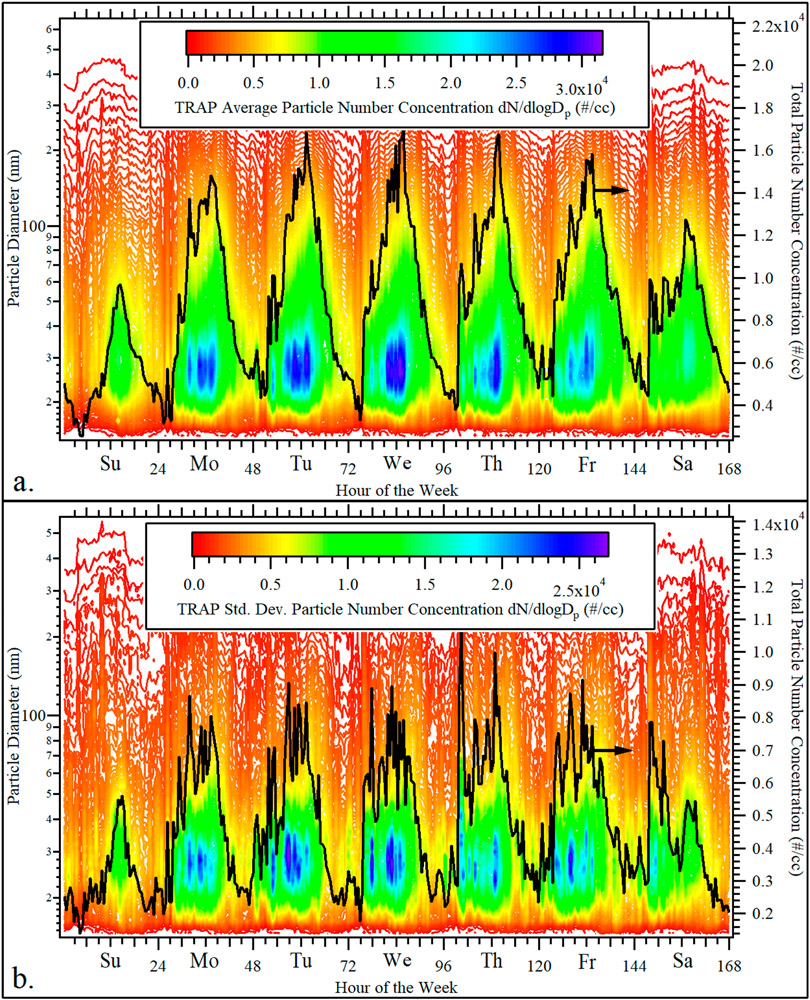
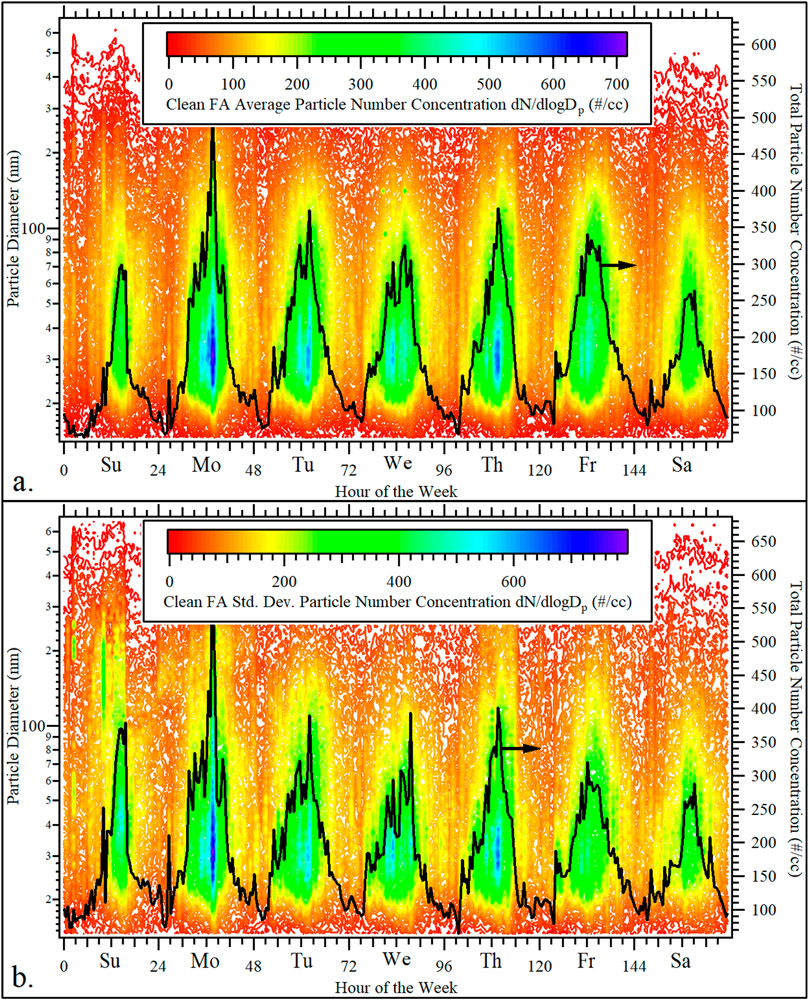
Figures 1 and 2 show the study-long (a) average and (b) standard deviation in the size distribution of particle number concentration as a function of hour of the week for the TRAP and FA exposure atmospheres, respectively, determined as previously discussed. Key observations in TRAP exposure dynamics include: (i) Dosing exhibits strong diurnal variation driven by traffic patterns and operation of the tunnel ventilation system with maximum concentrations during late morning and early afternoon and minimum concentrations during nighttime and early morning hours. During the 5-day work week, there is consistently a sharp drop in number concentrations around 14:00 daily, which is attributed to activation of the tunnel ventilation systems prior to the peak commuting hours from 16:00–20:00. (ii) Concentration swings between successive exposure maxima and minima is about an order of magnitude. (iii) The duration of peak exposure (~3 × 10⁴ particles/cc) is approximately 6 h daily with moderate (~1 × 10⁴ particles/cc) and low (~3 × 10³ particles/cc) exposure levels roughly dividing the rest of the day. (iv) There are noticeable drops in concentration during weekends when traffic patterns are similar but at reduced volume and without tunnel ventilation. (v) PSDs reside almost entirely in the ultrafine mode (Dp < 100 nm) throughout the duration of exposure but are narrower with smaller modes (Dp ~ 25 nm) during peak exposure. They increasingly grow in spread and mode (Dp ~ 40–100 nm) when transitioning to moderate and low exposure levels as traffic subsides and the background airshed begins dominating the tunnel atmosphere. (vi) Variance in the average follows identical trends with a standard deviation consistently on par in magnitude to the average but positively skewed and leptokurtic, meaning concentrations are routinely larger, rather than smaller, than the average and there are more extreme and larger numbers of outliers. These observations are more pronounced during peak exposure times and thus the correlation between the temporal trends, that is, periods of high concentration tend to show greater variability and increases in outlier events and vice versa for low concentration periods.
Figure 1.
Temporal trends in the study-long (a) average and (b) standard deviation of the size distribution of particle number concentration as a function of hour of the week for TRAP exposure groups. The black line (right axis) shows the total integrated particle number concentration.
Figure 2.
Temporal trends in the study-long (a) average and (b) standard deviation of the size distribution of particle number concentration as a function of hour of the week for FA exposure groups. The black line (right axis) shows the total integrated particle number concentration.
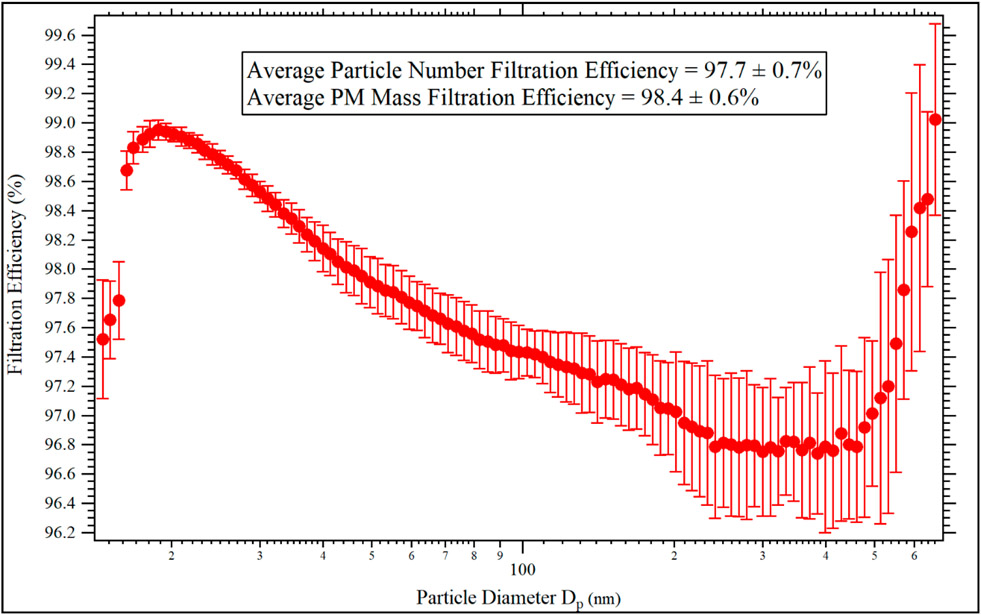
Since the source of clean FA for the negative control groups is drawn from immediately adjacent to the tunnel facility, it is similarly impacted by daily fluctuations in particle concentrations due to traffic and tunnel ventilation patterns. Filter efficiency curves for the ultrahigh-efficiency filters used to clean the air—as determined directly from the data in Figures 1 and 2 and shown with error bars in Figure 3—are relatively flat over the particle diameter range of the PSDs, and constant for a given particle diameter, so penetration increases with increasing number concentration and the same temporal trends observed for TRAP are also observed for FA. However, peak FA concentrations are an order of magnitude lower than the lowest TRAP levels and routinely 2 orders of magnitude lower than TRAP when compared in phase. A noticeable shift in the peak mode of FA PSDs to larger particle diameters (Dp ~ 30–50 nm) relative to TRAP is likely a result of the inverse relationship between filter efficiency and particle diameter in the diffusion regime.
Figure 3.
Study-average filtration efficiency (±error) versus particle diameter for the ultrahigh-efficiency filtration system used for FA exposure groups as determined from time-matched TRAP and FA size distributions of particle number concentration.
PM Mass Concentrations.
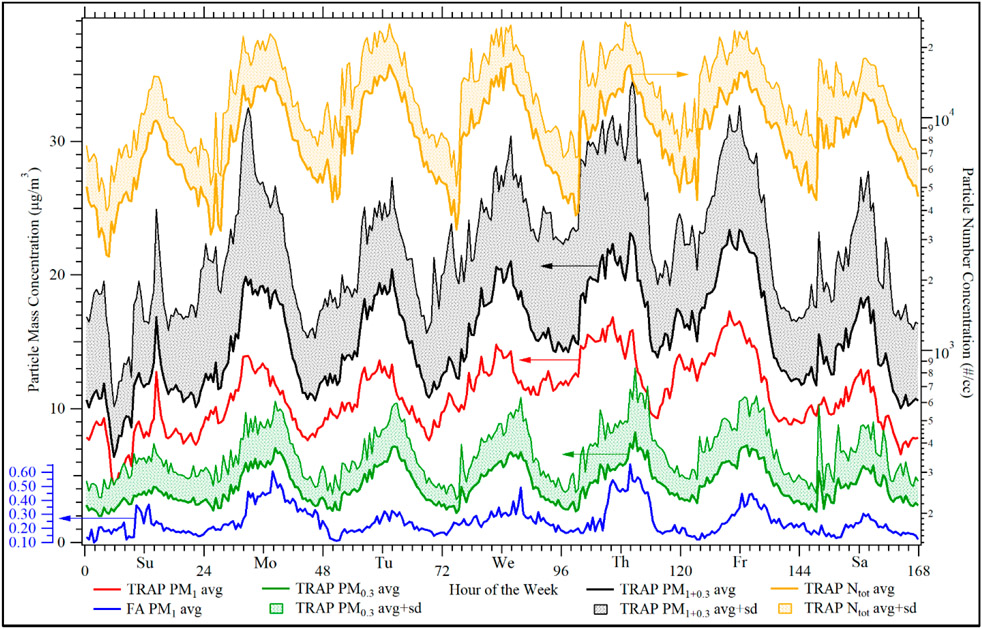
Figure 4 shows the temporal trends in the study-averaged PM mass concentrations versus hour of the week for (i) PM1 measured by the optical particle counters for both TRAP and FA, (ii) PM0.3 determined by integrating the TRAP particle size distributions assuming spherical particles with density 1.2 g/cm3, and (iii) PM1+0.3 calculated by adding the optical PM1 and integrated PM0.3 concentrations. The total integrated particle number concentrations for TRAP are also included for overlay comparison to the PM mass data. The study-averaged ratio of PM10 to PM1 is 1.06 ± 0.02 and all optical PM data trace each other almost identically so only the PM1 data is included in the figure. The PSD-integrated PM0.3 for FA adds negligible mass to the optical PM1 so is also excluded. PM1+0.3 is included for TRAP to correct for the lower particle size detection limit of optical particle counters and thus provide a more accurate PM1 concentration.
Figure 4.
Weekly trends in study-averaged PM mass concentrations for TRAP (left axis) and FA (left subaxis) and total integrated TRAP number concentration (right axis). Shaded areas represent the average + standard deviation; see text for discussion of data sources and methods. Arrows indicate which axis corresponds to each set of curves.
Primary conclusions from this analysis include (i) Temporal trends in PM mass concentrations are highly correlated to particle number concentrations for both TRAP and FA, showing the same diurnal variations based on traffic patterns and operation of the tunnel ventilation system. (ii) Study-average, in-phase FA mass concentrations are a factor of 70 ± 20 lower than TRAP with a PM mass filtration efficiency of 98.4 ± 0.6%. (iii) According to the optical particle counters, the study averaged PM2.5 mass concentration is 11 ± 3 μg/m3, which is below the U.S. Environmental Protection Agency’s (EPA’s) annual (12 μg/m3) and 24 h (35 μg/m3) National Ambient Air Quality Standards (NAAQS).40 Adjusting for the lower size limit of the optical instruments using the integrated PSD data raises this value to 16 ± 3 μg/m3, which is still far below the 24-h NAAQS. (iv) Although ultrafine particles (Dp ≤ 100 nm) only account for 4 ± 1% of total PM2.5 mass, they contribute to 88 ± 2% of the total particle number concentration.
Exposure Frequency Distributions.
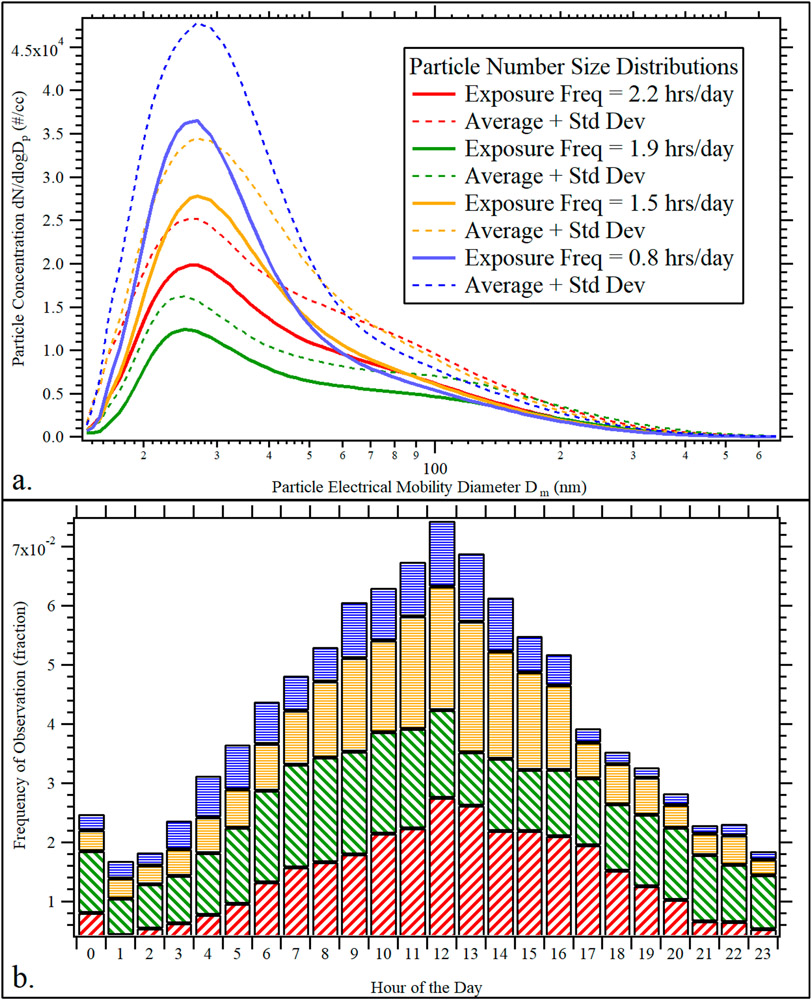
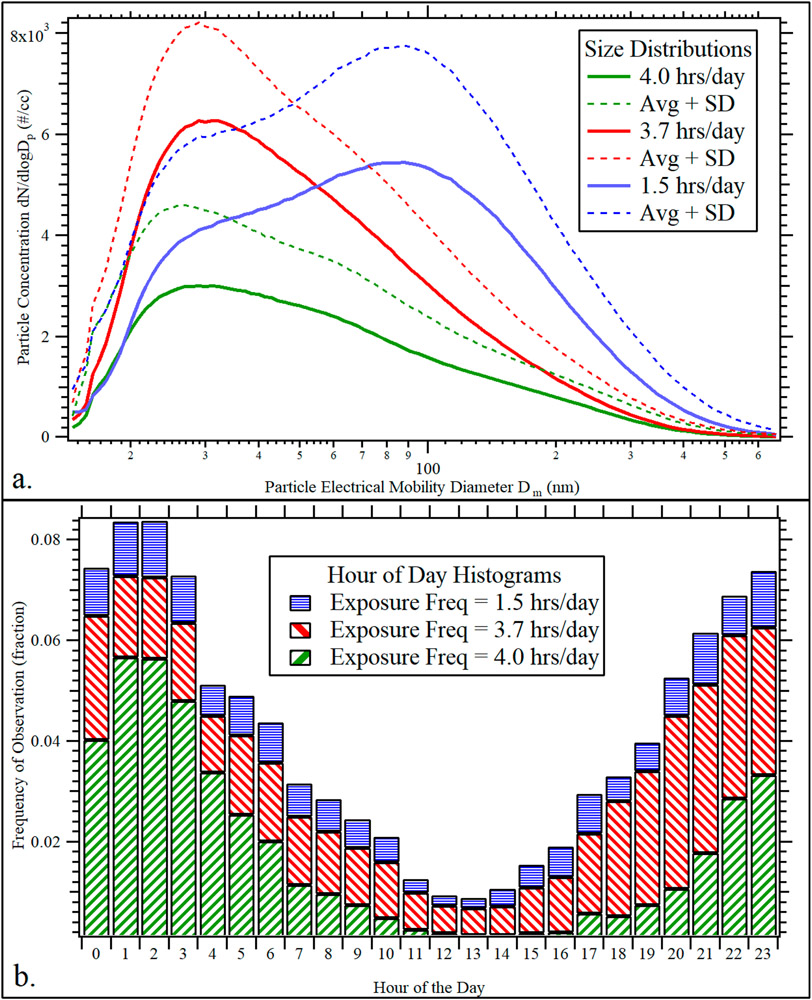
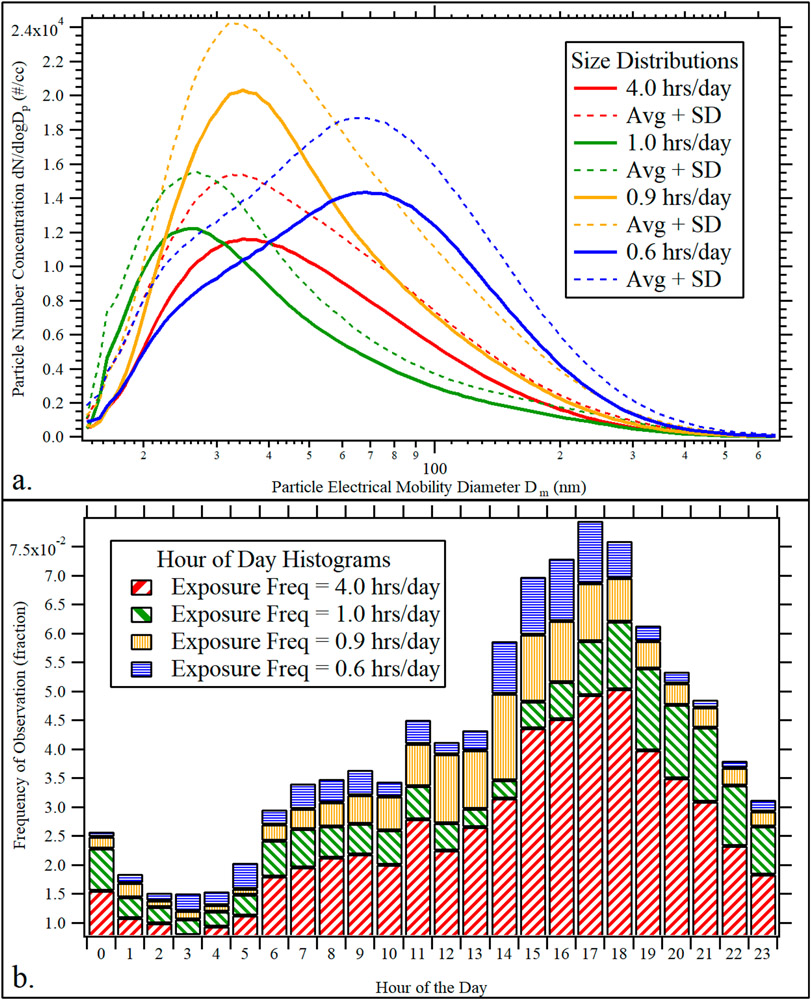
Study-average daily exposure frequencies–that is, the average amount of exposure time per day as a function of PSD or PM concentration—have been calculated according to the methods described previously. From the cluster analysis, the pooled timestamps of the individual PSDs constituting each cluster were used to construct hour-of-the-day frequency distributions. These distributions were then clustered according to the same algorithm described above to identify similar temporal trends in the observation of different groups of PSD clusters. Three distinct major patterns were identified accounting for 92% of the PSDs: daytime traffic, ambient background, and evening traffic. These data are shown in Figures 5, 6, and 7 and include (a) the PSD cluster averages (+ standard deviation) and associated exposure frequencies (hours/day) and (b) the hour-of-the-day histograms for each PSD cluster (color matched to the PSDs).
Figure 5.
Daytime traffic exposure frequency showing (a) identified PSD clusters (+ standard deviation) and (b) their associated hour of the day histograms (color coded). Listed exposure frequencies quantify the study-average daily exposure time to each PSD.
Figure 6.
Ambient background exposure frequency showing (a) identified PSD clusters (+standard deviation) and (b) their associated hour of the day histograms (color coded). Listed exposure frequencies quantify the study-average daily exposure time to each PSD.
Figure 7.
Evening traffic exposure frequency showing (a) identified PSD clusters (+ standard deviation) and (b) their associated hour of the day histograms (color coded). Listed exposure frequencies quantify the study-average daily exposure time to each PSD.
During daytime traffic, the PSD cluster averages stack neatly on top of one another with nearly identical diameter modes at 25 nm and differing only in peak number concentration, which range from 1 × 10⁴ #/cc for 1.9 h/day to 3.7 × 10⁴ #/cc for 0.8 h/day. In total, and on average, this group of PSD clusters account for 6.4 h of daily exposure time. In stark contrast, the ambient background dominates during the late night and early morning hours and is characterized by three distinct PSD clusters that vary widely in mode diameter (25–100 nm), but all have low peak concentrations ranging from 2.5 × 10³ to 6.1 × 10³ #/cc. Together, these background PSDs constitute the longest exposure time per day at 9.8 h. Evening traffic PSD clusters, peaking around 18:00, nicely demarcate the transition from daytime traffic through activation of the tunnel ventilation systems to the dominant nighttime ambient background. There is still a strong vehicular signal in the PSD clusters demonstrated by small mode diameters and high peak concentrations, but they are layered on top of ambient background PSDs coming from the ventilation system coupled to decreasing traffic volumes at later times. This period accounts for 6.5 h/day of exposure time.
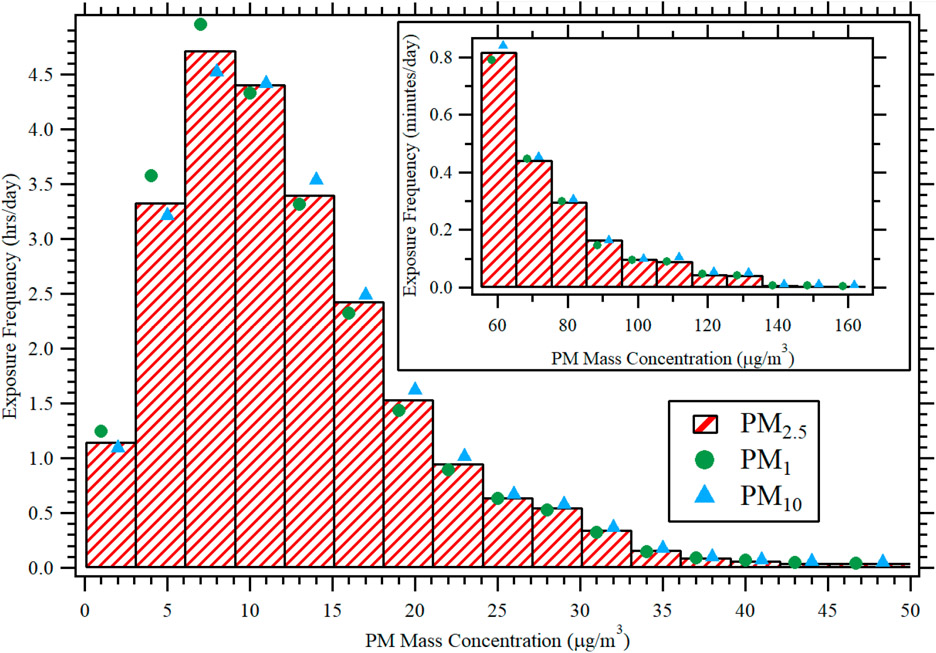
Exposure frequency as a function of PM mass concentration is shown in Figure 8 for PM1, PM2.5, and PM10. These data have been adjusted using the PSD integrated PM0.3 concentrations discussed previously. A key result from this analysis is that PM2.5 concentrations are less than the annual and 24-h NAAQS 70% and 99% of the time, respectively, immediately adjacent to a major freeway tunnel. If calculated using unadjusted optical data, then these values would increase to 81% and 99.8%. The frequency of highly episodic and transient events where PM concentrations spike due to the passage of heavily polluting vehicles is shown in the inset of Figure 8 as minutes/day. The study-averaged magnitude and duration of these events are 110 ± 50 μg/m3 and 40 ± 20 s.
Figure 8.
Study-long exposure frequency versus PM mass concentration for PM1, PM2.5, and PM10. The frequency distribution continues in the inset showing highly transient PM spikes.
To date, several published studies have been completed at the CTEF,36-39 with a focus on neurodevelopmental disorders (ASD) and neurodegenerative diseases (AD). A key conclusion of this research so far is that even though the study-averaged PM mass concentrations are below the EPA’s NAAQS, significant neurological effects and cognitive impairment were observed in a rat model.36-39 The main issue is that internal combustion engines produce large numbers of ultrafine particles that contribute negligible mass to the atmosphere—relative to NAAQS regulated PM2.5 and PM10—and go undetected by optical particle counters but have the highest mobility in animal models and humans. For example, a 2.5 μm particle, the upper size limit of PM2.5 NAAQS, is one million times more massive than a 25 nm particle, which is the predominate size mode in vehicular emissions. Conversely, it would take one million vehicular particles to equal the mass of one 2.5 μm particle. Furthermore, although a 2.5 μm particle is likely to be cleared in the nasal cavity or deposited in the upper respiratory tract due to its large size, the vehicular particle is so small that it can reach the deepest parts of the lung, cross into the circulatory system, and even translocate to the brain. In this sense, ultrafine PM is largely unregulated yet has the highest mobility in the body and thus may pose the greatest risk to human health. Given this, it is posited here that current federal and state air quality standards for PM are insufficient to fully protect human health, most notably the developing and aging brain, due to regulatory gaps for ultrafine PM. This is especially true for near-roadway, fence-line, and port-adjacent communities that are disproportionately impacted by combustion-derived ultrafine PM emission sources like light- and heavy-duty vehicles. It is well-known that these communities are largely populated by people of color who are socioeconomically disadvantaged toward mitigating exposure risks, thus compounding the environmental injustice and health inequity issues.41 These types of chronic, real-world exposures needed to elicit neurological diseases and deficits would not be possible without this facility.
Supplementary Material
ACKNOWLEDGMENTS
This research was funded by the National Institutes of Health (NIH: R21 ES026515, R21 ES025570, R01 ES026670, P30 ES023513, and P30 AG010129). K.J.B. was partially supported by the National Institute of Occupational Health & Safety (U54 OH007550) and the NIH (RF1 AG074709). The contents of this work do not necessarily represent the views of the NIH, and the NIH does not endorse the purchase of any commercial products or services mentioned in this publication. The authors thank Caltrans and their staff for allowing access to the Caldecott tunnel to site this facility and support during its construction and operation.
Footnotes
Supporting Information
The Supporting Information is available free of charge at https://pubs.acs.org/doi/10.1021/acs.est.1c07047.
Photo montage of the Caldecott Tunnel Exposure Facility; schematics of the onsite office trailer housing the vivarium, air quality monitoring instrumentation, and general lab space; schematics of the sampling train; details of the emissions control technology (PDF)
The authors declare no competing financial interest.
Contributor Information
Keith J. Bein, Air Quality Research Center, University of California, Davis, California 95616, United States; Center for Health & the Environment, University of California, Davis, California 95616, United States.
Chris D. Wallis, Air Quality Research Center, University of California, Davis, California 95616, United States
Jill L. Silverman, Dept. of Psychiatry and Behavioral Sciences and The MIND Institute, University of California, Davis, California 95616, United States
Pamela J. Lein, The MIND Institute and Department of Molecular Biosciences, University of California, Davis, California 95616, United States.
Anthony S. Wexler, Air Quality Research Center, University of California, Davis, California 95616, United States; Department of Mechanical and Aerospace Engineering, Department of Civil and Environmental Engineering, and Department of Land, Air and Water Resources, University of California, Davis, California 95616, United States.
REFERENCES
- (1).Ritz B; Yu F The effect of ambient carbon monoxide on low birth weight among children born in southern California between 1989 and 1993. Environ. Health Perspect 1999, 107 (1), 17. [DOI] [PMC free article] [PubMed] [Google Scholar]
- (2).Wilhelm M; Ghosh JK; Su J; Cockburn M; Jerrett M; Ritz B Traffic-related air toxics and preterm birth: a population-based case-control study in Los Angeles County, California. Environmental Health 2011, 10 (1), 89. [DOI] [PMC free article] [PubMed] [Google Scholar]
- (3).Crouse DL; Goldberg MS; Ross NA; Chen H; Labrèche F Postmenopausal breast cancer is associated with exposure to traffic-related air pollution in Montreal, Canada: a case-control study. Environ. Health Perspect 2010, 118 (11), 1578. [DOI] [PMC free article] [PubMed] [Google Scholar]
- (4).Danysh HE; Mitchell LE; Zhang K; Scheurer ME; Lupo PJ Traffic-related air pollution and the incidence of childhood central nervous system tumors: Texas, 2001–2009. Pediatric blood & cancer 2015, 62 (9), 1572–1578. [DOI] [PubMed] [Google Scholar]
- (5).Heck JE; Wu J; Lombardi C; Qiu J; Meyers TJ; Wilhelm M; Cockburn M; Ritz B Childhood cancer and traffic-related air pollution exposure in pregnancy and early life. Environ. Health Perspect 2013, 121 (11–12), 1385–1391. [DOI] [PMC free article] [PubMed] [Google Scholar]
- (6).McCreanor J; Cullinan P; Nieuwenhuijsen MJ; Stewart-Evans J; Malliarou E; Jarup L; Harrington R; Svartengren M; Han I-K; Ohman-Strickland P Respiratory effects of exposure to diesel traffic in persons with asthma. New England Journal of Medicine 2007, 357 (23), 2348–2358. [DOI] [PubMed] [Google Scholar]
- (7).Brunekreef B; Janssen NA; de Hartog J; Harssema H; Knape M; van Vliet P Air pollution from truck traffic and lung function in children living near motorways. Epidemiology 1997, 8, 298–303. [DOI] [PubMed] [Google Scholar]
- (8).Hoek G; Brunekreef B; Goldbohm S; Fischer P; van den Brandt PA Association between mortality and indicators of traffic-related air pollution in the Netherlands: a cohort study. lancet 2002, 360 (9341), 1203–1209. [DOI] [PubMed] [Google Scholar]
- (9).Künzli N; Jerrett M; Mack WJ; Beckerman B; LaBree L; Gilliland F; Thomas D; Peters J; Hodis HN Ambient air pollution and atherosclerosis in Los Angeles. Environ. Health Perspect 2005, 113 (2), 201–206. [DOI] [PMC free article] [PubMed] [Google Scholar]
- (10).Finkelstein MM; Jerrett M A study of the relationships between Parkinson’s disease and markers of traffic-derived and environmental manganese air pollution in two Canadian cities. Environmental research 2007, 104 (3), 420–432. [DOI] [PubMed] [Google Scholar]
- (11).Volk HE; Lurmann F; Penfold B; Hertz-Picciotto I; McConnell R Traffic-related air pollution, particulate matter, and autism. JAMA psychiatry 2013, 70 (1), 71–77. [DOI] [PMC free article] [PubMed] [Google Scholar]
- (12).Costa LG; Cole TB; Dao K; Chang Y-C; Coburn J; Garrick JM Effects of air pollution on the nervous system and its possible role in neurodevelopmental and neurodegenerative disorders. Pharmacology & Therapeutics 2020, 210, 107523. [DOI] [PMC free article] [PubMed] [Google Scholar]
- (13).Chen H; Kwong JC; Copes R; Tu K; Villeneuve PJ; Van Donkelaar A; Hystad P; Martin RV; Murray BJ; Jessiman B Living near major roads and the incidence of dementia, Parkinson’s disease, and multiple sclerosis: a population-based cohort study. Lancet 2017, 389 (10070), 718–726. [DOI] [PubMed] [Google Scholar]
- (14).Ru M; Brauer M; Lamarque J-F; Shindell D Exploration of the Global Burden of Dementia Attributable to PM2.5: What Do We Know Based on Current Evidence? GeoHealth 2021, 5 (5), No. e2020GH000356. [DOI] [PMC free article] [PubMed] [Google Scholar]
- (15).Oudin A; Forsberg B; Adolfsson AN; Lind N; Modig L; Nordin M; Nordin S; Adolfsson R; Nilsson L-G Traffic-related air pollution and dementia incidence in northern Sweden: a longitudinal study. Environ. Health Perspect 2016, 124 (3), 306–312. [DOI] [PMC free article] [PubMed] [Google Scholar]
- (16).Kilian J; Kitazawa M The emerging risk of exposure to air pollution on cognitive decline and Alzheimer’s disease - Evidence from epidemiological and animal studies. Biomedical Journal 2018, 41 (3), 141–162. [DOI] [PMC free article] [PubMed] [Google Scholar]
- (17).Ghio AJ; Devlin RB Inflammatory lung injury after bronchial instillation of air pollution particles. American journal of respiratory and critical care medicine 2001, 164 (4), 704–708. [DOI] [PubMed] [Google Scholar]
- (18).Plummer LE; Carosino CM; Bein KJ; Zhao Y; Willits N; Smiley-Jewell S; Wexler AS; Pinkerton KE Pulmonary inflammatory effects of source-oriented particulate matter from California’s San Joaquin Valley. Atmos. Environ 2015, 119, 174–181. [DOI] [PMC free article] [PubMed] [Google Scholar]
- (19).Demokritou P; Gupta T; Ferguson S; Koutrakis P Development of a high-volume concentrated ambient particles system (CAPS) for human and animal inhalation toxicological studies. Inhalation toxicology 2003, 15 (2), 111–129. [DOI] [PubMed] [Google Scholar]
- (20).Kim S; Jaques PA; Chang M; Froines JR; Sioutas C Versatile aerosol concentration enrichment system (VACES) for simultaneous in vivo and in vitro evaluation of toxic effects of ultrafine, fine and coarse ambient particles Part I: Development and laboratory characterization. J. Aerosol Sci 2001, 32 (11), 1281–1297. [Google Scholar]
- (21).Jung H; Arellanes C; Zhao Y; Paulson S; Anastasio C; Wexler A Impact of the Versatile Aerosol Concentration Enrichment System (VACES) on gas phase species. Aerosol Sci. Technol 2010, 44 (12), 1113–1121. [Google Scholar]
- (22).Lee D; Wallis C; Wexler AS; Schelegle ES; Van Winkle LS; Plopper CG; Fanucchi MV; Kumfer B; Kennedy IM; Chan JK Small particles disrupt postnatal airway development. J. Appl. Physiol 2010, 109 (4), 1115–1124. [DOI] [PMC free article] [PubMed] [Google Scholar]
- (23).Chan JK; Fanucchi MV; Anderson DS; Abid AD; Wallis CD; Dickinson DA; Kumfer BM; Kennedy IM; Wexler AS; Van Winkle LS Susceptibility to inhaled flame-generated ultrafine soot in neonatal and adult rat lungs. Toxicol. Sci 2011, 124 (2), 472–486. [DOI] [PMC free article] [PubMed] [Google Scholar]
- (24).Van Winkle LS; Chan JK; Anderson DS; Kumfer BM; Kennedy IM; Wexler AS; Wallis C; Abid AD; Sutherland KM; Fanucchi MV Age specific responses to acute inhalation of diffusion flame soot particles: cellular injury and the airway antioxidant response. Inhalation toxicology 2010, 22 (sup2), 70–83. [DOI] [PMC free article] [PubMed] [Google Scholar]
- (25).Levesque S; Surace MJ; McDonald J; Block ML Air pollution & the brain: Subchronic diesel exhaust exposure causes neuroinflammation and elevates early markers of neurodegenerative disease. Journal of neuroinflammation 2011, 8 (1), 105. [DOI] [PMC free article] [PubMed] [Google Scholar]
- (26).Kirchstetter TW; Singer BC; Harley RA; Kendall GB; Chan W Impact of oxygenated gasoline use on California light-duty vehicle emissions. Environ. Sci. Technol 1996, 30 (2), 661–670. [Google Scholar]
- (27).Kirchstetter TW; Harley RA; Kreisberg NM; Stolzenburg MR; Hering SV On-road measurement of fine particle and nitrogen oxide emissions from light- and heavy-duty motor vehicles. Atmos. Environ 1999, 33 (18), 2955–2968. [Google Scholar]
- (28).Geller VD; Sardar SB; Phuleria H; Fine PN; Sioutas C Measurements of particle number and mass concentrations and size distributions in a tunnel environment. Environ. Sci. Technol 2005, 39 (22), 8653–8663. [DOI] [PubMed] [Google Scholar]
- (29).Allen JO; Mayo PR; Hughes LS; Salmon LG; Cass GR Emissions of Size-Segregated Aerosols from On-Road Vehicles in the Caldecott Tunnel. Environ. Sci. Technol 2001, 35 (21), 4189–4197. [DOI] [PubMed] [Google Scholar]
- (30).Ban-Weiss GA; McLaughlin JP; Harley RA; Lunden MM; Kirchstetter TW; Kean AJ; Strawa AW; Stevenson ED; Kendall GR Long-term changes in emissions of nitrogen oxides and particulate matter from on-road gasoline and diesel vehicles. Atmos. Environ 2008, 42 (2), 220–232. [Google Scholar]
- (31).Ban-Weiss GA; Lunden MM; Kirchstetter TW; Harley RA Size-resolved particle number and volume emission factors for on-road gasoline and diesel motor vehicles. J. Aerosol Sci 2010, 41 (1), 5–12. [Google Scholar]
- (32).Venkataraman C; Friedlander SK Size Distributions of Polycyclic Aromatic Hydrocarbons and Elemental Carbon. 2. Ambient Measurements and Effects of Atmospheric Processes. Environ. Sci. Technol 1994, 28 (4), 563–572. [DOI] [PubMed] [Google Scholar]
- (33).Kirchstetter TW; Harley RA; Littlejohn D Measurement of Nitrous Acid in Motor Vehicle Exhaust. Environ. Sci. Technol 1996, 30 (9), 2843–2849. [Google Scholar]
- (34).Venkataraman C; Lyons JM; Friedlander SK Size distributions of polycyclic aromatic hydrocarbons and elemental carbon. 1. Sampling, measurement methods, and source characterization. Environ. Sci. Technol 1994, 284, 555–62. [DOI] [PubMed] [Google Scholar]
- (35).Gross DS; Galli ME; Silva PJ; Wood SH; Liu D-Y; Prather KA Single Particle Characterization of Automobile and Diesel Truck Emissions in the Caldecott Tunnel. Aerosol Sci. Technol 2000, 32 (2), 152–163. [Google Scholar]
- (36).Patten KT; González EA; Valenzuela A; Berg E; Wallis C; Garbow JR; Silverman JL; Bein KJ; Wexler AS; Lein PJ Effects of early life exposure to traffic-related air pollution on brain development in juvenile Sprague-Dawley rats. Translational Psychiatry 2020, 10 (1), 166. [DOI] [PMC free article] [PubMed] [Google Scholar]
- (37).Berg EL; Pedersen LR; Pride MC; Petkova SP; Patten KT; Valenzuela AE; Wallis C; Bein KJ; Wexler A; Lein PJ; Silverman JL Developmental exposure to near roadway pollution produces behavioral phenotypes relevant to neurodevelopmental disorders in juvenile rats. Translational Psychiatry 2020, 10 (1), 289. [DOI] [PMC free article] [PubMed] [Google Scholar]
- (38).Edwards S; Zhao G; Tran J; Patten KT; Valenzuela A; Wallis C; Bein KJ; Wexler AS; Lein PJ; Rao X Pathological Cardiopulmonary Evaluation of Rats Chronically Exposed to Traffic-Related Air Pollution. Environ. Health Perspect 2020, 128 (12), 127003. [DOI] [PMC free article] [PubMed] [Google Scholar]
- (39).Patten K; Valenzuela A; Wallis C; Berg E; Silverman J; Bein K; Wexler A; Lein P The Effects of Chronic Exposure to Ambient Traffic-Related Air Pollution on Alzheimer’s Disease Phenotypes in Wildtype and Genetically Predisposed Male and Female Rats. Environ. Health Perspect 2021, 129 (5), 057005. [DOI] [PMC free article] [PubMed] [Google Scholar]
- (40).Environmental Protectin Agency US, National Ambient Air Quality Standards. In 40 CFR 50, Washington, DC, 2020. [Google Scholar]
- (41).Tessum Christopher W; Paolella David A; Chambliss Sarah E; Apte Joshua S; Hill Jason D; Marshall Julian D, PM2.5 polluters disproportionately and systemically affect people of color in the United States. Sci. Adv 20217, (18), eabf4491. [DOI] [PMC free article] [PubMed] [Google Scholar]
Associated Data
This section collects any data citations, data availability statements, or supplementary materials included in this article.


