Abstract
Motivation
For immune system monitoring in large-scale studies at the single-cell resolution using CyTOF, (semi-)automated computational methods are applied for annotating live cells of mixed cell types. Here, we show that the live cell pool can be highly enriched with undefined heterogeneous cells, i.e. ‘ungated’ cells, and that current semi-automated approaches ignore their modeling resulting in misclassified annotations.
Result
We introduce ‘CyAnno’, a novel semi-automated approach for deconvoluting the unlabeled cytometry dataset based on a machine learning framework utilizing manually gated training data that allows the integrative modeling of ‘gated’ cell types and the ‘ungated’ cells. By applying this framework on several CyTOF datasets, we demonstrated that including the ‘ungated’ cells can lead to a significant increase in the precision of the ‘gated’ cell types prediction. CyAnno can be used to identify even a single cell type, including rare cells, with higher efficacy than current state-of-the-art semi-automated approaches.
Availability and implementation
The CyAnno is available as a python script with a user-manual and sample dataset at https://github.com/abbioinfo/CyAnno.
Supplementary information
Supplementary data are available at Bioinformatics online.
1 Introduction
For many decades, flow cytometry has been used as a conventional technique for both qualitative and quantitative analysis of single cells in a complex cellular system of heterogeneous cell types (Adan et al., 2017; McKinnon, 2018). In recent years, the advancement in the field of single-cell technologies has shifted the paradigm to unravel more complex cell mixtures at a single-cell resolution (Hwang et al., 2018; Pan, 2015). One such recent technique for single cell profiling at high-throughput level is Cytometry by Time Of Flight (CyTOF) or Mass cytometry (Bandura et al., 2009). In CyTOF, heavy metal ion tagged antibodies are bound to single cells, which allow the detection of 40 or more protein cellular markers in millions of cells per sample with much higher sensitivity and reduced ‘spillover’ than traditional flow cytometery (Maecker and Harari, 2015). However, the multi-dimensional and complex nature of CyTOF proposes the new computational challenge of deconvoluting the heterogeneous mixture of closely related cell types (Palit et al., 2019; Stanley et al., 2020).
Conventionally, the deconvolution of a pool of live, single cells into distinct cell types is done by drawing ‘manual gates’ on a hierarchal series of bi-axial plots, wherein the expression profiles of two defined markers are used in a series of sub-setting events to summarize a desired cell population (aka a cell type) with a defined marker expression profile (Supplementary Fig. S1) (Staats et al., 2019). The cells that lie inside the defined boundaries of ‘manual gates’ are selected for further sub-selection, whereas the remaining proportion of cells that remain outside the drawn gates for all cell types are not used in the downstream analysis, i.e. ungated cells (among the non-debris, single, live cells). Here, the choice of gate boundaries is based on expert knowledge by visual inspection and the hierarchical depth of a gating schema depends upon the number of protein markers used in the cytometry panel. For traditional flow cytometry, this process of manual gating is less laborious due to a small number of available parameters (Gadalla et al., 2019). However, as the number of available parameters in CyTOF datasets increases, a deeper interrogation of the cell sub-types can be performed by increasing the hierarchical depth and complexity of the gating schema to reveal previously undiscovered cell sub-type (Lee et al., 2019). This increase in the hierarchical complexity makes manual gating extremely time consuming and laborious, which further increases for large-scale studies (Becht et al., 2019; Mair et al., 2016). In addition to manual gating, unsupervised clustering is routinely performed, but suffers from numerous drawbacks, for instance, information loss due to random sub-sampling (Nowicka et al., 2017), especially during the identification of non-canonical and/or rare cell type(s) (Bhaduri et al., 2018) and cluster reproducibility after multiple resampling iterations (Melchiotti et al., 2017). Therefore, as an alternative, semi-automated approaches were proposed that use ‘prior’ knowledge or ‘ground truth’ about the marker expression in each of the given cell types to annotate every cell of the unlabeled dataset with biologically relevant labels (Liu et al., 2019). Currently, only a few semi-automated approaches for cell label predictions are available, viz. Automated Cell-type Discovery and Classification (ACDC) (Lee et al., 2017), Semi-supervised Category Identification and Assignment (SCINA) (Zhang et al., 2019), DeepCyTOF (Li et al., 2017) and Linear Discriminant Analysis (LDA) (Abdelaal et al., 2019). Both ACDC and SCINA, use a list of pre-defined markers for a given cell type to annotate the unsupervised cell cluster(s) that expresses these signature markers. However, these methods assume that the expression of target markers are binary (expressed or not expressed), which restricts their ability to classify highly similar cell subsets, especially non-canonical cell types, that cannot be separated linearly (Abdelaal et al., 2019; Liu et al., 2019). Instead of defined marker lists, DeepCyTOF and LDA use pre-defined cell clusters (e.g. manually gated cell types) in form of a marker expression matrix as training set to build a Machine Learning (ML) model for cell type prediction. In fact, semi-automated methods like LDA were found to show much higher precision than ACDC and unsupervised methods in correctly predicting non-canonical cell types in the pool of gated cell populations (Liu et al., 2019). However, these methods also suffer from elementary limitations, e.g. when used to predict manually gated cell labels, these methods are built toward the identification of gated cell types only and lack a systematic way of considering the cells that cannot be classified under any of the desired (gated) cell types, i.e. ungated cells.
In this work, we have shown that the cells that are not assigned to any cell type after manual gating (i.e. ungated cells) are an implicit part of the live cell pool generated by the cytometer and represent a heterogeneous cell population. Such cells are difficult to classify as they cannot be explained by the pre-defined set of gating events. Nevertheless, ungated cells may include cells with unknown phenotype and biological relevance, e.g. cells in their transitional immune state, and thus must not be misclassified as other desired (gated) cell population. However, the currently published semi-automated methods lack the systematic means for incorporating ungated live cells for training, testing and optimizing cell type prediction models. As a result, these methods misclassify a large proportion of ungated cell population as one of the closely related gated cell types.
To address these limitations, we developed a novel semi-automated ML-based computational framework, i.e. CyAnno (CyTOF Annotator; Fig. 1), that can effectively classify each live cell to one of the gated cell types or ungated otherwise, by learning the marker expression profile of each gated cell population, assuming ‘manual gating’ as the ground truth for cell type identification. The unique approach provides a systematic way for incorporating the marker expression level features of ungated cells for building an optimized ML classification model. Our algorithm demonstrated higher F1 scores and precision rates while differentiating gated populations from each other as well as from ungated populations in CyTOF datasets.
Fig. 1.
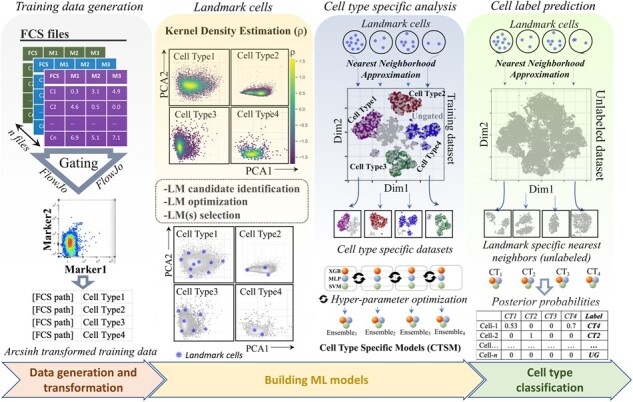
CyAnno workflow. For details see methods. Briefly, the entire workflow is divided into three steps: (i) FCS gating: The first step requires the generation of a training set, which is a collection of FCS/CSV files, one for each cell type manually gated per samples. (ii) Model building: For each cell type a unique ML model is build. The step is divided into two sub-steps: (a) LandMark identification. For each cell type, landmark (LM) cells are identified by computing the kernel densities of each cell in the bi-axial PC plots of its marker expression profile. Candidate LM cells are evaluated using greedy search algorithm to retain only high-confidence representative LM cells (asterisks *). (b) Cell type specific data modeling. In the training set with a mixed pool of manually gated cell types, each set of LM cells (one set per cell type) is used to compute their approximated nearest neighbors to create Cell Type Specific Training Dataset. The latter is then used to build a ‘one-vs-rest’ binary ML classification model (methods: XGboost, SVM and MLP) for each cell type, i.e. Cell Type Specific Model (CTSM). (iii) Prediction: The steps used for CTSD building are applied to the unknown/unlabeled cytometry data. Afterwards, for each cell type, a unique unlabeled Cell Type Specific Training Dataset is generated. The final cell labels are predicted by comparing the posterior probabilities of a cell to belong to one of the gated cell types. Cell not belonging to any of the gated cell type are classified as ‘ungated’ (UG)
2 Materials and methods
The proposed algorithm aims to classify live cells (non-debris; non-doublets) to one of the gated cell types (Fig. 1 and Supplementary Fig. S1) by learning the marker-level features expressed by the ungated cells and gated cell populations and building independent ‘one-vs-rest’ classification models, one for each cell type.
2.1 CyAnno workflow
CyAnno is implemented as a 3-steps serial framework:
2.1.1 Data generation and transformation
Each CyTOF sample Si represents a pre-gated set of live single cells belonging to multiple cell types, in which each cell j has expression values of p markers. A prior is the manually gated cell population of n live cells (labeled dataset, e.g. using FlowJo) from randomly selected m training samples, together represented as n-by-p expression matrix. Each training sample also contains cells not assigned to any of the cell types, i.e. ungated. Here, in the absence of gold-standard, we hypothesized ‘manual-gating’ as the ground truth of cell type identification. The marker expression profile of all live cells is first transformed using arcsinh transformation (co-factor set to default value of 5; user-defined). The transformation provides necessary scaling to build efficient ML models subsequently and helps in minimizing the inherent noise associated with marker expression values.
2.1.2 Building the ML models
The following details the three sub-steps performed on each of the mutually exclusive gated cell types:
2.1.2.1 Landmark cell identification
Within each cell type, we identify a small set of characteristic cells called LandMark cells (LM cells). The essential feature of the LM cells is their ability to effectively retrieve the cells of its respective cell type as Nearest Neighbors (NN) in a population of mixed cell types and ungated cells. Here, the NN of the LM cells within a mixed cell population are expected to include most (or all) of the cells from their respective cell type (i.e. True Positive {TP} cells) along with cells of closely related cell types, i.e. False Positive (FP) cells. The following stringent approach is applied to identify LM cells for each cell type that can recall maximum number of TP cells:
2.1.2.1.1 Decomposition into Principal Components (PCs)
The manually gated multi-dimensional k-by-p expression matrix is decomposed into its first two Principal Components (PCs), i.e. PC1 and PC2, where k is the number of cells in a given cell type.
2.1.2.1.2 Kernel Density Estimation
Kernel densities within the first two PCs are then estimated in PCs biaxial plots. The kernel density values smooth out the contribution of each data point over its nearest neighborhood, where the estimated density at each point can be represented as:
where estimate of f(x) is the convolution of Gaussian Kernel K (mean value of 0) with the 2D histogram of PCs. The kernel bandwidth h is estimated from data points using the automated fastKDE method (O’Brien et al., 2016).
2.1.2.1.3 Landmark candidates shortlisting
The estimated kernel densities are then stratified into five quantile ranges and 10 cells are randomly selected from each of the quantiles as LM candidates. In addition, LM candidate cells that form the edges in the PCs biaxial plots are estimated by computing the alpha shapes (method: concave hall; alpha = 0.80) of a set of points. Together, these LM candidate cells represent a highly diverse set of cells (Supplementary Fig. S2A) from which the final set of LM cells will be selected in the next step.
2.1.2.1.4 Landmark cell selection via nearest neighborhood approximation
Using the Nearest Neighborhood Approximation (NNA) via Facebook’s similarity search and clustering algorithm, viz faiss (https://github.com/facebookresearch/faiss; method: brute-force index with L2 distances), NN of each LM candidate within all live cells (n-by-p matrix) are identified. Here, the number of NN is equal to the proportion of the given cell type population in the total live cells. However, if the live cell population contains highly similar or ambiguous cell types, each LM candidate can produce lower than the expected proportion of TP cells and higher FP neighbors. Therefore, greedy search algorithm is used to enumerate LM cells with highest number of TP cells. Starting with LM candidate cells with the highest kernel density, the total number of LM candidates required to capture 100% of TP cells as NN are selected, such that no two LM cells share more than 20% of the same TP cells. In the latter case, the LM cell with the higher number of TP cells is selected. However, if the total number of cells in a given cell type is ≤100 (default value, user defined in CyAnno wrapper) then all cells for that given cell type are considered as LM cells.
2.1.2.2 Cell Type Specific Training Dataset
For each cell type, the LM associated NN cell sub-set is composed of TP cells along with FP cells. We call this cell subset of NN a ‘Cell Type Specific Training Dataset’.
2.1.2.3 Building a Binary Cell Type Specific Model (CTSM)
Next, each ‘Cell Type Specific Training Dataset’ is used to build the ML-based binary classifier(s). CyAnno uses three different ML algorithms for building prediction models, i.e. extreme gradient boosting (XGboost) (Chen and Guestrin, 2016), Multi-Layer Perceptron (MLP) (Rumelhart et al., 1986) and Support Vector Machine (SVM) (Cortes and Vapnik, 1995), for which the hyper-parameters are optimized using random grid search with cross validation analysis, wherein a large search space is defined for different parameter options for each ML algorithm. With the CyAnno wrapper, these algorithms can be called independently or they all can be used together for predicting cell labels using an ensemble model, which combines the results of multiple base estimators and provides consensus results by majority voting approach. For the subsequent analysis in this work, ensemble of ML models was used for predicting cell labels. The complete details of the hyper-parameters optimization, learning rate, error rate estimation and evaluation of different ML classifier are available as Supplementary Text.
2.1.3 Cell type classification with a CTSM
To annotate a new unlabeled dataset (e.g. validation dataset) of live cells, the following steps are performed per cell type: First, NNA is computed using the previously predicted LM cells for the cell type c. The resulting ‘cell type specific dataset’ is then applied to its corresponding CTSM built previously (from Section 2.1.2). This results in a posterior probability of each of the cell j belonging to the given cell type c, such that
Thus, posterior probability of a cell j in cell type c becomes 0 if it is less than the threshold, i.e. (default 0.5; user-defined). The posterior probability matrix n-by-C contains the probability score of each cell j of belonging to each of the cell type c, where c . Finally, label l for each cell j from n-by-C probability matrix is defined as:
where label for a given cell j is cell type c having the maximum posterior probability as compared to the other cell types.
2.2 Performance evaluation
Performance matrices and methods used for comparing CyAnno with existing methods are available as Supplementary Text.
2.3 Software implementation
All codes were compiled with Python programming language (version 3.0 or above). A Lenovo P400 workstation running on 2 X Intel-Xeon processor with 20 cores and 64 GB of RAM was used. For the end-users, the CyAnno algorithm is wrapped as an easy-to-use cross-platform python script that can be executed via command line interface.
3 Results
3.1 Characterization of ungated cell population
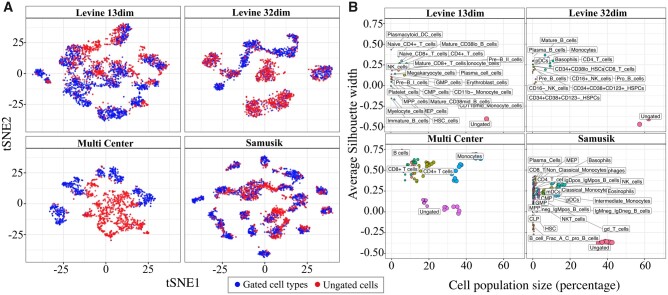
The analyses of four publicly available cytometry datasets (Table 1; see Supplementary Text, Supplementary Section S1) revealed that a large proportion (∼20–60%) of all live cells remains ungated after manual gating (Supplementary Fig. S3). Since every gating event can populate the ungated class of cells, it is expected that together these cells represent a heterogeneous cell population. Therefore, in tSNE plots (Zhou et al., 2018), these ungated cells are visualized as randomly scattered over the gated cell population (Fig. 2A). This is further evident by analyzing the silhouette width of each cell type cluster per sample, wherein the cluster of ungated cells with very low or negative width indicates their lower clustering potential than any of the gated cell types (Fig. 2B). Here we emphasize that these ungated cells can represent a large cell pool with multi-faceted, heterogeneous and undefined marker expression profiles, making their filtration difficult with typical ML approaches.
Table 1.
Datasets description
| Dataset | No. of samples | No. of markers | Mean cell count | No. of cell types | Stimulation | No. of batches | Reference |
|---|---|---|---|---|---|---|---|
| Levine 13 dim | 1 | 13 | 167K | 24 | No | 1 | Levine et al. (2015) |
| Levine 32 dim | 2 | 32 | 132K | 14 | No | 1 | Levine et al. (2015) |
| Samusik | 10 | 39 | 84K | 24 | No | 1 | Samusik et al. (2016) |
| Multi-center | 16 | 8 | 58K | 4 | No | 2 | Nassar et al. (2015) |
| POISED | 30 | 39 | 139K | 25 | 2 | 7 | N/A |
Note: For details, see Supplementary Text.
Fig. 2.
Distribution of ungated cells. (A) tSNE visualization to show the unclustered (or random) distribution of ungated cells compared to the gated cell types. (B) Average silhouette width to show the clustering tendency of different cell types (see materials and methods). In all datasets, ungated cells tend to cluster weaker than any of the gated populations, despite having a large population size in the pool of live cells
To understand the influence of ungated cells on ML model efficacy, we applied multi-class LDA and deep learning (DeepCyTOF) approaches on the Samusik (Samusik et al., 2016) and Multi Center (Nassar et al., 2015) CyTOF datasets (see Supplementary Text). As expected, both LDA and DeepCyTOF predicted cell labels with high F1 scores in the absence of ungated cells in the training and test sets, however, the observed efficiency of both models dropped significantly when the complete pool of live cells, i.e. gated as well as ungated cell populations were used in test sets (Fig. 3A and B and Supplementary Fig. S4A and B). Next, we analyzed the posterior probabilities of ungated cells, predicted by LDA or DeepCyTOF, to belong to one of the gated cell types (Fig. 4). A large proportion of ungated cells had a posterior probability > 0.4, a fixed threshold used by these methods below which all cells are considered as unknown/ungated, leading to their misclassification as one of the gated cell types. Alternatively, using a high posterior probability threshold (e.g. 0.7), as suggested by Abdelaal et al. (2019), to retain high-confidence prediction may increase False Negative (FN) prediction. For instance, the predicted posterior probability distribution of many manually gated cell types (e.g. CMP, CLP and plasma cells in the Samusik dataset) was largely centered around a value of less than 0.5 (Supplementary Fig. S5A and B) and if a high posterior probability threshold is used, these cells would get misclassified to the ungated/unknown class of cells. Therefore, increasing the posterior probability threshold might not provide a viable solution to effectively filtering out the ungated cells in the unlabeled live cell dataset. Since the inclusion of ungated cells represent a real-world scenario in which both gated cell type and ungated cells are required to be correctly labeled, we developed CyAnno for predicting the gated cell types while considering the marker expression profile of ungated cell labels.
Fig. 3.
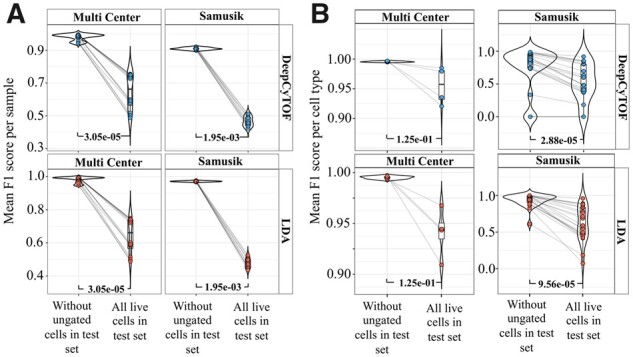
(A) Comparison of per sample F1 score without ungated live cells versus with ungated live cells in the test set after applying DeepCyTOF and LDA to two datasets (Multi Center and Samusik). For estimating F1 score for all live cells, TP ungated cells were excluded (see Supplementary Methods). (B) Mean F1 score comparison for each gated cell type (using DeepCyTOF and LDA), with and without including ungated live cells in the test set. (see Supplementary Text, Supplementary Sections S5 and S6). P-values were calculated using paired Wilcoxon Rank Sum test
Fig. 4.
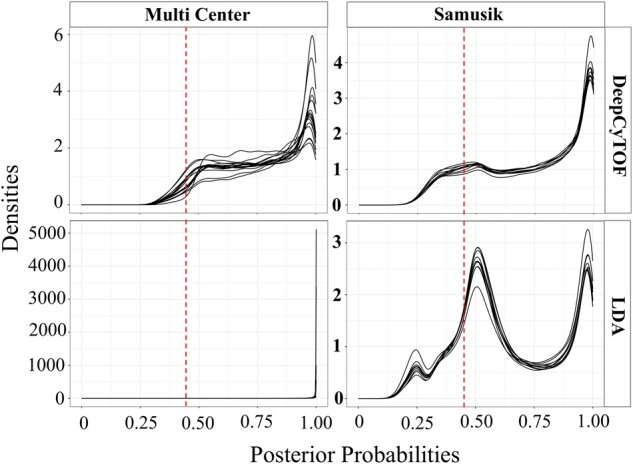
Posterior probability distribution, per sample, of ungated cells predicted by DeepCyTOF (top) and LDA (bottom) to belong to one of the gated populations. Red dotted line shows the probability threshold (0.4) below which cells are classified as ungated by default by DeepCyTOF and LDA
3.2 Comparison of CyAnno with existing methods
We tested CyAnno and compared its performance with DeepCyTOF and LDA using five-fold cross validation analysis (see Supplementary Text, Supplementary Section S5). For both DeepCyTOF and LDA, any prediction with posterior probability less than 0.4 was labeled as unknown/ungated cells, as used in their original publications. The number and proportion of LM cells shortlisted by CyAnno to retrieve the maximum number of TP cells from training dataset as NNs is available in Supplementary Figure S2B.
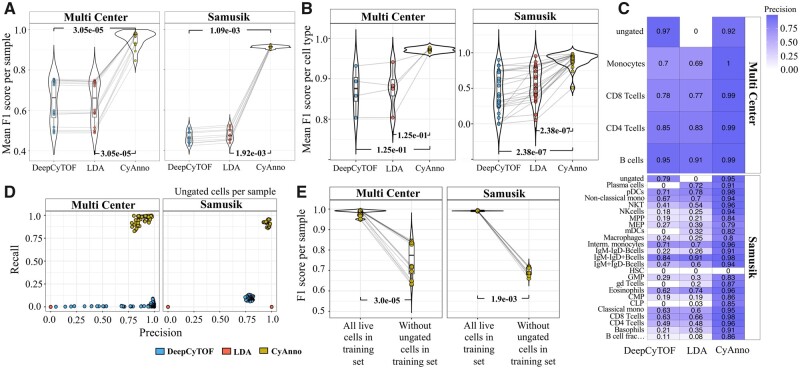
Overall, the analysis of F1 scores suggested that CyAnno outperformed both DeepCyTOF and LDA when labels of all live cells (i.e. not just the gated population) were used for model evaluation (Fig. 5A and B). Moreover, CyAnno classified gated populations with higher precision (Fig. 5C) while simultaneously filtering out the ungated class of cells from the dataset with higher recall rate (Fig. 5D). However, we observed a significant drop in the prediction accuracy of CyAnno when ungated cells were excluded from training set while keeping them in the test set (Fig. 5E), confirming their essential role in model performance. In addition, we also observed that CyAnno precision scores were less impacted by the population size with higher observed precision (minimum precision > 0.75 across all the five runs for any cell type) than DeepCyTOF or LDA in spite of class label imbalance in the training and test sets (Fig. 6). Moreover, the limited variability in the F1 score (across five runs) further suggests the ability of CyAnno in reproducing similar results (Supplementary Fig. S6). Next, we evaluated the composition and proportion of TP and FP cell labels predicted by the three different algorithms. CyAnno outperformed both of the other methods in predicting the highest percentage of TP cells and most of the FP predictions were associated with the ungated class of cells (Supplementary Fig. S7A and B). Whereas, for DeepCyTOF and LDA, the predicted FP cells were composed of numerous gated cell type populations. For instance, in the Samusik dataset, for NK cell type, CyAnno predicted FP cells were composed of ungated and macrophages only, unlike LDA and DeepCyTOF where FP predicted labels were composed of >13 different cell types, excluding ungated cells in the case of LDA. Similarly, in the Multi Center dataset, LDA failed to identify any of the ungated cell correctly and classified all ungated cells as one of the four gated populations (Supplementary Fig. S7B).
Fig. 5.
Results evaluation with three methods. (A) Mean F1 score comparison (all live cells per sample in test set) with different cell annotation methods tested across two datasets. Mean F1 represents the average of the F1 scores per sample after five iterations of variable training sets. See Supplementary Text, Supplementary Section S5. (B) Comparison of mean F1 score for each cell type in a given dataset predicted with different methods. (C) The heatmap of precision of prediction associated with each cell type. The HSC cell type (in Samusik dataset) was found to have very small cell count (<10) in the training set and, thus, was not used in CyAnno for model training. (D) Precision-versus-recall rate estimated for ungated cells using three different methods. Recall rate for ungated cells with CyAnno were significantly higher than for the other two methods. (E) Pairwise sample F1 score comparison of CyAnno when ungated cells were included (all live cells) in model training versus when they were excluded from model training (without ungated cells). P-values reflect the statistical significance of difference in outcome when ungated cells were not considered for model training. P-values were computed with paired Wilcoxon Rank Sum test
Fig. 6.
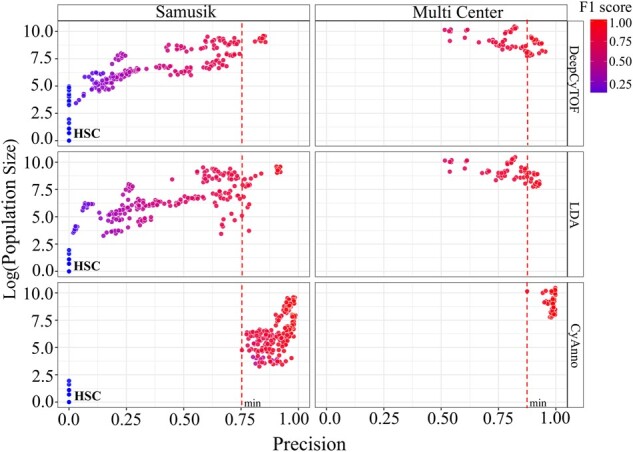
The precision scores (X-axis) are plotted with gated cell population size (Y-axis; % live cells) of the given cell type in all the samples of the given dataset. Here, the precision score for each cell type was computed using three different methods, each executed five times, with varying and independent training dataset in each run. Each circle represents the predicted precision score for a cell type per sample in one run, colored by the F1 score for that gated cell type during the respective run. The cell type HSC had a very small cell count (<10 cells) in the overall training set, which did not provide sufficient information for its training, and was thus not included in the training set. The red line marks the minimum precision score observed with CyAnno for the Samusik (0.75; HSC excluded) and Multi Center (0.87) datasets
3.3 Evaluation with independent benchmark dataset
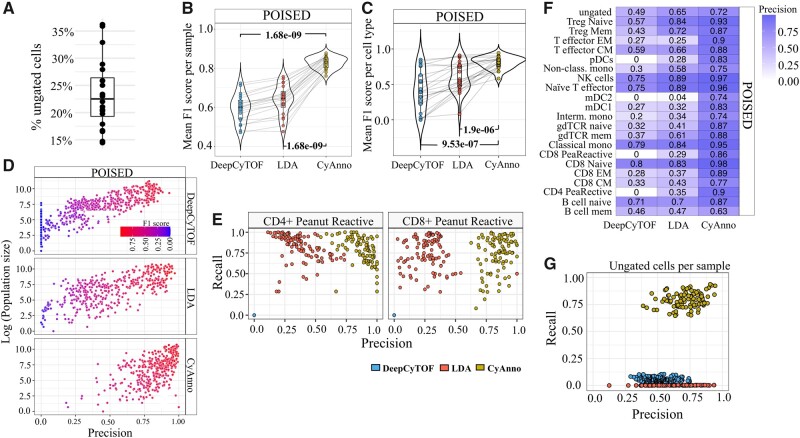
We also evaluated the performance of CyAnno with an original dataset composed of 15 peanut-stimulated and 15 unstimulated samples [viz. POISED dataset (Chinthrajah et al., 2019); see Supplementary Text], which contains 15–40% of ungated class of live cells (Fig. 7A). The mean F1 score, across the five runs, per sample as well as cell type, in the validation set was compared and we found that CyAnno outperformed both DeepCyTOF and LDA (Fig. 7B and C). Wherein, CyAnno’s performance was found to be less impacted by the cell type population size than DeepCyTOF or LDA (Fig. 7D). To ascertain the prediction, we randomly shuffled the cell labels in the validation set and re-executed CyAnno 1000 times (see Supplementary Text). In all samples, we observed P-value < 0.001 of randomly predicting the observed F1 score with CyAnno.
Fig. 7.
POISED dataset results evaluation. (A) The percentage of ungated cells per (n = 20) FCS file after hand-gating in the POISED dataset. (B) The mean F1 score observed with different methods when all live cells are used in POISED training set. (C) The mean F1 score computed for each cell type across all the samples in each dataset after five independent runs. (D) The precision scores (X-axis) are plotted with cell population size (Y-axis) of the given cell type in all samples of the given dataset. Here, the precision score for each cell type was computed using three different methods, each executed five times, with varying and independent training sets per run. Each circle represents the predicted precision score for a cell type per sample per run, colored by the F1 score for that cell type during the respective run. (E) Precision and Recall rate observed for two different peanut reactive cell types with different methods across five different runs with varying training sets. Each colored dot represents a predicted score (precision and recall value) observed for the CD4+/CD8+ peanut reactive cell type by three different methods (colored) in the five different runs in validation set. CyAnno predicted labels were found to have better precision than LDA and DeepCyTOF. (F) The heatmap of precision of prediction associated with each cell type. (G) Precision-versus-recall rate estimated for ungated cells in POISED dataset using three different methods. The recall rate for ungated cells with CyAnno was significantly higher than for the other two methods
Furthermore, we investigated the ability of the different methods to identify CD4+ and CD8+ peanut-reactive cells, which represented <2% of total live cell population (mean cell count of 114.17 and 298.78 cells per sample respectively) and shared similar marker expression profile with many other cell types included in the dataset (Supplementary Fig. S8A). The precision-versus-recall scatter plot analysis revealed the high precision of CyAnno in detecting these rare cells (Fig. 7E), whereas DeepCyTOF failed to predict these cells while LDA predicted these cells with lower precision than CyAnno. We also evaluated the composition of FP cell type labels predicted for each cell type (Supplementary Fig. S7C) which suggests that most of the CyAnno predicted FP labels were composed of ungated class of cells, unlike LDA and DeepCyTOF. For instance, the FP cells for the CD4+ peanut reactive cell type predicted with CyAnno mainly included the ungated class of cells (total three cell types), whereas with LDA and DeepCyTOF ∼10 different cell types were falsely predicted as CD4+ peanut reactive cells. Overall, CyAnno had a higher precision of prediction than LDA and DeepCyTOF for most of the cell types (Fig. 7F), whereas the ungated class of cells was filtered out with a higher recall rate (Fig. 7G).
Furthermore, we trained the three different methods using only a single cell type, i.e. the CD4+ peanut reactive or CD8+ peanut reactive cell type (sample size = 3) and predicted these cells in the 20 samples from the independent test set (Fig. 8). We found that CyAnno can be used for training and predicting even a single cell types with significantly higher accuracy than LDA and DeepCyTOF.
Fig. 8.
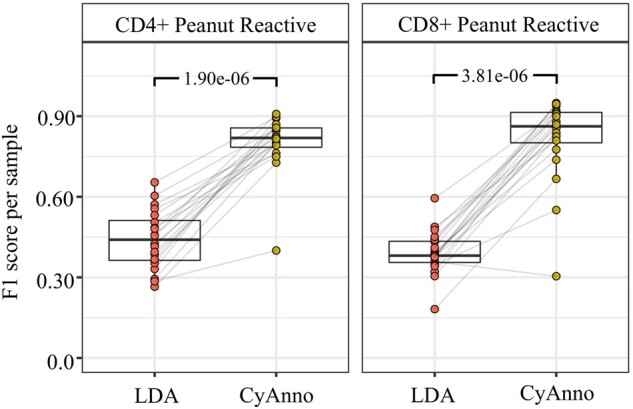
F1 scores observed with CyAnno and LDA, when the algorithm was trained to predict only the CD4 peanut reactive cell type or only the CD8 peanut reactive cell type, respectively in a different run. The observed F1 score reflects the accuracy by which CD4 peanut reactive cells and CD8 peanut reactive cells were predicted in the independent test dataset with 20 samples. For LDA, we used two classes of cell types, one defined as CD4 or CD8 peanut reactive cell type and the rest of the cell types were defined as ‘other’. With DeepCyTOF, we were not able to predict any of the CD4 or CD8 peanut reactive cells. P-values were calculated using paired Wilcoxon Rank Sum test
Next, for estimating sample size effect, we re-executed CyAnno with varying number of sample size (n = 1, …, 10) in the training set. The analysis showed no drastic change in F1 scores, however, for larger sample sizes (e.g. n = 10) we observed large F1 scores for all samples in the validation set (Supplementary Fig. S9). We further tested if CyAnno predicts biased results for samples that are processed only for a given stimulation, by training the models with seven peanut stimulated samples and tested its performance on the 20 independent samples (Supplementary Fig. S10). The results suggested that the unstimulated samples were found to have comparatively high F1 score (F1: 0.89-0.99) even though only peanut stimulated samples were used in the training set, and that the CyAnno results were not biased for the weak stimulations.
4 Discussion
CyAnno is a new tool aimed to label the single cells in large-scale cytometry datasets by modeling the marker expression profiles through the use of machine learning approaches on manually gated and ungated cell populations. We have shown that ungated cells are present in a substantially large number, yet they are largely ignored by the existing cell label prediction approaches. Theoretically, an ungated cell can represent a cell just outside the manually drawn gate or an ‘unknown’ but biologically relevant cell type or simply a cell from a cell type not considered during manual gating. As a result, the ambiguous marker expression profile of ungated cells makes their identification challenging. Therefore, CyAnno offers a systematic approach to train and predict the ungated as well as the manually gated cells with overall higher accuracy. For the other semi-automated methods, using the heterogeneous ungated cells for modeling cell type(s) is a technical challenge, as these cells cannot be used as single class of cells. CyAnno overcomes this problem by building a cell type specific ‘one-vs-rest’ binary model, in which the predicted posterior probability for a TP cell to be assigned to its cell type by the respective model should be >0.50 and it is independent of the other cell types as well as ungated cells. To achieve this, CyAnno expects a user-defined list of lineage or discriminant markers. The choice of lineage markers is critical and in theory, should be based on the markers used for manual gating and expert knowledge. For example, in the POISED dataset we excluded PD-1 for classification, but in another study it was used as a lineage marker (Thommen et al., 2018).
In addition, CyAnno also performed exceptionally good in the identification of rare cell types, e.g. CD4+ and CD8+ peanut-reactive cell types, which are not captured effectively by the other semi-supervised approaches used in this study. In fact, CyAnno allows to train and predict such rare single cell type independently which can be useful for a broad range of studies in which a specific cell type [e.g. CD45+ Linlo cells in (Hamers et al., 2019)] is manually gated for downstream analysis. This can save efforts and time during manual gating for large-scale studies and can assist focused research without compromising on overall accuracy. Moreover, CyAnno can be used to predict any predefined cell subset (e.g. novel cell subset predicted via unsupervised clustering) in the unlabeled dataset.
One of the known limitations of CyAnno is its higher computational cost than DeepCyTOF and LDA (Supplementary Fig. S11, see Supplementary Text, Supplementary Section S7), as hyper-parameter optimization (for all of the ML algorithms) consumes the majority of the computational time, wherein XGboost performed better than other classifiers, in terms of computational cost and prediction accuracy. Since the hyper-parameter optimization is the most time consuming yet unavoidable part of CyAnno, the future plan is to incorporate Bayesian hyper-parameter optimization that can evaluate much a larger combination of hyper-parameters with lower computational cost.
In summary, we have shown the overall size and impact of ungated cells in guiding the process cell type prediction and proposed a novel approach to learn their features for the classification of gated cell types. CyAnno aims to assist large-scale cytometry studies where hand-gating can be time consuming and vulnerable to human subjectivity.
Funding
This work was supported by the National Institutes of Health/National Institute of Allergy and Infectious Diseases (NIAID) [5U19 AI104209-07, R01AI140134-01 and 5U01 AI140498-03], the Sean N Parker Center for Allergy and Asthma Research at Stanford University. Also, this work was partially supported by the National Institutes of Health [P30-CA124435, P30-DK116074 and UL1-TR003142].
Conflict of Interest: K.C.N. reports grants from National Institute of Allergy and Infectious Diseases (NIAID), National Heart, Lung, and Blood Institute (NHLBI) and National Institute of Environmental Health Sciences (NIEHS); Food Allergy Research & Education (FARE), Director of World Allergy Organization (WAO) Center of Excellence at Stanford; Advisor at Cour Pharma; Co-founder of Before Brands, Alladapt, Latitude, and IgGenix; National Scientific Committee member at Immune Tolerance Network (ITN) and National Institutes of Health (NIH) clinical research centers; DSMB member for NHLBI, US patents for basophil testing, multifood immunotherapy and prevention, monoclonal antibody from plasmoblasts and device for diagnostics.
Supplementary Material
Contributor Information
Abhinav Kaushik, Department of Medicine, Sean N Parker Center for Allergy and Asthma Research at Stanford University, Stanford University, Stanford, CA 94305–5101, USA.
Diane Dunham, Department of Medicine, Sean N Parker Center for Allergy and Asthma Research at Stanford University, Stanford University, Stanford, CA 94305–5101, USA.
Ziyuan He, Department of Medicine, Sean N Parker Center for Allergy and Asthma Research at Stanford University, Stanford University, Stanford, CA 94305–5101, USA.
Monali Manohar, Department of Medicine, Sean N Parker Center for Allergy and Asthma Research at Stanford University, Stanford University, Stanford, CA 94305–5101, USA.
Manisha Desai, Department of Medicine, Quantitative Sciences Unit, Stanford University, Stanford, CA 94305–5101, USA.
Kari C Nadeau, Department of Medicine, Sean N Parker Center for Allergy and Asthma Research at Stanford University, Stanford University, Stanford, CA 94305–5101, USA.
Sandra Andorf, Department of Medicine, Sean N Parker Center for Allergy and Asthma Research at Stanford University, Stanford University, Stanford, CA 94305–5101, USA; Department of Pediatrics, University of Cincinnati College of Medicine, Cincinnati, OH 45229, USA; Divisions of Biomedical Informatics and Allergy & Immunology, Cincinnati Children’s Hospital Medical Center, Cincinnati, OH 45229, USA.
References
- Abdelaal T. et al. (2019) Predicting cell populations in single cell mass cytometry data. Cytom. A, 95, 769–781. [DOI] [PMC free article] [PubMed] [Google Scholar]
- Adan A. et al. (2017) Flow cytometry: basic principles and applications. Crit. Rev. Biotechnol., 37, 163–176. [DOI] [PubMed] [Google Scholar]
- Bandura D.R. et al. (2009) Mass cytometry: technique for real time single cell multitarget immunoassay based on inductively coupled plasma time-of-flight mass spectrometry. Anal. Chem., 81, 6813–6822. [DOI] [PubMed] [Google Scholar]
- Becht E. et al. (2019) Reverse-engineering flow-cytometry gating strategies for phenotypic labelling and high-performance cell sorting. Bioinformatics, 35, 301–308. [DOI] [PubMed] [Google Scholar]
- Bhaduri A. et al. (2018) Identification of cell types in a mouse brain single-cell atlas using low sampling coverage. BMC Biol., 16, 113. [DOI] [PMC free article] [PubMed] [Google Scholar]
- Chen T., Guestrin C. (2016) XGBoost: a scalable tree boosting system. In Proceedings of the ACM SIGKDD International Conference on Knowledge Discovery and Data Mining, pp. 785–794. ACM.
- Chinthrajah R.S. et al. (2019) Sustained outcomes in oral immunotherapy for peanut allergy (POISED study): a large, randomised, double-blind, placebo-controlled, phase 2 study. Lancet, 394, 1437–1449. [DOI] [PMC free article] [PubMed] [Google Scholar]
- Cortes C., Vapnik V. (1995) Support-vector networks. Mach. Learn., 20, 273–297. [Google Scholar]
- Gadalla R. et al. (2019) Validation of CyTOF against flow cytometry for immunological studies and monitoring of human cancer clinical trials. Front. Oncol., 9, 415. [DOI] [PMC free article] [PubMed] [Google Scholar]
- Hamers A.A.J. et al. (2019) Human monocyte heterogeneity as revealed by high-dimensional mass cytometry. Arterioscler. Thromb. Vasc. Biol., 39, 25–36. [DOI] [PMC free article] [PubMed] [Google Scholar]
- Hwang B. et al. (2018) Single-cell RNA sequencing technologies and bioinformatics pipelines. Exp. Mol. Med., 50, 1. [DOI] [PMC free article] [PubMed] [Google Scholar]
- Lee H.-C. et al. (2017) Automated cell type discovery and classification through knowledge transfer. Bioinformatics, 33, 1689–1695. [DOI] [PMC free article] [PubMed] [Google Scholar]
- Lee H. et al. (2019) High-throughput analysis of clinical flow cytometry data by automated gating. Bioinform. Biol. Insights, 13, 1177932219838851. [DOI] [PMC free article] [PubMed] [Google Scholar]
- Levine J.H. et al. (2015) Data-driven phenotypic dissection of AML reveals progenitor-like cells that correlate with prognosis. Cell, 162, 184–197. [DOI] [PMC free article] [PubMed] [Google Scholar]
- Li H. et al. (2017) Gating mass cytometry data by deep learning. Bioinformatics, 33, 3423–3430. [DOI] [PMC free article] [PubMed] [Google Scholar]
- Liu X. et al. (2019) A comparison framework and guideline of clustering methods for mass cytometry data. Genome Biol., 20, 297. [DOI] [PMC free article] [PubMed] [Google Scholar]
- Maecker H.T., Harari A. (2015) Immune monitoring technology primer: flow and mass cytometry. J. Immunother. Cancer, 3, 44. [DOI] [PMC free article] [PubMed] [Google Scholar]
- Mair F. et al. (2016) The end of gating? An introduction to automated analysis of high dimensional cytometry data. Eur. J. Immunol., 46, 34–43. [DOI] [PubMed] [Google Scholar]
- McKinnon K.M. (2018) Flow cytometry: an overview. Curr. Protoc. Immunol., 2018, 5.1.1–5.1.11. [DOI] [PMC free article] [PubMed] [Google Scholar]
- Melchiotti R. et al. (2017) Cluster stability in the analysis of mass cytometry data. Cytom. A, 91, 73–84. [DOI] [PubMed] [Google Scholar]
- Nassar A. et al. (2015) The first multi-center comparative study using a novel technology mass cytometry time-of-flight mass spectrometer (cytof2) for high-speed acquisition of highly multi-parametric single cell data: a status report. In: Presented at the 30th Congress of the International Society of Advancement of Cytometry.
- Nowicka M. et al. (2017) CyTOF workflow: differential discovery in high-throughput high-dimensional cytometry datasets. F1000Research, 6, 748. [DOI] [PMC free article] [PubMed] [Google Scholar]
- O’Brien T.A. et al. (2016) A fast and objective multidimensional kernel density estimation method: fastKDE. Comput. Stat. Data Anal., 101, 148–160. [Google Scholar]
- Palit S. et al. (2019) Meeting the challenges of high-dimensional single-cell data analysis in immunology. Front. Immunol., 10, 1515. [DOI] [PMC free article] [PubMed] [Google Scholar]
- Pan X. (2015) Single Cell Analysis: from Technology to Biology and Medicine. Single Cell Biol, 3, 106. [DOI] [PMC free article] [PubMed] [Google Scholar]
- Rumelhart D.E. et al. (1986) Learning representations by back-propagating errors. Nature, 323, 533–536. [Google Scholar]
- Samusik N. et al. (2016) Automated mapping of phenotype space with single-cell data. Nat. Methods, 13, 493–496. [DOI] [PMC free article] [PubMed] [Google Scholar]
- Staats J. et al. (2019) Guidelines for gating flow cytometry data for immunological assays. In: McCoy, Jr J. (ed.) Immunophenotyping Methods in Molecular Biology. Humana, New York, NY, pp. 81–104. [DOI] [PubMed] [Google Scholar]
- Stanley N. et al. (2020) VoPo leverages cellular heterogeneity for predictive modeling of single-cell data. Nat. Commun, 11, 3738. [DOI] [PMC free article] [PubMed] [Google Scholar]
- Thommen D.S. et al. (2018) A transcriptionally and functionally distinct pd-1 + cd8 + t cell pool with predictive potential in non-small-cell lung cancer treated with pd-1 blockade. Nat. Med., 24, 994–1004. [DOI] [PMC free article] [PubMed] [Google Scholar]
- Zhang Z. et al. (2019) SCINA: semi-supervised analysis of single cells in silico. Genes (Basel), 10, 531. [DOI] [PMC free article] [PubMed] [Google Scholar]
- Zhou H. et al. (2018) T-distributed stochastic neighbor embedding method with the least information loss for macromolecular simulations. J. Chem. Theory Comput., 14, 5499–5510. [DOI] [PMC free article] [PubMed] [Google Scholar]
Associated Data
This section collects any data citations, data availability statements, or supplementary materials included in this article.


