

Abstract
Our objective was to identify the molecule which can inhibit SARS-CoV-2 main protease and can be easily procured. Natural products may provide such molecules and can supplement the current custom chemical synthesis-based drug discovery for this objective. A combination of docking approaches, scoring functions, classical molecular dynamic simulation, binding pose metadynamics, and free energy perturbation calculations have been employed in this study. Theaflavin digallate has been observed in top-scoring compounds after the three independent virtual screening simulations of 598435 compounds (unique 27256 chemical entities). The main protease-theaflavin digallate complex interacts with critical active site residues of the main protease in molecular dynamics simulation independent of the explored computational framework, simulation time, initial structure, and force field used. Theaflavin digallate forms approximately three hydrogen bonds with Glutamate166 of main protease, primarily through hydroxyl groups in the benzene ring of benzo(7)annulen-6-one, along with other critical residues. Glu166 is the most critical amino acid for main protease dimerization, which is necessary for catalytic activity. The estimated binding free energy, calculated by Amber and Schrodinger MMGBSA module, reflects a high binding free energy between theaflavin digallate and main protease. Binding pose metadynamics simulation shows the highly persistent H-bond and a stable pose for the theaflavin digallate-main protease complex. Using method control, experimental controls, and test set, alchemical transformation studies confirm high relative binding free energy of theaflavin digallate with the main protease. Computational molecular interaction suggests that theaflavin digallate can inhibit the main protease of SARS-CoV-2.
Keywords: SARS-CoV-2, Main protease, Theaflavin digallate
Abbreviations: FEP, Free Energy Perturbation
1. Introduction
The current coronavirus disease 2019 (COVID-19) pandemic is caused by severe acute respiratory syndrome coronavirus 2 (SARS-CoV-2), previously tentatively named as 2019-nCoV. The 2012 epidemic of Middle East respiratory syndrome (MERS) was caused by Middle East respiratory syndrome-related coronavirus (MERS-CoV), and the 2003 epidemic of severe acute respiratory syndrome (SARS) was caused by severe acute respiratory syndrome coronavirus (SARS-CoV). SARS-CoV-2, SARS-CoV, and MERS-CoV belong to the same genus, Beta coronavirus [1]. As of August 31, 2022, the total number of covid-19 cases was 599,825,400, including 6,469,458 deaths [2].
SARS-CoV-2 is a single-stranded, positive-sense, and enveloped RNA virus. The genome size is approximately 30 kilobases. Depending on the ribosomal frameshift, either replicase polyprotein pp1a (nsp1-11) or replicase polyprotein pp1ab (nsp1-16) is translated from the genomic open reading frame 1a and 1ab, respectively [3]. SARS-CoV-2 has four structural proteins: spike, envelope, matrix, and nucleocapsid. Apart from structural protein, sixteen nonstructural proteins and nine accessory factors are also present in SARS-CoV-2. The 16 nonstructural proteins together form the replicase/transcriptase complex. The role of micro-RNA has also been observed to be responsible for viral egression and immune evasion [4]. Furthermore, host-related proteins such as transmembrane serine protease 2 (TMPRSS2), furin, and cathepsin L have also been involved in the viral entry [5].
The current chemical therapeutics against SARS-CoV-2 include Remdesivir (intravenous), Ritonavir-boosted Nirmatrelvir (Paxlovid, oral), and Molnupiravir (oral). Evusheld (intramuscular injection) is recommended as monoclonal antibodies for pre-exposure prophylaxis and Babtelovimab (intravenous injection) for treatment. Molnupiravir and Remdesivir inhibit the function of RNA-dependent RNA Polymerase [6,7]. Nirmatrelvir is the only orally available drug against main protease of SARS-CoV-2 [8]. Ritonavir is a CYP3A4 inhibitor and increases the Nirmatrelvir concentration in therapeutic range [9].
Main protease (also known as Mpro, 3CLpro, and nsp5 protease) is necessary for processing polyproteins from Nsp4–11 or Nsp4–16. Main proteases are chymotrypsin-like cysteine proteases. Main protease is essential in proteolytic processing and is responsible for the generation of functional proteins of SARS-CoV-2. Furthermore, no known homolog protease is present in humans. Hence, it has been extensively explored as a drug target against SARS-CoV or SARS-CoV-2 [10]. Main protease has three domains, Domain 1 and domain 2 are rich in beta-strands, whereas domain 3 is predominantly a helical structure. Main protease is biologically active in the form of a dimer.
Natural products offer a wide range of opportunities in this scenario as it provides a diverse chemical scaffold that cannot be represented using conventional chemical libraries. Natural products can have known side effects/pharmacodynamics/pharmacokinetics as natural products may have been used traditionally for several indications. Natural products are chiral-rich molecules and offer many stereoisomers whose biological exploration might be limited using conventional wet experimental techniques. Furthermore, natural products provide the opportunity to harness the chemical product, which can result due to the long evolutionary interaction.
The structural bioinformatics efforts to identify inhibitors against main protease can be divided into three stages. The first stage was numerous high-speed studies published as peer-reviewed/preprints involving molecular docking/dynamics, including ours as a preprint [[11], [12], [13]]. In a critical review of the 61 peer-reviewed manuscripts from the first stage, about half of the manuscripts did not include a molecular dynamics study, included single-step docking, and were without computational validation [14]. Similarly, in another perspective from 168 published articles on molecular docking of main protease, approximately half of the articles have not evaluated the docking performance [15].
The second stage involved the analysis of these published data, which led to several critical reviews and benchmarking studies. The third stage followed the recommendation of these benchmarking studies to seek further computational reproducibility. The computational calculations have inherent biases; hence, one suitable method for one target can fail on another target. In benchmarking study on SARS-CoV-2 main protease, free energy perturbation methods have performed better than routinely used MMGBSA/MMPBSA methods or other less reported methods such as linear interaction energy [16]. The residues Thr26, His41, Ser46, Asn142, Gly143, Cys145, His164, Glu166, and Gln189 have been critical for main protease inhibition [16]. Another benchmarking study by Zev et al. also imposed the limitations of docking simulation alone to predict the best pose, despite being shown Glide as the top performer compared to Dock, AutoDock, AutoDock Vina, Fred, and Enzydoc. Zev et al. also pointed out the need for free energy perturbation studies in main protease inhibitor design [17].
Computational calculations to identify the potential inhibitor require an extensive conformation sampling of ligands. The generation of multiple-input ligands structure has been recommended to achieve the optimal pose. The sole dependence on docking algorithm to generate conformers might not be sufficient to explore the lowest binding free energy state of protein-ligand complex [18]. Docking calculations can have numerical artifacts and may lack reproducibility over different computing variants/input conformation [19]. Similarly, the conclusion made from the single/triplicate replica of molecular dynamics trajectories is often error-prone. In molecular dynamics simulation, similar molecular systems can explore different trajectories attributed to algorithmic differences, the stochastic nature of simulations such as initial velocities, and the difference in computing platforms such as compilers and computing cores [20,21]. Furthermore, the inclusion of target flexibility and evaluation by achieving consensus across methods has been recommended in the main protease inhibitor studies [15].
Hence, we have studied the computational molecular interaction of SARS-CoV-2 main protease with readily available natural products using three independent virtual screening runs using different computing environments/input conformations, molecular dynamics using Desmond and Amber18, molecular dynamics by varying GPUs, simulation time, input structure, and force field, binding free energy estimation using Schrodinger and Amber MMGBSA module, the inclusion of explicit water in MMGBSA calculation, evaluation of H-bond persistence and pose stability using binding pose metadynamics, free energy perturbation using method control, free energy perturbation by varying ionization state and core RMSD and further confirmation by thermodynamic integration and multistate Bennett acceptance ratio. While analyzing interactions in a computational model, we have observed that theaflavin digallate (TG) may inhibit SARS-CoV-2 main protease. The in-vitro experimental data for the inhibition of SARS-CoV main protease by TG is available in existing literature [22].
2. Methodology
Structural coordinates of easily available natural products in SDF file formats were downloaded from ZINC database [23]. Ligand preparation was performed using the LigPrep module [24]. The force field OPLS3e was used to generate the three-dimensional conformation of natural products. Natural products were desalted and neutralized. Ionization states were prepared at neutral pH using Epik [25]. The similarity of natural products in the virtual screening ligand library was accessed using hierarchical ligand clustering with a similarity cutoff of 0.8. The structure FragFP of data warrior was used as a descriptor [26]. PDB ID 6LU7 was used as SARS-CoV-2 main protease. Hydrogen atoms were added, and side chains were optimized using the prep wizard utility of the Schrodinger suite. Ionizable groups at pH seven were predicted using PROPKA, and hydrogen bonds were optimized using ProtAssign utility [27]. The structure was minimized with only restraints on heavy atoms using impref utility. The docking grid files were centered on Cys145 and His41 as these residues were identified as a catalytic dyad of main protease [28].
The protein was docked using a virtual screen workflow combining Glide module version 8.1 with high throughput virtual screening (Glide HTVS), single-precision (Glide SP), and extra precision (Glide XP). The experiments were replicated thrice. We have used 598435 structures as an initial set in each virtual screen workflow. Glide XP has more extensive conformational sampling, such as anchor-and-grow methodology, and a more stringent scoring function, such as high penalty scores for receptor-ligand non-complementary than Glide SP. Furthermore, Glide XP also includes “virtual water” to estimate the desolvation energy and ligand water interaction. The compounds were ranked on the basis of docking scores. The binding energy was estimated using Prime MMGBSA for the ligand-receptor complex derived after Glide XP docking and molecular dynamics simulation. The Optimized Variable Dielectric Surface Generalized Born version 2.0 (VSGB2) was used as an implicit solvation model [29]. The complex was evaluated according to MMGBSA dG bind score where the dG bind = E_complex (minimized) - E_ligand (minimized) -E_receptor(minimized). The Prime MMGBSA total energy includes the energy component viz. Coulombic, covalent, Van der Waals, lipophilic, and generalized Born electrostatic solvation. The prime MMGBSA includes correction terms for hydrogen bonding, pi-pi, and self-contact interaction.
2.1. Molecular dynamics study using Desmond
The molecular dynamic simulation of the top-scoring complex after the Glide XP stage was performed using the Desmond molecular dynamics package 2019 with OPLS 2005 and OPLS3e force field. The solvation model used for molecular dynamics simulation was TIP3P. Ten Å orthorhombic box has been used as boundary conditions. The charge was neutralized by adding four Na+ ions, and 0.15 M NaCl was added as a salt. Simulations were run for 200 ns in NPT conditions and at 300 K and 1.01 bars.
Reversible reference system propagator algorithms (RESPA) integrator has been used with a time step of 2 fs for bonded interaction, 2 fs for short-range electrostatic, and van der Waals interaction, and 6 fs for the long-range electrostatic interaction. The short-range and long-range interaction was defined using a cutoff radius of 9 Å. Nose-hoover chain was used as a thermostat with a relaxation time of 1 ps. Martyna-Tobias-Klein piston was used as a barostat with a relaxation time of 2 ps [30]. No positional restraints have been used. The custom seed value 2007 was used to randomize the velocity.
2.2. Principal component analysis
Principal component analysis (PCA) has been employed to determine the essential dynamics of main protease in complex with TG. PCA is a multivariate statistical technique that linearly transforms the data to extract the important features from a covariance matrix. A cartesian coordinate covariance matrix is computed and diagonalized to obtain the eigenvector and the corresponding eigenvalues. The cpptraj module of the amber software was employed to compute the PCA on the molecular dynamics trajectory. Translational and rotational motions were eliminated by fitting the trajectory C-alpha atom coordinates to the average structure. The porcupine plot was visualized using the Normal Mode Wizard of VMD to identify the dominant motions in the protein. R was used to plot the 2D projection data.
2.3. Molecular dynamics study using amber
MD simulations were also performed using the GPU accelerated program in Amber18 package [31]. Parameterization of the ligand was done using antechamber tool, and charge was assigned using AM1-BCC model. Additional force field parameters for the ligand were generated using the Paramchk2 program. The tleap module was used in the preparation of the topology and coordinate files. Amber force field ff99SB and General Amber Force Field (GAFF) parameters were used for the protein and ligand, respectively. The complex was solvated using the TIP3P water model, and negative charge was neutralized with four Na+ ions.
Minimization was done to relax the system and was performed in two steps - (a) with restraints on the solute and (b) without restraints. Minimization with restrains involved 500 steps of steepest descent and 500 steps of conjugate gradient, respectively. Minimization without restraint was performed for 3000 steps involving steepest descent and conjugate gradient method. After minimization, the system was slowly heated to 300 K within the NVT (constant number of particles, volume, and temperature) ensemble for 60 ps. After that, equilibration was performed without restraint on the solute at 1 atm pressure under the NPT (constant number of particles, pressure, and temperature) ensemble. The time involved for equilibration was 100 ps. Langevin dynamics (with 1.0 ps-1 collision frequency) and isotropic position scaling (relaxation time was 2 ps) were used to maintain the temperature and pressure.
The simulations were performed at constant temperature (300 K) and pressure (1 atm). Shake algorithm was applied, and hydrogen bonds were constrained with a time step of 2 fs in the heating, equilibration, and production simulations. Periodic boundary conditions were employed, and Particle Mesh Ewald (PME) method was used to determine the long-range electrostatic interactions. The cutoff value was set to 8 Å for the non-bonded interactions. Binding free energy was calculated using the MMPBSA.py script of the amber tools package. The Amber MMPBSA.py primarily calculates the binding free energy in Delta G gas and Delta G solvation where Delta G gas score = van der Waals interaction in gas phase + electrostatic interaction in gas phase and Delta G solvation score = Nonpolar solvation Free energy + Polar Solvation Free Energy [32].
2.4. Binding pose metadynamics studies
The binding pose metadynamics has been carried out as described by Clark et al. using the default parameters of the binding pose metadynamics module of Schrodinger 2018-4 software suite [33]. The force field used was OPLS3e. Four sodium ions were used for neutralization. One binding pose metadynamics simulation consists of ten independent runs of 10 ns each. All simulation was carried out on GTX 1070 GPU having Ubuntu 18.04 as the operating system. One-tenth of KbT, 0.05 kcal/mol, was used as hill height, and 0.02 Å was used as hill width. RMSD of ligand-heavy atoms with respect to their starting position is considered as a collective variable.
2.5. Free energy perturbation studies
The relative binding free energy was calculated by free energy perturbation/alchemical transformation of TG to mutated ligand (TG’) using the Desmond academic module of DE Shaw research. The relative binding free energy of the wild type (TG) and mutated ligand (TG′) can be defined as ΔΔG (relative binding free energy) = ΔG2- ΔG1 = ΔG4- ΔG3 following the thermodynamic cycle as of below.
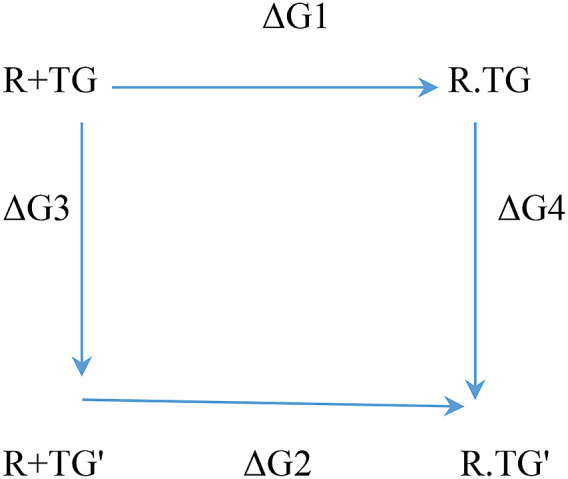
As the calculation of ΔG2- ΔG1 requires high computational resources, the relative binding free energy was calculated using ΔG4- ΔG3. Two sets of simulations were carried out to calculate ΔG4 and ΔG3. The calculation of ΔG4 is termed as complex calculation as it evaluates the energy difference between two complexes R.TG′ and R.TG. Similarly, the calculation of ΔG3 is termed as solvent calculation. In these two simulation cycles, the stepwise ligand mutation, i.e., TG to TG′, was achieved using an alchemical stepwise window/coupling parameter (λ) value from 0.1 to 0.9. TG reflects the λ value = 0, whereas TG’ has the λ value = 1.
For each lambda window, the molecular dynamic simulation of 5 ns has been carried out. Replica exchange and solute tempering have been employed as a sampling method for receptor and ligand rearrangement, which involves temperature variation on the relevant portion of ligand and protein. In this process, the temperature increases from the initial window to the middle window and gradually decreases to its initial value in the final lambda window. The exchange of configuration between neighboring windows was attempted at every 1.2 ps. In both solvent and complex calculations, 12 λ values have been used.
The box shape was orthorhombic, and the buffer width was 5 Å and 10 Å for the complex and solution simulation, respectively. Before lambda hopping, the system preparation stage includes the default Desmond settings, for example, starting with Brownian dynamics NVT at 10 K and with restraints on solute heavy atoms for 100 ps, followed by NVT and NPT classical dynamics simulation with restraints on the heavy solute atom for 12 ps. The next system preparation stage included NPT with restraints and NPT without restraints for 24 ps and 240 ps, respectively. The same protocols were followed for the TG and TG′ in complex with main protease and TG and TG′ in solution.
The estimated relative binding free energy calculated using FEP was validated through thermodynamic integration and multistate Bennett acceptance ratio using Sire/OpenMM-SOMD. Briefly, the parameterization of the ligand was done automatically by FESetup. AM1-BCC charge model and GAFF2 force field were used to parameterize the ligand. The equilibration was done at the NVT ensemble. The density was stabilized using the NPT ensemble. Production run simulations were performed using an NPT ensemble. The free energy computation was performed using the analyse_freenrg mbar tool of Sire.
3. Results and discussion
3.1. Theaflavin digallate has been observed as a top-scoring pose across computational platforms and number of input conformation
We have used unique natural compounds that are reported to be readily available on the ZINC database, i.e., marked as “for-sale,” “in-stock,” and “natural products.” This resulted in 27256 unique chemical entities. The possible isomeric/ionization/minimized conformation from this set resulted in 598435 distinct ligands with a cap of a maximum of 32 stereoisomers from each chemical ionization state. However, we have also employed enhanced ligand conformation sampling at Glide SP and XP stages to generate multiple input structures. This enhanced sampling gives each ligand three conformations, i.e., original conformation, optimized using MMFFS force field, and optimized using OPLS force field. As the aim of any molecular docking algorithm is to achieve best possible pose of ligand, which in turn is dependent on having lowest docking score, we have employed enhanced sampling and not dependent solely on docking algorithms for input generation [18]. Data on the top 10 conformations of three independent virtual screening runs are presented in Table 1 and Supplementary Tables 1 and 2. Ligands were sorted according to respective docking scores. The number of compounds kept in each consecutive step is represented in Supplementary Table 3.
Table 1.
The top 10 ligands after the virtual screening of 598435 unique compounds (27256 unique chemical entities). The ligands are sorted according to their docking score.
| ZINC_id | docking score (kcal/mol) | XP Gscore (kcal/mol) | Glide Gscore (kcal/mol) | Glide energy (kcal/mol) | Glide emodel (kcal/mol) |
|---|---|---|---|---|---|
| ZINC000195838435 (Theaflavin digallate) | −15.263 | −15.2929 | −15.2929 | −80.7874 | −114.878 |
| ZINC000195838435 (Theaflavin digallate) | −14.9138 | −14.9437 | −14.9437 | −76.8608 | −109.745 |
| ZINC000195838435 (Theaflavin digallate) | −14.4314 | −14.4613 | −14.4613 | −72.5158 | −111.75 |
| ZINC33861449 | −14.4268 | −14.5059 | −14.5059 | −65.6439 | −106.16 |
| ZINC000085645325 | −14.24 | −14.24 | −14.24 | −83.6571 | −106.964 |
| ZINC000085645325 | −14.2216 | −14.2216 | −14.2216 | −72.4829 | −105.12 |
| ZINC000085645325 | −14.2128 | −14.2128 | −14.2128 | −83.4784 | −112.139 |
| ZINC67903526 | −14.1658 | −14.1944 | −14.1944 | −73.0363 | −116.279 |
| ZINC000085645325 | −14.1375 | −14.1375 | −14.1375 | −82.697 | −111.94 |
| ZINC000085645325 | −14.0532 | −14.0532 | −14.0532 | −81.513 | −109.506 |
Docking simulation has been carried out on two different operating systems, viz. Centos 7 (Supplementary Table 1) and Ubuntu 18.04 (Supplementary Table 2), although using the same software version, i.e., Schrodinger 2018–4. The score/ranking of compounds does not observe to be changed by variation in the operating system (comparing Supplementary Tables 1 and 2 ). This may be caused as glide tries to approximate the complete systemic search, and non-deterministic sampling algorithm such as Monte Carlo has been applied primarily on final top scoring conformations and reported to be more accurate than other methods GOLD and surflex [17,34].
However, the docking scores were perturbed by software versions, input conformation, and computer hardware, such as random access memory and the number of processors (data not shown). To increase the number of input conformation in Table 1, the number of input compounds is made equivalent to the number of input structures. Hence, 598435 compounds have been used as input in the HTVS steps of virtual screen workflow compared to 26831 compounds in Supplementary Tables 1 and 2 (Supplementary Table 3). In the final XP stage, 4800 input structures were evaluated compared to 2577 in Supplementary Tables 1 and 2. In Table 1, The top 3 hits are from ZINC ID ZINC000195838435, which corresponds to theaflavin digallate (TG). TG has chromane and benzo(7)annulen-6-one as a chemical scaffold. The top-scoring pose having docking score of −15.263 kcal/mol has been observed irrespective of number of input conformation or computational infrastructure (Table 1 and Supplementary Tables 1 and 2). The molecular interactions of TG with the main protease have been presented in Fig. 1 a , which reflects TG has dominant interaction with main protease.
Fig. 1a.

Ligand interaction diagram of theaflavin digallate (ZINC ID ZINC000195838435) with main protease, top 1st hit after the virtual screening of natural compound libraries.
We have included telaprevir, a reversible covalent protease inhibitor clinically approved for hepatitis C, for the reference set [35]. This is represented by PDB ID 6XQS with ligand ID SV6 representing telaprevir, complexed with main protease. For the non-covalent inhibitor, we have included the MCULE-5948770040, which has been experimentally shown to inhibit main protease as PDB ID 7LTJ with ligand ID YD1 representing MCULE-5948770040 [36]. We have also included a feline coronavirus inhibitor, GC376, with PDB ID 6WTJ and ligand ID K36 as GC376 [37]. We have included the PDB ID 7M01 complexed with inhibitor 14c [38]. The inhibitor 14c has two enantiomers, with ligand ID YKV and YKS. YKV and YKS have approximately similar propensity to form the covalent bond with Cys145. In the crystal structure, both YKS and YKV have equal occupancy. The set includes PDB ID 7M03 with inhibitor 18c having R, S enantiomer with ligand ID YLJ, and YLD in a similar structure series. We have also included the reference set from PDB ID 7LZT with inhibitor 8b having enantiomer with ligand ID YMY and YN1 [39]. We have also included the reference set from covalent inhibitor 2k having enantiomer with ligand ID Y4V and Y7M [40].
As the covalent inhibitor also needs noncovalent interaction to achieve the required proximity for covalent bond formation, we have used the crystallographic covalent inhibitors as non-covalent inhibitors in our reference set [41]. We compared the crystallographic poses of known noncovalent inhibitors (YD1), covalent inhibitors (SV6, YKS, YLJ, YNI, Y4V, and K36), and docked pose of TG (Fig. 1e). None of the crystallographic poses of known inhibitors are completely superimposed with either TG or each other. However, strong hydrogen bond interaction with Glu166 is observed in all the selected reference ligands and docked TG. The superimposed main protease crystal structure surface at 50% transparency reflects the TG docked deep in the crystallographic binding site cavity (Supplementary Fig. 1A). A surface view of crystallographic pose and docked TG pose reflect TG and crystallographic ligands share the same active site cavity (Supplementary Fig. 1B). The docked poses of reference set have a similar interaction as in the crystallographic pose and as in the docked pose of TG (Supplementary Fig. 1C). The crystallographic poses, docked poses of reference compounds, and TG pose showed a strong hydrogen bond interaction with Glu166.
Fig. 1e.

Comparison of crystallographic poses of reference compounds with docked pose of TG. Superimposed protein crystal structure in cyan, whereas TG has been highlighted in yellow. The figure depicts noncovalent inhibitor YD1 in forest green, SV6 (telaprevir) in blue, YKS in violet-red, YLJ in light green, YNI in hot pink, and Y4V in green magenta, K36 (feline coronavirus inhibitor GC3760) in red. The upper panel represents the far view whereas lower panel represents the close view.
However, TG can be a top hit due to the bias in the ligand library. The number of compounds in consecutive stages of the virtual screen workflow has been changed to remove this bias, as shown in Supplementary Table 3. Furthermore, we have performed hierarchical clustering of the ligand library. The 27256 unique natural product inputs were divided into 3194 clusters (Fig. 1 f). TG (ZINC000195838435) falls into cluster number 86. Cluster number 86 has 33 natural products out of 27256 unique compounds. This may indicate that top ranking of TG is not due to the presence of similar compounds in the input library. The 3194 clusters have a mean compound number of 8.534 and a median of 2 with a 75th percentile of 6 compounds. Cluster number 93 is observed as an outlier having 1481 compounds. However, none of the compounds from cluster number 93 have been observed as top-ranking compounds in Table 1 or Supplementary Tables 1 and 2 This may indicate the specificity of the docking method and grid used for the virtual screening workflow.
Fig. 1f.

Hierarchical clustering of the ligand library. The figure shows the number of clusters on the X-axis and the number of compounds in the corresponding cluster on the Y-axis.
3.2. Evaluation of TG and main protease interaction using molecular dynamics (Desmond and AMBER module)
The molecular interaction of TG with main protease has been evaluated by molecular dynamic simulations. The total number of residues in main protease (PDB ID 6LU7) was 308 (306 amino acids + 2 terminal caps) and had a charge of −4. The total molecular system has 36432 atoms. The protein and ligand were simulated for 200 ns. During the simulation, protein fluctuated around 1.8 Å (Fig. 2 a left axis), whereas the ligand fluctuated at about 4 Å (Fig. 2a right axis) when superimposed to the docked protein at 0 ns. The protein complex was observed to be achieved a metastable stage throughout the simulation of 200 ns (Fig. 2a). The RMSD of all atoms of binding site residues is represented in Fig. 2 b to evaluate further the stability of simulation and dynamics of ligand interaction. The trajectory of all atoms of binding site residues was observed to be converged from 50 ns to 200 ns at 2.3 Å (Fig. 2b). Furthermore, RMSF values varied from 1 to 2 Å during the simulation, and it correlate with crystallographic B-factor and interaction with binding site residue. Corresponding RMSF values of binding site residues are shown as vertical lines in Fig. 2 c. The radius of gyration of main protease varied between 22 and 30 Å during the simulation of 200 ns (Fig. 2 d).
Fig. 2a.

Root mean square deviation plot of C-alpha atoms of main protease and theaflavin digallate. The main protease is represented in pink line, whereas theaflavin digallate in dark line. Left Y-axis represents the RMSD of main protease, and right Y-axis represents the RMSD of theaflavin digallate aligned on protein. The X-axis represents the simulation time in nanoseconds.
Fig. 2b.

Root means square deviation plot of all atoms of binding site residues. Y-axis represents the RMSD of binding site residues, whereas X-axis represents simulation time in nanoseconds.
Fig. 2c.

Root mean square fluctuation plot of C- alpha atoms of main protease. Ligand contacts are shown as vertical lines.
Fig. 2d.

Radius of gyration plot of main protease. Y-axis represents the radius of gyration in angstrom, and X-axis represents the simulation time in picoseconds.
Distinct global and collective motions of main protease were determined by performing PCA on the molecular dynamics trajectory. A scatter plot involving the first two principal components (PC1 vs. PC2) was also drawn to analyze the projections of the trajectory. The 2D projection plot illustrates the phase space explored by the trajectory during the simulation (Fig. 2 e). The protein explores a large phase space. Moreover, the densely populated region represents the stable conformations of the protein structure. First principal component and second principal component predominantly define the conformational space explored during MD simulation and thus represent conformational variance of the main protease. The first and second principal components are also depicted as porcupine plots in Fig. 2 f and Fig. 2 g, respectively. The arrows represent the direction (eigenvector), and the length of the arrows denotes the magnitude of the motions (eigenvalues).
Fig. 2e.

Two-dimensional projection for the first and second principal components of molecular simulation trajectories.
Fig. 2f.

Porcupine plot for the first component of molecular dynamics trajectories. The TG binding residues are highlighted in orange. The arrows in green color denote the direction of the dominant motions.
Fig. 2g.

Porcupine plot of the second component of molecular dynamics trajectories. The TG binding residues are highlighted in orange. The arrows in green color denote the direction of the dominant motions.
TG approximately makes three hydrogen bonds, either directly or water-mediated, with Glu166 throughout the simulation of 200 ns. Glu166 of each protomer interacts with the “N-finger” of another protomer for dimerization, which is required for the catalytic activity of main protease [28]. At the start of production run, ligand interaction diagram is shown in Fig. 1b, whereas Fig. 1c represents the ligand interaction diagram at the end of the simulation. Fig. 1d represents the superimposed main protease after docking, at the start of production run, and at the end of simulation. While hydrogen bond interaction with residue Thr190 is observed at both the start and end of the simulation, a more water-mediated interaction and hydrogen bond formation with Cys145 of catalytic dyad, have been observed at the end of simulation.
Fig. 1b.

Ligand interaction diagram of theaflavin digallate (ZINC ID ZINC000195838435) with main protease. The ligand interaction diagram depicts complex file at time 0 ns, i.e., at the start of the production run for molecular dynamics simulation.
Fig. 1c.

Ligand interaction diagram of theaflavin digallate (ZINC ID ZINC000195838435) with main protease. The ligand interaction diagram depicts complex file at time 200 ns, i.e., at the end of the production run for molecular dynamics simulation. .
.
Fig. 1d.

Superimposition of structural coordinates after docking, before the production run (time 0 ns), and after the production run (time 200 ns). Main protease after the docking is represented as cyan, at 0 ns is represented as blue, whereas at 200 ns is represented as pink. Docked TG is represented as red, at 0 ns in yellow and 200 ns in green.
There are at least 14 residues (Thr26, His41, Cys44, Ser46, Glu47, Met49, Asn142, Gly143, Cys145, His164, Glu166, Asp187, Gln189, Thr190) in the main protease which interacts with TG for more than 100 ns either through hydrogen bonds, hydrophobic, water bridges or ionic interaction (Fig. 2 h). The catalytic residue Cys145 predominantly interacts with water bridges, whereas His41 interacts mainly through hydrophobic interaction (Fig. 2h). The TG makes approximately 15 contacts during the whole simulation (Fig. 2i).
Fig. 2h.

Interaction fraction (occupancy) plot of main protease with theaflavin digallate. Y-axis represents the total number of contact fractions per residue per simulation time, i.e., if the residue (presented on X-axis) has one contact during the whole simulation of 200 ns, it will have an interaction fraction score of 1. Glu166 has a score of ∼3, representing Glu 166 retains at least three total contacts during the whole simulation.
Fig. 2i.

Interaction dynamics of main protease with theaflavin digallate. Glu166 predominantly interacts with theaflavin digallate having a number of contacts ranging from 2 to 4 across the simulation trajectories. The total number of contacts during simulation was ∼15. The heat map shows the number of contacts during simulation.
Among the evaluated interaction, H-bond was observed to be the most dominant in main protease and TG interaction. The trajectory of total number of hydrogen bonds between TG and main protease is shown in Fig. 2 j, whereas the hydrogen bond occupancies with respect to simulation time and residues are shown in Supplementary Fig. 1D. The distribution of occupancy based on the type of hydrogen bond is shown as Supplementary Fig. 1E. The total number of hydrogen bonds with respect to simulation time varied from 3 to 13, with 25th percentile and 75th percentile values of 8 and 10, respectively. The mean and median for number of H bonds were 9 and 8.8, respectively. Concerning Glu166 residue, the number of hydrogen bonds varied between 1 and 4, with a 25th percentile and a 75th percentile value of 2 (Supplementary Fig. 1D). The mean and median for number of hydrogen bonds were 2.1 and 2, respectively. Glu166 forms H-bond predominantly with its side chain atom type OE1 and OE2. The interaction fraction (% occupancy) for the H-bond formed by Glu166 and main protease was approximately 2 (200%). Cys44, His164, Asp187, and Thr190 have more than 50% occupancy for the backbone acceptor type of H-bond. Gly143 interacts with backbone acceptor and Glu47 as side chain acceptor with more than 50% occupancy.
Fig. 2j.

Trajectory of total number of hydrogen bonds between theaflavin digallate and main protease. The number of hydrogen bonds varied between 3 and 13 during the whole simulation, with median and mean values of 9 and 8.8, respectively.
Molecular dynamics simulation was also performed using Amber molecular dynamics package 2018 for 100 ns, and NPT condition with Amber ff99SB force field. The RMSD and RMSF values are represented in Supplementary Fig. 2. The RMSD of main protease and TG complex varied from 1.028 Å to 4.150 Å for 100 ns. The 25th percentile of RMSD was at 2.039 Å, whereas the 75th percentile was at 2.664 Å. The mean and median value of RMSD was 2.375 and 2.410 Å, respectively (Supplementary Fig. 2A). The RMSF value has a mean and median value of 1.324 and 1.164, respectively, including the terminal residue (Supplementary Fig. 2B). Terminal residues showed an abnormally high value, usually observed in typical molecular dynamic simulations. This may confirm the reproducible, stable complex of TG and main protease and might not be due to the computational calculation artifact.
3.3. Reproducibility of interacting partner Glu166 during the different simulation trajectories
Reproducibility is an essential prerequisite for any scientific result. Experimental/biological replicates are often employed in any research method to estimate reproducibility. In molecular dynamics, identical atomic coordinates with identical force field parameters can be termed as replicates. In a typical molecular dynamics simulation, only the initial velocity is randomized. However, even with the same initial velocity, replicates can explore different trajectories owing to the computational architecture/software used, such as processors, floating-point precision, compiler, or type of random number seed generator [20,21,42]. Hence molecular interaction can also vary depending on the trajectories. For example, in the case of molecular dynamics simulation of T cell receptors, the number of H bonds varied from 12.38 in one replicate to 19.12 in another replicate [20].
The data represented in Fig. 2a, Fig. 2b, Fig. 2c, Fig. 2d, Fig. 2e, Fig. 2f, Fig. 2g, Fig. 2h, Fig. 2i, Fig. 2j have been acquired from GTX 1070 on Ubuntu 18.04 platform. Fig. 2a, Fig. 2b, Fig. 2c, Fig. 2d, Fig. 2e, Fig. 2f, Fig. 2g, Fig. 2h, Fig. 2i, Fig. 2j simulation results were completely reproducible while keeping all factors constant, as shown in Supplementary Fig. 3 and Supplementary Fig. 4. We have explored the other conditions such as 100 ns at K40 GPU (Supplementary Fig. 5), simulation at K40 GPU for 100 ns where the input conformation was of after 100 ns of molecular dynamics simulation (Supplementary Fig. 6), simulation at 100 ns of main protease alone (Supplementary Fig. 7), simulation of main protease another template (PDB ID 6y84, Supplementary Fig. 8), For 200 ns on K40 GPU (Supplementary Fig. 9), replicate of 200 ns on K40 GPU (Supplementary Fig. 10), For 200 ns on K40 GPU with OPLS3e forcefield (Supplementary Fig. 11). A comparison of the computing cores, i.e., GTX 1070 and Tesla K40, has been presented as Supplementary Table 4. Despite the difference in different molecular simulation paths explored, as evident by RMSD and RMSF plots, Glu166 has appeared as a consensus dominant interacting residue with TG across all the evaluated variations.
3.4. Estimation of binding free energy using MMGBSA (Prime and amber module)
For the estimation of binding energy, we have employed the prime MMGBSA using VSGB2 as an implicit solvent model on docked complexes and 1000 molecular dynamics trajectory snapshots [29]. For the three top docked complexes that correspond with TG, the MMGBSA dG bind score (estimated binding free energy) varied from −69.06819456 kcal/mol to −70.85623647 kcal/mol. While during the 200 ns molecular dynamics simulation involving 1000 snapshots, the MMGBSA dG bind score ranged from −51.79 kcal/mol to −122.74 kcal/mol, having a mean value of −90.04 kcal/mol with a standard deviation of 9.68 kcal/mol. The MMGBSA dG bind scores for consecutive snapshots of molecular dynamics trajectories in 200 ns simulations were presented in Fig. 3 a. TG-main protease complexes have shown the average estimated binding energy of approximately −90 kcal/mol throughout the molecular dynamics simulation from 40 ns to 200 ns which may indicate the possible strong interaction between TG and main protease of SARS-CoV-2 (Fig. 3a).
Fig. 3a.

MMGBSA dG bind scores of theaflavin digallate with main protease during molecular dynamics simulation using Desmond molecular dynamics package. X-axis represents the 1000 consecutive snapshots of molecular dynamics trajectory in 200 ns simulation. Y-axis represents MMGBSA dG bind score of theaflavin-digallate complex.
In the MMGBSA calculation, inclusion of explicit water molecules has been shown to increase the correlation between predicted and experimental binding energies [43,44]. The water molecules within 5 Å distance from ligand were considered explicitly. The MMGBSA dG bind score varied from −52.95 kcal/mol to −171.6 kcal/mol, having a mean value of −118.0 kcal (Supplementary Fig. 12). However, a higher value of the standard deviation of 22.5 kcal/mol was observed. This can be due to the variation in the number of water molecules in the 5 Å region due to the movement of water molecules in a dynamic system.
MMGBSA calculation was also performed using Amber molecular dynamics package 2018 for 100 ns and NPT condition with Amber ff99SB force field. The MMGBSA Delta Score (estimated binding free energy) as calculated from the Amber18 molecular dynamics package varies from −26.23 kcal/mol to −74.00 kcal/mol with a mean and median value of −51.88 kcal/mol and −52.60 kcal/mol, respectively (Fig. 3 b). The MMGBSA delta score converges at approximately −56 kcal/mol, which indicates a favorable interaction between TG and main protease.
Fig. 3b.

MMGBSA delta total scores of theaflavin digallate with main protease during molecular dynamics simulation. X-axis represents the 1000 consecutive snapshots of molecular dynamics trajectories in 100 ns simulation. Y-axis represents MMGBSA delta total scores of theaflavin-digallate complex.
The sum of van der Waals contribution and electrostatic interaction from molecular mechanics force field is normally termed as Delta G gas score, and it is independent of the solvation model used. The sum of nonpolar solvation free energy and polar solvation free energy is termed as Delta G Solvation Score, which depends on the solvation method used. Delta G gas score has the mean and median values of −111.3 kcal/mol and −110.5 kcal/mol, respectively (Supplementary Fig. 2C). Delta G solvation score has the mean and median of 59.39 kcal/mol and 57.61 kcal/mol (Supplementary Fig. 2D). Out of the final four interactions which contribute to the final estimated binding free energy, van der Waal, electrostatic, and nonpolar solvation energy was favorable, whereas polar solvation energy was unfavorable.
3.5. Evaluation of binding pose and H-bond persistence using binding pose metadynamics simulation
We have evaluated the binding pose of TG with main protease using a modified molecular dynamics simulation called binding pose metadynamics, in which root mean square deviation of all heavy atoms in the ligand with respect to starting position is considered as a collective variable. Binding pose metadynamics simulation enables the enhanced exploration of conformational ensembles by employing a time-dependent bias on collective variables and thus guiding the simulation to search for unexplored free energy landscape and avoid the entrapment of ligand in a kinetic basin.
The objective of binding pose metadynamics is different from classical metadynamics simulation. Classical metadynamics aims to explore the free energy landscape. In contrast, binding pose metadynamics is interested in exploring the relative stabilities of input pose [33]. For scoring, we have used the termed persistence score and pose score. The scoring is based on the mobility of ligands, such as the persistence score measures the persistence of protein-ligand contacts, whereas pose score represents the movement of the ligand with respect to its initial position. An abrupt change in the pose score often indicates the ligands being not present in energy minimum. The persistence score measures the hydrogen bond persistence during simulation.
One metadynamics run consists of ten independent runs of 10 ns. The simulation properties of two independent runs, such as target temperature, number of atoms, potential energy, temperature, pressure, and volume are represented in Supplementary Table 5, which confirm the equilibration and convergence of system. The simulation interaction diagram of two independent runs of 10 ns has been shown as Supplementary Figs. 13A and 13B. The number of interaction fractions for Glu166 was approximately 2.6 in the first run, whereas approximately 3.3 in the second run. While there were changes in the interaction fraction of two independent runs, such as interaction with Cys44 was present in the first independent run, it diminished in the second independent run. However, while comparing the interaction faction in the metadynamics run with classical molecular dynamics run, despite the change in the force field, ensemble (NVT vs. NPT), and biased potential, the strong interaction of Glu166 with TG was observed (Supplementary Figs. 13A and 13B).
The overall persistence score of the H bond of main protease and TG was 0.162 (Table 2). Based on the H-bond persistence score only, Glu166 has been observed as a robust interacting partner with an individual persistence score of 0.282 and mainly interacting with OE1/OE2 atom types with H10 of TG. Thr190 showed the H bond persistence score of 0.427 and 0.145, respectively. The score shown in Table 2 mainly focused on the persistence of the H bond, whereas the interaction fraction shown in Supplementary Fig. 13 A and 13 B showed the overall interaction. The dominant interactor Glu166 has overall strong interaction due to the contribution of both H–Bond and water bridges as compared to Thr190 because Thr190 mainly interacts with H-bonds only.
Table 2.
Residue-wise H bond persistence score of Theaflavin digallate and main protease during 10 independent metadynamics runs of 10 ns each.
| Mean Persistence score of ten independent run | Residue involved |
|---|---|
| 0.282 | Glutamate166 |
| 0.009 | Arginine188 |
| 0.427 | Threonine190 |
| 0.145 | Threonine190 |
| 0.082 | Threonine26 |
| 0.027 | Glycine143 |
| Mean:0.162 |
The binding pose score of main protease-TG complex was 2.46, as shown in Fig. 4 . In this binding pose metadynamics, a steep slope of RMSD intends to have an unstable complex, which in turn reflects a high RMSD change [45]. However, this was not the case with main protease, after an initial jump in the RMSD value, i.e., a change in RMSD value of 1.28 Å at 0.6 ns, which gradually increased to 2.46 Å at 10 ns. In the study by Fusani et al., the ligands having pose scores below two have been considered stable poses, whereas pose scores above four are considered unstable poses. The examples studied include the specific crystallographic ligands in which molecular weight was generally below 500 Da. Natural products are usually chiral-rich molecules and have multi-ring scaffolds. As in this study, TG has a molecular weight of 868.714 Da with 63 atoms, 70 bonds, and four chiral carbons. While pose scores are not benchmarked, exact stable pose scores of natural products are not defined. However, a higher RMSD can be generally expected for a higher molecular weight compound than a low molecular weight compound.
Fig. 4.

Root mean square deviation plot of collective variables (theaflavin digallate heavy atoms) during metadynamics simulation of 10 ns.
Binding pose metadynamics has been shown to differentiate between a set of incorrect binding poses, i.e., not supported by electron density, with a set of correct binding poses, i.e., supported by electron density (Fusani et al., 2020). In the Drug Design Data Resource Grand Challenge 2, binding pose metadynamics, although computationally intensive, has been observed to predict lower RMSD poses as compared to Smina, induced fit docking, and Align-close methods [46].
3.6. Estimation of relative free binding energy using alchemical free energy calculation
The docking, classical dynamics, and binding pose metadynamics have shown a strong interaction with the hydroxyl groups in the benzene ring of benzo(7)annulen-6-one of TG. The alchemical transformation of TG to the perturbed TG′ has been performed at 12 “windows” which represent the steps carried out to achieve the final perturbed TG’. For the method control, aspartyl protease b-APP cleaving enzyme 1 (BACE 1) inhibitors, CAT-4j (IUPAC name(2E,5R)-2-imino-3-methyl-5-phenyl-5-[3-(pyridin-3-yl) phenyl]imidazolidin-4-one) and CAT-4b ((2E,5R)-2-imino-5-(3′-methoxybiphenyl-3-yl)-3-methyl-5-phenylimidazolidin-4-one) have been used having PDB ID 2DJW and 2DJV respectively [47]. This receptor and ligand system have been extensively studied using the free energy perturbation method [47,48]. The two-dimensional structure of method control ligands is shown in Supplementary Fig. 14 A.
For the method control ligand (Table 3 FEP10, Supplementary Fig. 14A), the value of ΔG4 as corresponded to thermodynamic cycle and termed as complex calculation was 30.62+-0.07 kcal/mol whereas the value of ΔG3 as corresponded to thermodynamic cycle, termed as solution calculation was 31.68+-0.03 kcal/mol. As the relative free energy change in the complex form of CAT-4j (at λ = 0) and CAT-4b (at λ = 1) is lower than solution form of CAT-4j (a λ = 0), and CAT-4b (λ = 1), the binding of CAT-4b is more favorable than CAT-4j. Furthermore, the relative free energy by permuting CAT-4j to CAT-4b from the thermodynamic cycle, ΔΔG = ΔG4- ΔG3 = 30.62+-0.07 kcal/mol −31.68+-0.03 kcal/mol = −1.06+-0.08 kcal/mol. From the experimental data, the binding energy of CAT-4j is −9.023 kcal/mol, which corresponds to the ΔG1 of the thermodynamic cycle, and binding energy of CAT-4b is −9.633 kcal/mol, which corresponds to the ΔG2 of the thermodynamic cycle. Hence ΔΔG from the experimental data = ΔG2- ΔG1 = −9.633 – (−9.023) kcal/mol = −0.610 kcal/mol, which is in agreement with free energy perturbation studies that CAT-4b has a stronger binding affinity than CAT-4j. We have performed the same free energy perturbation methodology for the calculation of relative binding free energy between TG and mutated ligand TG′ by the alchemical transformation of TG to TG’.
Table 3.
Relative free energy change calculated using alchemical free energy perturbation. Theaflavin digallate is at λ = 0, whereas the mutated residues are at λ = 1. *Using Desmond 2018_4, ** Using Desmond2019_4, ***using Desmond 2018_1.
| Starting molecule, Mutation at λ = 1 | Relative free energy change (kcal/mol) | Core RMSD (In Å) | |
|---|---|---|---|
| FEP1 (test set) | Non-ionized TG, Deletion of four hydroxyl groups | ΔG4 = complex = 8.78+-0.53, ΔG3 = solution = 4.41+-0.39, ΔΔG = 4.38+-0.66 |
0.000 |
| FEP2 (experimental control1) | Non-ionized TG, Deletion of four hydroxyl groups | ΔG4 = complex = 11.12+-0.70, ΔG3 = solution = 5.48+-0.35, ΔΔG = 5.63+-0.78 | 0.790 |
| FEP3 (experimental control2) | Ionized TG, Substitution of two hydroxyl groups with two methyl groups | ΔG4 = complex = 43.61+-0.88, ΔG3 = solution = 41.28+-0.67, ΔΔG = 2.33+-1.11 | 0.000 |
| FEP4 (experimental control3) | Ionized TG, deletion of two hydroxyl groups | ΔG4 = complex = 33.08+-0.91, ΔG3 = solution = 33.65+-0.59, ΔΔG = −0.58+-1.08 | 0.000 |
| FEP5 (experimental control4) | Ionized TG, deletion of four hydroxyl groups | ΔG4 = complex = 163.98+-0.86, ΔG3 = solution = 161.63+-0.54, ΔΔG = 2.35+-1.02 | 0.000 |
| FEP6 (experimental control5) | Ionized TG, deletion of ten hydroxyl groups | ΔG4 = complex = 255.07+-1.63, ΔG3 = solution = 251.18+-1.80, ΔΔG = 3.89+-2.43 | 0.105 |
| FEP7 (experimental control6) | Non-ionized TG, differentially ionized mutated residue, one OH deleted, CH3 added | ΔG4 = complex = −137.65+-8.82, ΔG3 = solution = −141.87+-1.46, ΔΔG = 4.22+-8.94 | 0.356 |
| FEP8 (experimental control7) | Non-ionized TG, differentially ionized mutated residue. Both OH were deleted. | ΔG4 = Complex = − 149.18+-29.98, ΔG3 = solution = −147.13+-1.99, ΔΔG = −2.05+-30.05 | 0.356 |
| FEP9 (experimental control8) | Ionized TG, OH replaced with CH3 | ΔG4 = Complex = 24.32+-3.80 ΔG3 = solution = 20.40+-1.74, ΔΔG = 3.92+-4.18* | Not aligned |
| ΔG4 = Complex = 21.19+-6.51, ΔG3 = solution = 23.30+-3.99, ΔΔG = −2.11+-7.63** | |||
| FEP10 (method control) | CAT-4j, CAT-4b |
ΔG4 = Complex = 30.02+-0.11, ΔG3 = solution = 31.81+-0.04 ΔΔG = −1.79+-0.11*** | Core RMSD: 0.078 |
| ΔG4 = Complex = 30.62+-0.07, ΔG3 = solution = 31.68+-0.03, ΔΔG = −1.06+-0.08** |
We have used a method control ligand in the form of CAT-4j and CAT-4b, as the wet experimental data were available, whereas, in our test set, wet experimental data set was not available. To calculate the relative binding free energy of TG with main protease, the neutral TG molecule were kept at λ = 0, whereas the three hydroxyls and one carbonyl group of benzo(7)annulen-6-one of theaflavin digallate have been mutated for λ = 1. Specifically, oxygen atom numbers 19, 21, 54, and 52 were deleted, and the valency of carbon atom has been sufficed by H atoms (Fig. 5 , Table 3 FEP1). The value of ΔG4, i.e., in the complex calculation, was 8.78+-0.53 kcal/mol, whereas the value of ΔG3, i.e., in solution calculation, was 4.41+-0.39 kcal/mol. Hence, relative free energy by permuting TG to TG′ from the thermodynamic cycle, ΔΔG = ΔG4- ΔG3 = 8.78+-0.53 kcal/mol - 4.41+-0.39 kcal/mol = 4.38+-0.66 kcal. Thus, TG has more affinity than TG’, and removing the hydroxyl/carbonyl group in benzo(7)annulen-6-one drastically reduces the binding affinity.
Fig. 5.

Two dimensional structure of test ligands used in free energy perturbation calculation. Relative binding free energy of TG with main protease has been calculated using neutral TG molecule kept at λ = 0, whereas the 3 hydroxyls and one carbonyl group of benzo(7)annulen-6-one of theaflavin digallate have been mutated for λ = 1. The relative binding free energy difference between TG (λ = 0) and TG’ (λ = 1) was 4.38+-0.66 kcal/mol which reflects the increase in binding free energy, thus a decrease in interaction by converting TG into TG’. The mutated regions are highlighted as yellow box.
The free energy change in alchemical perturbation calculation depends on the ligand alignment, and the crystallographic poses of TG/TG’ were not known. FEP was generally adapted for small molecule ligands, whereas TG has a molecular weight of 868.714 Da [49]. Hence, to confirm that the positive relative free energy is not a calculation artifact, ligand alignment was perturbed from the initial core RMSD 0.00 to a perturbed core of RMSD 0.790. For the perturbed core, ΔΔG = ΔG4- ΔG3 = 11.12+-0.70 kcal/mol −5.48+-0.35 kcal/mol = 5.63+-0.78 kcal/mol, which reflects the strong interaction of TG with main protease and not a calculation artifact (Supplementary Fig. 14B, Table 3, FEP2).
Furthermore, as we do not have the crystallographic poses and owing to the limitation of alchemical free energy approaches in handling charges/ionization states, a set of alchemical free energy calculations was performed with different mutation and ionization states [50,51]. The inclusion of charged/ionization states in standard/default alchemical free energy calculation is usually observed to be problematic in the default settings. However, the calculation was done to see the effect on the overall conclusion with previous free energy perturbation calculations (FEP1 and FEP2), i.e., TG can strongly interact with main protease. To generate the different ionization state as of non-ionized TG in FEP 3, we have used the same oxygen atoms of benzo(7)annulen-6-one of theaflavin as in earlier FEP 1 and 2. Specifically, the hydroxyl group of O19 and O21 were deleted and replaced by methyl group in TG’ whereas the carbonyl oxygen atom number 54 was positively charged and hydroxyl oxygen atom number 52 was negatively charged in both native and mutated ligand (Supplementary Fig. 14C, FEP3 Table 3). The ΔΔG = ΔG4- ΔG3 = 43.61+-0.88 kcal/mol - 41.28+-0.67 kcal/mol = 2.33+-1.11 kcal/mol which confirm the interaction of TG with main protease in FEP3 run. While not replacing the O19 and O21 group with methyl group and adding hydrogen atom to suffice the valency resulted in ΔΔG = ΔG4- ΔG3 = 33.08+-0.91 - 33.65+-0.59 = −0.58+-1.08 in FEP4 (Supplementary Fig. 14 D, Table 3 in FEP4). Furthermore, deletion of oxygen atom numbers 19, 21, 54, and 52 have resulted in ΔΔG = ΔG4- ΔG3 = 163.98+-0.86 - 161.63+-0.54 = 2.35+-1.02 in FEP5 (Supplementary Fig. 14E, FEP5 Table 3). These studies confirm the three hydroxyls and one carbonyl oxygen atom of benzo(7)annulen-6-one are required for the interaction TG with main protease. The deletion of only two hydroxyl groups (O19 and O21) does not observe to cause the decrease in interaction of TG with main protease, which may be as the TG being polyphenols and neighboring hydroxyl and carbonyl group can compensate for the interaction.
Furthermore, we have also evaluated the changes which can have low confidence in FEP calculation using the same default algorithm as in FEP 1–5, e.g., deletion of ten hydroxyl groups (Supplementary Fig. 14F, FEP6 Table 3), increase in the RMSD and differential ionization outside of benzo(7)annulen-6-one (Supplementary Fig. 14G, Table 3 FEP7 and Supplementary Fig. 14H, Table 3 FEP8), not aligned and with different software version (Supplementary Fig. 14 I, Table 3 FEP9). In FEP6, The TG, λ = 0 is at the same ionization state as FEP5, i.e., carbonyl oxygen atom number 54 was positively charged, and hydroxyl oxygen atom number 52 was negatively charged, however at λ = 1, ten hydroxyl groups were deleted. The ΔΔG = 3.89+-2.43 reflects a decrease in relative binding affinity upon deletion of hydroxyl group as in FEP1-5, although of low statistical confidence. In FEP7-8, at λ = 0, The TG is non-ionized as in FEP1-2. The carbonyl oxygen atom number 54 was positively charged as in FEP3-6. However, instead of hydroxyl oxygen atom number 52 as in FEP3-6, hydroxyl oxygen atom number 44 not present in benzo(7)annulen-6-one, was negatively charged. In FEP7, O21 was replaced by a single CH3 similar to FEP3, whereas 019 was deleted. In FEP8, both 019 and 021 were deleted as in FEP4. The ΔΔG value in FEP7 = 4.22+-8.94, which shows a decrease in affinity, although with low confidence. Similarly, in FEP7, -ΔΔG -2.05+-30.05, which shows a negative change, hence increase in interaction, however with low confidence as compared to FEP4. In FEP9, ligands were not aligned, and the addition of the methyl group showed positive and negative changes depending on the version of the software used, which confirms the requirement of a good alignment for an interpretable result using free energy perturbation.
We have also employed alchemical free energy calculation using thermodynamic integration and multistate Bennett's acceptance ratio to validate the calculation using FEP (Supplementary Figs. 15A and 15B). For the test set, i.e., deletion of four hydroxyl groups, the value of ΔG4 = complex = −54.93 kcal/mol whereas ΔG3 = solution = −59.22 kcal/mol, hence the value of ΔΔG = ΔG4- ΔG3 = −54.93 kcal/mol – −59.22 kcal/mol = 4.29 kcal/mol using MBAR. Similarly using the thermodynamic integration, ΔΔG = ΔG4- ΔG3 = −54.59 kcal/mol - −58.91 kcal = 4.32 kcal/mol. Hence the value of estimated relative binding free energy using alchemical free energy calculation i.e., using FEP, thermodynamic integration, and multistate Bennett's acceptance ratio are 4.38 kcal/mol, 4.32 kcal/mol, and 4.29 kcal/mol, respectively.
Using the similarity ensemble approach, TG appears to be in a protease inhibitor target class [52]. In the study of screening a natural products library against the 2003 SARS-CoV virus main protease, TG has a half-maximal inhibitory concentration of 7 μM against the main protease [22]. Since the onset of pandemic, several computational studies on the screening of natural product libraries have been published. However, to the best of our knowledge, evidence from alchemical free energy calculation has not been presented with any main-protease natural products complex. In the case of existing drugs, relative binding free energy was estimated using FEP for perampanel analogs [53]. An accelerated FEP was also used as virtual screening with existing drugs [54].
In the study of virtual screening of 200 published antiviral natural products, TG has appeared as the top-scoring natural product in molecular docking simulation using a different algorithm (Autodock v4) as in this study and our previous complementary study. The achieved pose was evaluated using molecular dynamics simulation for 50 ns and using another variant of force field as used in this study. A similar molecular interaction profile, such as the Glu166, came as the highest interacting partner as of this study [55]. Similarly, TG has been reported as a top hit in the computational study comprising a virtual screen of 70 tea components and molecular dynamics for 100 ns [56]. Similarly, in the molecular docking studies using two tea polyphenols, TG has been shown to interact with Glu166 with two hydrogen bonds as in our molecular docking study, although using AutoDock Vina [56]. This may confirm the reproducibility of TG docked pose across the docking software platforms.
The literature reports an extensive application of docking and molecular dynamics to identify the potential natural product inhibitors against the main protease. Such as, by using molecular docking, natural 2-pyridones have been reported as a potential inhibitor [57]. Similarly, using molecular docking and dynamics for ten ns, a set of marine natural products has been reported as a putative inhibitor [58]. Microbial natural products were also screened using molecular docking and dynamics for 20 ns [59]. Similarly, phytochemicals were also screened using docking, dynamics for 100 ns, and binding free energy estimation using MMPBSA [60]. 251 quantum mechanically optimized natural polyphenols were also studied using molecular docking and dynamics. Glu166 is observed as a consensus interacting residue in the top 12 reported compounds in this study [61].
However, the docking scores alone will not always result in high in-vitro inhibition. In the study of natural products and main protease, many high-scoring hits, such as tubuloside and maltopentose failed to show inhibition in in-vitro assays [62]. Similarly, the sole dependence on conformation generator of docking algorithms might not guarantee the possible search space for achieving the lowest energy/best pose [18]. Similarly, the conclusion based on single trajectories using a single algorithm can be inaccurate [20]. Furthermore, binding energy estimation using endpoint methods such as MMGBSA/MMPBSA tends to be less accurate than alchemical free energy calculation [63,64]. In the case of the main protease inhibitor discovery, free energy perturbation is recommended in benchmarking studies [16,17].
4. Conclusion
This study is based on mere computational calculations, although robust, and indicates that TG may inhibit SARS-CoV-2 main protease, maybe by inhibiting protease dimerization due to strong interaction between Glu166 of main protease and hydroxyl/carbonyl group in benzo(7)annulen-6-one scaffold of TG. Furthermore, in the computational calculation, the unavailability of crystallographic pose and high molecular weight of TG limits the overall reliability of binding free energy calculation [49,65]. The major limitation of our study is the wet experimental validation. Only invitro data is available in scientific literature to show that TG can inhibit SARS-CoV main protease. Whether the TG remains to be effective against SARS-CoV-2 or Covid-19 has not been explored in our study. While the computational calculation is necessary for any drug discovery pipeline, it alone cannot provide evidence for the effectiveness of any drug against any disease.
In wet experimental cellular screens against SARS-CoV-2, it has been reported that 60% of the reported repurposed drugs against SARS-CoV-2 are acting through non-specific mechanisms [66]. Natural products, although readily available however proven to be difficult to be evaluated in robust clinical settings or as original natural sources such as curcumin [67]. Similarly, an exact wet experiment or clinical studies providing evidence on TG efficacy are challenging to conduct because of the enormous number of variants available as natural resources. However, this study offers a scientific rationale for initiating an observational clinical study and in-vitro experiments with SARS-CoV-2 main protease for conclusive evidence.
Funding
MM is supported by senior research associate fellowship under the CSIR- Scientist's Pool Scheme.
SM is supported by research fellowship under the ICMR research grant.
Availability of data and material
All non-modified, time-stamped, raw data of every step of computational simulations using Desmond academic version such as classical dynamics and free energy perturbations are provided at https://drive.google.com/drive/folders/1SvNdMpVvd2Q48vxV_bnR2tYYlBTF6s4H?usp=sharing. These raw data include all the input files, output files, parameters, and log files. Furthermore, these data are represented as tables, figures, supplementary tables, and supplementary figures in the manuscript draft.
Code availability
Free energy perturbation and molecular dynamics have been performed using an academic version of Desmond, available for an academic institution with no cost involved at https://www.deshawresearch.com/. Data in the manuscript were generated using only two software suites, viz. Schrodinger and Amber, which are being extensively used and can be easily accessed in the form of license or evaluation.
Authors’ contribution
Computational calculations were performed by SM, MM and AA. Original Draft was prepared by SM, MM and NS. The final draft was prepared by AA, SM, MM and NS. NS provided the computational infrastructure and overall guidance. The computational experiments were designed by SM, MM, AA and NS. All the authors approved the final manuscript.
Declaration of competing interest
The authors declare that they have no conflicts of interest or any competing interests.
Footnotes
Supplementary data to this article can be found online at https://doi.org/10.1016/j.compbiomed.2022.106125.
Appendix A. Supplementary data
The following is the Supplementary data to this article:
References
- 1.Coronaviridae Study Group of the International Committee on Taxonomy of Viruses The species Severe acute respiratory syndrome-related coronavirus: classifying 2019-nCoV and naming it SARS-CoV-2., Nat Microbiol. 2020;5:536–544. doi: 10.1038/s41564-020-0695-z. [DOI] [PMC free article] [PubMed] [Google Scholar]
- 2.WHO coronavirus (COVID-19) dashboard | WHO coronavirus (COVID-19) dashboard with vaccination data. https://covid19.who.int/ n.d.
- 3.Krichel B., Falke S., Hilgenfeld R., Redecke L., Uetrecht C. Processing of the SARS-CoV pp1a/ab nsp7–10 region. Biochem. J. 2020;477:1009–1019. doi: 10.1042/bcj20200029. [DOI] [PMC free article] [PubMed] [Google Scholar]
- 4.Zhang S., Amahong K., Sun X., Lian X., Liu J., Sun H., Lou Y., Zhu F., Qiu Y. The miRNA: a small but powerful RNA for COVID-19, Briefings Bioinf. 2021;22:1137–1149. doi: 10.1093/bib/bbab062. [DOI] [PMC free article] [PubMed] [Google Scholar]
- 5.Zhao M.M., Yang W.L., Yang F.Y., Zhang L., Huang W.J., Hou W., Fan C.F., Jin R.H., Feng Y.M., Wang Y.C., Yang J.K. Cathepsin L plays a key role in SARS-CoV-2 infection in humans and humanized mice and is a promising target for new drug development. Signal Transduct. Targeted Ther. 2021;6:1–12. doi: 10.1038/s41392-021-00558-8. [DOI] [PMC free article] [PubMed] [Google Scholar]
- 6.Jayk Bernal A., Gomes da Silva M.M., Musungaie D.B., Kovalchuk E., Gonzalez A., Delos Reyes V., Martín-Quirós A., Caraco Y., Williams-Diaz A., Brown M.L., Du J., Pedley A., Assaid C., Strizki J., Grobler J.A., Shamsuddin H.H., Tipping R., Wan H., Paschke A., Butterton J.R., Johnson M.G., De Anda C. Molnupiravir for oral treatment of covid-19 in nonhospitalized patients. N. Engl. J. Med. 2022;386:509–520. doi: 10.1056/nejmoa2116044. [DOI] [PMC free article] [PubMed] [Google Scholar]
- 7.Vangeel L., Chiu W., De Jonghe S., Maes P., Slechten B., Raymenants J., André E., Leyssen P., Neyts J., Jochmans D., Remdesivir Molnupiravir and Nirmatrelvir remain active against SARS-CoV-2 Omicron and other variants of concern. Antivir. Res. 2022;198 doi: 10.1016/j.antiviral.2022.105252. [DOI] [PMC free article] [PubMed] [Google Scholar]
- 8.Owen D.R., Allerton C.M.N., Anderson A.S., Aschenbrenner L., Avery M., Berritt S., Boras B., Cardin R.D., Carlo A., Coffman K.J., Dantonio A., Di L., Eng H., Ferre R.A., Gajiwala K.S., Gibson S.A., Greasley S.E., Hurst B.L., Kadar E.P., Kalgutkar A.S., Lee J.C., Lee J., Liu W., Mason S.W., Noell S., Novak J.J., Obach R.S., Ogilvie K., Patel N.C., Pettersson M., Rai D.K., Reese M.R., Sammons M.F., Sathish J.G., Singh R.S.P., Steppan C.M., Stewart A.E., Tuttle J.B., Updyke L., Verhoest P.R., Wei L., Yang Q., Zhu Y. An oral SARS-CoV-2 Mpro inhibitor clinical candidate for the treatment of COVID-19. Science. 1979;374(2021):1586–1593. doi: 10.1126/science.abl4784. [DOI] [PubMed] [Google Scholar]
- 9.Ritonavir-boosted Nirmatrelvir (paxlovid) | COVID-19 treatment guidelines. https://www.covid19treatmentguidelines.nih.gov/therapies/antiviral-therapy/ritonavir-boosted-nirmatrelvir-paxlovid-/ n.d.
- 10.Yang H., Bartlam M., Rao Z. Drug design targeting the main protease, the achilles heel of coronaviruses. Curr. Pharmaceut. Des. 2006;12:4573–4590. doi: 10.2174/138161206779010369. [DOI] [PubMed] [Google Scholar]
- 11.Dotolo S., Marabotti A., Facchiano A., Tagliaferri R. A review on drug repurposing applicable to COVID-19, Briefings Bioinf. 2021;22:726–741. doi: 10.1093/bib/bbaa288. [DOI] [PMC free article] [PubMed] [Google Scholar]
- 12.Palayew A., Norgaard O., Safreed-Harmon K., Andersen T.H., Rasmussen L.N., Lazarus J.V. Pandemic publishing poses a new COVID-19 challenge. Nat. Human Behav. 2020;4:666–669. doi: 10.1038/s41562-020-0911-0. [DOI] [PubMed] [Google Scholar]
- 13.Odone A., Galea S., Stuckler D., Signorelli C., Amerio A., Bellini L., Bucci D., Capraro M., Gaetti G., Salvati S., Amerio A., Bellini L., Bucci D., Capraro M., Gaetti G., Salvati S. The first 10 000 COVID-19 papers in perspective: are we publishing what we should be publishing?, Eur. J. Publ. Health. 2020;30:849–850. doi: 10.1093/eurpub/ckaa170. [DOI] [PMC free article] [PubMed] [Google Scholar]
- 14.Macip G., Garcia-Segura P., Mestres-Truyol J., Saldivar-Espinoza B., Ojeda-Montes M.J., Gimeno A., Cereto-Massagué A., Garcia-Vallvé S., Pujadas G. Haste makes waste: a critical review of docking-based virtual screening in drug repurposing for SARS-CoV-2 main protease (M-pro) inhibition, Med. Res. Rev. 2022;42:744–769. doi: 10.1002/med.21862. [DOI] [PMC free article] [PubMed] [Google Scholar]
- 15.Llanos M.A., Gantner M.E., Rodriguez S., Alberca L.N., Bellera C.L., Talevi A., Gavernet L. Strengths and weaknesses of docking simulations in the SARS-CoV-2 era: the main protease (Mpro) case study, J. Chem. Inf. Model. 2021;61:3758–3770. doi: 10.1021/acs.jcim.1c00404. [DOI] [PubMed] [Google Scholar]
- 16.Ngo S.T., Tam N.M., Pham M.Q., Nguyen T.H. Benchmark of popular free energy approaches revealing the inhibitors binding to SARS-CoV-2 Mpro. J. Chem. Inf. Model. 2021;61:2302–2312. doi: 10.1021/acs.jcim.1c00159. [DOI] [PubMed] [Google Scholar]
- 17.S Z., K R., R S., R T., Pk G., Dt M. Benchmarking the ability of common docking programs to correctly reproduce and score binding modes in SARS-CoV-2 protease Mpro. J. Chem. Inf. Model. 2021;61:2957–2966. doi: 10.1021/ACS.JCIM.1C00263. [DOI] [PubMed] [Google Scholar]
- 18.Feher M., Williams C.I. Effect of input differences on the results of docking calculations. J. Chem. Inf. Model. 2009;49:1704–1714. doi: 10.1021/ci9000629. [DOI] [PubMed] [Google Scholar]
- 19.Feher M., Williams C.I. Numerical errors and chaotic behavior in docking simulations. J. Chem. Inf. Model. 2012;52:724–738. doi: 10.1021/ci200598m. [DOI] [PubMed] [Google Scholar]
- 20.Knapp B., Ospina L., Deane C.M. Avoiding false positive conclusions in molecular simulation: the importance of replicas, J. Chem. Theor. Comput. 2018;14:6127–6138. doi: 10.1021/acs.jctc.8b00391. [DOI] [PubMed] [Google Scholar]
- 21.Purawat S., Ieong P.U., Malmstrom R.D., Chan G.J., Yeung A.K., Walker R.C., Altintas I., Amaro R.E. A kepler workflow tool for reproducible AMBER GPU molecular dynamics, Biophys. J. 2017;112:2469–2474. doi: 10.1016/j.bpj.2017.04.055. [DOI] [PMC free article] [PubMed] [Google Scholar]
- 22.Chen C.-N., Lin C.P.C., Huang K.-K., Chen W.-C., Hsieh H.-P., Liang P.-H., Hsu J.T.-A. Inhibition of SARS-CoV 3C-like protease activity by theaflavin-3,3’-digallate (TF3) Evid. Based Complement Alternat. Med. 2005;2:209–215. doi: 10.1093/ecam/neh081. [DOI] [PMC free article] [PubMed] [Google Scholar]
- 23.Sterling T., Irwin J.J. ZINC 15-ligand discovery for everyone. J. Chem. Inf. Model. 2015;55:2324–2337. doi: 10.1021/acs.jcim.5b00559. [DOI] [PMC free article] [PubMed] [Google Scholar]
- 24.Schrödinger, LLC; New York, NY: 2018. Schrödinger Release 2018-4 LigPrep. n.d. Schrödinger Release 2018-4. [Google Scholar]
- 25.Greenwood J.R., Calkins D., Sullivan A.P., Shelley J.C. Towards the comprehensive, rapid, and accurate prediction of the favorable tautomeric states of drug-like molecules in aqueous solution. J. Comput. Aided Mol. Des. 2010;24:591–604. doi: 10.1007/s10822-010-9349-1. [DOI] [PubMed] [Google Scholar]
- 26.Sander T., Freyss J., Von Korff M., Rufener C. DataWarrior: an open-source program for chemistry aware data visualization and analysis. J. Chem. Inf. Model. 2015;55:460–473. doi: 10.1021/ci500588j. [DOI] [PubMed] [Google Scholar]
- 27.Olsson M.H.M., Søndergaard C.R., Rostkowski M., Jensen J.H. PROPKA3: consistent treatment of internal and surface residues in empirical p Ka predictions. J. Chem. Theor. Comput. 2011;7:525–537. doi: 10.1021/ct100578z. [DOI] [PubMed] [Google Scholar]
- 28.Zhang L., Lin D., Sun X., Curth U., Drosten C., Sauerhering L., Becker S., Rox K., Hilgenfeld R. Crystal structure of SARS-CoV-2 main protease provides a basis for design of improved α-ketoamide inhibitors. Science. 2020 doi: 10.1126/science.abb3405. [DOI] [PMC free article] [PubMed] [Google Scholar]
- 29.Li J., Abel R., Zhu K., Cao Y., Zhao S., Friesner R.A. The VSGB 2.0 model: a next generation energy model for high resolution protein structure modeling., Proteins. 2011;79:2794–2812. doi: 10.1002/prot.23106. [DOI] [PMC free article] [PubMed] [Google Scholar]
- 30.Martyna G.J., Tobias D.J., Klein M.L. Constant pressure molecular dynamics algorithms. J. Chem. Phys. 1994;101:4177–4189. doi: 10.1063/1.467468. [DOI] [Google Scholar]
- 31.Wang P., Fu T., Zhang X., Yang F., Zheng G., Xue W., Chen Y., Yao X., Zhu F. Differentiating physicochemical properties between NDRIs and sNRIs clinically important for the treatment of ADHD. Biochim. Biophys. Acta Gen. Subj. 2017;1861:2766–2777. doi: 10.1016/j.bbagen.2017.07.022. [DOI] [PubMed] [Google Scholar]
- 32.Xue W., Wang P., Tu G., Yang F., Zheng G., Li X., Li X., Chen Y., Yao X., Zhu F. Computational identification of the binding mechanism of a triple reuptake inhibitor amitifadine for the treatment of major depressive disorder. Phys. Chem. Chem. Phys. 2018;20:6606–6616. doi: 10.1039/c7cp07869b. [DOI] [PubMed] [Google Scholar]
- 33.Clark A.J., Tiwary P., Borrelli K., Feng S., Miller E.B., Abel R., Friesner R.A., Berne B.J. Prediction of protein-ligand binding poses via a combination of induced fit docking and metadynamics simulations. J. Chem. Theor. Comput. 2016;12:2990–2998. doi: 10.1021/acs.jctc.6b00201. [DOI] [PubMed] [Google Scholar]
- 34.Friesner R.A., Banks J.L., Murphy R.B., Halgren T.A., Klicic J.J., Mainz D.T., Repasky M.P., Knoll E.H., Shelley M., Perry J.K., Shaw D.E., Francis P., Shenkin P.S. Glide: a new approach for rapid, accurate docking and scoring. 1. Method and assessment of docking accuracy, J. Med. Chem. 2004;47:1739–1749. doi: 10.1021/jm0306430. [DOI] [PubMed] [Google Scholar]
- 35.Kneller D.W., Galanie S., Phillips G., O'Neill H.M., Coates L., Kovalevsky A. Malleability of the SARS-CoV-2 3CL Mpro active-site cavity facilitates binding of clinical antivirals. Structure. 2020;28:1313–1320. doi: 10.1016/j.str.2020.10.007. e3. [DOI] [PMC free article] [PubMed] [Google Scholar]
- 36.Clyde A., Galanie S., Kneller D.W., Ma H., Babuji Y., Blaiszik B., Brace A., Brettin T., Chard K., Chard R., Coates L., Foster I., Hauner D., Kertesz V., Kumar N., Lee H., Li Z., Merzky A., Schmidt J.G., Tan L., Titov M., Trifan A., Turilli M., Van Dam H., Chennubhotla S.C., Jha S., Kovalevsky A., Ramanathan A., Head M.S., Stevens R. High-throughput virtual screening and validation of a SARS-CoV-2 main protease noncovalent inhibitor. J. Chem. Inf. Model. 2022;62:116–128. doi: 10.1021/acs.jcim.1c00851. [DOI] [PubMed] [Google Scholar]
- 37.Vuong W., Khan M.B., Fischer C., Arutyunova E., Lamer T., Shields J., Saffran H.A., McKay R.T., van Belkum M.J., Joyce M.A., Young H.S., Tyrrell D.L., Vederas J.C., Lemieux M.J. Feline coronavirus drug inhibits the main protease of SARS-CoV-2 and blocks virus replication. Nat. Commun. 2020;11:1–8. doi: 10.1038/s41467-020-18096-2. [DOI] [PMC free article] [PubMed] [Google Scholar]
- 38.Dampalla C.S., Rathnayake A.D., Perera K.D., Jesri A.R.M., Nguyen H.N., Miller M.J., Thurman H.A., Zheng J., Kashipathy M.M., Battaile K.P., Lovell S., Perlman S., Kim Y., Groutas W.C., Chang K.O. Structure-guided design of potent inhibitors of SARS-CoV-2 3CL protease: structural, biochemical, and cell-based studies. J. Med. Chem. 2021;64:17846–17865. doi: 10.1021/acs.jmedchem.1c01037. [DOI] [PMC free article] [PubMed] [Google Scholar]
- 39.Dampalla C.S., Rathnayake A.D., Perera K.D., Jesri A.R.M., Nguyen H.N., Miller M.J., Thurman H.A., Zheng J., Kashipathy M.M., Battaile K.P., Lovell S., Perlman S., Kim Y., Groutas W.C., Chang K.O. Structure-guided design of potent inhibitors of SARS-CoV-2 3CL protease: structural, biochemical, and cell-based studies. J. Med. Chem. 2021;64:17846–17865. doi: 10.1021/acs.jmedchem.1c01037. [DOI] [PMC free article] [PubMed] [Google Scholar]
- 40.Dampalla C.S., Kim Y., Bickmeier N., Rathnayake A.D., Nguyen H.N., Zheng J., Kashipathy M.M., Baird M.A., Battaile K.P., Lovell S., Perlman S., Chang K.O., Groutas W.C. Structure-guided design of conformationally constrained cyclohexane inhibitors of severe acute respiratory syndrome coronavirus-2 3CL protease. J. Med. Chem. 2021;64:10047–10058. doi: 10.1021/acs.jmedchem.1c00319. [DOI] [PMC free article] [PubMed] [Google Scholar]
- 41.Singh J., Petter R.C., Baillie T.A., Whitty A. The resurgence of covalent drugs, Nat. Rev. Drug Discov. 2011;10:307–317. doi: 10.1038/nrd3410. [DOI] [PubMed] [Google Scholar]
- 42.Grossfield A., Zuckerman D.M. Chapter 2 quantifying uncertainty and sampling quality in biomolecular simulations. Annu. Rep. Comput. Chem. 2009;5:23–48. doi: 10.1016/S1574-1400(09)00502-7. [DOI] [PMC free article] [PubMed] [Google Scholar]
- 43.Maffucci I., Contini A. Improved computation of protein-protein relative binding energies with the nwat-MMGBSA method. J. Chem. Inf. Model. 2016;56:1692–1704. doi: 10.1021/acs.jcim.6b00196. [DOI] [PubMed] [Google Scholar]
- 44.Maffucci I., Hu X., Fumagalli V., Contini A. An efficient implementation of the Nwat-MMGBSA method to rescore docking results in medium-throughput virtual screenings. Front. Chem. 2018;6 doi: 10.3389/fchem.2018.00043. [DOI] [PMC free article] [PubMed] [Google Scholar]
- 45.Fusani L., Palmer D.S., Somers D.O., Wall I.D. Exploring ligand stability in protein crystal structures using binding pose metadynamics. J. Chem. Inf. Model. 2020;60:1528–1539. doi: 10.1021/acs.jcim.9b00843. [DOI] [PMC free article] [PubMed] [Google Scholar]
- 46.Baumgartner M.P., Evans D.A. Lessons learned in induced fit docking and metadynamics in the drug design data resource Grand challenge 2. J. Comput. Aided Mol. Des. 2018;32:45–58. doi: 10.1007/s10822-017-0081-y. [DOI] [PubMed] [Google Scholar]
- 47.Cumming J.N., Smith E.M., Wang L., Misiaszek J., Durkin J., Pan J., Iserloh U., Wu Y., Zhu Z., Strickland C., Voigt J., Chen X., Kennedy M.E., Kuvelkar R., Hyde L.A., Cox K., Favreau L., Czarniecki M.F., Greenlee W.J., McKittrick B.A., Parker E.M., Stamford A.W. Structure based design of iminohydantoin BACE1 inhibitors: identification of an orally available, centrally active BACE1 inhibitor. Bioorg. Med. Chem. Lett. 2012;22:2444–2449. doi: 10.1016/j.bmcl.2012.02.013. [DOI] [PubMed] [Google Scholar]
- 48.Ciordia M., Pérez-Benito L., Delgado F., Trabanco A.A., Tresadern G. Application of free energy perturbation for the design of BACE1 inhibitors. J. Chem. Inf. Model. 2016;56:1856–1871. doi: 10.1021/acs.jcim.6b00220. [DOI] [PubMed] [Google Scholar]
- 49.Wallraven K., Holmelin F.L., Glas A., Hennig S., Frolov A.I., Grossmann T.N. Adapting free energy perturbation simulations for large macrocyclic ligands: how to dissect contributions from direct binding and free ligand flexibility. Chem. Sci. 2020;11:2269–2276. doi: 10.1039/c9sc04705k. [DOI] [PMC free article] [PubMed] [Google Scholar]
- 50.De Oliveira C., Yu H.S., Chen W., Abel R., Wang L. Rigorous free energy perturbation approach to estimating relative binding affinities between ligands with multiple protonation and tautomeric states. J. Chem. Theor. Comput. 2019;15:424–435. doi: 10.1021/acs.jctc.8b00826. [DOI] [PubMed] [Google Scholar]
- 51.Hu Y., Sherborne B., Lee T.S., Case D.A., York D.M., Guo Z. The importance of protonation and tautomerization in relative binding affinity prediction: a comparison of AMBER TI and Schrödinger FEP, J. Comput. Aided Mol. Des. 2016;30:533–539. doi: 10.1007/s10822-016-9920-5. [DOI] [PMC free article] [PubMed] [Google Scholar]
- 52.Keiser M.J., Roth B.L., Armbruster B.N., Ernsberger P., Irwin J.J., Shoichet B.K. Relating protein pharmacology by ligand chemistry. Nat. Biotechnol. 2007;25:197–206. doi: 10.1038/nbt1284. [DOI] [PubMed] [Google Scholar]
- 53.Zhang C.H., Stone E.A., Deshmukh M., Ippolito J.A., Ghahremanpour M.M., Tirado-Rives J., Spasov K.A., Zhang S., Takeo Y., Kudalkar S.N., Liang Z., Isaacs F., Lindenbach B., Miller S.J., Anderson K.S., Jorgensen W.L. Potent noncovalent inhibitors of the main protease of SARS-CoV-2 from molecular sculpting of the drug perampanel guided by free energy perturbation calculations. ACS Cent. Sci. 2021;7:467–475. doi: 10.1021/acscentsci.1c00039. [DOI] [PMC free article] [PubMed] [Google Scholar]
- 54.Li Z., Li X., Huang Y.Y., Wu Y., Liu R., Zhou L., Lin Y., Wu D., Zhang L., Liu H., Xu X., Yu K., Zhang Y., Cui J., Zhan C.G., Wang X., Bin Luo H. Identify potent SARS-CoV-2 main protease inhibitors via accelerated free energy perturbation-based virtual screening of existing drugs. Proc. Natl. Acad. Sci. U. S. A. 2020;117:27381–27387. doi: 10.1073/pnas.2010470117. [DOI] [PMC free article] [PubMed] [Google Scholar]
- 55.C S., S D.K., Ragunathan V., Tiwari P., A S., Brindha Devi B.D. Molecular docking, validation, dynamics simulations, and pharmacokinetic prediction of natural compounds against the SARS-CoV-2 main-protease. J. Biomol. Struct. Dyn. 2020 doi: 10.1080/07391102.2020.1815584. [DOI] [PMC free article] [PubMed] [Google Scholar]
- 56.Gogoi M., Borkotoky M., Borchetia S., Chowdhury P., Mahanta S., Barooah A.K. Black tea bioactives as inhibitors of multiple targets of SARS-CoV-2 (3CLpro, PLpro and RdRp): a virtual screening and molecular dynamic simulation study. J. Biomol. Struct. Dyn. 2021 doi: 10.1080/07391102.2021.1897679. [DOI] [PubMed] [Google Scholar]
- 57.Forrestall K.L., Burley D.E., Cash M.K., Pottie I.R., Darvesh S. 2-Pyridone natural products as inhibitors of SARS-CoV-2 main protease. Chem. Biol. Interact. 2021;335 doi: 10.1016/j.cbi.2020.109348. [DOI] [PMC free article] [PubMed] [Google Scholar]
- 58.Gentile D., Patamia V., Scala A., Sciortino M.T., Piperno A., Rescifina A. Putative inhibitors of SARS-COV-2 main protease from a library of marine natural products: a virtual screening and molecular modeling study, Mar. Drugs. 2020;18 doi: 10.3390/md18040225. [DOI] [PMC free article] [PubMed] [Google Scholar]
- 59.Sayed A.M., Alhadrami H.A., El-Gendy A.O., Shamikh Y.I., Belbahri L., Hassan H.M., Abdelmohsen U.R., Rateb M.E. Microbial natural products as potential inhibitors of SARS-CoV-2 main protease (Mpro) Microorganisms. 2020;8:1–17. doi: 10.3390/microorganisms8070970. [DOI] [PMC free article] [PubMed] [Google Scholar]
- 60.Patel C.N., Jani S.P., Jaiswal D.G., Kumar S.P., Mangukia N., Parmar R.M., Rawal R.M., Pandya H.A. Identification of antiviral phytochemicals as a potential SARS-CoV-2 main protease (Mpro) inhibitor using docking and molecular dynamics simulations. Sci. Rep. 2021;11:1–13. doi: 10.1038/s41598-021-99165-4. [DOI] [PMC free article] [PubMed] [Google Scholar]
- 61.Ma Y., Tao Y., Qu H., Wang C., Yan F., Gao X., Zhang M. Exploration of plant-derived natural polyphenols toward COVID-19 main protease inhibitors: DFT, molecular docking approach, and molecular dynamics simulations. RSC Adv. 2022;12:5357–5368. doi: 10.1039/d1ra07364h. [DOI] [PMC free article] [PubMed] [Google Scholar]
- 62.Zhang Y., Gao H., Hu X., Wang Q., Zhong F., Zhou X., Lin C., Yang Y., Wei J., Du W., Huang H., Zhou H., He W., Zhang H., Zhang Y., McCormick P.J., Fu J., Wang D., Fu Y., Lu X., Zhang T., Duan J., Qin B., Jiang H., Luo J., Zhang Y., Chen Q., Luo Q., Cheng L., Zhang Z., Zhang J., Li J. Structure-based discovery and structural basis of a novel broad-spectrum natural product against the main protease of coronavirus. J. Virol. 2022;96 doi: 10.1128/jvi.01253-21. [DOI] [PMC free article] [PubMed] [Google Scholar]
- 63.Zhang Y., Ying J.B., Hong J.J., Li F.C., Fu T.T., Yang F.Y., Zheng G.X., Yao X.J., Lou Y., Qiu Y., Xue W.W., Zhu F. How does chirality determine the selective inhibition of histone deacetylase 6? A lesson from trichostatin A enantiomers based on molecular dynamics, ACS Chem. Neurosci. 2019;10:2467–2480. doi: 10.1021/acschemneuro.8b00729. [DOI] [PubMed] [Google Scholar]
- 64.Wang P., Gao X., Zhang K., Pei Q., Xu X., Yan F., Dong J., Jing C. Exploring the binding mechanism of positive allosteric modulators in human metabotropic glutamate receptor 2 using molecular dynamics simulations. Phys. Chem. Chem. Phys. 2021;23:24125–24139. doi: 10.1039/d1cp02157e. [DOI] [PubMed] [Google Scholar]
- 65.Mey A.S.J.S., Allen B.K., Bruce Macdonald H.E., Chodera J.D., Hahn D.F., Kuhn M., Michel J., Mobley D.L., Naden L.N., Prasad S., Rizzi A., Scheen J., Shirts M.R., Tresadern G., Xu H. Best practices for alchemical free energy calculations [article v1.0] Living J. Comput. Mol. Sci. 2020;2 doi: 10.33011/livecoms.2.1.18378. [DOI] [PMC free article] [PubMed] [Google Scholar]
- 66.Tummino T.A., Rezelj V. v, Fischer B., Fischer A., O'Meara M.J., Monel B., Vallet T., White K.M., Zhang Z., Alon A., Schadt H., O'Donnell H.R., Lyu J., Rosales R., McGovern B.L., Rathnasinghe R., Jangra S., Schotsaert M., Galarneau J.R., Krogan N.J., Urban L., Shokat K.M., Kruse A.C., García-Sastre A., Schwartz O., Moretti F., Vignuzzi M., Pognan F., Shoichet B.K. Drug-induced phospholipidosis confounds drug repurposing for SARS-CoV-2. Science. 1979;373(2021) doi: 10.1126/science.abi4708. [DOI] [PMC free article] [PubMed] [Google Scholar]
- 67.Nelson K.M., Dahlin J.L., Bisson J., Graham J., Pauli G.F., Walters M.A. Curcumin may (not) defy science. ACS Med. Chem. Lett. 2017;8:467–470. doi: 10.1021/acsmedchemlett.7b00139. [DOI] [PMC free article] [PubMed] [Google Scholar]
Associated Data
This section collects any data citations, data availability statements, or supplementary materials included in this article.
Supplementary Materials
Data Availability Statement
All non-modified, time-stamped, raw data of every step of computational simulations using Desmond academic version such as classical dynamics and free energy perturbations are provided at https://drive.google.com/drive/folders/1SvNdMpVvd2Q48vxV_bnR2tYYlBTF6s4H?usp=sharing. These raw data include all the input files, output files, parameters, and log files. Furthermore, these data are represented as tables, figures, supplementary tables, and supplementary figures in the manuscript draft.