

Abstract
Convolutional Neural Networks (CNN) have recently made considerable advances in the field of biomedical signal processing. These methodologies can assist in emotion recognition for affective brain computer interface. In this paper, a novel emotion recognition system based on the effective connectivity and the fine-tuned CNNs from multichannel Electroencephalogram (EEG) signal is presented. After preprocessing EEG signals, the relationships among 32 channels of EEG in the form of effective brain connectivity analysis which represents information flow between regions are computed by direct Directed Transfer Function (dDTF) method which yields a 32*32 image. Then, these constructed images from EEG signals for each subject were fed as input to four versions of pre-trained CNN models, AlexNet, ResNet-50, Inception-v3 and VGG-19 and the parameters of these models are fine-tuned, independently. The proposed deep learning architectures automatically learn patterns in the constructed image of the EEG signals in frequency bands. The efficiency of the proposed approach is evaluated on MAHNOB-HCI and DEAP databases. The experiments for classifying five emotional states show that the ResNet-50 applied on dDTF images in alpha band achieves best results due to specific architecture which captures the brain connectivity, efficiently. The accuracy and F1-score values for MAHNOB-HCI were obtained 99.41, 99.42 and for DEAP databases, 98.17, and 98.23. Newly proposed model is capable of effectively analyzing the brain function using information flow from multichannel EEG signals using effective connectivity measure of dDTF and ResNet-50.
Keywords: Electroencephalogram, Emotion recognition, Effective connectivity, direct Directed Transfer Function (dDTF), Deep Learning (DL), Convolutional Neural Network (CNN)
Introduction
Emotion is a mental state that arises from external stimulus such as watching images, video clips, and hearing music clips. It strongly affects human life and influences on decision making and perception. Nowadays, investigation of emotion has become an important topic in many areas such as affective brain computer interface (aBCI) (Atkinson and Campos 2016; Iacoviello et al. 2015), diagnose psychophysiological disorders (Akar et al. 2015; Li et al. 2015), e-learning and entertainment (Alarcao and Fonseca 2017). Sadness, happiness, fear, anger, disgust and surprise are six basic emotions that introduced by Ekman as basic emotional models (Ekman 1992). The other famous emotional model is based on valence and arousal concepts (Russell 1980). Valence means positive and negative emotional feeling and arousal means low and high elicitation level of emotion. There are multiple brain mapping techniques to investigate emotional states such as functional Magnetic Resonance Imaging (fMRI), Magnetoencephalography (MEG), and electroencephalography (EEG). Among these techniques, EEG is the most convenient way due to high time resolution, user friendly, inexpensive and available in academicals and clinical environments. Also, EEG is widely used in other brain studies such as monitoring depth of anesthesia (Afshani et al. 2019; Shalbaf et al. 2020), depression (Saeedi et al. 2020a,b) and seizure detection (Sadati et al. 2006; Mohseni et al. 2006a,b; Acharya et al. 2018).
There are several nonlinear EEG-based methods that are used in emotion recognition. Among these methods, Correlation Dimension (CD) (Yuvaraj and Murugappan 2016; Soroush et al. 2018, 2019, 2020), Fractal dimension (FD) (Soroush et al. 2018, 2019, 2020; Akar et al. 2015), recurrence quantification analysis (RQA) (Soroush et al. 2018, 2019, 2020; Yang et al. 2018), and entropy (Soroush et al. 2018; Soroush et al. 2019; Soroush et al. 2020; Zhang and Zhang 2016; Jie et al. 2014; Zheng et al. 2017) are the most used. Another nonlinear multi-channel EEG-based method for emotion recognition is brain connectivity measures. Brain connectivity is a multivariate tool that provides valuable information from brain network during processing tasks and it includes two categories: functional connectivity (FC) and effective connectivity (EC) (Mullen 2010).
Lee and Hsieh computed three FC measures, phase synchronization index (PSI), Coherence (Coh) and Correlation (Corr) from 19 channels of EEG and recognized three emotional states of negative, positive and neutral using the Quadratic Discriminant Analysis classifier (Lee and Hsieh 2014). Thammasan et al. (2017) estimated these mentioned FC measures from 32 EEG channels of DEAP database and classified them into two classes of negative and positive valence and low and high arousal using Support vector machine (SVM) and decision tree methods. Liu et al. (2018) estimated another FC measure, Mutual Information (MI) from 32 channels of EEG from DEAP database and then used SVM and Random Forest (RF) classifiers to recognize two classes of low and high arousal and positive and negative valence. Also, Li et al. (2019) estimated another FC measure, PLV from 32 channels of EEG from the two databases of DEAP and MAHNOB-HCI and then classified three emotional states of negative, positive and neutral using the Graph regularized Extreme Learning Machine and SVM methods.
Shahabi and Moghimi (2016) estimated EC measure, Direct Transfer Function (DTF) from 14 EEG channels during listening to music excerpts and classified three emotional states of melancholia, joy and neutral using the SVM. Moreover, Zhang et al. (2017) estimated the Granger Causality (GC) value from candidate EEG channels from each brain region and then computed the significant interaction matrix to investigate two emotional states of negative, and positive. Finally, Rouzbahani and Nasrabadi (2017) estimated two EC methods of GC and DTF from multiple EEG signals and investigated the topography and similarity of three emotional states of sadness, happiness and neutral. However, most of the studies focused on feature extraction and classification have moderate success and ultimately, finding a solution for this subject remains a challenging task.
With developments in neural network architecture design and training, there has been a developing interest in the utilization of deep learning (DL) methods especially the Convolutional neural network (CNN) due to well generalization, flexibility and feature learning abilities (Roy et al. 2019; Guo et al. 2016). It is a widely used method in medical applications (Litjens et al. 2017). The input of CNN models must be 2D image. So, by converting EEG from signal space to image space, we can use the benefits of deep learning methods especially CNN for EEG classification. These methods are used for processing EEG signals with very success (Atkinson and Campos 2016; Iacoviello et al. 2015; Akar et al. 2015; Li et al. 2015; Afshani et al. 2019; Shalbaf et al. 2020; Saeedi et al. 2020a). CNNs are also used in recognition of emotion from EEG signals (Wang et al. 2019; Yang et al. 2018, 2019). Zeng et al. (2019) proposed a specific DL network to improve the recognition rate of emotional states using the SincNet-R. Shen et al. (2020) proposed a novel emotion recognition system based on combination of CNN and Long Short-Term Memory (LSTM) from 4-dimensional spatial, temporal and frequency components of multichannel EEG signals. The other types of deep learning are Stacked Autoencoders (SAE) and LSTM that are used in emotion recognize from EEG signal (Xiaofen et al. 2019).
In contrast to the mentioned work used CNNs for emotion recognition (Yang et al. 2018, 2019; Zeng et al. 2019; Shen et al. 2020), the main contribution of this paper is the method to build 2-dimensional (2-D) image from 1-dimensional (1-D) EEG signals using brain effective connectivity measures (namely direct Directed Transfer Function (dDTF) and Partial Directed Coherence (PDC)) to be fed into pre-trained CNN architecture to recognize the five emotional states (four quarters of valence-arousal model and neutral) from two EEG public databases of DEAP and MAHNOB-HCI during watching music video clips and ordinary emotional video clips, respectively.
Materials and methods
Emotional states
The two-dimensional valence-arousal emotional model has four quarters (Russell 1980) (Fig. 1). The first quarter includes emotions such as excitement and happiness with high valence and high arousal (HVHA) values. The second quarter includes emotions like fear or angry with low valence and high arousal (LVHA) values. Emotions such as sadness, boredom and depression are in the third quarter, having low valence and low arousal (LVLA) values. Contentment and calmness are the fourth emotions which have high valence and low arousal (HVLA) values. Neutral is at the middle of axes. In this paper, the four quarters and neutral are considered as five emotional classes.
Fig. 1.

Valence-arousal emotional model and five emotional classes
MAHNOB-HCI database
In MAHNOB-HCI database, thirty-two recorded channels of EEG according to 10–20 international system from 27 volunteer (15 females and 12 males at ages from 19 to 40) during watching emotional video clips were used (Soleymani and Pantic 2013). These participated volunteers are undergraduate students at postdoctoral fellows with different cultures, languages and educations. EEG signals ware recorded by the Biosemi active II system with the sampling frequency of 256 Hz. Twenty video clips were selected from commercially produced movies to evoke the following emotions: fear and disgust in LVHA, sadness in LVLA, joy in HVHA, amusement in HVLA and neutral. The lengths of video clips are considered from 34.9 to 117 s to be efficient to evoke one emotion according to psychologist’s recommendation (Rottenberg et al. 2007; Schaefer et al. 2010). Then, each subject rated value of valence and arousal concepts based on Self Manikin Assessment (SAM) from 1 to 9 scales (1 for low value and 9 for high). In this study, the values of valence and arousal greater than 5 considered as HVHA class, valence and arousal values lower than 5 considered as LVLA class, valence values greater than 5 and arousal values lower than 5 classified as HVLA class and valence values lower than 5 and arousal values greater than 5 considered as LVHA class. The neutral has valence and arousal values of 5.
DEAP database
In DEAP database, thirty-two EEG channels according to 10–20 international recording system from 32 subjects (16 males and 16 females in the age ranges from 17 to 37) while watching music video clips were recorded (Koelstra et al. 2011). The original sampling frequency was 512 Hz and then was downsampled to 128 Hz at preprocessing step. 40 music video clips with the length of 60 s were used to evoke four emotional states and neutral state. After watching music video clips, subjects rated value of valence and arousal based on SAM from 1 to 9 scales. The class labels were considered as previous explanation in MAHNOB-HCI database.
Pre-processing step
EEG signals of 32 channels from two databases MAHNOB-HCI and DEAP were preprocessed using the EEGLAB toolbox (version 2021.0) in MATLAB software (version 2019a). In preprocessing step of MAHNOB-HCI, EEGs were re-referenced by the averaging method and passed through three FIR filters low pass, high pass and the notch with cut off frequencies of 0.5, 45 and 49–51 Hz, respectively. Also, blinking, squeezing and motion artifacts were removed manually. Finally, EEG signals from 3 subjects were removed due to high amounts of artifacts and further processing were done on the remaining 24 subjects. All of these steps except average re-referencing step were done for DEAP database.
Effective connectivity
There are various methods to convert the 1D signal to a 2D image, namely, non-data-driven approaches like known transformations such as Continuous Wavelet transform (CWT) (Chaudhary et al. 2019), Short- Time Fourier Transform (STFT) (Chaudhary et al. 2019) as time–frequency representation and model-based approaches like time series modelling, Hidden-Markov-Models (HMMs), connectivity-based methods and system theory approaches like recurrent plots and Poincare maps. The basic question this research was supposed to answer was “Are connectivity-based approaches as effective as transformation-based approaches in turning 1D signal to the image to be used successfully for emotion recognition via CNNs or not?”. Brain effective connectivity concept provides valuable information from the brain network during processing tasks. Effective connectivity describes casual or asymmetric dependencies of separate brain regions (Mullen, 2010). This method describes the information flow of brain regions between different EEG channels at a specific frequency component to convert a 1-D EEG signal into a 2-D image.
The most famous method for estimating effective connectivity is Granger-Causality which can be computed in the frequency domain (Shahabi and Moghimi 2016). To achieve this, the estimation of parameters of Multi-Variable Auto-Regressive (MVAR) model for an individual signal data is required. The window length and the model order were two important parameters to estimate the MVAR model from EEG signals. The window length was selected using the Variance-Ratio Test to preserve stationarity of EEG signals. The model order was chosen to minimize the Akaike Information Criterion (AIC). The sliding window length or step size of this window was examined in a try and error manner and finally, it was selected to provide large numbers of image as much as possible to train CNNs better and consequently to have higher performance. Then, based on selected parameters, the estimated model was validated using whiteness of residuals, consistency percent, and stability exams (Mullen 2010). Given channels of EEG data with the lengths of , i.e., , MVAR process of order represents as follow (Korzeniewska et al. 2003; Saeedi et al 2020a):
| 1 |
where is an (M × 1) vector of intercept terms i.e., , are (M × M) model coefficient matrixes and is a white noise process with zero mean and non-singular covariance matrix Σ.
Rearranging terms results in:
| 2 |
where and .
After applying the Fourier transform to both sides:
| 3 |
where
| 4 |
By multiply Eq. (4) at and rearrange terms we have:
| 5 |
where is the (M × M) spectral matrix of the multivariate process, is a random sinusoidal shocks matrix and is the transfer matrix of the system. The spectral density matrix of the process is determined as follows:
| 6 |
The matrices of and are used to define several measures of effective connectivity. The dDTF and PDC are common multivariate extensions of the Granger-causal concept, that are used in this study since they have shown effectiveness in neuroscience studies (Korzeniewska et al. 2003; Kus et al. 2004; Astolfi et al. 2007, 2008; Tafreshi et al. 2019; Shalbaf and Maghoudi 2020; Maghsoudi and Shalbaf 2020; Ghahari et al 2020; Kohan et al 2020; Saeedi et al 2020a).
dDTF measure
dDTF is an estimator of brain effective connectivity concept that are based on frequency-domain of conditional Granger-Causality (Mullen 2010). The dDTF from channel to channel at frequency is estimated by following equation (Korzeniewska et al. 2003; Saeedi et al 2020a):
| 7 |
We extract five frequency ranges for dDTF measure by averaging the frequency spectrum as follows: delta (0.1–4), theta (4–8), alpha (8–13), beta (13–25) and gamma (25–45).
PDC measure
In addition to dDTF, PDC is another estimator of brain information flow that has been used in many neuroscience studies (Astolfi et al. 2007, 2008; Tafreshi et al. 2019). Given simultaneous recorded signals, PCD determines the relation between two signals among them, concerning the influence of all others. PDC from th EEG channel to th EEG channel at frequency f is estimated according to Eq. (8) (Tafreshi et al. 2019):
| 8 |
where is the description of elements of the autoregressive coefficients matrix () in the frequency domain and computes as follows:
| 9 |
where denotes the order of the model. The value of PDC measure is from zero to one. Similar to dDTF measure, PDC at the mentioned frequency bands were represented. All calculations of two dDTF and PDC measures were done in MATLAB (The Mathworks, Inc., Natick, MA, USA) via the Source Information Flow Toolbox (SIFT) version 0.1a (Mullen 2010).
Convolutional neural network and pre-trained versions
CNN is a specific type of neural networks which widely utilized in biomedical signal processing and classification applications (Saeedi et al. 2020a; Faust et al. 2018; Craik et al. 2019; Deng and Yu 2014). This network contains a convolutional layer, pooling layer, batch normalization, fully connected (FC) layers and finally a softmax layer (Guo et al. 2016). High level deep features are extracted in convolutional layers. Then, pooling layers reduces the size of feature maps using maximum or average operators and the most significant features are extracted. Finally, FC layers prepare extracted features to be classified by softmax layer. Softmax is a simple function in the last layer which decides the probability of belonging the input to one of the classes. Rectified Linear Unit (ReLU) activation function is used after each convolutional and fully connected layer to strengthen the network for solving nonlinear problems. Due to good properties of CNNs (generalization, flexibility and etc.), this kind of deep network are used to improve classification accuracy. Four popular pre-trained CNN on ImageNet database named AlexNet, VGG-19, Inception-v3 and ResNet-50 are used in this study to classify five emotional states from EEG signals.
AlexNet
AlexNet which has been won the ILSVRC2012, is a simple CNN with a few convolutional layers (Krizhevsky et al. 2012). It has 5 convolutional layers, three pooling layers with maximum operator and three fully connected layers. AlexNet allows 227 × 227 color images as input and provides 61 million parameters. Figure 2a shows the structure of the AlexNet in compact form.
Fig. 2.

Block representation of a AlexNet and b VGG-19 in compact form
VGGNet
Visual Geometry Group or VGGNet has been the runner-up of ILSVRC2014 (Zisserman 2014). This network has similar structure to the AlexNet but deeper than that; it has sixteen (VGG-16) or nineteen (VGG-19) weighted layers. VGG-19 allows 224 × 224 color images and provides 144 million parameters. Figure 2b shows the structure of theVGG-19 in compact form.
Inception-v3
Inception version 3 or Inception-v3 is the runner up of ILSVRC2015 (Szegedy et al. 2016). The name, Inception comes from the embedded Inception module that has four parallel convolutional layers; by this work, the efficiency increases. Inception-v3 has 23.9 million parameters and accepts input color images with the size of 299 × 299. Figure 3 shows the structure of Inception-v3 in compact form.
Fig. 3.

Block representation of the Inception-v3
ResNet-50
Residual network (ResNet) is the winner of ILSVRC2015 (He et al. 2016). ResNet has many stacked identity shortcut connections that help to solve the vanishing gradient problem of CNNs. ResNet has multiple versions with various convolutional layers, 18, 34, 50, 101 and 152; as increases the number of weighted layers, increases the performance; however, network complexity and computational load increase and requires stronger hardware. Among these versions, ResNet-50 was selected due to better performance and hardware restriction. ResNet-50 allows color images with the size of 224 × 224 and has 25.6 million parameters. Figure 4 shows the structure of ResNet-50 in compact form.
Fig. 4.

Block representation of the ResNet-50 in compact form
Evaluation criteria
The tenfold Cross-Validation method was used to evaluate recognition performance. In this regard, independently, four versions of the pre-trained CNNs were fine-tuned on ninefold of dDTF images and evaluated on onefold. Then, images were shuffled and this procedure repeated 10-times and the accuracy, precision, recall and F1-score measures were computed (Sokolova and Lapalme 2009). Finally, the values of mean and standard deviation were reported.
Results
EEG signals of 32 channels from two databases MAHNOB-HCI (27 subjects) and DEAP (32 subjects) were preprocessed using the EEGLAB toolbox (version 2021.0) in MATLAB software (version 2019a). Finally, EEG signals from 3 subjects were removed due to high amounts of artifacts and further processing were done on the remaining 24 subjects. As the lengths of EEG signals from this database differ from 34.9 to 117 s, we selected the least length of 30 s to be processed. The length of EEG signal from DEAP database was 60 s. Then, EEGs were normalized with zero mean and standard deviation and then used to fit a MVAR model. In MAHNOB and DEAP database, the model orders are selected 10. We have selected the window length and step size equal to 5 and 1 s for MAHNOB-HCI database. Therefore, 26 windows were created from signal with the length of 30 s. Also, we have selected the window length and step size equal to 6 and 1 s for DEAP database. Therefore, 55 windows were created from signal with the length of 60 s. Consequently, dDTF and PDC measures based on parameters of calculated MVAR model are estimated on 32 EEG channels per subject in five standard frequency bands delta, theta, alpha, beta and gamma from 5- and 6-s windows for MAHNOB-HCI and DEAP databases, respectively. Results of effective connectivity methods (dDTF and PDC measures) which are 32 × 32 values (32 channels) are considered as images with size of 32 × 32 and fed as input of pre-trained CNN models. The size of images constructed by dDTF and PDC are 32 × 32, which are not match with the input size of the pre-trained CNN models. So, each pixel in dDTF and PDC images are expanded to achieve the required size of input image of the pre-trained CNN models. For example, the input size of AlexNet is 227 × 227 and each pixel of dDTF and PDC were expanded approximately 7 times. So, a process to convert 1-dimensional EEG signals to image is done by effective connectivity measures. The number of dDTF and PDC images separately for each frequency band for MAHNOB-HCI and DEAP were 12,480 (26 (window) × 24 (subject) × 20 (video clips)) and 70,400 (55 (window) × 32 (subject) × 40 (music video clips)), respectively. Figure 5 shows dDTF images of one subject for the five emotional states (a) HVHA, (b) LVHA, (c) LVLA, (d) HVLA and (e) neutral states in different frequency bands for MAHNOB-HCI databases, respectively. According to these figures, there are obvious differences among five emotional states in the point of effective connectivity measured by dDTF at each frequency band.
Fig. 5.


dDTF images for a HVHA, b LVHA, c LVLA, d HVLA and e neutral states in delta, theta, alpha, beta and gamma frequency bands on 5-s time window for MAHNOB-HCI EEG signals. The size of dDTF matrix was 32 × 32 and denotes in horizontal and vertical axis. Each element represents the dDTF value between two channels, in which the values of diagonal elements are zero
Then, constructed dDTF and PDC images from EEG signals were separately fed as input to four versions of pre-trained CNN models, AlexNet, ResNet-50, Inception-v3 and VGG-19 and the parameters of these models are fine-tuned, independently. Fine-tune step was performed on ninefold of data and then onefold to evaluate the performance of the classifier using various metrics (accuracy, precision, recall and F1-score) for five emotional states. This procedure repeated 10-times and the mean and standard deviation of these measures were reported. Cross Entropy was chosen as the loss function and in optimization phase, the adaptive moment estimation optimizer (ADAM) algorithm was used. The initial learning rate, squared gradient decay factor, max epochs and mini batch size were 0.0004 (0.0001 for AlexNet), 0.99, 40 and 32, respectively. If the accuracy value (or loss function) did not change from 100% (negligible) in five consecutive epochs the early stop was occurred manually. Figure 6 shows block diagram of the proposed method for dDTF images.
Fig. 6.

The block diagram of proposed emotion recognition system
Results of MAHNOB-HCI database
Table 1 shows the classification results for the fine-tuned of four pre-trained CNNs in all frequency bands of PDC images while using the tenfold Cross-Validation method. As it can be observed, the alpha frequency band had the highest accuracy using each model on PDC images. The highest accuracy, precision, recall and F1-score were obtained 96.25%, 96.23%, 96.28% and 96.23% in the alpha frequency band using the ResNet-50, respectively. Inception-v3 was the runner up of recognizing the five emotional states on the same images and frequency band with the difference of 1% that achieved the average accuracy, precision, recall and F1-score of 95.85%, 95.83%, 95.87% and 95.83%, respectively.
Table 1.
Classification results for proposed method using different pre-trained CNNs and PDC images on MAHNOB-HCI database in all frequency bands while using tenfold Cross-Validation method
| Net | Bands | Accuracy (%) | Precision (%) | Recall (%) | F1- score (%) |
|---|---|---|---|---|---|
| AlexNet | Delta | 75.76 ± 0.49 | 75.74 ± 0.56 | 75.78 ± 0.51 | 76.72 ± 0.55 |
| Theta | 76.28 ± 0.52 | 76.25 ± 0.55 | 76.24 ± 0.63 | 76.24 ± 0.50 | |
| Alpha | 78.32 ± 0.63 | 78.30 ± 0.53 | 78.35 ± 0.50 | 78.26 ± 0.67 | |
| Beta | 77.35 ± 0.65 | 77.34 ± 0.56 | 77.36 ± 0.55 | 77.32 ± 0.56 | |
| Gamma | 77.15 ± 0.55 | 77.12 ± 0.50 | 77.16 ± 0.56 | 77.13 ± 0.50 | |
| VGG-19 | Delta | 85.25 ± 0.54 | 85.22 ± 0.50 | 85.26 ± 0.50 | 85.20 ± 0.52 |
| Theta | 85.45 ± 0.58 | 85.75 ± 0.55 | 85.78 ± 0.54 | 85.42 ± 0.55 | |
| Alpha | 87.38 ± 0.46 | 87.33 ± 0.50 | 87.42 ± 0.52 | 87.32 ± 0.52 | |
| Beta | 86.05 ± 0.52 | 86.03 ± 0.53 | 86.10 ± 0.52 | 86.02 ± 0.53 | |
| Gamma | 85.75 ± 0.50 | 85.72 ± 0.40 | 85.78 ± 0.65 | 85.72 ± 0.50 | |
| ResNet-50 | Delta | 93.24 ± 0.53 | 93.23 ± 0.54 | 93.25 ± 0.50 | 93.22 ± 0.52 |
| Theta | 93.64 ± 0.54 | 93.63 ± 0.55 | 93.66 ± 0.54 | 93.61 ± 0.58 | |
| Alpha | 96.26 ± 0.53 | 96.23 ± 0.56 | 96.28 ± 0.55 | 96.23 ± 0.54 | |
| Beta | 94.53 ± 0.52 | 94.52 ± 0.57 | 94.55 ± 0.52 | 94.50 ± 0.55 | |
| Gamma | 94.22 ± 0.51 | 94.16 ± 0.53 | 94.24 ± 0.55 | 94.20 ± 0.50 | |
| Inception-v3 | Delta | 92.10 ± 0.54 | 92.08 ± 0.53 | 92.14 ± 0.55 | 92.07 ± 0.52 |
| Theta | 92.39 ± 0.58 | 92.37 ± 0.50 | 92.42 ± 0.50 | 92.35 ± 0.50 | |
| Alpha | 95.85 ± 0.56 | 95.83 ± 0.54 | 95.87 ± 0.52 | 95.83 ± 0.60 | |
| Beta | 93.29 ± 0.50 | 93.25 ± 0.59 | 93.34 ± 0.56 | 93.26 ± 0.57 | |
| Gamma | 93.07 ± 0.53 | 93.05 ± 0.56 | 93.12 ± 0.55 | 93.05 ± 0.55 |
Highest results are showed bold
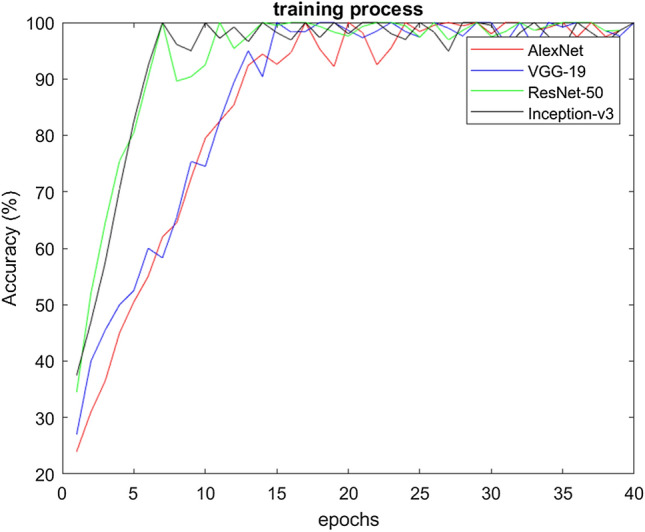
Figure 7 shows training curves for AlexNet, VGG-19, ResNet-50 and Inception-v3 at alpha frequency band of dDTF images from MAHNOB-HCI database. According to this figure, the two networks, ResNet-50 and Inception-v3 are trained sooner than AlexNet and VGG-19. Table 2 shows the classification results for the fine-tuned of four pre-trained CNNs in all frequency bands of dDTF images while using tenfold Cross-Validation method. Alpha frequency band had the highest accuracy using each model and ResNet-50 achieved the highest accuracy, followed by Inception-v3 in recognition of five emotional states on dDTF images. Maximum accuracy, precision, recall and F1-score were obtained 99.43% ± 0.58, 99.42% ± 0.62, 99.44% ± 0.61 and 99.42% ± 0.56 in alpha frequency band using the ResNet-50, respectively, followed by Inception-v3 with 98.55% ± 0.59, 98.55 ± 0.63, 98.55 ± 0.64 and 98.55 ± 0.59. Table 3 shows confusion matrixes for the different pre-trained CNNs in alpha frequency band.
Fig. 7.

The train curve obtained for AlexNet, VGG-19, ResNet-50 and Inception-v3 at alpha frequency band of dDTF images from MAHNOB-HCI database
Table 2.
Classification results for proposed method using different pre-trained CNNs and dDTF images on MAHNOB-HCI database in all frequency bands while using tenfold Cross-Validation method
| Net | Bands | Accuracy (%) | Precision (%) | Recall (%) | F1-score (%) |
|---|---|---|---|---|---|
| AlexNet | Delta | 79.20 ± 0.75 | 79.38 ± 0.73 | 79.41 ± 0.70 | 79.25 ± 0.71 |
| Theta | 79.45 ± 0.74 | 79.63 ± 0.72 | 79.72 ± 0.71 | 79.53 ± 0.72 | |
| Alpha | 79.40 ± 0.73 | 79.44 ± 0.72 | 79.38 ± 0.69 | 79.40 ± 0.70 | |
| Beta | 79.56 ± 0.73 | 79.74 ± 0.73 | 79.83 ± 0.67 | 79.40 ± 0.71 | |
| Gamma | 79.50 ± 0.74 | 79.71 ± 0.73 | 79.80 ± 0.66 | 79.62 ± 0.68 | |
| VGG-19 | Delta | 86.12 ± 0.75 | 86.10 ± 0.74 | 86.35 ± 0.70 | 86.16 ± 0.67 |
| Theta | 86.45 ± 0.74 | 86.42 ± 0.73 | 86.75 ± 0.73 | 86.39 ± 0.68 | |
| Alpha | 88.30 ± 0.75 | 88.29 ± 0.74 | 88.30 ± 0.72 | 88.30 ± 0.72 | |
| Beta | 87.54 ± 0.73 | 87.75 ± 0.72 | 87.65 ± 0.73 | 87.56 ± 0.68 | |
| Gamma | 87.50 ± 0.74 | 87.70 ± 0.72 | 87.61 ± 0.72 | 87.76 ± 0.65 | |
| ResNet-50 | Delta | 97.30 ± 0.62 | 97.35 ± 0.66 | 97.20 ± 0.67 | 97.31 ± 0.69 |
| Theta | 98.25 ± 0.63 | 98.50 ± 0.63 | 98.25 ± 0.65 | 98.47 ± 0.62 | |
| Alpha | 99.43 ± 0.58 | 99.42 ± 0.61 | 99.44 ± 0.62 | 99.42 ± 0.56 | |
| Beta | 98.44 ± 0.59 | 98.67 ± 0.62 | 98.42 ± 0.63 | 98.54 ± 0.58 | |
| Gamma | 98.35 ± 0.57 | 98.55 ± 0.65 | 98.37 ± 0.63 | 98.29 ± 0.60 | |
| Inception-v3 | Delta | 97.30 ± 0.62 | 97.26 ± 0.65 | 97.36 ± 0.65 | 97.33 ± 0.59 |
| Theta | 97.30 ± 0.63 | 97.27 ± 0.64 | 97.36 ± 0.63 | 97.35 ± 0.61 | |
| Alpha | 98.55 ± 0.59 | 98.55 ± 0.63 | 98.55 ± 0.64 | 98.55 ± 0.59 | |
| Beta | 97.32 ± 0.60 | 97.26 ± 0.63 | 97.39 ± 0.65 | 97.30 ± 0.60 | |
| Gamma | 97.25 ± 0.59 | 97.29 ± 0.61 | 97.31 ± 0.60 | 97.26 ± 0.62 |
Highest results are showed bold
Table 3.
Confusion matrixes of proposed method using different pre-trained CNNs ((a) AlexNet, (b) VGG-19, (c) ResNet-50 and (d) Inception-v3) and dDTF images on MAHNOB-HCI database in alpha frequency bands

Results of DEAP database
Table 4 shows the classification results for the fine-tuned of four pre-trained CNNs in all frequency bands of PDC images while using the tenfold Cross-Validation method. Alpha frequency band had the highest accuracy using each model on PDC images. The highest accuracy, precision, recall and F1-score were obtained 95.73%, 95.70%, 95.77% and 95.69% in the alpha frequency band using the ResNet-50, respectively. Similar to results on PDC images of the MAHNOB-HCI database, Inception-v3 was the runner-up and achieved average accuracy, precision, recall and F1-score 94.12%, 94.10%, 94.14% and 94.07%, respectively.
Table 4.
Classification results for proposed method using different pre-trained CNNs and PDC images on DEAP database in all frequency bands while using tenfold Cross-Validation method
| Net | Bands | Accuracy (%) | Precision (%) | Recall (%) | F1- score (%) |
|---|---|---|---|---|---|
| AlexNet | Delta | 75.23 ± 0.46 | 75.24 ± 0.53 | 75.05 ± 0.54 | 75.20 ± 0.52 |
| Theta | 75.55 ± 0.58 | 75.56 ± 0.59 | 75.64 ± 0.56 | 75.52 ± 0.56 | |
| Alpha | 77.12 ± 0.53 | 77.13 ± 0.55 | 77.15 ± 0.55 | 77.08 ± 0.45 | |
| Beta | 76.48 ± 0.62 | 76.15 ± 0.47 | 76.06 ± 0.43 | 76.44 ± 0.52 | |
| Gamma | 76.14 ± 0.48 | 76.18 ± 0.53 | 76.76 ± 0.48 | 76.12 ± 0.55 | |
| VGG-19 | Delta | 83.39 ± 0.52 | 83.35 ± 0.54 | 83.41 ± 0.55 | 83.35 ± 0.53 |
| Theta | 83.76 ± 0.47 | 83.75 ± 0.49 | 83.78 ± 0.62 | 83.70 ± 0.52 | |
| Alpha | 85.42 ± 0.65 | 85.41 ± 0.56 | 85.45 ± 0.55 | 85.38 ± 0.56 | |
| Beta | 84.44 ± 0.48 | 84.42 ± 0.45 | 84.45 ± 0.57 | 84.42 ± 0.48 | |
| Gamma | 84.15 ± 0.53 | 84.14 ± 0.48 | 84.16 ± 0.43 | 84.12 ± 0.55 | |
| ResNet-50 | Delta | 91.20 ± 0.51 | 91.22 ± 0.43 | 91.26 ± 0.46 | 91.16 ± 0.51 |
| Theta | 91.52 ± 0.60 | 91.55 ± 0.52 | 91.54 ± 0.56 | 91.50 ± 0.56 | |
| Alpha | 95.73 ± 0.56 | 95.70 ± 0.54 | 95.77 ± 0.52 | 95.69 ± 0.55 | |
| Beta | 93.36 ± 0.56 | 93.33 ± 0.54 | 93.42 ± 0.47 | 93.29 ± 0.62 | |
| Gamma | 93.24 ± 0.53 | 93.22 ± 0.45 | 93.28 ± 0.56 | 93.21 ± 0.54 | |
| Inception-v3 | Delta | 91.25 ± 0.58 | 91.24 ± 0.75 | 91.27 ± 0.48 | 91.21 ± 0.63 |
| Theta | 91.44 ± 0.49 | 91.41 ± 0.56 | 91.47 ± 0.57 | 91.42 ± 0.56 | |
| Alpha | 94.12 ± 0.52 | 94.10 ± 0.47 | 94.14 ± 0.48 | 94.07 ± 0.65 | |
| Beta | 92.56 ± 0.56 | 92.52 ± 0.54 | 92.59 ± 0.53 | 92.54 ± 0.46 | |
| Gamma | 92.21 ± 0.54 | 92.18 ± 0.55 | 92.23 ± 0.55 | 92.20 ± 0.48 |
Highest results are showed bold
Figure 8 shows training curves for AlexNet, VGG-19, ResNet-50 and Inception-v3 at alpha frequency band of dDTF images DEAP database. Similar to MAHNOB-HCI database, the two networks, ResNet-50 and Inception-v3 are trained sooner than AlexNet and VGG-19 on dDTF images. Table 5 shows the classification results for the different pre-trained CNNs in all frequency bands while using tenfold Cross-Validation method on dDTF images. Again, alpha frequency band had the highest accuracy using each model and ResNet-50 achieved the highest accuracy, followed by Inception-v3, VGG-19 and AlexNet in recognition of five emotional states on dDTF images. Maximum accuracy, precision, recall and F1-score were obtained 98.16% ± 0.54, 98.16 ± 0.64, 98.16 ± 0.63 and 98.16 ± 0.55 in alpha frequency band using the ResNet-50, respectively. Table 6 shows confusion matrixes for the different pre-trained CNNs in alpha frequency band.
Fig. 8.
The train curve obtained for AlexNet, VGG-19, ResNet-50 and Inception-v3 on dDTF images at alpha frequency band of DEAP database
Table 5.
Classification results for proposed method using different pre-trained CNNs and dDTF images on DEAP database in all frequency bands while using tenfold Cross-Validation method
| Net | Bands | Accuracy (%) | Precision (%) | Recall (%) | F1- score (%) |
|---|---|---|---|---|---|
| AlexNet | Delta | 80.10 ± 0.75 | 80.21 ± 0.72 | 80.79 ± 0.73 | 80.45 ± 0.72 |
| Theta | 80.32 ± 0.73 | 80.36 ± 0.71 | 80.21 ± 0.74 | 80.35 ± 0.70 | |
| Alpha | 82.40 ± 0.70 | 82.39 ± 0.69 | 82.39 ± 0.75 | 82.39 ± 0.69 | |
| Beta | 81.12 ± 0.77 | 81.15 ± 0.70 | 80.87 ± 0.74 | 81.03 ± 0.71 | |
| Gamma | 81.34 ± 0.75 | 81.30 ± 0.74 | 81.05 ± 0.75 | 81.15 ± 0.69 | |
| VGG-19 | Delta | 87.62 ± 0.75 | 87.55 ± 0.75 | 87.05 ± 0.68 | 87.34 ± 0.71 |
| Theta | 88.50 ± 0.73 | 88.47 ± 0.75 | 88.10 ± 0.69 | 88.25 ± 0.68 | |
| Alpha | 89.95 ± 0.70 | 89.95 ± 0.69 | 89.95 ± 0.70 | 89.95 ± 0.69 | |
| Beta | 89.50 ± 0.70 | 89.47 ± 0.70 | 89.08 ± 0.69 | 89.34 ± 0.67 | |
| Gamma | 88.25 ± 0.71 | 88.20 ± 0.70 | 87.86 ± 0.68 | 88.10 ± 0.65 | |
| ResNet-50 | Delta | 97.10 ± 0.53 | 97.12 ± 0.65 | 96.85 ± 0.67 | 97.05 ± 0.63 |
| Theta | 97.05 ± 0.60 | 97.10 ± 0.65 | 96.83 ± 0.65 | 96.92 ± 0.60 | |
| Alpha | 98.16 ± 0.54 | 98.16 ± 0.64 | 98.16 ± 0.63 | 98.16 ± 0.55 | |
| Beta | 97.13 ± 0.56 | 97.16 ± 0.63 | 96.95 ± 0.65 | 97.04 ± 0.58 | |
| Gamma | 97.15 ± 0.50 | 97.20 ± 0.63 | 96.91 ± 0.64 | 97.01 ± 0.59 | |
| Inception-v3 | Delta | 97.20 ± 0.52 | 97.35 ± 0.65 | 96.50 ± 0.66 | 97.14 ± 0.59 |
| Theta | 97.35 ± 0.54 | 97.42 ± 0.64 | 97.05 ± 0.65 | 97.35 ± 0.58 | |
| Alpha | 97.54 ± 0.55 | 97.53 ± 0.65 | 97.53 ± 0.62 | 97.53 ± 0.57 | |
| Beta | 97.25 ± 0.50 | 97.30 ± 0.65 | 96.86 ± 0.64 | 97.17 ± 0.57 | |
| Gamma | 97.50 ± 0.48 | 97.57 ± 0.62 | 96.73 ± 0.63 | 97.28 ± 0.59 |
Highest results are showed bold
Table 6.
Confusion matrixes of proposed method using different pre-trained CNNs ((a) AlexNet, (b) VGG-19, (c) ResNet-50 and (d) Inception-v3) and dDTF images on DEAP database in alpha frequency bands

Discussion
In this research, we have used deep learning and effective connectivity methods for automated detection of emotional states with very success. The highest accuracy values of 99.43% and 98.16% are achieved for applying the architecture of ResNet-50 in images of dDTF method at alpha frequency band on 32 channels of EEG signals from the MAHNOB-HCI and the DEAP databases, respectively.
One of the main novelties of this work is a way to build 2-dimensional image from 1-dimensional EEG signals of 32 channels using brain effective connectivity measures to be fed to pre-trained CNN architecture. There are other techniques to make 2-D image from 1-dimensional signal based on classical time–frequency information (Short Term Fourier Transform (STFT) (Chaudhary et al. 2019) and Continuous Wavelet transform (CWT) (Chaudhary et al. 2019)). However, we have used the effective connectivity measure, i.e., the dDTF and PDC which describes information flow of brain regions between different EEG channels at a specific frequency component. Also, we have exploited different deep learning schemes named AlexNet, ResNet-50, VGG-19 and Inception-v3.
According to Tables 1 and 2, alpha frequency band had highest accuracies to recognize the five mentioned emotional states in MAHNOB-HCI database using most of the fine-tuned CNNs followed by beta, gamma, theta and delta frequency bands. Also, according to Tables 4 and 5, alpha frequency band had highest accuracies using all fine-tuned CNNs for DEAP database followed by gamma, beta, theta and delta frequency bands. Therefore, alpha frequency band is more discriminative than other bands to recognize the five mentioned emotional states in the two analyzed databases. The previous works have shown the superiority and efficiency of alpha band power in emotion classification (Nie et al. 2011; Zheng and Lu 2015; Zheng et al. 2017; Akar et al. 2015). These studies declared that alpha, beta and gamma band power are the most correlated bands to emotion. We found it informative and also interesting that in terms of information flow (effective connectivity) between brain regions, also alpha band shows better discriminative behavior than other bands. Our findings about alpha effective connectivity by dDTF and PDC are consistent with others studies with other connectivity features. Shahabi and Moghimi (2016) proved that DTF effective connectivity at alpha, beta and gamma frequency bands are increased at frontal and parietal regions than other frequency bands while listening to music. This is consistent with Fig. 5, there are greater information flow at multiple frontal and parietal channels at these frequency bands comparing delta and theta frequency bands. Moreover, Wu et al. (2019) found that the coherence connectivity is significantly higher at frontal site in the alpha, beta and gamma bands for the happy emotion (HVHA emotional state). So, our findings about alpha, beta and gamma dDTF and PDC are consistent with others studies with different features and also several psychological studies (Jaušovec et al. 2011; Klimesch 2012; Başar 2012; Allen et al 2018).
Comparing Tables 1,24 and 5, we found that dDTF images are more effective and appropriate to investigate and recognize emotional states than PDC images in terms of accuracy values (99.43% vs. 96.26% for MAHNOB-HCI database and 98.16% vs. 95.73% for DEAP database).
According to Tables 1, 2, 3, 4, 5 and 6, ResNet-50 and Inception-v3 had the best recognition results for five emotional states in two databases. ResNet-50 and Inception-v3 use residual and Inception modules, respectively, that have specific non-straightforward arrangement of convolutional layers. A residual module has shortcuts from input to output and Inception module has parallel convolutional layers. Also, these networks use the batch normalization technique to prevent overfitting and speed up convergence (Guo et al. 2016). As showed in Figs. 7 and 8 these networks are trained sooner than AlexNet and VGG-19. So, these specific arrangements cause to learn the desired task more accurately and results of these networks are higher than VGG-19 and AlexNet.
In Table 7, results of this study are compared with new best related studies to classify emotional states from EEG signals on same databases. All of these studies considered emotional states based on the valence-arousal model. The majority of these studies such as Lee and Hsieh (2014), Zhang et al. (2017) and Yang et al. (2019) classified emotional states as binary classes based on the valence and arousal concepts, i.e., positive valence against negative valence and low arousal against high arousal. But we considered emotional states in more detail (5 classes, as mentioned in the Emotional states section) to be closer to real life, i.e., positive valence and high arousal is considered one class, positive valence and low arousal another class, negative valence and low arousal or high arousal the other two classes and finally near zero valence and arousal as the neutral class.
Table 7.
Comparison of emotion recognition studies from EEG signals
| References (year) | Database | Method | Number of classes | Accuracy (%) |
|---|---|---|---|---|
| Atkinson and Campos (2016) | DEAP | Statistical features, FD, HP, mRMR, SVM | 2 | 73.41 (valence), 73.06 (arousal) |
| Yang et al. (2018) | DEAP | Empirical mode decomposition, Sample entropy, support vector machine | 4 | 93.2 |
| Zheng et al. (2017) | DEAP | Differential entropy, Graph regularized Extreme Learning Machine | 4 | 69.67 |
| Soroush et al. (2018) | DEAP | Nonlinear features (CD, FD, …), ICAs, modified Dempster-Shafer theory of evidence | 4 | 90.54 |
| Soroush et al. (2020) | DEAP | Poincare plane, MSVM, KNN, MLP | 4 | 89.76 |
| Lee and Hsieh (2014) | DEAP | PSI, Coh, Corr, SVM, MLP, DT | 2 | 73.30 (arousal), 72.50 (valence) |
| Zhang et al. (2017) | DEAP | MI, PCC, SVM, RF | 2 | 72.6 (valence), 70.3 (arousal) |
| Li et al. (2019) | DEAP, MAHNOB-HCI | PLV, SVM, GELM | 4 | 68 (MAHNOB-HCI), 62 (DEAP) |
| Wang et al. (2019) | DEAP | PLV, graph-CNN | 2 | 73.31 (valence), 77.03 (arousal) |
| Yang et al. (2018) | DEAP | Recurrence quantification analysis, Parallel Convolutional Recurrent Neural Network | 2 | 90.8 (valence), 91.03 (arousal) |
| Xiaofen et al. (2019) | DEAP | Stack AutoEncoder-Long short-term memory | 2 | 81.10 (valence), 74.38 (arousal) |
| Yang et al. (2019) | DEAP | Multi column CNN | 2 | 90.01 (valence), 90.65 (arousal) |
| Shen et al. (2020) | DEAP | Differential entropy, 4D-Convolutional recurrent neural network | 2 | 94.22 (valence), 94.58 (arousal) |
| Proposed method | DEAP, MAHNOB-HCI | dDTF, PDC, ResNet-50, Inception-v3, AlexNet, VGG-19 | 5 | 98.16 ± 0.54 (dDTF, DEAP), 99.43 ± 0.58 (dDTF, MAHNOB-HCI) |
As it is observed, accuracy achieved in this study is higher than those studies with the traditional machine learning methods and other deep learning method and proves the preference of the proposed method. So, compared to other similar studies, this work has the advantage of combination of the dDTF effective connectivity image converted from EEG signals and powerful fine-tuned deep learning CNNs comparing the other methods that caused higher accuracy. Consequently, according to the Table 7, this study acquired the best results so far in automated recognition of emotional states in two databases. Our aim in the future is to employ the developed methodology on other types of EEG data.
Conclusion
A comprehensive study using the concept of information flow from multichannel EEG signals via two effective connectivity measures, dDTF and PDC, and a number of well-known pre-trained deep learning algorithms was exploited for recognition of five emotional states during watching emotional video clips and music video clips (MAHNOB-HCI and DEAP databases). The highest accuracy values of 99.43% and 98.16% are achieved for applying the architecture of ResNet-50 in images of dDTF method at alpha frequency band in classifying five emotional states from the MAHNOB-HCI and the DEAP databases, respectively. Relying on the results, newly proposed model is capable of effectively analyzing the brain function and produces the best results compared to all studies in recent years.
Acknowledgements
We would like to thank Science and Research Branch, Islamic Azad University due to their support.
Appendix
Tables 8 and 9 shows the classification results for the fine-tuned of four pre-trained CNNs in all frequency bands of dDTF images from MAHNOB-HCI (Table 8) and DEAP (Table 9) database using Leave-One-Subject-Out (LOSO) Cross-Validation method. Alpha frequency band had the highest accuracy using each model and ResNet-50 achieved the highest accuracy in recognition of five emotional states on dDTF images. In Table 8, maximum accuracy, precision, recall and F1-score were obtained 97.78% ± 3.32, 97.72% ± 3.33, 97.71% ± 3.45 and 97.73% ± 3.24 in alpha frequency band using the ResNet-50, respectively. In Table 9, maximum accuracy, precision, recall and F1-score were obtained 96.12% ± 3.25, 96.15% ± 3.24, 96.25% ± 3.30 and 96.16% ± 3.25 in alpha frequency band using the ResNet-50, respectively.
Table 8.
Classification results for proposed method using different pre-trained CNNs and dDTF images on MAHNOB-HCI database in all frequency bands using the LOSO Cross-Validation method
| Net | Bands | Accuracy (%) | Precision (%) | Recall (%) | F1-score (%) |
|---|---|---|---|---|---|
| AlexNet | Delta | 76.55 ± 0.75 | 76.59 ± 3.43 | 76.50 ± 3.24 | 76.42 ± 3.22 |
| Theta | 77.07 ± 0.74 | 77.12 ± 3.22 | 77.15 ± 3.52 | 77.10 ± 3.44 | |
| Alpha | 77.73 ± 0.73 | 77.77 ± 3.40 | 77.75 ± 3.53 | 77.64 ± 3.42 | |
| Beta | 77.28 ± 0.73 | 77.35 ± 3.43 | 77.26 ± 3.35 | 77.21 ± 3.41 | |
| Gamma | 77.40 ± 0.74 | 77.43 ± 3.32 | 77.32 ± 3.40 | 77.32 ± 3.45 | |
| VGG-19 | Delta | 84.36 ± 3.45 | 84.57 ± 3.32 | 84.32 ± 3.39 | 84.15 ± 3.34 |
| Theta | 84.69 ± 3.49 | 84.83 ± 3.45 | 84.57 ± 3.35 | 84.52 ± 3.28 | |
| Alpha | 86.42 ± 3.25 | 86.66 ± 3.40 | 86.35 ± 3.36 | 86.34 ± 3.37 | |
| Beta | 85.30 ± 3.34 | 85.52 ± 3.42 | 85.24 ± 3.34 | 85.22 ± 3.34 | |
| Gamma | 85.42 ± 3.50 | 85.67 ± 3.38 | 85.36 ± 3.40 | 85.34 ± 3.32 | |
| ResNet-50 | Delta | 95.23 ± 3.27 | 95.73 ± 3.35 | 95.32 ± 3.37 | 95.13 ± 3.24 |
| Theta | 96.65 ± 3.25 | 96.75 ± 3.34 | 96.65 ± 3.32 | 96.48 ± 3.25 | |
| Alpha | 97.78 ± 3.32 | 97.72 ± 3.33 | 97.71 ± 3.45 | 97.73 ± 3.24 | |
| Beta | 96.91 ± 3.24 | 96.93 ± 3.25 | 96.84 ± 3.24 | 96.75 ± 3.35 | |
| Gamma | 96.86 ± 3.21 | 96.90 ± 3.21 | 96.82 ± 3.40 | 96.73 ± 3.42 | |
| Inception-v3 | Delta | 94.26 ± 3.55 | 94.24 ± 3.52 | 94.33 ± 3.43 | 94.15 ± 3.22 |
| Theta | 94.54 ± 3.52 | 94.60 ± 3.43 | 94.54 ± 3.25 | 94.37 ± 3.31 | |
| Alpha | 96.86 ± 3.54 | 96.83 ± 3.22 | 96.78 ± 3.44 | 96.70 ± 3.30 | |
| Beta | 95.25 ± 3.26 | 95.30 ± 3.45 | 95.32 ± 3.30 | 95.20 ± 3.32 | |
| Gamma | 95.20 ± 3.23 | 95.32 ± 3.35 | 95.24 ± 3.23 | 95.15 ± 3.34 |
Highest results are showed bold
Table 9.
Classification results for proposed method using different pre-trained CNNs and dDTF images on DEAP database in all frequency bands using LOSO Cross-Validation method
| Net | Bands | Accuracy (%) | Precision (%) | Recall (%) | F1- score (%) |
|---|---|---|---|---|---|
| AlexNet | Delta | 79.49 ± 3.42 | 79.35 ± 3.35 | 79.55 ± 3.72 | 79.32 ± 3.35 |
| Theta | 79.36 ± 3.36 | 79.13 ± 3.41 | 79.42 ± 3.29 | 79.25 ± 3.26 | |
| Alpha | 80.62 ± 3.34 | 80.48 ± 3.30 | 80.72 ± 3.35 | 80.49 ± 3.32 | |
| Beta | 80.21 ± 3.35 | 80.10 ± 3.34 | 80.34 ± 3.42 | 80.15 ± 3.42 | |
| Gamma | 80.36 ± 3.30 | 80.24 ± 3.35 | 80.39 ± 3.45 | 80.30 ± 3.29 | |
| VGG-19 | Delta | 80.12 ± 3.34 | 80.11 ± 3.32 | 80.25 ± 3.35 | 80.08 ± 3.29 |
| Theta | 80.46 ± 3.40 | 80.38 ± 3.35 | 80.54 ± 3.32 | 80.30 ± 3.35 | |
| Alpha | 81.72 ± 3.35 | 81.57 ± 3.26 | 81.76 ± 3.25 | 81.65 ± 3.36 | |
| Beta | 81.38 ± 3.22 | 81.32 ± 3.35 | 81.42 ± 3.27 | 81.32 ± 3.45 | |
| Gamma | 81.45 ± 3.36 | 81.34 ± 3.42 | 81.51 ± 3.38 | 81.40 ± 3.36 | |
| ResNet-50 | Delta | 94.02 ± 3.25 | 94.15 ± 3.34 | 94.26 ± 3.32 | 94.10 ± 3.35 |
| Theta | 94.35 ± 3.27 | 94.25 ± 3.30 | 94.44 ± 3.35 | 94.32 ± 3.40 | |
| Alpha | 96.12 ± 3.25 | 96.15 ± 3.24 | 96.25 ± 3.30 | 96.15 ± 3.25 | |
| Beta | 95.42 ± 3.50 | 95.40 ± 3.36 | 95.57 ± 3.24 | 95.32 ± 3.22 | |
| Gamma | 95.56 ± 3.20 | 95.74 ± 3.29 | 95.53 ± 3.30 | 95.67 ± 3.29 | |
| Inception-v3 | Delta | 92.36 ± 3.55 | 92.23 ± 3.60 | 92.25 ± 3.64 | 92.20 ± 3.52 |
| Theta | 92.49 ± 3.54 | 92.35 ± 3.62 | 92.35 ± 3.62 | 92.31 ± 3.56 | |
| Alpha | 93.80 ± 3.56 | 93.62 ± 3.65 | 93.72 ± 3.60 | 93.72 ± 3.52 | |
| Beta | 93.30 ± 3.52 | 93.13 ± 3.62 | 93.35 ± 3.62 | 93.25 ± 3.53 | |
| Gamma | 93.45 ± 3.54 | 93.30 ± 3.56 | 93.50 ± 3.62 | 93.35 ± 3.55 |
Highest results are showed bold
Authors' contributions
All authors contributed equally to the preparation of the manuscript.
Funding
This research did not receive any specific grant from funding agencies in the public, commercial, or not-for-profit sectors.
Data availability
The data that support the findings of this study are available from (Koelstra et al 2011; Soleymani and Pantic 2013) but restrictions apply to the availability of these data, which were used under license for the current study, and so are not publicly available. Data are however available from the authors upon reasonable request and with permission of (Koelstra et al 2011; Soleymani and Pantic 2013). The datasets analyzed during the current study are available in the DEAP repository, http://www.eecs.qmul.ac.uk/mmv/datasets/deap/ and MAHNOB-HCI repository, https://mahnob-db.eu/.
Code availability
Not applicable.
Declarations
Conflict of interest
There is no conflicts of interest.
Ethical approval
Not applicable (we used the DEAP and MAHNOB-HCI databases that have approval by the original researchers).
Informed consent
Not applicable (we used the DEAP and MAHNOB-HCI databases that have consent of participants but we did not access to these information).
Footnotes
Publisher's Note
Springer Nature remains neutral with regard to jurisdictional claims in published maps and institutional affiliations.
Contributor Information
Sara Bagherzadeh, Email: sara.bagherzadeh@srbiau.ac.ir.
Keivan Maghooli, Email: keivanmaghooli91@gmail.com, Email: k_maghooli@srbiau.ac.ir.
Ahmad Shalbaf, Email: Shalbaf@sbmu.ac.ir.
Arash Maghsoudi, Email: Maghsoudi@srbiau.ac.ir.
References
- Acharya UR, Oh SL, Hagiwara Y, Tan JH, Adeli H. Deep convolutional neural network for the automated detection and diagnosis of seizure using EEG signals. Comput Biol Med. 2018;100:270–278. doi: 10.1016/j.compbiomed.2017.09.017. [DOI] [PubMed] [Google Scholar]
- Afshani F, Shalbaf A, Shalbaf R, Sleigh J. Frontal–temporal functional connectivity of EEG signal by standardized permutation mutual information during anesthesia. Cogn Neurodyn. 2019;13(6):531–540. doi: 10.1007/s11571-019-09553-w. [DOI] [PMC free article] [PubMed] [Google Scholar]
- Akar SA, Kara S, Agambayev S, Bilgiç V. Nonlinear analysis of EEGs of patients with major depression during different emotional states. Comput Biol Med. 2015;67:49–60. doi: 10.1016/j.compbiomed.2015.09.019. [DOI] [PubMed] [Google Scholar]
- Alarcao SM, Fonseca MJ. Emotions recognition using EEG signals: a survey. IEEE Trans Affect Comput. 2017;10(3):374–393. [Google Scholar]
- Allen JJ, Keune PM, Schönenberg M, Nusslock R. Frontal EEG alpha asymmetry and emotion: From neural underpinnings and methodological considerations to psychopathology and social cognition. Psychophysiology. 2018;55(1):e13028. doi: 10.1111/psyp.13028. [DOI] [PubMed] [Google Scholar]
- Atkinson J, Campos D. Improving BCI-based emotion recognition by combining EEG feature selection and kernel classifiers. Expert Syst Appl. 2016;47:35–41. [Google Scholar]
- Astolfi L, Cincotti F, Mattia D, Marciani MG, Baccala LA, et al. Comparison of different cortical connectivity estimators for high-resolution EEG recordings. Hum Brain Mapp. 2007;28(2):143–157. doi: 10.1002/hbm.20263. [DOI] [PMC free article] [PubMed] [Google Scholar]
- Astolfi L, Fallani FDV, Cincotti F, Mattia D, Marciani MG, et al. Estimation of effective and functional cortical connectivity from neuroelectric and hemodynamic recordings. IEEE Trans Neural Syst Rehabil Eng. 2008;17(3):224–233. doi: 10.1109/TNSRE.2008.2010472. [DOI] [PMC free article] [PubMed] [Google Scholar]
- Başar E. A review of alpha activity in integrative brain function: fundamental physiology, sensory coding, cognition and pathology. Int J Psychophysiol. 2012;86:1–24. doi: 10.1016/j.ijpsycho.2012.07.002. [DOI] [PubMed] [Google Scholar]
- Chaudhary S, Taran S, Bajaj V, Sengur A. Convolutional neural network based approach towards motor imagery tasks EEG signals classification. IEEE Sens J. 2019;19(12):4494–4500. [Google Scholar]
- Craik A, He A, Contreras-Vidal JLA. Deep learning for electroencephalogram (EEG) classification tasks: a review. J Neural Eng. 2019;16(3):031001. doi: 10.1088/1741-2552/ab0ab5. [DOI] [PubMed] [Google Scholar]
- Deng L, Yu D. Deep learning: methods and applications. Found Trends Signal Process. 2014;7(3–4):197–387. [Google Scholar]
- Ekman P. Are there basic emotions? Psychol Rev. 1992;99:550–553. doi: 10.1037/0033-295x.99.3.550. [DOI] [PubMed] [Google Scholar]
- Faust O, Hagiwara Y, Hong TJ, Lih OS, Acharya UR. Deep learning for healthcare applications based on physiological signals: A review. Comput Methods Programs Biomed. 2018;161:1–3. doi: 10.1016/j.cmpb.2018.04.005. [DOI] [PubMed] [Google Scholar]
- Ghahari S, Salehi F, Farahani N, Coben R, Nasrabadi AM. Representing temporal network based on dDTF of EEG signals in children with autism and healthy children. Biomed Signal Process Control. 2020;62:102139. [Google Scholar]
- Guo Y, Liu A, Oerlemans A, Lao S, Wu S, Lew MS. Deep learning for visual understanding: a review. Neurocomputing. 2016;187:27–48. [Google Scholar]
- He K, Zhang X, Ren S, Sun J (2016) Deep residual learning for image recognition. In: Proceedings of the IEEE conference on computer vision and pattern recognition, pp 770–778
- Iacoviello D, Petracca A, Spezialetti M, Placidi G. A real-time classification algorithm for EEG-based BCI driven by self-induced emotions. Comput Methods Programs Biomed. 2015;122(3):293–303. doi: 10.1016/j.cmpb.2015.08.011. [DOI] [PubMed] [Google Scholar]
- Jaušovec N, Jaušovec K, Gerlič I. Differences in event-related and induced EEG patterns in the theta and alpha frequency bands related to human emotional intelligence. Neurosci Lett. 2011;311:93–96. doi: 10.1016/s0304-3940(01)02141-3. [DOI] [PubMed] [Google Scholar]
- Jie X, Cao R, Li L. Emotion recognition based on the sample entropy of EEG. Bio-Med Mater Eng. 2014;24(1):1185–1192. doi: 10.3233/BME-130919. [DOI] [PubMed] [Google Scholar]
- Klimesch W. Alpha-band oscillations, attention, and controlled access to stored information. Trends Cogn Sci. 2012;16:606–617. doi: 10.1016/j.tics.2012.10.007. [DOI] [PMC free article] [PubMed] [Google Scholar]
- Koelstra S, Muhl C, Soleymani M, Lee JS, Yazdani A, Ebrahimi T, Pun T, Nijholt A, Patras I. DEAP: a database for emotion analysis; using physiological signals. IEEE Trans Affect Comput. 2011;3(1):18–31. [Google Scholar]
- Kohan MD, Nasrabadi AM, Shamsollahi MB, Sharifi A. EEG/PPG effective connectivity fusion for analyzing deception in interview. Signal Image Video Process. 2020;14:907–914. [Google Scholar]
- Korzeniewska A, Mańczak M, Kamiński M, Blinowska KJ, Kasicki S. Determination of information flow direction among brain structures by a modified directed transfer function (dDTF) method. J Neurosci Methods. 2003;125(1–2):195–207. doi: 10.1016/s0165-0270(03)00052-9. [DOI] [PubMed] [Google Scholar]
- Krizhevsky A, Sutskever I, Hinton GE (2012) Imagenet classification with deep convolutional neural networks. In: Advances in neural information processing systems, pp 1097–1105
- Kus R, Kaminski M, Blinowska KJ. Determination of EEG activity propagation: pair-wise versus multichannel estimate. IEEE Trans Biomed Eng. 2004;51(9):1501–1510. doi: 10.1109/TBME.2004.827929. [DOI] [PubMed] [Google Scholar]
- Lee YY, Hsieh S. Classifying different emotional states by means of EEG-based functional connectivity patterns. PLOS ONE. 2014;9(4):e95415. doi: 10.1371/journal.pone.0095415. [DOI] [PMC free article] [PubMed] [Google Scholar]
- Li Y, Cao D, Wei L, Tang Y, Wang J. Abnormal functional connectivity of EEG gamma band in patients with depression during emotional face processing. Clin Neurophysiol. 2015;126(11):2078–2089. doi: 10.1016/j.clinph.2014.12.026. [DOI] [PubMed] [Google Scholar]
- Li P, Liu H, Si Y, Li C, Li F, Zhu X, Huang X, Zeng Y, Yao D, Zhang Y, Xu P. EEG based emotion recognition by combining functional connectivity network and local activations. IEEE Trans Biomed Eng. 2019;66(10):2869–2881. doi: 10.1109/TBME.2019.2897651. [DOI] [PubMed] [Google Scholar]
- Litjens G, Kooi T, Bejnordi BE, Setio AAA, Ciompi F, Ghafoorian M, Van Der Laak JA, Van Ginneken B, Sánchez CI. A survey on deep learning in medical image analysis. Med Image Anal. 2017;42:60–88. doi: 10.1016/j.media.2017.07.005. [DOI] [PubMed] [Google Scholar]
- Liu J, Meng H, Li M, Zhang F, Qin R, Nandi AK. Emotion detection from EEG recordings based on supervised and unsupervised dimension reduction. Concurr Comput Pract Exp. 2018;30(23):e4446. [Google Scholar]
- Maghsoudi A, Shalbaf A (2020) Hand Motor Imagery Classification Using Effective Connectivity and Hierarchical Machine Learning in EEG Signals. J Biomed Phys Eng [DOI] [PMC free article] [PubMed]
- Mohseni HR, Maghsoudi A, Kadbi MH, Hashemi J, Ashourvan A (2006) Automatc detection of epileptic seizure using time-frequency distributions. In 2006 IET 3rd International conference on advances in medical, signal and information processing-MEDSIP 2006, pp 1–4
- Mohseni HR, Maghsoudi A, Shamsollahi MB (2006) Seizure detection in EEG signals: a comparison of different approaches. In: 2006 International conference of the IEEE engineering in medicine and biology society, pp 6724–6727 [DOI] [PubMed]
- Mullen T (2010) Source information flow toolbox (SIFT). Swartz Center for Computational Neuroscience, California, San Diego
- Nie D, Wang XW, Shi LC, Lu BL (2011) EEG-based emotion recognition during watching movies. In: 2011 5th international IEEE/EMBS conference on neural engineering, pp 667–670
- Rouzbahani M, Nasrabadi AM. Effective connectivity estimation based on emotion EEG signal by granger causality and directed transfer function. Adv Cogn Sci. 2017;19:1–18. [Google Scholar]
- Rottenberg J, Ray RD, Gross JJ (2007) Emotion elicitation using films. In: Handbook of emotion elicitation and assessment, series in affective science. Oxford University Press, pp 9–28
- Roy Y, Banville H, Albuquerque I, Gramfort A, Falk TH, Faubert J. Deep learning-based electroencephalography analysis: a systematic review. J Neural Eng. 2019;16(5):051001. doi: 10.1088/1741-2552/ab260c. [DOI] [PubMed] [Google Scholar]
- Russell JA. A circumplex model of affect. J Pers Soc Psychol. 1980;39(6):1161. [Google Scholar]
- Sadati N, Mohseni HR, Maghsoudi A (2006) Epileptic seizure detection using neural fuzzy networks. In: 2006 IEEE international conference on fuzzy systems, pp 596–600
- Saeedi A, Saeedi M, Maghsoudi A, Shalbaf A. Major depressive disorder diagnosis based on effective connectivity in EEG signals: a convolutional neural network and long short-term memory approach. Cogn Neurodyn. 2020;15:239–252. doi: 10.1007/s11571-020-09619-0. [DOI] [PMC free article] [PubMed] [Google Scholar]
- Saeedi M, Saeedi A, Maghsoudi A. Major depressive disorder assessment via enhanced k-nearest neighbor method and EEG signals. Phys Eng Sci Med. 2020;43:1007–1018. doi: 10.1007/s13246-020-00897-w. [DOI] [PubMed] [Google Scholar]
- Schaefer A, Nils F, Sanchez X, Philippot P. Assessing the effectiveness of a large database of emotion-eliciting films: a new tool for emotion researchers. Cogn Emot. 2010;24:1153–1172. [Google Scholar]
- Shahabi H, Moghimi S. Toward automatic detection of brain responses to emotional music through analysis of EEG effective connectivity. Comput Hum Behav. 2016;58:231–239. [Google Scholar]
- Shalbaf A, Shalbaf R, Saffar M, Sleigh J. Monitoring the level of hypnosis using a hierarchical SVM system. J Clin Monit Comput. 2020;34(2):331–338. doi: 10.1007/s10877-019-00311-1. [DOI] [PubMed] [Google Scholar]
- Shalbaf A, Maghsoudi A (2020) Mental arithmetic task recognition using effective connectivity and hierarchical feature selection from EEG Signals. Basic Clin Neurosci [DOI] [PMC free article] [PubMed]
- Shen F, Dai G, Lin G, Zhang J, Kong W, Zeng H. EEG-based emotion recognition using 4D convolutional recurrent neural network. Cogn Neurodyn. 2020;14(6):815–828. doi: 10.1007/s11571-020-09634-1. [DOI] [PMC free article] [PubMed] [Google Scholar]
- Sokolova M, Lapalme G. A systematic analysis of performance measures for classification tasks. Inf Process Manage. 2009;45:427–437. [Google Scholar]
- Soleymani M, Pantic M (2013) Multimedia implicit tagging using EEG signals. In: IEEE international conference on multimedia and expo (ICME), pp 1–6
- Soroush MZ, Maghooli K, Setarehdan SK, Nasrabadi AM. A novel approach to emotion recognition using local subset feature selection and modified Dempster-Shafer theory. Behav Brain Funct. 2018;14(1):17. doi: 10.1186/s12993-018-0149-4. [DOI] [PMC free article] [PubMed] [Google Scholar]
- Soroush MZ, Maghooli K, Setarehdan SK, Nasrabadi AM. Emotion recognition through EEG phase space dynamics and Dempster-Shafer theory. Med Hypotheses. 2019;127:34–45. doi: 10.1016/j.mehy.2019.03.025. [DOI] [PubMed] [Google Scholar]
- Soroush MZ, Maghooli K, Setarehdan SK, Nasrabadi AM. Emotion recognition using EEG phase space dynamics and Poincare intersections. Biomed Signal Process Control. 2020;59:101918. [Google Scholar]
- Szegedy C, Vanhoucke V, Ioffe S, Shlens J, Wojna Z (2016) Rethinking the inception architecture for computer vision. In: Proceedings of the IEEE conference on computer vision and pattern recognition, pp 2818–2826
- Tafreshi TF, Daliri MR, Ghodousi M. Functional and effective connectivity based features of EEG signals for object recognition. Cogn Neurodyn. 2019;13(6):555–566. doi: 10.1007/s11571-019-09556-7. [DOI] [PMC free article] [PubMed] [Google Scholar]
- Thammasan N, Moriyama K, Fukui KI, Numao M. Familiarity effects in EEG-based emotion recognition. Brain Inf. 2017;4(1):39–50. doi: 10.1007/s40708-016-0051-5. [DOI] [PMC free article] [PubMed] [Google Scholar]
- Wang Z, Tong Y, Heng X. Phase-locking value-based graph convolutional neural networks for emotion recognition. IEEE Access. 2019;7:93711–93722. [Google Scholar]
- Wu X, Zheng WL, Lu BL (2019) Identifying functional brain connectivity patterns for EEG-based emotion recognition. In: 2019 9th international IEEE/EMBS conference on neural engineering (NER) 2019 Mar 20, pp 235–238
- Xiaofen X, Li Z, Xu T, Shu L, Hu B, Xu X. SAE+ LSTM: a new framework for emotion recognition from multi-channel EEG. Front Neurorobot. 2019;13:37. doi: 10.3389/fnbot.2019.00037. [DOI] [PMC free article] [PubMed] [Google Scholar]
- Yang YX, Gao ZK, Wang XM, Li YL, Han JW, Marwan N, Kurths J. A recurrence quantification analysis-based channel-frequency convolutional neural network for emotion recognition from EEG. Chaos. 2018;28(8):085724. doi: 10.1063/1.5023857. [DOI] [PubMed] [Google Scholar]
- Yang H, Han J, Min K. A multi-column CNN model for emotion recognition from EEG signals. Sensors. 2019;19:4736. doi: 10.3390/s19214736. [DOI] [PMC free article] [PubMed] [Google Scholar]
- Yuvaraj R, Murugappan M. Hemispheric asymmetry non-linear analysis of EEG during emotional responses from idiopathic Parkinson’s disease patients. Cogn Neurodyn. 2016;10(3):225–234. doi: 10.1007/s11571-016-9375-3. [DOI] [PMC free article] [PubMed] [Google Scholar]
- Zeng H, Wu Z, Zhang J, Yang C, Zhang H, Dai G, Kong W. EEG emotion classification using an improved SincNet-based deep learning model. Brain Sci. 2019;9(11):326. doi: 10.3390/brainsci9110326. [DOI] [PMC free article] [PubMed] [Google Scholar]
- Zhang Y, Ji X, Zhang S. An approach to EEG-based emotion recognition using combined feature extraction method. Neurosci Lett. 2016;633:152–157. doi: 10.1016/j.neulet.2016.09.037. [DOI] [PubMed] [Google Scholar]
- Zhang J, Zhao S, Huang W, Hu S (2017) Brain effective connectivity analysis from EEG for positive and negative emotion. In: International conference on neural information processing, pp 851–857
- Zheng WL, Lu BL. Investigating critical frequency bands and channels for EEG-based emotion recognition with deep neural networks. IEEE Trans Auton Ment Dev. 2015;7(3):162–175. [Google Scholar]
- Zheng WL, Zhu JY, Lu BL. Identifying stable patterns over time for emotion recognition from EEG. IEEE Trans Affect Comput. 2017;10:417–429. [Google Scholar]
- Zisserman SK (2014) Very deep convolutional networks for large-scale image recognition. arXiv: 1409.1556.
Associated Data
This section collects any data citations, data availability statements, or supplementary materials included in this article.
Data Availability Statement
The data that support the findings of this study are available from (Koelstra et al 2011; Soleymani and Pantic 2013) but restrictions apply to the availability of these data, which were used under license for the current study, and so are not publicly available. Data are however available from the authors upon reasonable request and with permission of (Koelstra et al 2011; Soleymani and Pantic 2013). The datasets analyzed during the current study are available in the DEAP repository, http://www.eecs.qmul.ac.uk/mmv/datasets/deap/ and MAHNOB-HCI repository, https://mahnob-db.eu/.
Not applicable.