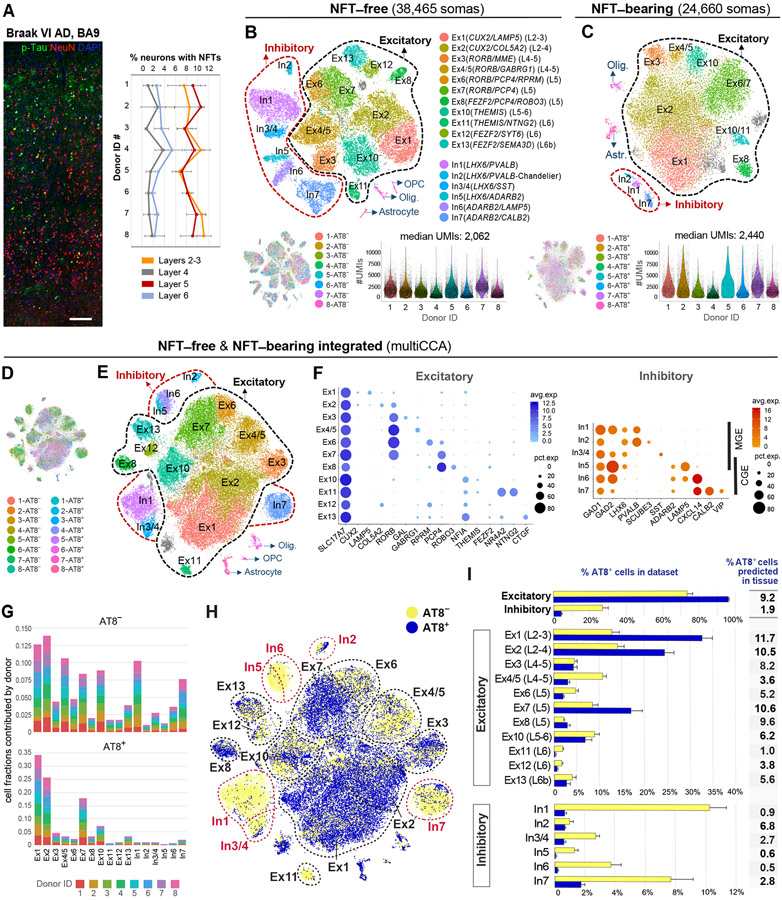
Figure 2. Census of neuronal subtypes exhibiting NFTs in AD.
(A) Quantification of NFT density in tissues used for transcriptomics. NFTs were abundant in layers 2–3 (8.94 ± 1.52%) and 5 (8.86 ± 1.56%) and sparse in layers 4 (1.75 ± 1.03%) and 6 (3.03 ± 0.96%). Data are represented as mean ± STD.
(B and C) Clustering of NFT-free and NFT-bearing somas separately. t-SNE plots illustrate the annotated cell types. Gray clusters represent mixed populations. Violin plots show the distribution of UMI counts per cell in each sample.
(D–F) Clustering of NFT-free and NFT-bearing combined datasets after multiCCA (63,110 somas after QC). One color in (D) per sample. Unsupervised clustering (E) identified the same neuronal subtypes as in (B). Dot plots (F) depict the expression of marker genes (x-axis) within Ex and In clusters (y-axis).
(G) Bar plots illustrating the fraction of somas derived from each donor per cluster (normalized to sample size).
(H) t-SNE plot highlighting the relative contributions of AT8− and AT8+ somas to each cluster.
(I) Bar plots showing the percentages of AT8− and AT8+ somas per cluster. Data are represented as mean ± SEM. The column adjacent to the bar plots shows the predicted percentages of AT8+ neurons in histological sections for each subtype (percentage of AT8+ somas per cluster normalized to total somas obtained in clustering analysis divided by percentage of NFT-bearing neurons obtained in histological sections from the same donor [Figure 2A]).
See also Figures S3 and S4, and Table S2.

