Abstract
A system concept for online alignment verification of millimeter-wave, corneal reflectometry is presented. The system utilizes beam scanning to generate magnitude-only reflectivity maps of the cornea at 650 GHz and compares these images to a precomputed/measured template map to confirm/reject sufficient alignment. A system utilizing 5 off-axis parabolic mirrors, a thin film beam splitter, and 2-axis galvanometric mirror was designed, simulated, and evaluated with geometric and physical optics. Simulation results informed the construction of a demonstrator system which was tested with a reference reflector. Similarity metrics computed with the aligned template and 26 misaligned positions, distributed on a 0.5 mm x 0.5 mm x 0.5 mm mesh, demonstrated sufficient misalignment detection sensitivity in 23 out of 26 positions. The results show that positional accuracy on the order of 0.5 mm is possible using 0.462 mm wavelength radiation due to the perturbation of coupling efficiency via beam distortion and beam walk-off.
Index Terms—: Biological and medical imaging, THz imaging of cornea, medical diagnostics, clinical instruments
1. Introduction
Millimeter-wave (mmW)-to-THz frequency mapping of corneal tissue water content (CTWC) continues to generate interest in the high frequency RF and photonics communities with increasing support from ophthalmology and related clinical specialties [1–8]. CTWC is currently difficult to quantify in vivo and abnormal increases in tissue hydration are associated with a number of corneal diseases [9–11] and correlated with tissue viability following various surgical procedures [12–15]. The cornea offers a unique opportunity for mmW-to-THz frequency remote sensing as the typical population variation in geometry and morphology are vanishingly small when evaluated on THz wavelength scales [2]. The absence of wavelength referenced physiologic variation results in limited target induced clutter thus enabling straightforward analysis of in vivo tissue properties. This allows system engineering to focus on the dielectric spectroscopic like measurements that take advantage of the natural cavity enhanced spectral signatures arising from the aqueous humor lying directly behind. In other words, resolution of lossy, longitudinal modes enables sensitive and specific quantification of dispersive optical path length leading to absolute measurement of CTWC.
Despite these favorable conditions, translation of mmW and THz frequency-based diagnostics to in vivo pilot trials has been difficult. One major barrier is alignment sensitivity where the combination of wavelength sized sources/detectors with relatively long optical path lengths within the instrument yields rapid coupling loss and beam walk-off due to uncontrolled patient movement. This challenge is similar to that faced in UV/VIS/NIR imaging of ocular structures (e.g. optical coherence tomography (OCT)) where the patient’s significant, uncontrolled movement with respect to desired spatial/volumetric resolution confounds image acquisition with sufficient clarity. Modern ophthalmologic imaging system (e.g. OCT, fluorescence angiography, etc.) overcome movement-based clutter by increasing acquisition speed and continually acquiring data until sufficient image clarity is obtained. Image clarity assessment may be quantified/automated or may be performed qualitatively by a technician via visual assessment. In either case, a real time validation is performed via imaging data.
Successful application of mmW and THz frequency technology to corneal imaging also requires online, real-time verification of alignment but cannot leverage dense focal plane arrays and resolution of small, known anatomical structures as reference points. Further lower illumination frequencies enable more clinically relevant penetration depths but further limit the number of useful pixels on target. Finally, it is difficult, in practice, to optically couple a mmW imaging system with, e.g. a NIR imaging system to provide online, external validation of corneal position relative to the mmW aperture.
To address this problem, we propose implementing THz imaging as an alignment adjunct to mmW-based CTWC quantification. In this concept, a higher frequency with insufficient penetration depth is used to image the surface of the cornea while a lower frequency, mmW band is used to assess water content. The high frequency coupling between source and detector generates contrast that is quite sensitive and specific to optimal corneal alignment. Thus, both the mmW and THz data are obtained simultaneously and continuously, and the THz data is used to screen for optimal alignment at which point the concomitant mmW data is used to extract CTWC. These bands are inherently compatible since quasi-optical designs optimized for mmW radiation are generally low loss and well behaved in the low THz band (e.g. < 1 THz).
This article details the design theory and simulation of a corneal imaging using off-axis parabolic (OAP) mirrors and compares them to experimental results. The scanning architecture and its working principals are presented. Ray tracing, quasioptical, and physical optic simulations of the scanning subsystem and the complete optical systems are presented where the expected image contrast in the aligned and misaligned cases are presented. A scanning system is constructed and fed by a 650 GHz narrow band frequency multiplier source. Image data from characterization targets is compared and contrasted to the simulation results and an image similarity metric for optimal alignment detection is presented and tested.
II. Adjunct alignment system concept
A. Previous work on alignment sensitivity
Alignment sensitivity of a quasioptical system, composed of two custom biconvex aspherical lenses, was explored with physical optics (PO) [16]. A broad band (220 GHz – 330 GHz) Gaussian beam was routed through a lens train and incident on a sphere of water surrounded by a lossy spherical shell and representing the electromagnetic properties of the cornea. The shell was 0.5 mm thick and 78% water by volume and was placed such that the incident field curvature was matched to the target surface curvature. The scattered beam was rerouted back to the beam feed and complex reflectivity spectra generated via field coupling computations. The complex spectra were analyzed with the equivalent planar stratified media under plane wave illumination conditions, and particle swarm optimization (PSO) was used to extract a baseline thickness and water content of ~ 0.49 mm and ~ 79.9% respectively. Misalignment effects were explored by displacing the target in the axial and transverse directions and rerunning the PSO at each position. Axial displacements of 0.1 mm produced errors of ~ 0.042 mm and 6% in thickness and water content estimates respectively. Transverse displacements were explored up to 0.5 mm and produced errors of ~ 0.140 mm and 5% in thickness and water content estimates respectively. In all cases, the change total (band integrated) coupled power was negligible making it nearly impossible to detect misalignment with the 220 GHz – 330 GHz band alone.
B. Concept
A conceptual diagram integrating the mmW and reflectometer and proposed alignment adjunct are displayed in Figure 1(a). The mmW and THz beams orthogonally polarized and are quasioptically coupled via a free standing or substrate deposited wire grid polarizer.
Figure 1.
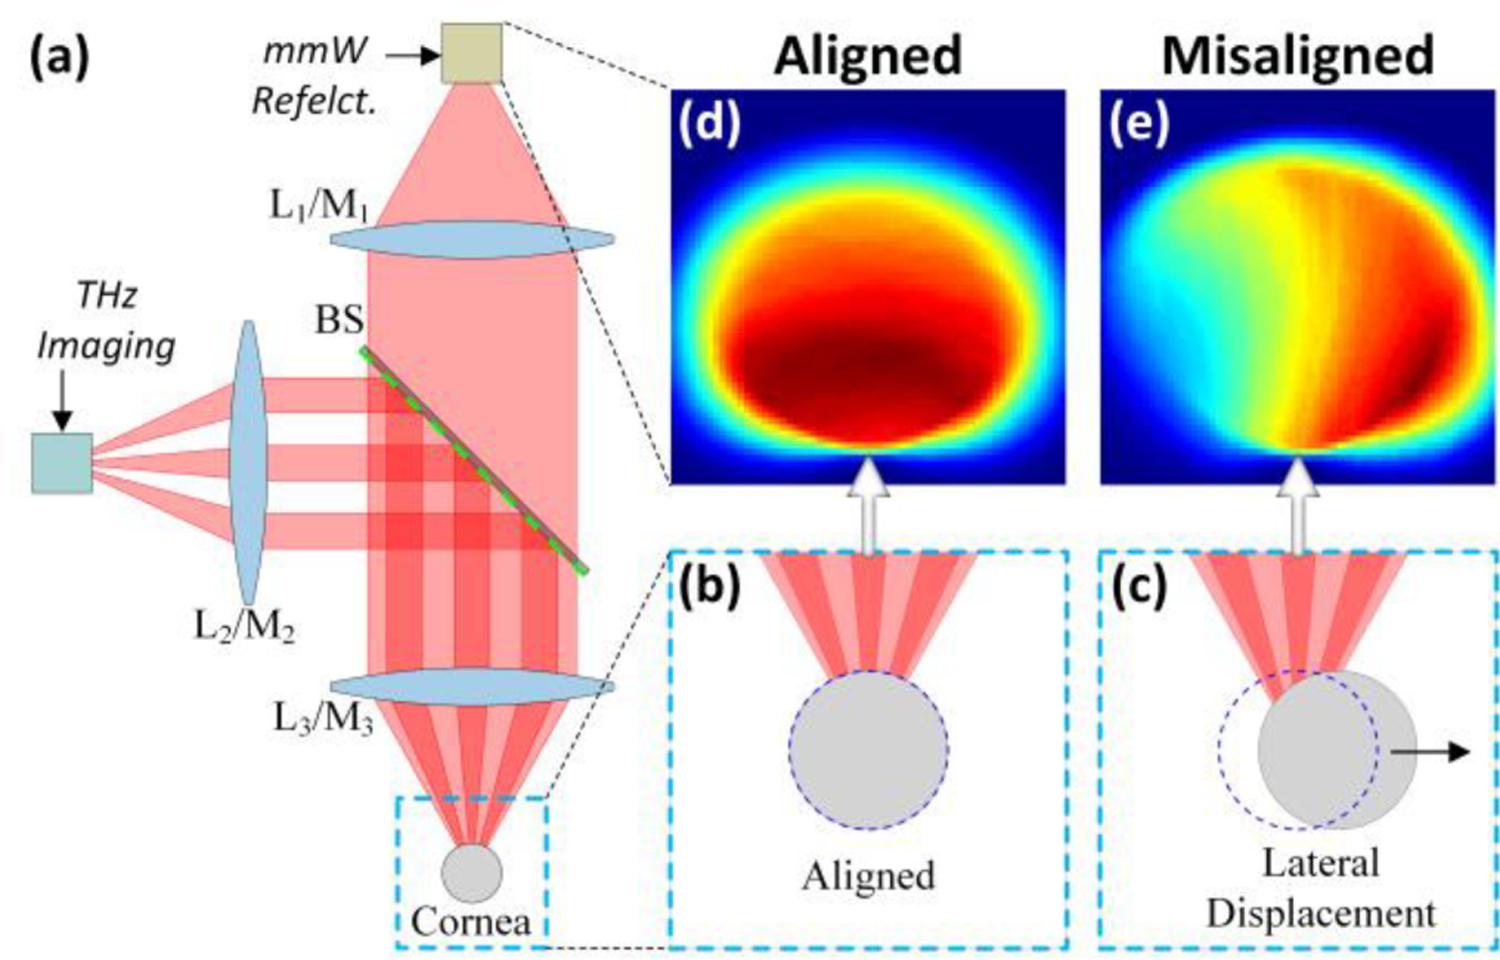
Alignment concept. (a) A quasioptical diplexer (e.g. wire grid polarizer) multiplexes the THz and mmW beams on a common optical axis. When the cornea is positioned correctly with respect to the aperture in (b) the THz image shows the contrast in (d). When the cornea is misaligned (c) there is a significant change in imaging contrast (e) arising from the rapid degradation in coupling.
Lenses/Mirrors 2 and 3 (L2/M2 and L3/M3 in Figure 1), and the total free space path between them, are designed to optimize the match between source beam radius and corneal curvature in the mmW band [17]. Additionally, L2,3/M2,3 are designed to create collimated beams with long confocal distances and thus free space path lengths sufficiently large to accommodate the beam splitter and other optics. In this setup, mmW reflectivity spectrum and THz imagery are continually acquired. When the observed THz contrast matches a pre-known/computed contrast map for optimal alignment, the concomitant mmW spectra is processed to compute corneal water content. This concept is further enumerated in Figure 1 (b) – (d). Figure 1 (b) shows the cornea aligned such that the incident phase front curvature is matched to the surface curvature upon incidence. The corresponding THz magnitude image is displayed in Figure 1 (c) and serves as a template contrast map indicating ideal alignment. Transverse misalignment is demonstrated in Figure 1 (d) and corresponding THz magnitude image in Figure 1 (e). Substantial differences in spatial contrast are seen and quantitative metrics can be applied to evaluate similarities between the two images thus confirming or rejecting sufficient alignment. In practice, it may be difficult to collocate optimal alignment positions. Furthermore, if the optimal positions are displaced from each other by more than ~1 mm (further discussed in later sections) the optimal MMW system position may correspond to ~ 0 signal (no discernable image) in the THz system due to walk-off losses and degradation in coupling efficiency. Experimentally, the optimal position of the MMW system relies on 3D scans over a very fine (~λ/6) grid and analysis of peak amplitude in the Fourier transformed, time domain traces at each grid point [18, 19]. Thus, a good approach is to find the optimal MMW position and then independently tweak the THz system alignment. This approach is compatible with Figure 1 where, if the polarizer is optically thin at MMW then tip/tilt perturbations to align the THz beam should produce negligible changes in the MMW beam path.
The following sections motivate WR-1.5 (500 GHz – 750 GHz) as a reasonable lower bound on imaging band and compare relevant performance to the WR-3.4 band.
C. Imaging Band motivation: Spot size
The spot size on the cornea should be sufficiently small to provide reasonable pixel count with minimal overlap to generate an image sufficient for pattern recognition. Previous work has shown that placing the corneal center of curvature such that the corneal surface lies beyond the confocal point and in the geometric region of the beam propagation simplifies the optical requirements and renders the optical system broadband [17].
| (1) |
| (2) |
| (3) |
Previous work identified the upper bound on the confocal distance zc in equation (1) which, in turn, defines an upper bound on beam waist formed by the focusing optics [17]. Additionally, the beam waist lower bound, , maintains the paraxial approximation. To compute the relevant spot sizes on target, phase front curvature matching was imposed at the corneal surface. Beams with input waist and were back propagated to identify the axial distance (z0 in equation (2)) corresponding to a beam radius of curvature equal to the corneal radius of curvature (R(z0) = Rs, equation (2)). The computed axial distance z0, was used with the standard Gaussian beam spot size relation (3) to compute approximate beam radius on the cornea denoted as .
Equations (1) – (3) are described in Figure 2(a) and Figure 2(b) for and respectively Figure 2(a) shows the special case where all the diverging beams spot size equal Rs/π at z = − Rs, independent of frequency. Figure 2(b) is the special case where z0 is independent of frequency.
Figure 2.
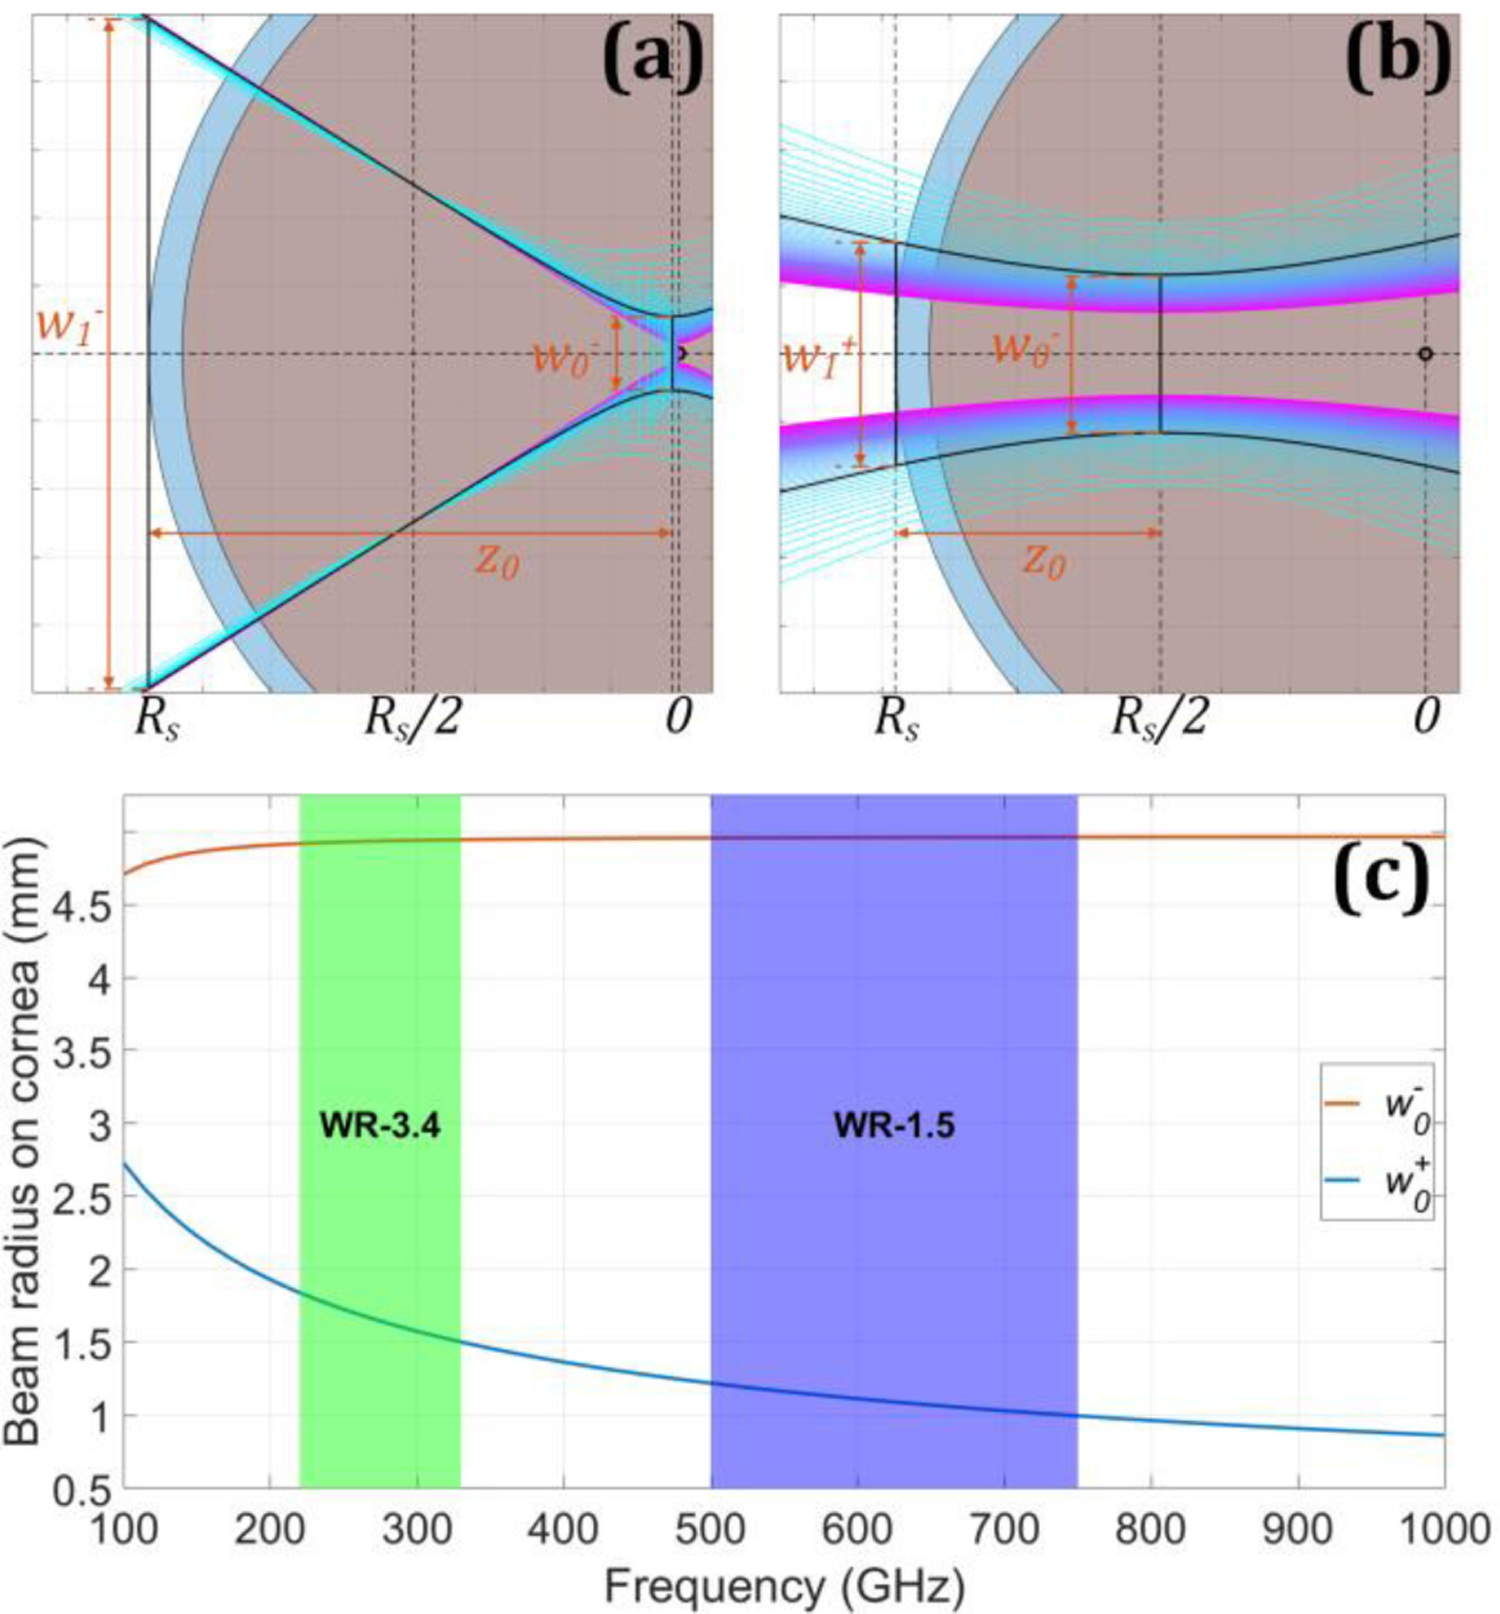
Beam radius on cornea as a function of frequency and parameterized by beam waist radius at the corneal Center of Curvature (CoC). (a) Beam evolution with minimum spot size w0− = λ/2. The spectral components are indicated by the cool color map. The overlaid black trace corresponds to 275 GHz. (b) same as (a) but the input spot is w0+ from equation (2). (c) the resulting spot sizes on the cornea: w0− and w0+
The Gaussian beam is intercepted some distance away from the waist location. This results in larger beam spot size on the cornea for smaller initial waist radii as evidence by the w0− plot in Figure 2(c); a smaller waist corresponds to a larger beam convergence/divergence angle. The spot size on cornea, in the geometric limit, is minimized by maximizing the beam waist radius and thus minimizing divergence angle as demonstrated by the curve in Figure 2. Both curves are superimposed on shaded regions representing the WR-3.4 (220 GHz – 330 GHz) and WR-1.5 (500 GHz – 750 GHz).
D. Imaging Band motivation: limiting tear film influence
Ideally, the corneal should look like a homogenous half space in the THz imaging system operating band. Specifically, the band should be sufficiently high that the corneal-aqueous humor interface is screened by dielectric loss. Further, sensitivity to rapid time varying tear film thickness (due to drying), should be minimized. This constraint ensures that contrast variation across the field of view (FOV) can be attributed, nominally, to alignment/misalignment and the subsequent perturbation to antenna feed coupling.
To assess spectrum, a simple numerical corneal dielectric model was constructed consisting of a 500 μm thick film of protein (40% by volume) and free water (60% by volume). The constituents were “mixed” with Bruggeman effective media theory and sandwiched between a half space of vacuum and 100% water. Finally, a tear film consisting of 100% water was placed between cornea and air with thicknesses of 30 µm, 20 µm, 10 µm, and 1 µm to capture the effects of drying. These layers and their definitions are illustrated in Figure 3(a). The 10-micron step between the largest three values was motivated by the nominal depth resolution of modern anterior segment OCT systems [20] and represent an approximate practical resolution limit. The 1 µm thickness serves as lower bound on in vivo tear film measurements performed with experimental OCT systems [21].
Figure 3.
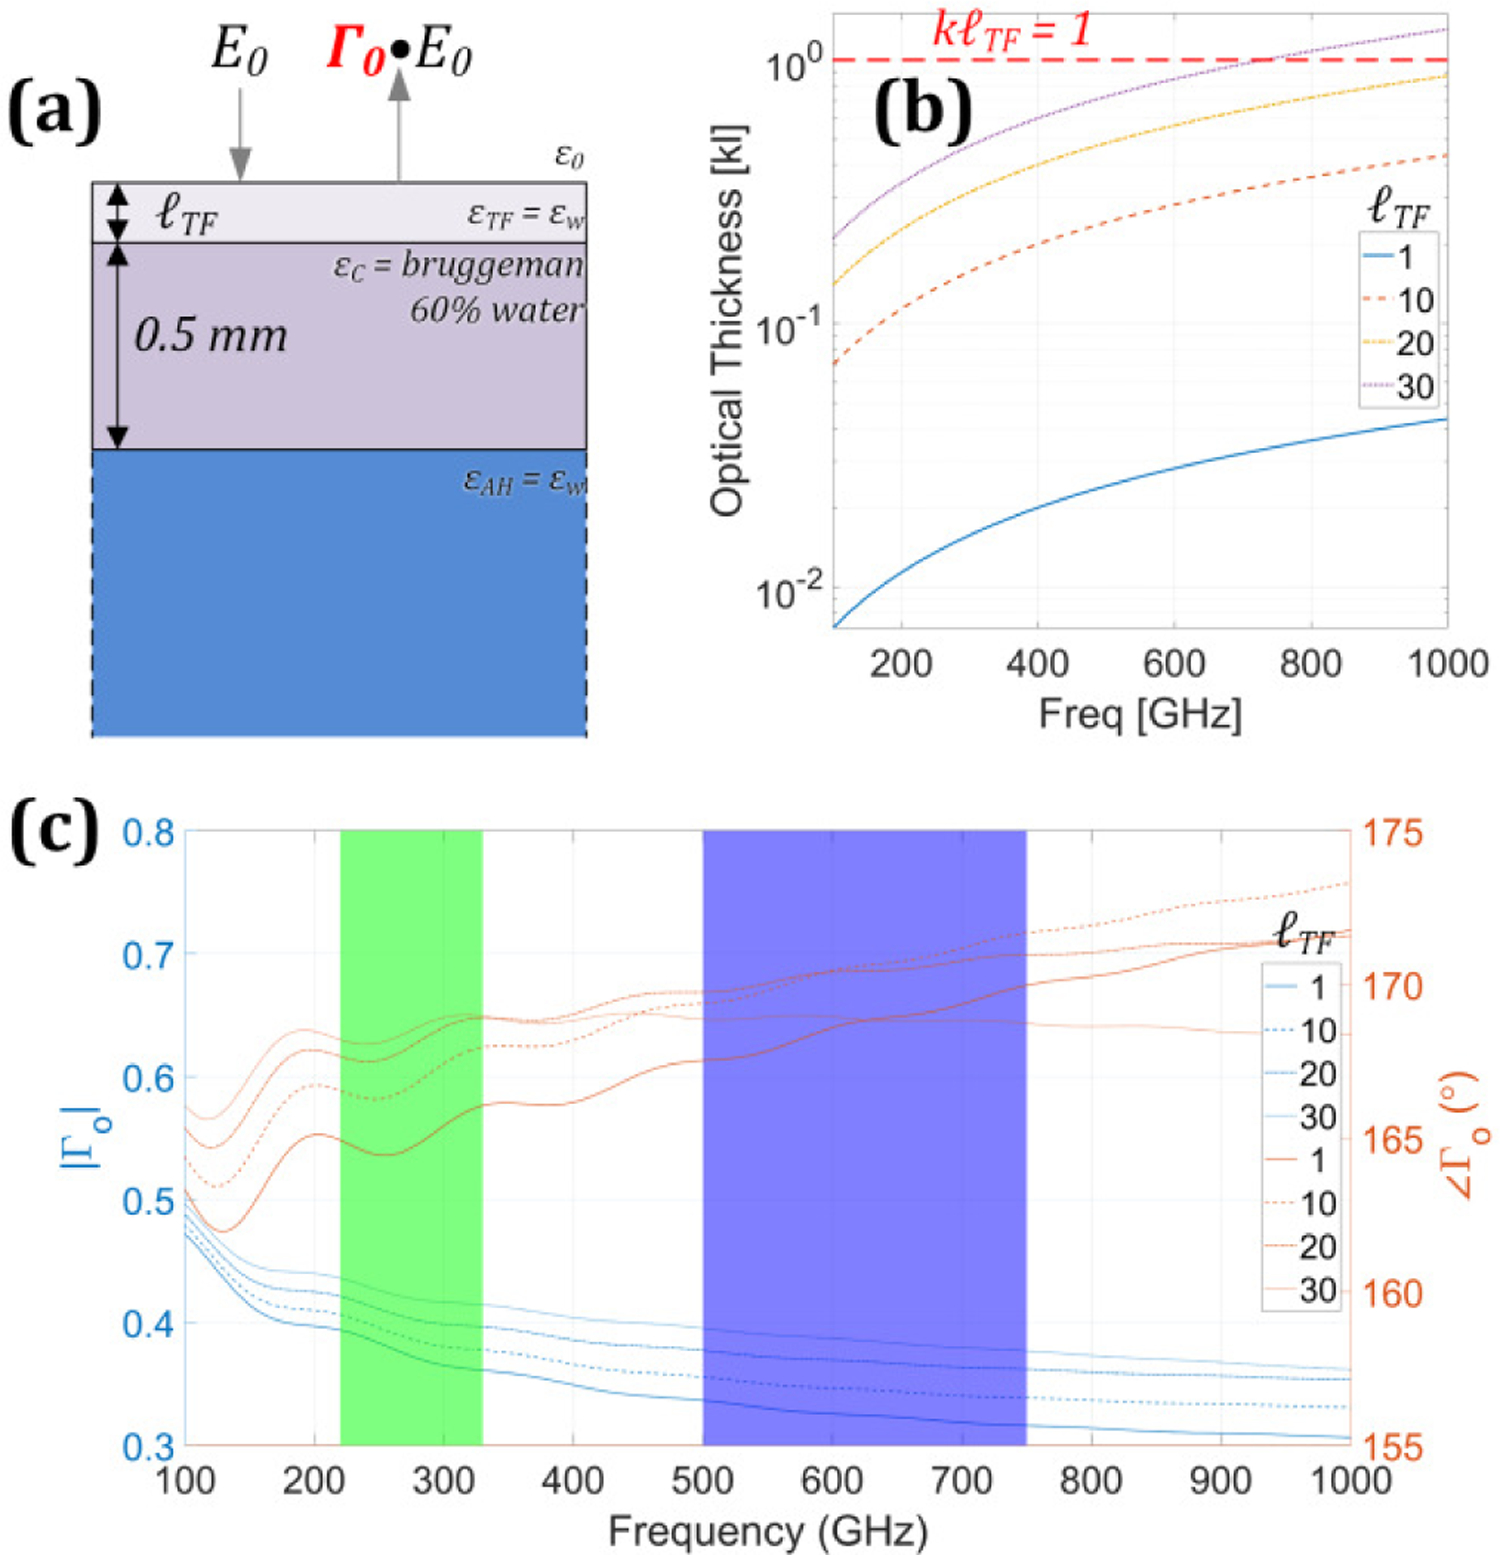
(a) stratified media model for fixed cornea and varying corneal tear film thickness. (b) optical path as a function of frequency, parameterized by tear film thickness. (c) Magnitude (left axis) and phase (right axis) plot of simulated total reflection as a function of frequency, parameterized by tear film thickness.
The dimensionless optical thickness computed as the product of propagation constant (β) and physical thickness (ℓ) is shown in Figure 3(b) and parameterized by tear film thickness. The approximate regime border between thick and thin is indicated by the βℓ = 1 line.
The low frequency undulations (especially in the phase plot in Figure 3(c)) are due to the decrease in dielectric loss as the frequency is decreased and demonstrate the lossy longitudinal modes of the corneal cavity that can be leveraged for corneal spectroscopy [4, 17]. Conversely, peak locations and amplitudes are affected by tear film, thickness and thus time varying tear film is a confounder to both spectroscopy and alignment sensitivity.
The interplay between optical thickness and loss is evident in the spectra. As the frequency is increased, the tear film layer optical thickness and dielectric loss increase in kind. The WR-1.5 band serves as a tradeoff region where even the thick tear film (~ 30 μm) is still optically thin but the dielectric loss is sufficiently high that the tear film/cornea interface is screened. Thus, for the tear film thicknesses considered, imaging contrast in this band can be primarily attributed to geometry, its match/mismatch to the illumination phase front, and its effects on coupling efficiency.
III. Imaging system design
The beam scanning mechanism is displayed in Figure 4. This design is similar to laser scanning microscopy (e.g. confocal microscopy, optical coherence tomography) which typically employ galvanometric or resonance mirrors to transform translation in the angular domain at some intermediary plane to transverse, planar translation at the imaging plane.
Figure 4.
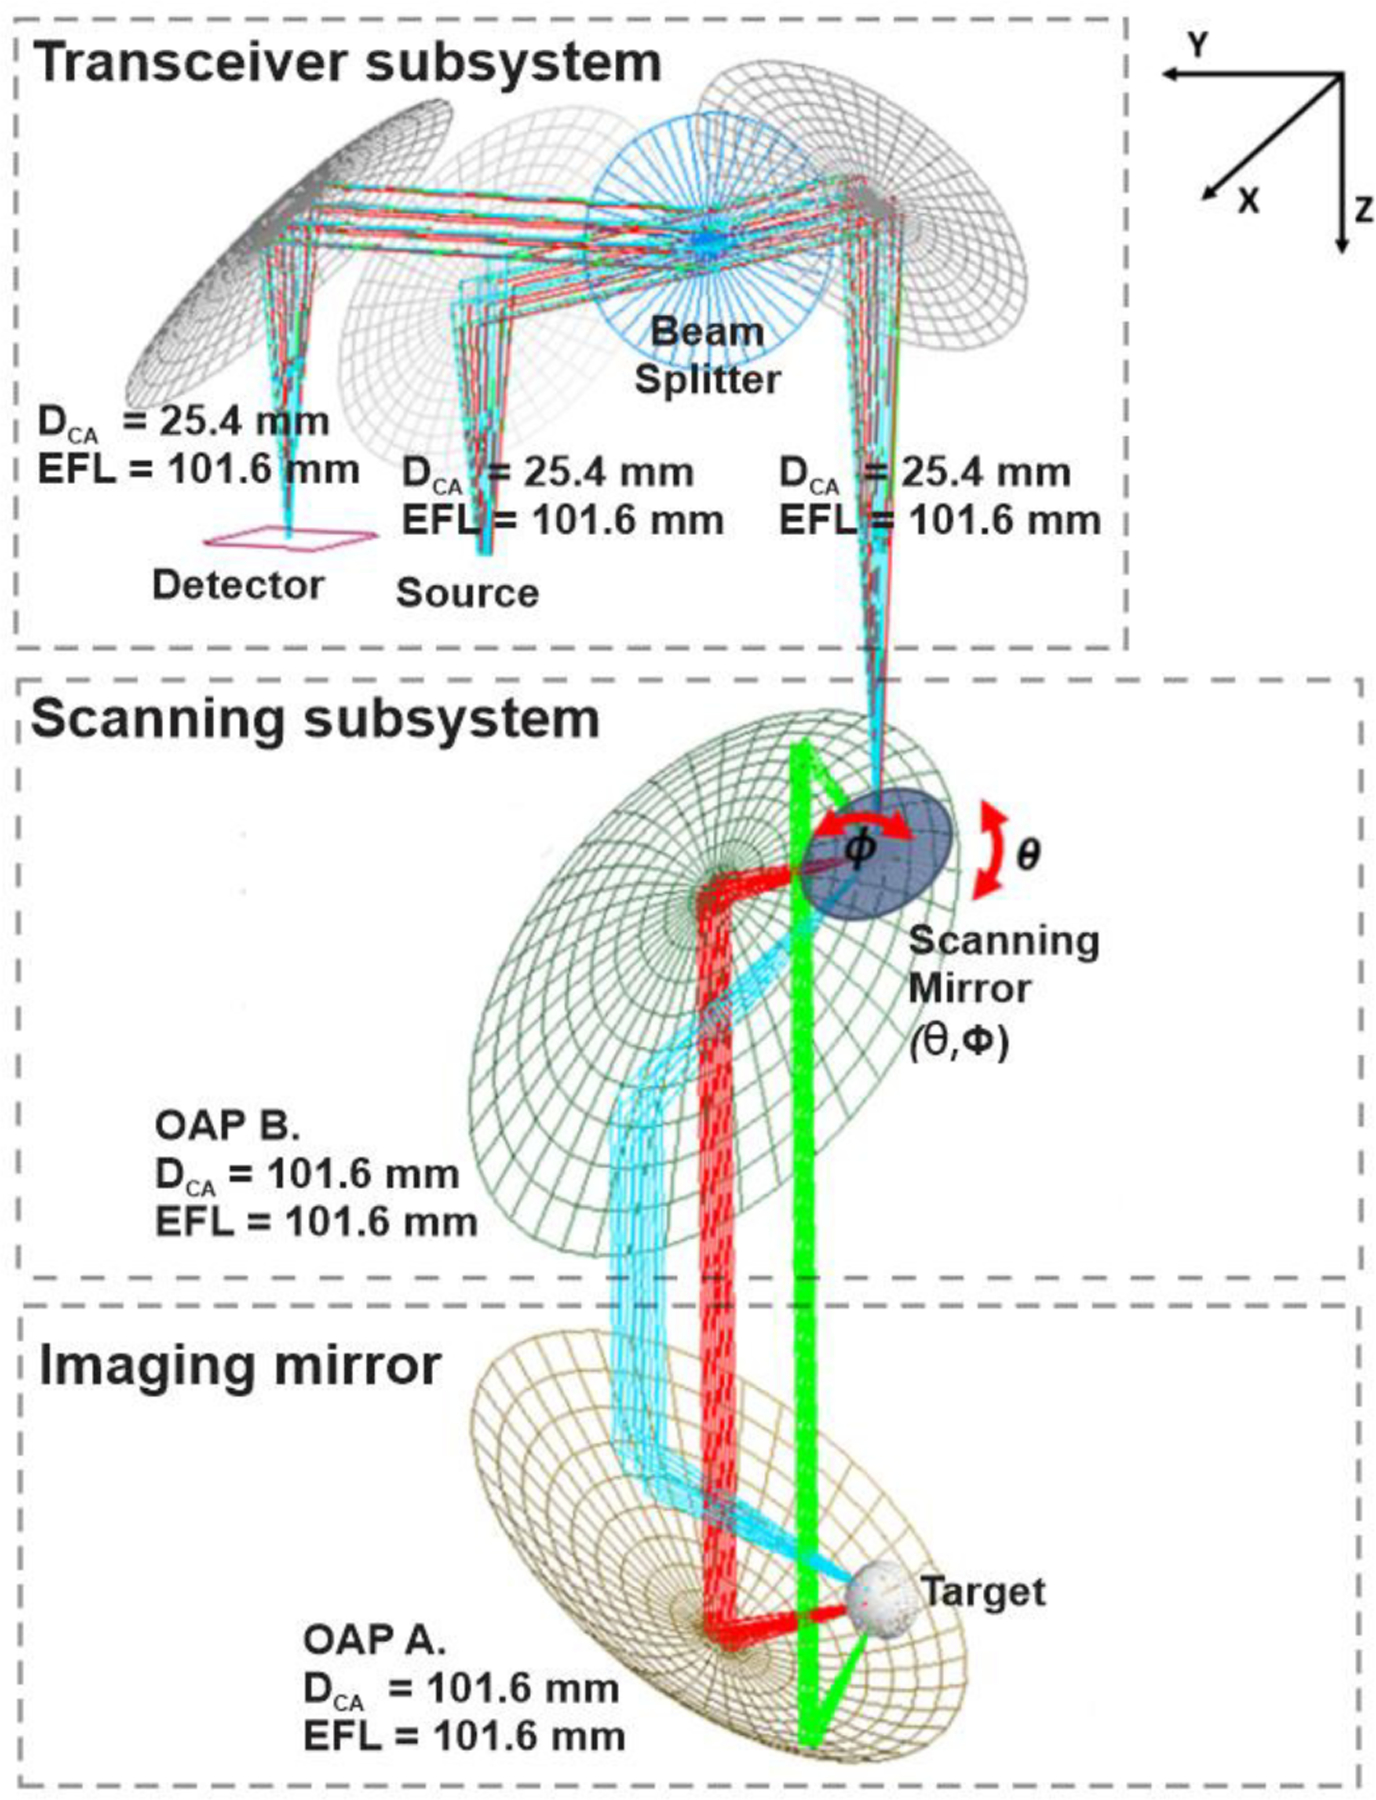
Double mirror, angular scanning imaging system design. The input beam is steered by the (θ, ϕ) scanning mirror. Three θ angle scan locations are plotted.
Standard optical system design decouple the azimuthal and elevation scan directions to separate planar mirrors whose axes are mutually orthogonal [22]. Due to the comparatively short confocal distances (zc) at the design wavelength the system was designed with a single gimbal-mirror-like optical translation where rotational motion is about the center point of the mirror surface.
There are two key improvements over previous work [1, 2] which used rectilinear translate of two plane mirrors to scan a the clear aperture of a single large OAP mirror. (1) Angular scanning at moderate speeds can produce rapid transverse translation in the collimated beam path and the total image acquisition time is greatly reduced compared rectilinear scanning [1, 2]. (2) The collimated beam diameter is a function of scanning angle resulting in a partial optimization of beam parameters with respect to the spot size on target. In previous designs [1], larger beam diameters at the far edge of the OAP minimized the spot size while smaller beam diameters at the near edge of the OAP minimized the spot size [1, 2]. This behavior is illustrated by ray paths in Figure 5 (a).
Figure 5.
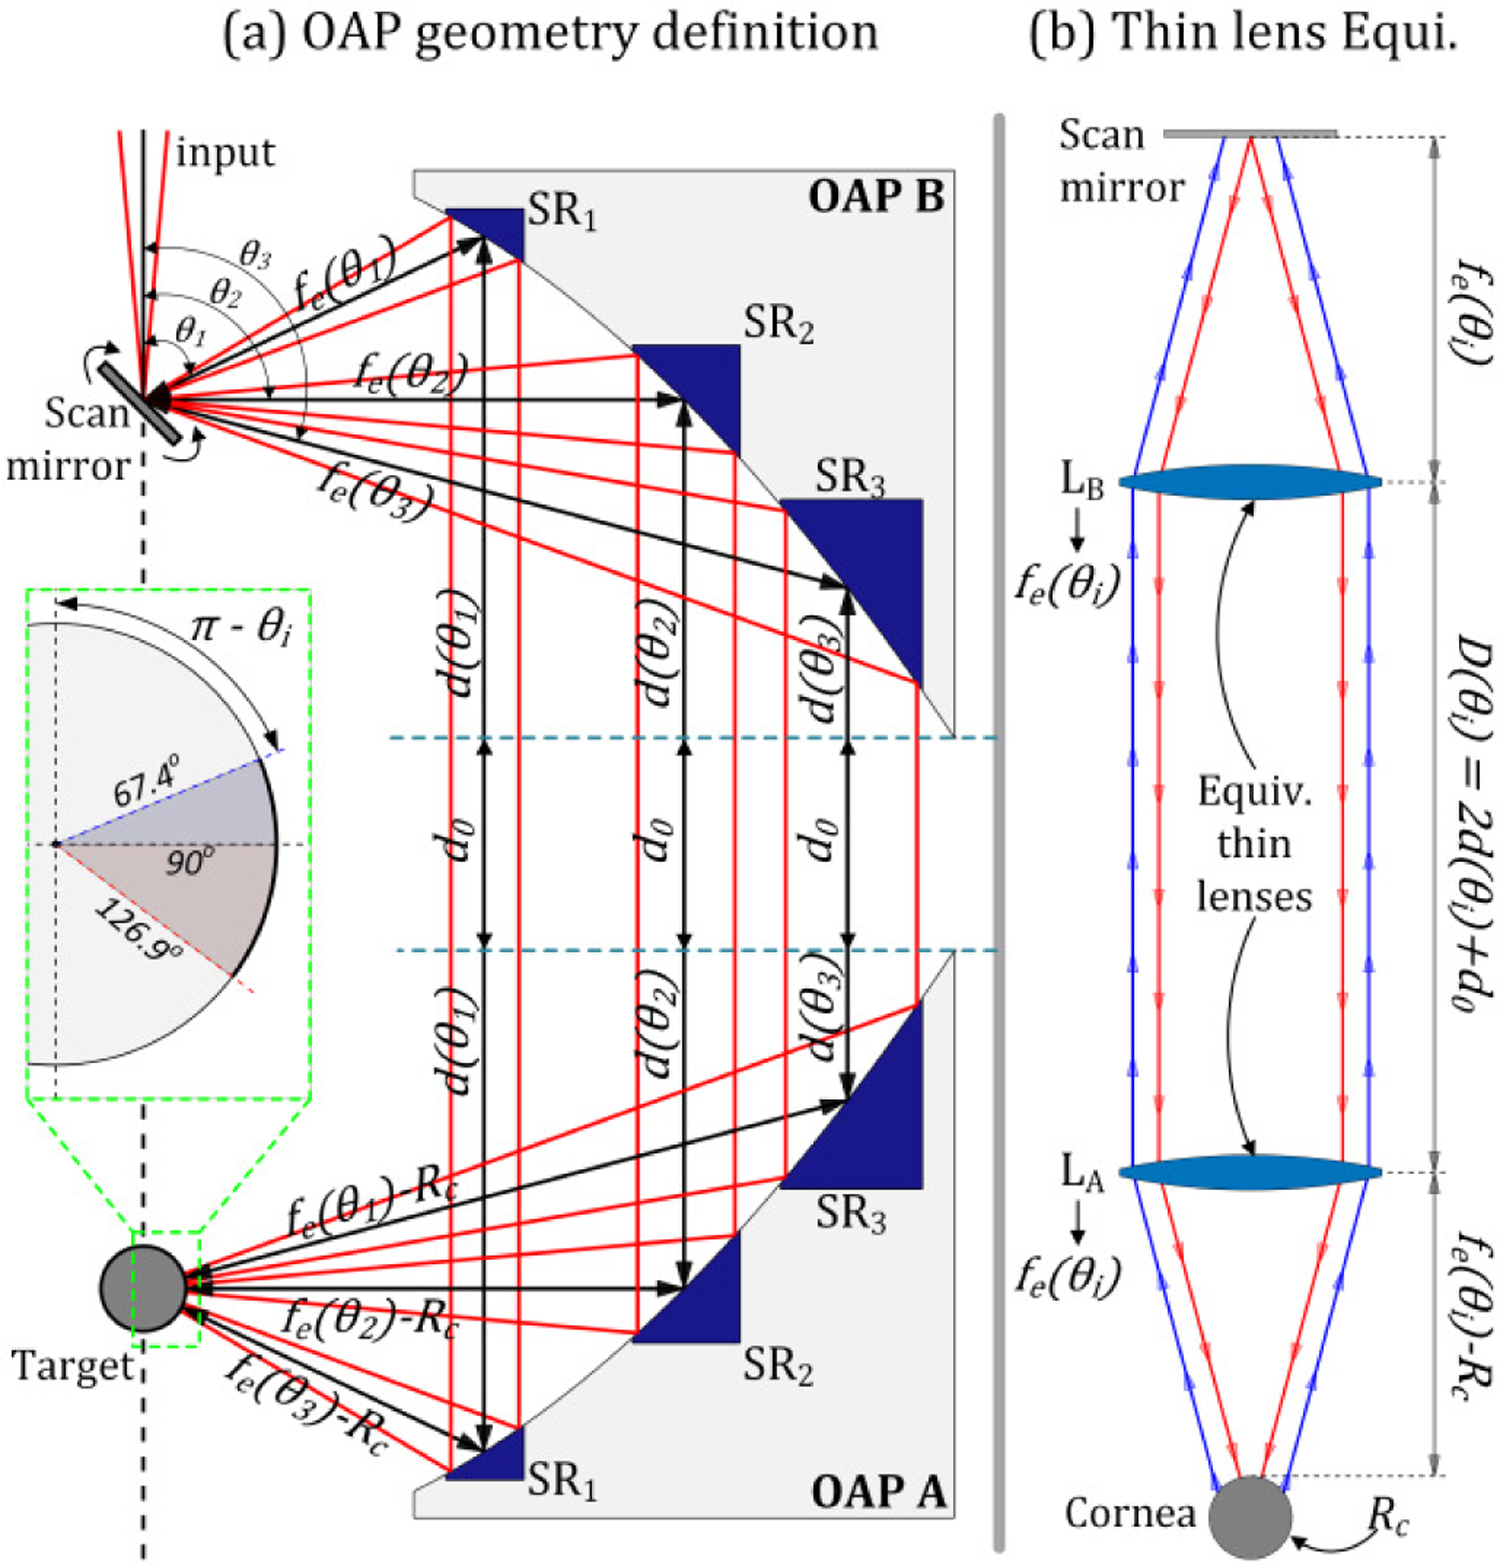
Ray path diagram of the imaging system. (a) Parabolic mirror segmentation and (b) thin lens equivalent of the overall beam path
A. ABCD matrix analysis of mirror separation and feed directivity
ABCD matrix analysis was performed to estimate the effects of varying collimated beam path length and feed horn directivity on beam radius and coupling efficiency. The beam waist radius in the initial complex beam parameter was set equal to the feed horn beam waist. The quasioptical setup and problem definition for the angularly scanned system are displayed in Figure 5 (a) and (b) respectively. The mirror front surface centroid is coincident with the focal point of OAP A and the cornea center of curvature (CoC) is coincident with the focal point of OAP B. The beam angle theta is defined with respect to the z-axis (standard spherical coordinates).
The beam travels a free space path length from the galvanometric mirror to OAP mirror A. This path length is angle dependent and equal to the effective focal length of the lens; fe(θ), equation (4). The collimated beam path length is partitioned into three sections. The first section is the distance between the beam centroid and the tip of the OAP mirror; d(θ), equation (5). The second distance is an arbitrary distance d0 between the two OAP mirror tips. The third section is equivalent to the first section, d(θ). The total distance D is given in equation (6). Finally, the beam travels a free space length to the cornea which is given fe(θ)-Rc where Rc is the corneal radius of curvature. Equations (4) – (6) are written in terms of mirror clear aperture A, mirror parent focal length fp, and the angle that the diverging beam centroid makes with the z-axis θ.
| (4) |
| (5) |
| (6) |
The equivalent quasioptical setup in terms of ABCD matrices, is described by the right side of Figure 5 where the mirror segment subtended by the beam and pierced by the beam centroid is represented by an equivalent thin lens of focal length fe(θ). The diverging beam travels free space path fe(θ), is collimated by a lens of focal length fe(θ), travels free space path length D(θ), is focused by another lens of focal length fe(θ), and then travels fe(θ)-Rc to the cornea. The beam then retraces its path back to the reference plane. This path is described by 2×2 matrix multiplication of path from plane-to-cornea (MP→C, Equation (7)), reflection from the cornea (MC, Equation (9)), and the reverse path back to the reference plane (MC→P, Equation (8)). The theta dependence of the parameters in Equations (7)– (9) has been suppressed for brevity and the equations for MP→C and MC→P, further delineated into M1, M2, and M3 for clarity.
| (7) |
| (8) |
| (9) |
Equations (4) – (9) enable estimation of the scanning system performance parameterized by OAP separation distance d0, and source directivity. Two key parameters are of interest in evaluating imaging system performance. The first is the effect of varying collimated path length D(θ=90°). The canonical, Gaussian beam telescope separation is D(θ=90°) = 2fe although the range may be constrained by the mmW system optics, wire grid polarizer, etc. The second parameter is antenna directivity which is utilized in this work via effective beam waist radius.
Three separation distances were evaluated and defined by the path length of the centroid at θ = 90°; d0 = 0 st. D(90°) = 1.3fe, d0 st. D(90°) = 2.0fe, and d0 st. D(90°) = 3.0fe. The 1.3fe corresponds to d0 = 0 and 2fe is the Gaussian beam telescope separation distance. In addition to free space path length, two different beam waist sizes were w0 = 0.66 mm and w0 = 0.99 mm corresponding to the 12° and 10° diagonal feedhorn gains respectively which are commercially available from the source supplier. The results are denoted by the dashed line style in Figure 6 and are labeled Geometric Optics (GO).
Figure 6.

ABCD matrix estimates of optical parameters as a function of angle, parameterized by collimated path length and feedhorn directivity. (a) 1/e beam radius on the corneal surface. (b) Beam waist ratio between the illumination beam at OAP B and the scattered, collected beam along the retrodirective path at OAP B. (c) Coupling efficiency. The dashed line style indicates ABCD (GO) matrix computations and the solid line style indicates PO results. The collimated path length is in units of effective focal length computed with equation (4) → fe(θ = 90°)
B. Physical Optics (PO) Analysis of scanning system
Physical Optics were also used to simulate and analyze scanning and beam propagation using the same approach as [1, 2]. The analysis was performed with both GRASP (TICRA, Copenhagen, Denmark) and inhouse codes. Beam radii were computed via the 1/e envelope of the fields to account for spatial variation due to diffraction. The coupling efficiencies were computed with
| (10) |
where K is the power coupling coefficient, Ei is the incident electric field, defined at the source plane, and Er is the reference electric field that is focused back at the source plane. The reference electric field was a linearly polarized Gaussian beam with a beam waist identical to the source feed.
C. Results
The ABCD parametric analysis results are shown in Figure 6 where the x-axis corresponds to the angular position on cornea. The curves plotted in a dotted line style and are labeled by their corresponding collimated path length. The system matrixes used to compute the curves are displayed in the boxed inset. The curves are grouped into the w0 = 0.66 mm and w0 = 0.99 mm horn triplets. The corresponding PO results are superimposed with a solid line style and a colormap shared with the ABCD matrix results.
Figure 6 (a) reports the spot size on cornea and shows a monotonic, positive trend for increasing theta. The increased spread and decreased spot size in of w0 = 0.99 mm curves, as compared to the w0 = 0.66 mm curves indicate that the resulting beam waists from the w0 = 0.99 mm horn are significantly closer to the corneal surface. The PO results demonstrate excellent agreement with the GO results for the w0 = 0.66 horn across an ~ 84° – 105° scan range. Similarly, the w0 = 0.99 mm horn and ABCD matrix analysis agree well over an ~ 83° – 112° range where the increased range is due to a smaller beam radius incident on the first mirror.
The final spot size on OAP B (M2M3MCMP→C) referenced top the initial spot size (M1) was computed to explore aperture spill over due to the optical path and the results are shown in Figure 6(b). The lower directivity horn displays limited beam walk-off while the high directivity beam demonstrates significant spill over at the mirror near edge, even for short path length 1.3fe.
Figure 6 (c) reports the overall coupling from scan mirror, to cornea, back to scan mirror and gives an indication of expected image contrast due to angular dependent coupling coefficient. The lower directivity horn produces superior coupling efficiency for any angle and collimated path length, while the higher directivity horn produces a greater variation in coupling across the scan angle.
The PO results confirm a usable scan range of ~ 84 – 105 degrees depending on the mirror and horn configurations. Additionally, both analysis types indicate that, while beam propagation is affected by the collimated path length between the OAPs mirrors, this path length has limited effect on coupling efficiency under ideal alignment conditions. While the less directive horn (w0 = 0.66) offers superior coupling efficiency and a reduced ratio of input to output beam waist (spillover), the efficiency differs by less than a factor of 2 so the SNR degradation is manageable. The more directive horn (w0 = 0.99) produces a smaller spot size on target and larger FOV yielding an increase in unique pixels with which to create the aligned case image. (Visualization of PO computed beam propagation is shown in Appendix A.). The larger FOV of the w0 = 0.99 antenna is attributed to the reduced beam radius at the first mirror owning to the decreased spread.
IV. Experimental Imaging System
A. System
A prototype system, with the optical layout in Figure 4 and block diagram in Figure 7 was constructed.
Figure 7.
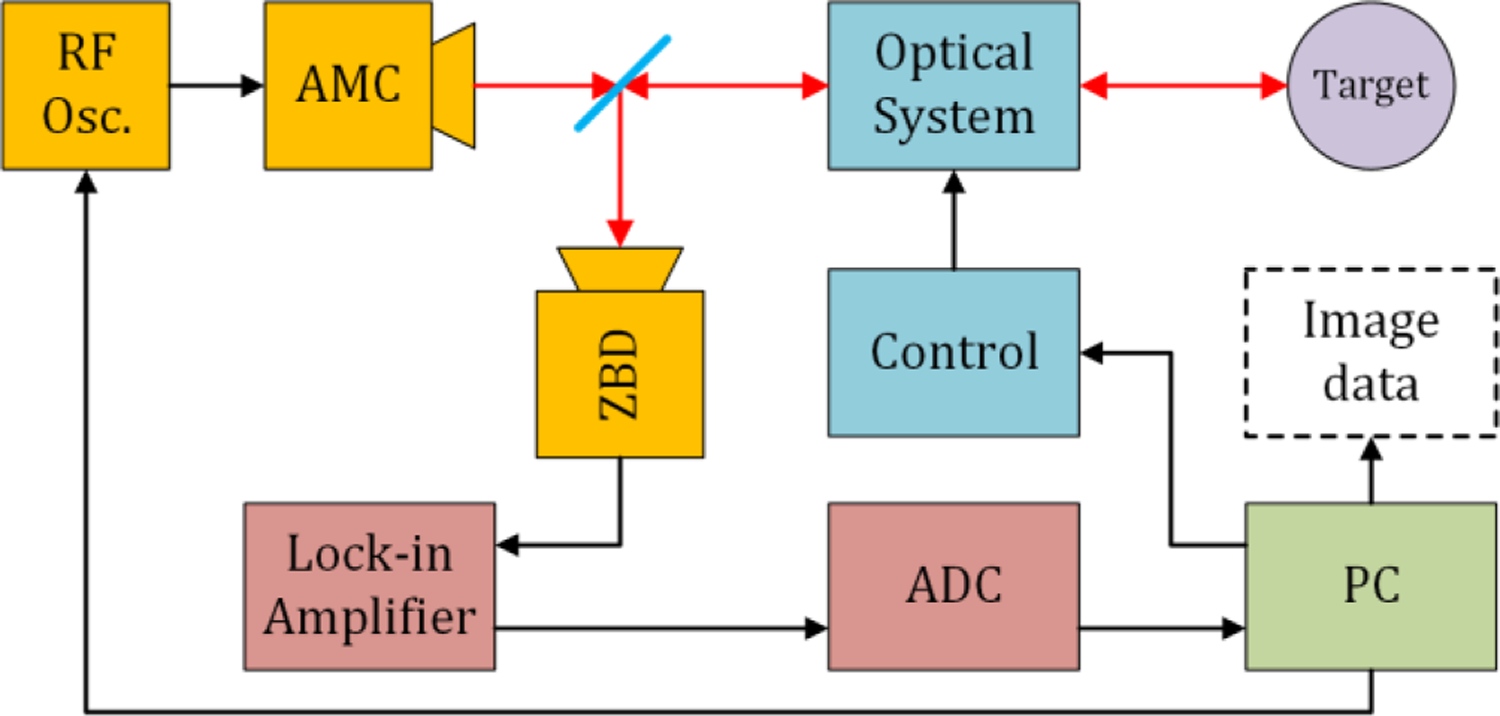
System block diagram
An Amplifier-Multiple Chain (AMC) (Virginia Diodes, VA) and a WR1.5 wave-guide mounted zero biased Schottky diode (ZBD) (Virginia Diodes, VA) were used as THz source and detector. The main properties are as shown in the figure. To get rid of the possible standing waves in the measurement, the source is frequency modulated over ~500 MHz, providing a wide enough bandwidth to cancel the etalon effect of the whole optical path, at a rate of 100 kHz. The source is also amplitude modulated with the TTL output from the lock-in amplifier (LIA) at a frequency of 950 Hz and the detection signal was fed to the LIA, demodulated, low-pass filtered and acquired using a LabJack U6 ADC, with a resolution of 16 bits (± 1V) at sample rate of 2000 samples/s. Both the source and detector were coupled to 26 dB gain pyramidal horns and the total source power was ~ − 1 dBm.
A CAD design of the system is shown in Figure 8(a) and is based on the optics design in Figure 4. The source ① is coupled to the galvanometric scan mirror ④ via the 50.8 mm clear aperture OAP mirror pair labeled ②. The 101.6 mm clear aperture OAP pair labeled ⑤, combined with the scan mirror performs the imaging. A Mylar beam splitter ③ and third 50.8 mm clear aperture OAP mirror focuses the reflected, collected radiation to the feedhorn of a zero-bias Schottky diode detector ⑨ mounted to a 3-axis stage ⑧. Test targets ⑥ are mounted to a 3-axis stage ⑧ and this assembly is rigidly attached to the 101.6 mm OAP mirror mount to simplify alignment. An image of the assembled system is shown in Figure 8(b). Two RSW60C-E03T3 rotary stages connected to a X-MCB2 (Zaber Technologies Inc.), were used as the motion actuator of the rotating mirror.
Figure 8.
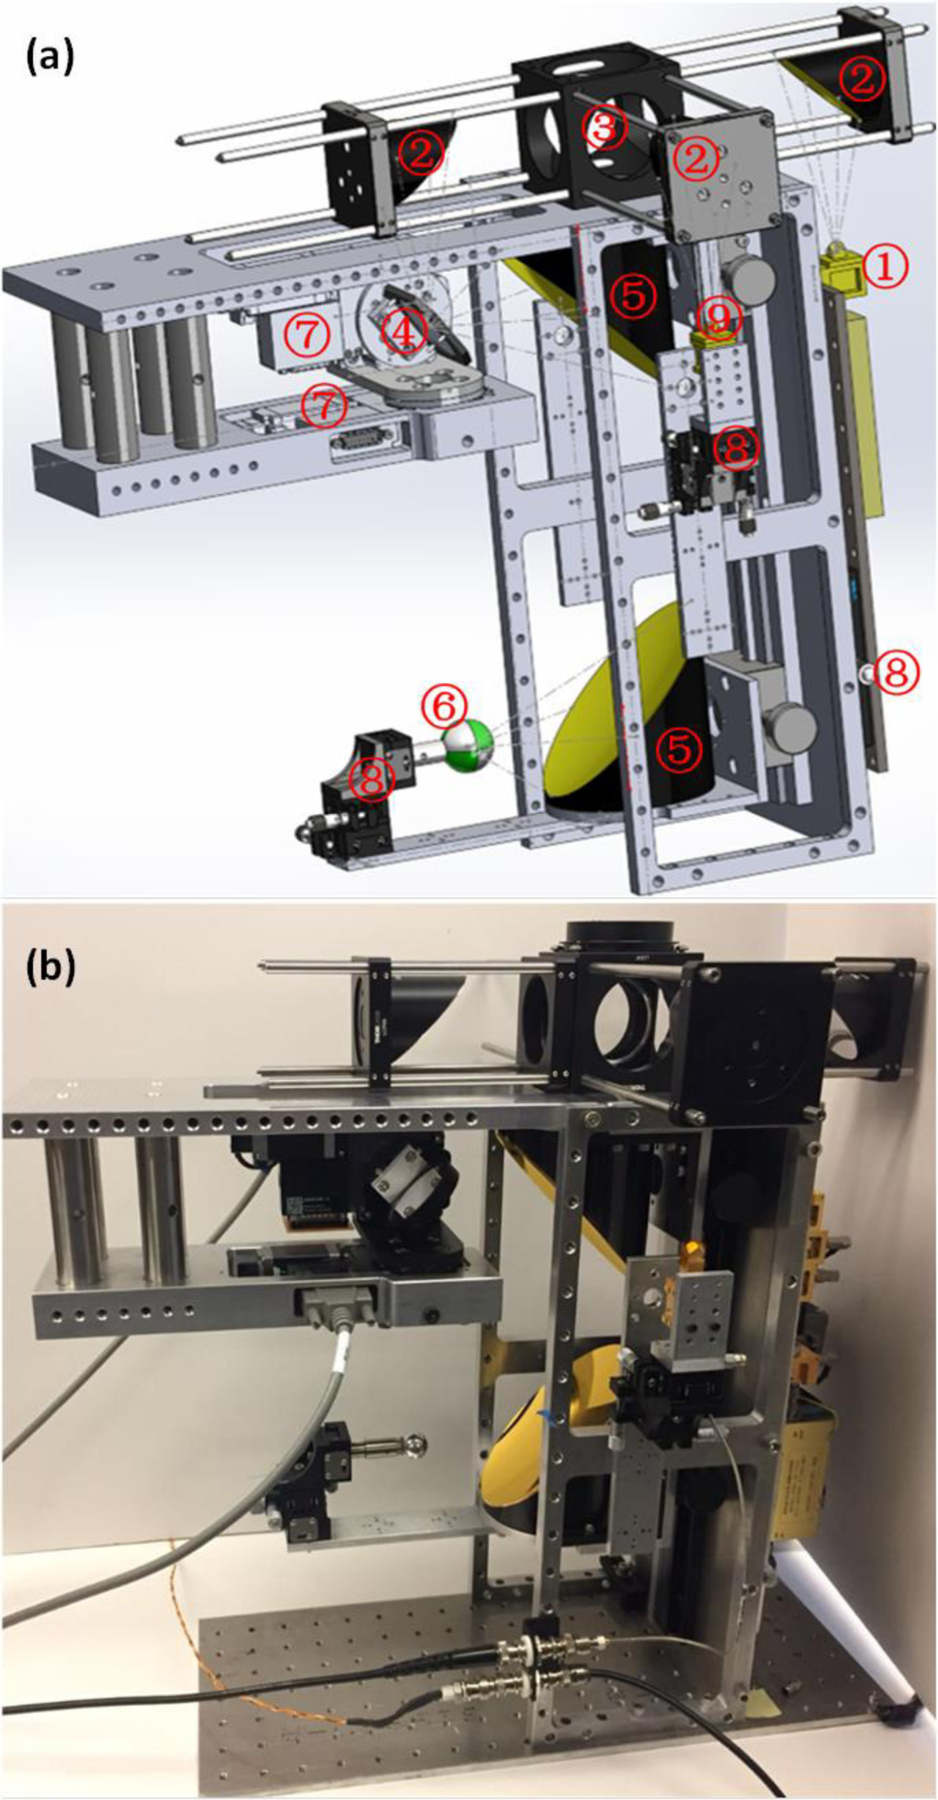
(a) SolidWorks model of the optical system, where: ① THz Source, ② 50.8 mm clear aperture OAPs, ③ beam splitter, ④ scanning mirror, ⑤ 101.6 mm clear aperture OAPs, ⑥ target ball, ⑦ rotary step motor, ⑧ 3-axis translational stage, ⑨ detector. (b) Constructed system.
B. Reference target imaging results
Reference targets were imaged by the system to confirm operation and sufficient spot size on target for the displaced target imaging experiments. A visible image of a brass, 3/8” = 9.525 mm RoC sphere is shown in Figure 9(a) and the corresponding THz image in Figure 9 (e). The THz reflectivity demonstrates good symmetry about the vertical axis and the contrast variation from bottom to top of the FOV is consistent with the decreasing signal for increased increasing mirror scanning angle predicted by the ABCD Gaussian beam analysis in Section III.
Figure 9.
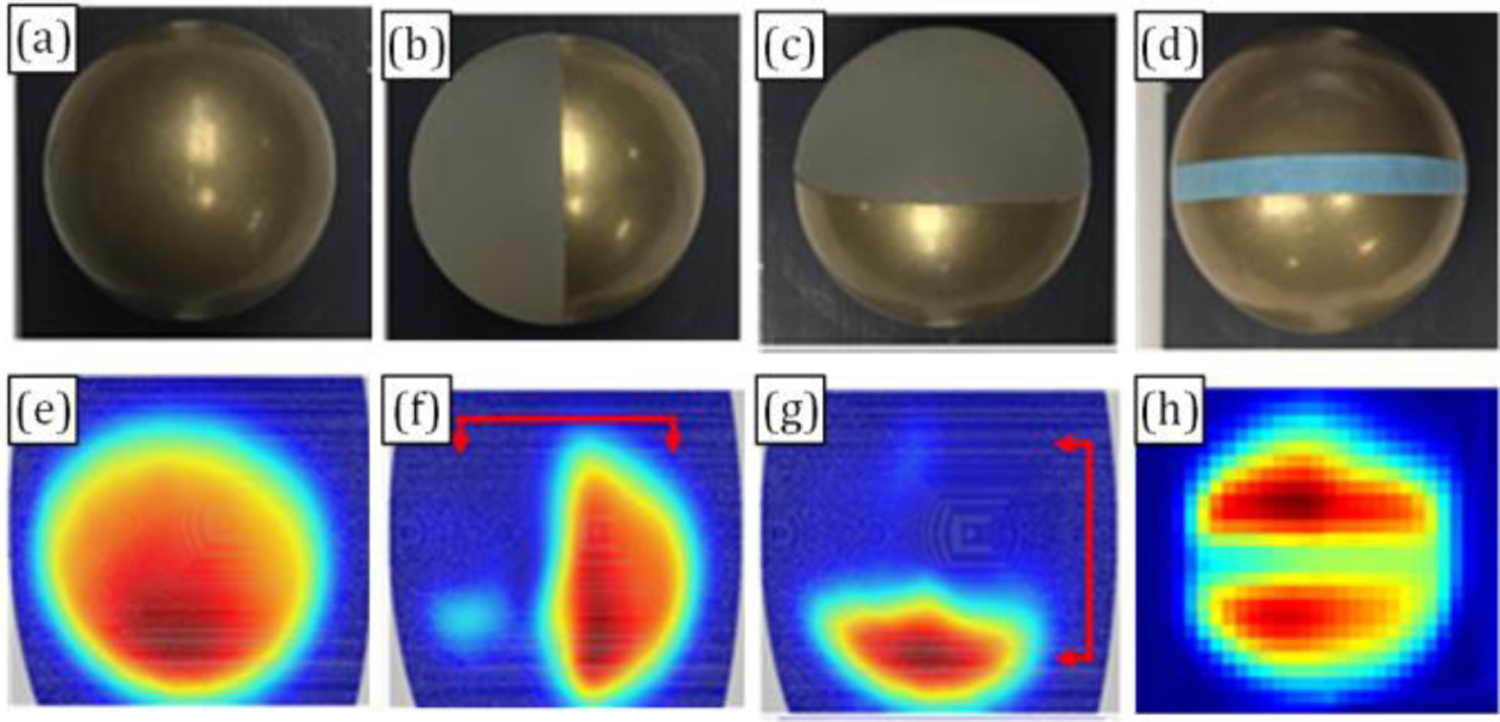
Imaging of brass ball. (a) bare brass ball imaging for coupling efficiency verification; (b) dielectric/brass hemispherical step response target with vertically oriented material interface. (c) step response target with horizontally oriented interface. (d) 2 mm wide tape adhered to brass sphere target. (e) – (h) THz images of (a) – (d) respectively
Step response spherical targets consisting of brass and dielectric hemispheres were imaged in different orientations to assess spot size on target. Visible images of the target in two orthogonal orientations are displayed in Figure 9(b) and Figure 9(c) with corresponding THz images in Figure 9(f) and Figure 9(g) respectively. Analysis of step response contrast using methods presented previously [1] returned a 1/e radius of ~ 2 mm which is ~ 0.5 mm larger than that predicted from GB theory.
Finally, a 2 mm wide dielectric tape was applied to the brass spere and imaged with the THz imaging system. A visible image indicating strip orientation and corresponding THz image are shown in Figure 9(d) and Figure 9(h) respectively.
C. Corneal Phantom
A corneal phantom (soft contact lens 31% nelfilcon A, 69% water in isotonic phosphate-acetate buffered saline) with plastic background was imaged to explore the water content imaging capability of the system. The contact lens taken directly from the solution was positioned on the polypropylene ball, the solution was left to evaporate under lab environment and images were acquired using our THz system.
In Figure 10, (a) is the visible image of the target, a contact lens attached to a polypropylene ball, with radii of curvature of 3/8” = 9.525 mm; (b) is the THz image immediately taken after the contact lens was attached to the ball, perfectly tight; in figure (c), a bubble was intentionally left in the center area between the contact lens and the polypropylene ball, the ring-shape image very well reflected the existence of the bubble; figure (d) was taken 3 min after (c) was taken. Comparing (c) and (d), we noticed the shift of the red color, which matches the possible migration of the water under the influence of gravity.
Figure 10.

Imaging of corneal phantom. (a) visual image of the phantom; (b)THz image of phantom obtained immediately after being mounted in the system. (c) THz image a of phantom with an air bubble between phantom and dielectric, right after mounting. (d) Image of trapped air bubble phantom acquired ~3 minutes after the image in (c)
V. Simulation and Imaging of a Displaced Reference Reflector
A. Geometry and experimental data acquisition
The relevant geometry for simulation and experiments is displayed in Figure 11 which shows a wire mesh of the final OAP focusing surface and a wire mesh of the spherical reflector. The OAP focal point and corneal CoC are collocated at the origin of the local axis (x’, y’, z’) = (0, 0, 0).
Figure 11.
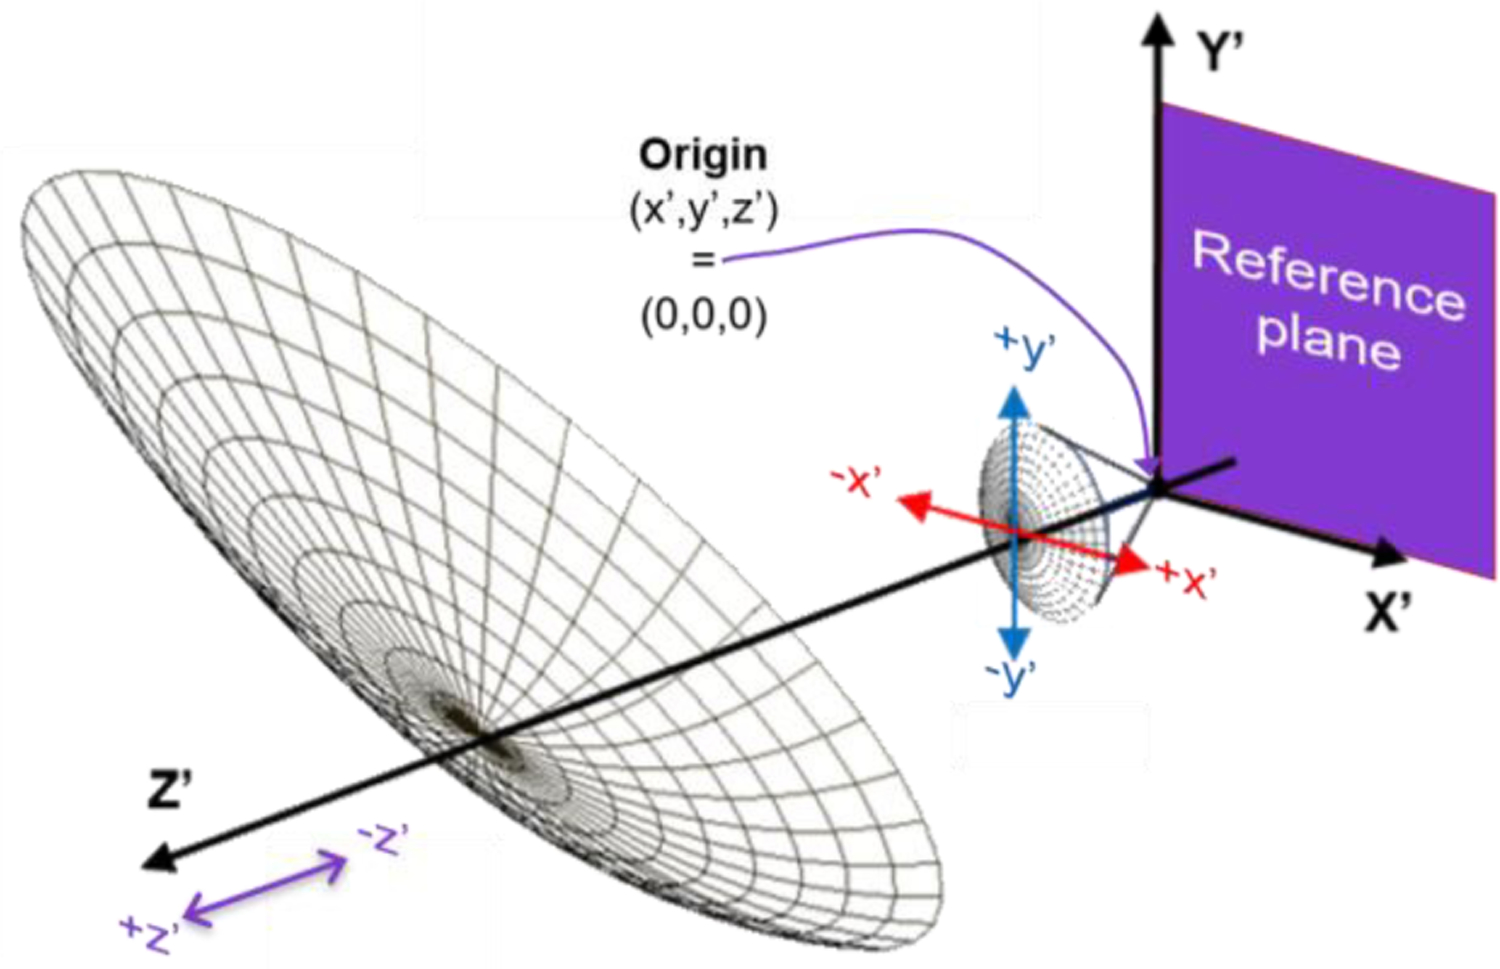
Geometry and positioning of the imaging OAP and the spherical reference reflector. The local coordinates of these elements are described by (x’, y’, z’). Directions oriented to obey the right hand rule. z’ = 0 indicates no axial displacement from the ideal aligned case.
Images in both the simulation and experiment were acquired at all combinations of x’ = 0, ± 0.5, y’=0, ± 0.5 and z’ = 0, ± 0.5 displacements for a total of 27 reflector positions that span a 1 mm x 1 mm x 1 mm cube. The positions and directions, relative to the mirror and sample geometry, are denoted in Figure 11 and follow the right-hand rule. 650 GHz corresponds to a free space wavelength of 0.461 mm. However, displacements of 0.5 mm were selected because they were straightforward to implement experimentally with the manual micrometer in the assembled system. Experimental results confirmed that target displacements beyond ~ 1 mm in the transverse direction corresponded with insufficient SNR for image formation thus simulations were limited to a maximum displacement of 1 mm.
B. Geometric Optics
Nonsequential ray tracing was performed with ASAP (Breault Research Organization). The source was an emitting disk with a radius of 1 mm and emitting with half angle of 10 degrees at a wavelength of 0.461 mm (650 GHz). 65 × 65 = 4225 mirror positions were simulated by varying the galvanometric mirror angle with 1-degree steps so that θ ∈ [50°,114°] [−40°,24°], ϕ ∈ [−32°,32°], which reflects the scanning area and steps of the imager. The 5 mm x 5 mm detector plane was partitioned into 101 × 101 = 10,201 pixels and used to create intensity maps of scattered, collected radiation as a function of scanning mirror position. Beam distortion was analyzed and then these maps were spatially integrated to form a total collected flux for each (θ, ϕ) pair. Intensity maps as a function (θ, ϕ) were generated for each of the 27 target locations discussed in section V.A.
Collected beam rays at the detector plane, for 9 different mirror positions, centered about the point (θ, φ) = (90°,0°), are shown in Figure 12(a). These images were generated when the reference reflector was located in the (x’,y’,z’) = (0,0,0) position. Figure 12(b) shows an expanded map of the (θ, φ) = (90°,0°) and demonstrates significant beam distortion, even for the on-axis, aligned case. The beam distortion is due to the finite (non-zero) extent of the source. When a source with a non-zero width is reflected by the spherical target, the reflected beams are no longer colinear with the illumination beams. Further the angle between the reflected beams and the OAP mirror surface normal is not radially symmetric about the beam centroid since the mirror is off-axis. This creates the beam distortion and results in the smearing of energy seen outside the source image perimeter as indicated by the white circle. The total collected contrast map for the (x’,y’,z’) = (0,0,0) position is displayed in Figure 12(c) with the θ = 90°, φ = 0° axes labeled. The pixel lying at the intersection of these axes is denoted by a black circle and was computed by integrating the total intensity in Figure 12(b).
Figure 12.
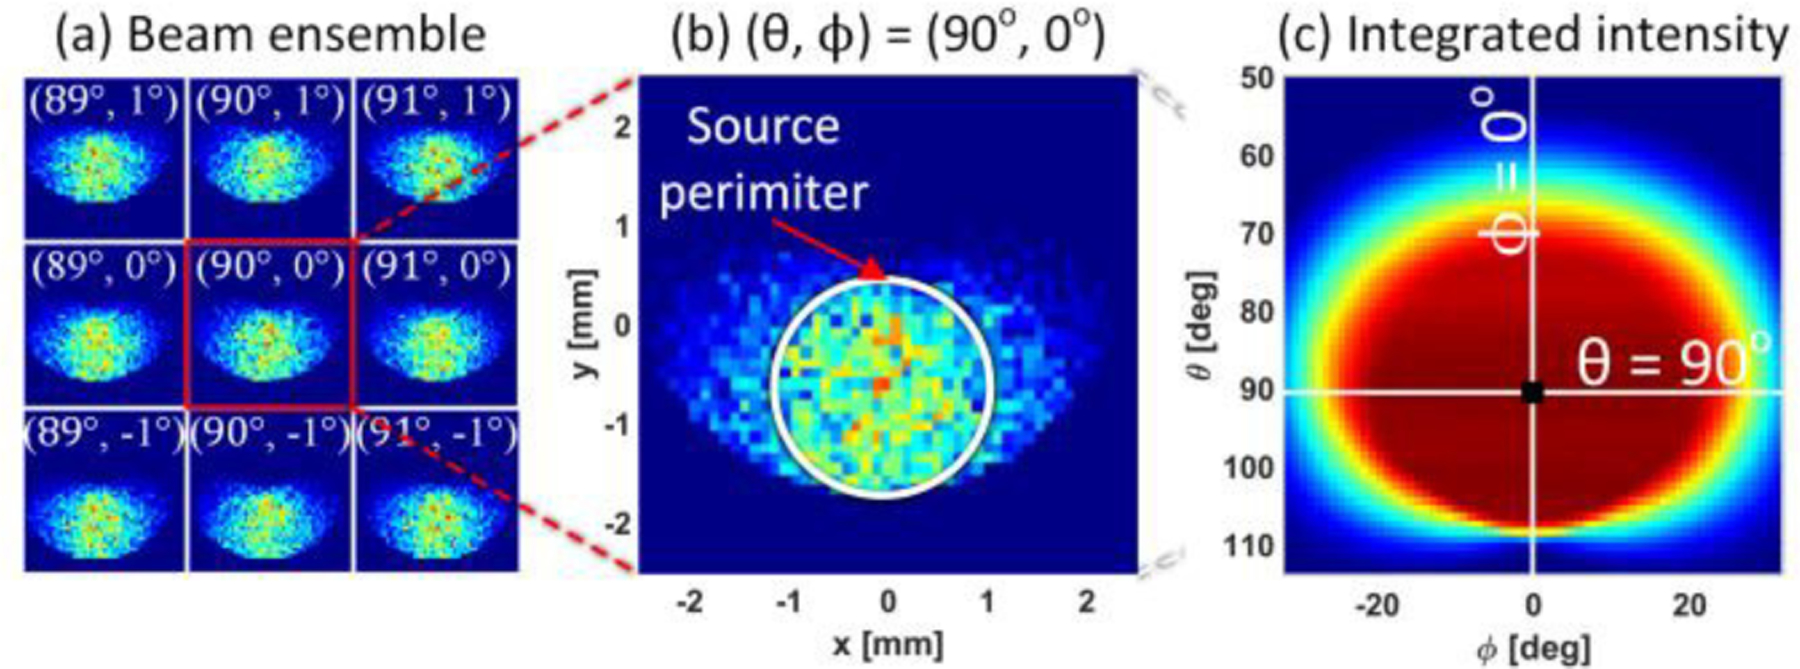
Rays were routed from a circular emitting aperture to a 5 mm x 5 mm detector plane for all 4225 scanning mirror positions and 27 different reference reflector positions. (a) Intensity at the detector plane for 9 different scanning mirror positions (θ,ϕ) centered about the OAP focal axis and for a reference reflector at the (x’, y’, z’) = (0, 0, 0) position. (b) Expanded view of the (θ, ϕ) = (90°, 0°) position demonstrating beam smearing (c) Reflectivity image made by summing intensities at each mirror position.
C. Displaced target Imaging Results
All simulation and experimental results are displayed in Figure 13 where the modalities (simulation type, experiment) are arranged in the columns (a,b,c,d) and the rows (i,ii,iii) represent varying locations of the reference reflector along the z’ axis (−0.5 mm, 0 mm 0.5 mm). The center image within each 3 × 3 panel represents the (x’, y’) = (0, 0) position at each z’ location and modality. Images located up, down, right, and left from the center image represent the +y’, −y’, +x’, and −x’ directions respectively as indicated in Figure 11. The bold boxed images in row (ii) represent the aligned maps corresponding to the (x’, y’, z’) = (0, 0, 0) position for each modality and are used as the template images in Section VI.
Figure 13.
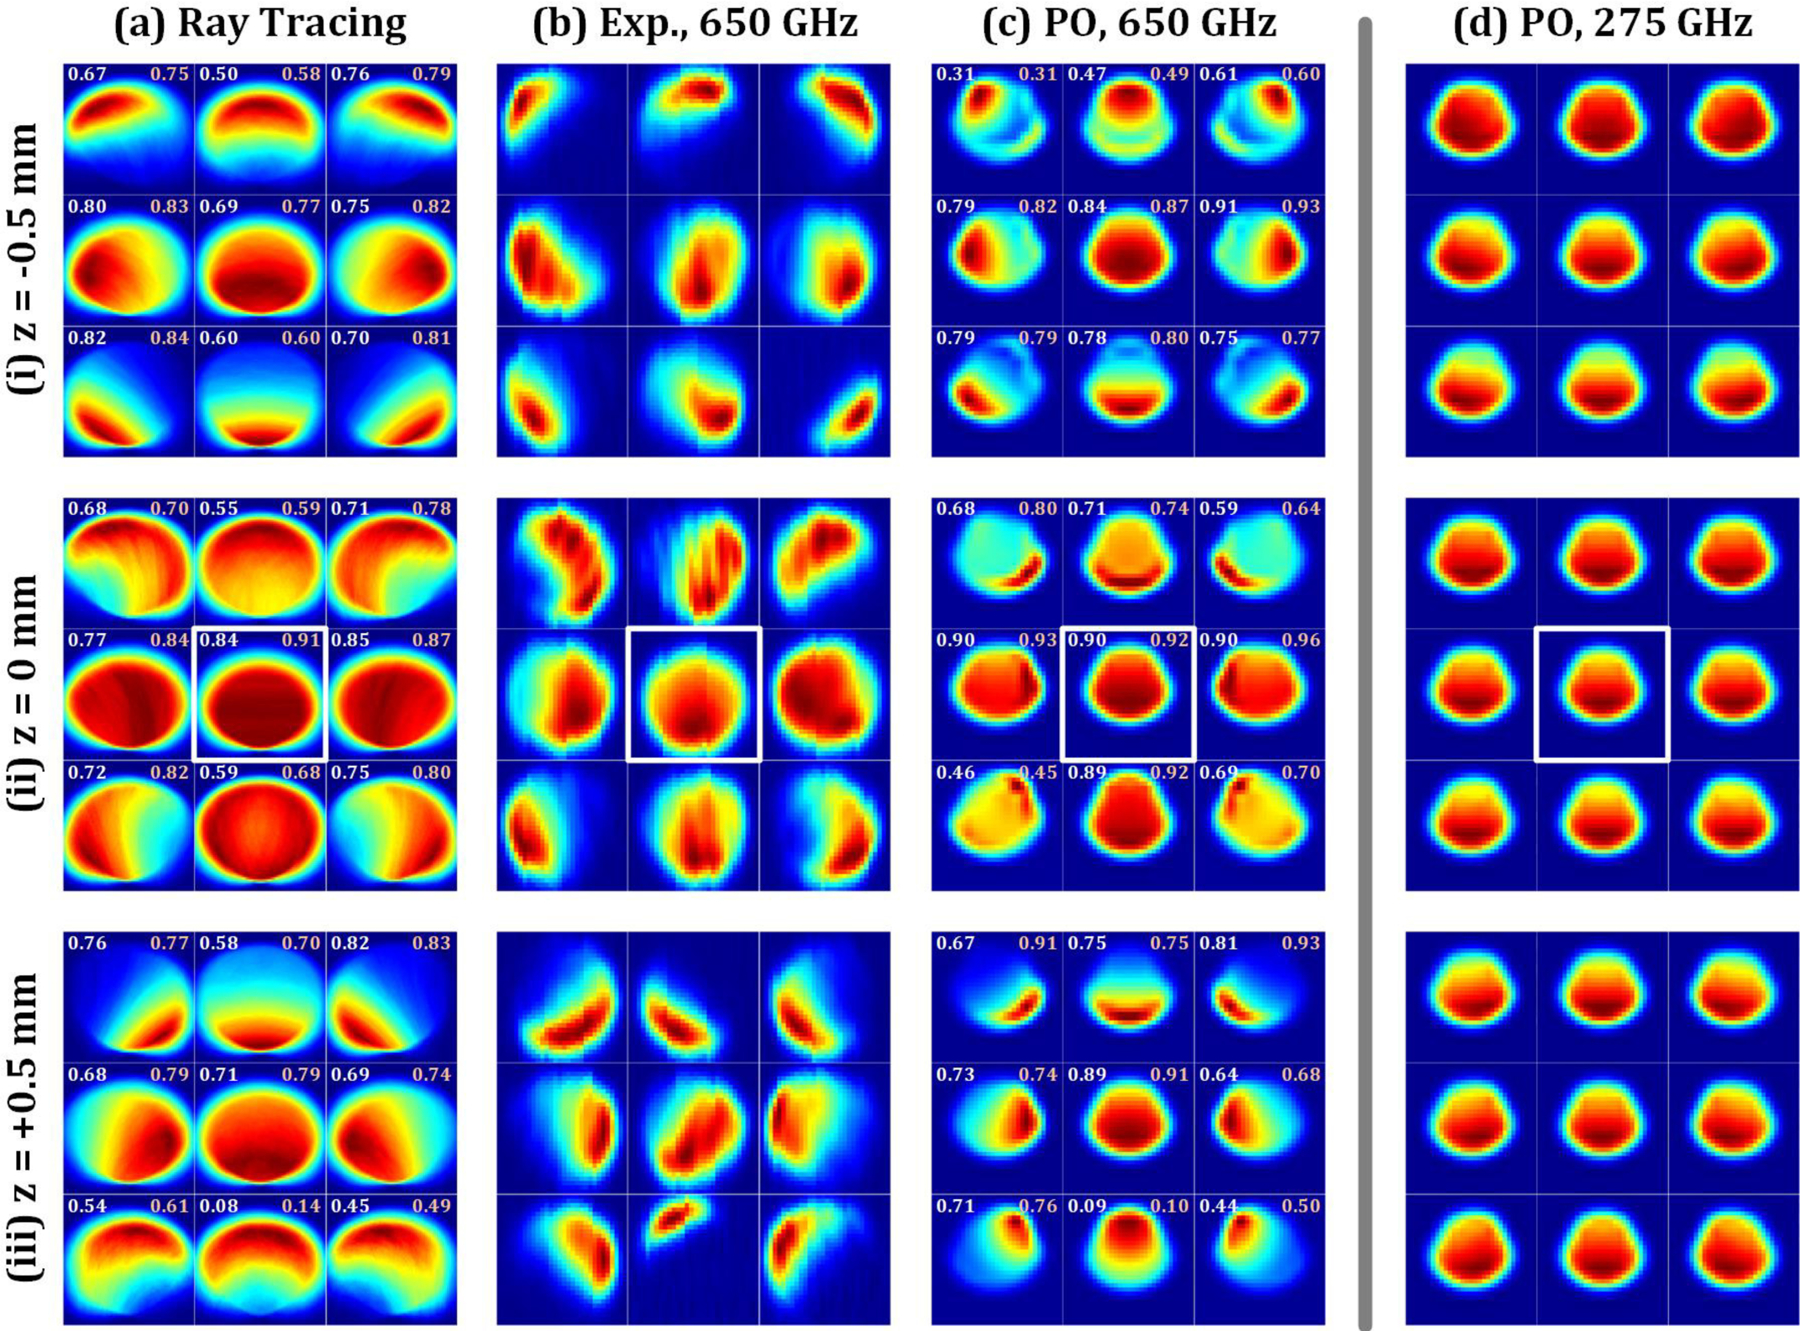
Simulation and experimental results. (a) Geometric optics (Ray tracing) (b) Experimental results at 650 GHz, (c) Physical Optics at 650 GHz, (d) Physical Optics at 275 GHz. Rows correspond to (i) −0.5 mm, (ii) 0 mm, and (iii) 0.5 mm axial displacements of the reference reflector. The outlined images in each column set indicate the template image located at (0, 0, 0).
The analysis of non-sequential ray tracing results generally overestimated the mirror scan solid angle over which significant signal is collected. This is likely due to computing images with total power arriving at the detector plane instead of a weighted average moderated by original source spatial extent and the angle of scattered beam arrival. Nevertheless, image based entirely on GO-based characterization of beam walk-off serves as a reasonable prediction of experimental behavior. The largest discrepancy is at the (x’, y’, z’) = (± 0.5, −0.5, 0.5) mm target positions represented by the southwest (SW) and southeast (SE) images in the Figure 13(a.iii) panel.
The 650 GHz PO images display some discrepancy with the experimental results in on the z’ = 0 planeμ Figure 13(c.ii) but very good agreement with the z’ = ±0.5 mm planes. Features are more accurately predicted by the PO results than the ray tracing results at 650 GHz which produced tighter distributions in signal about the maximum.
The OAP mirrors orientations were set to maintain parallel mirror pairs throughout the optics train. In addition to minimizing beam aberrations and cross polarization, the parallel orientations ensure a symmetric imaging performance for target positions of equal but opposite displacement. This is demonstrated by the 9 simulation panels Figure 13 (a,c,d,i–iii). Each panel is symmetric about a vertical line that bisects the middle column of the 9 image subsets per panel. This vertical line corresponds to the symmetry plane of the large OAP mirrors labeled OAP A and OAP B. Also note that there is no symmetry about the horizontal axis which corresponds to the lack of symmetry in the off axis mirrors about this plane. The experimental data in Figure 13 (b.i–iii) shows some break from symmetry about the vertical axis; particularly Figure 13 (b.iii).We believe this discrepancy is due to misalignment between the mirrors and/or source and detector in the optics train. The 650 GHz beam path undergoes reflections from 8 parabolic mirror surfaces, three planar surfaces, and one spherical surface. Any misalignment between OAP mirror aperture centroids, or even non-optimal alignment between the source/OAP or detector/OAP pairs can induce asymmetry in the beam that is exacerbated as it propagates.
In addition to misalignment, the discrepancy may also be due to the feed antenna simplification where a best fit Gaussian Beam was used to initiate propagation instead of the actual diagonal horn beam pattern.
A quantitative estimate of agreement between simulation and experiment were explored via the Zero Normalized Cross Correlation (ZNCC) and Structural Similarity Index Measure (SSIM) described respectively by equation (11) and (12) in section VI. Each ray tracing/physical optic image was compared to the corresponding experimental image via these metrics. The images were resampled to ensure a one-to-one spatial correspondence between pixels from different modalities. The SSIM is reported in the top left corner of each panel while the ZNCC is reported in the top right. These assessments demonstrate reasonable agreement in some regions and highlight significant discrepancies in others.
The comparison PO results at 275 GHz in Figure 13(d) show little apparent contrast variation for changing target location and are, qualitatively, insufficient for detecting misalignment. This is consistent with previous experimental [18, 19]. and simulation [16] results in the WR-3.4 band.
VI. Alignment Sensitivity Analysis
Two image comparison metrics were used to quantify sensitivity to target displacement via assessment of image contrast. Zero Normalized Cross Correlation (ZNCC, equation (11)) is a form of matched filtering that normalizes cross correlations by the total energy to focus on similarities/differences in contrast [23]. This method was applied previously and generates an output between −1 (perfectly anti-correlated) and +1 (perfectly correlated) [24].
| (11) |
Equation (11) operates on image A and image B indicated by IA(x,y) and IB(x,y) respectively and (x,y) are the spatial coordinates of the medium. μ# is the mean of image #, σ# is the standard deviation of image #, and N is the total number of pixels in the image.
Structural Similarity Index Measure (SSIM) is a method developed to assess image quality degradation from an ideal image by comparing means, variances, and covariances of spatially registered moving windows within the candidate images [25]. The SSIM metric ranges from 0 to 1 and produces a similarity index described by equation (12) where α and β are constants.
| (12) |
The parameters µ and σ in (12) are the same as equation (11), σA,B is the covariance between A and B, and L is the image dynamic range. If the localized windows are increased to the image size, then equation (12) converges to the mean SSIM or MSSIM. MSSIM was utilized for image characterization.
ZNCC and MSSIM were computed for the aligned image (non-displaced image → 0,0,0) paired with all other images. Prior to metric computations, a 1/e contour was found for each (0,0,0) image and applied to all misaligned images, as shown in Figure 14. The 1/e heuristic formed a reasonable tradeoff between a small pixel count for contours >>1/e and artificially high ZNCC/MSSIM scores arising from a large 0-signal area in the FOV. The top-hat like contrast visible in the full FOV masks contributions from small contrast variation within the top-hat and thus produces large ZNCC/MSSIM scores that are not consistent with qualitative assessments of contrast variation. The ZNCC scores were evaluated with a 0.7 threshold where a ZNCC > 0.7 [26] indicates insufficient misalignment detection sensitivity. The authors were unable to find published threshold standards for MSSIM and thus set the MSSIM threshold to 0.85 or 85% of the MSSIM range: [0, 1]. This is equivalent to the same ZNCC range; 0.7 = 85% of [– 1, 1]. This workflow is further described by the diagram in Figure 14.
Figure 14.
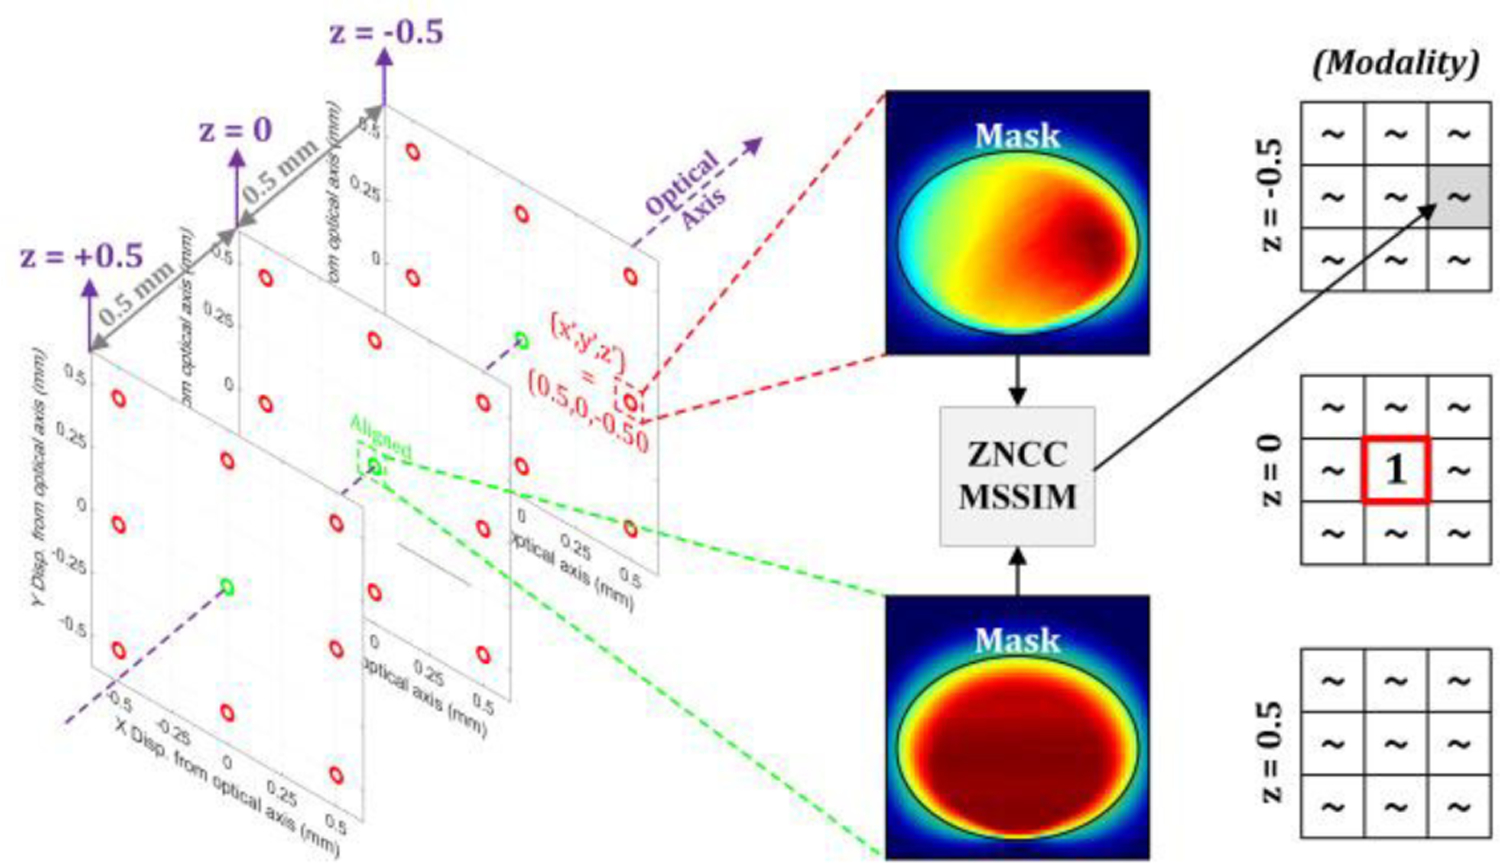
Image analysis workflow. The contrast map from the aligned (0,0,0) case serves as the template for image similarity comparisons. A 1/e intensity mask was extracted from the template image and only pixels within these masks are compared
Figure 15 shows ZNCC scores with positions corresponding to the image position in Figure 13. The aligned (0,0,0) case for each simulation/measurement type is indicated by the red dotted box and, by definition, achieves a score of 1 (self-correlation).
Figure 15.
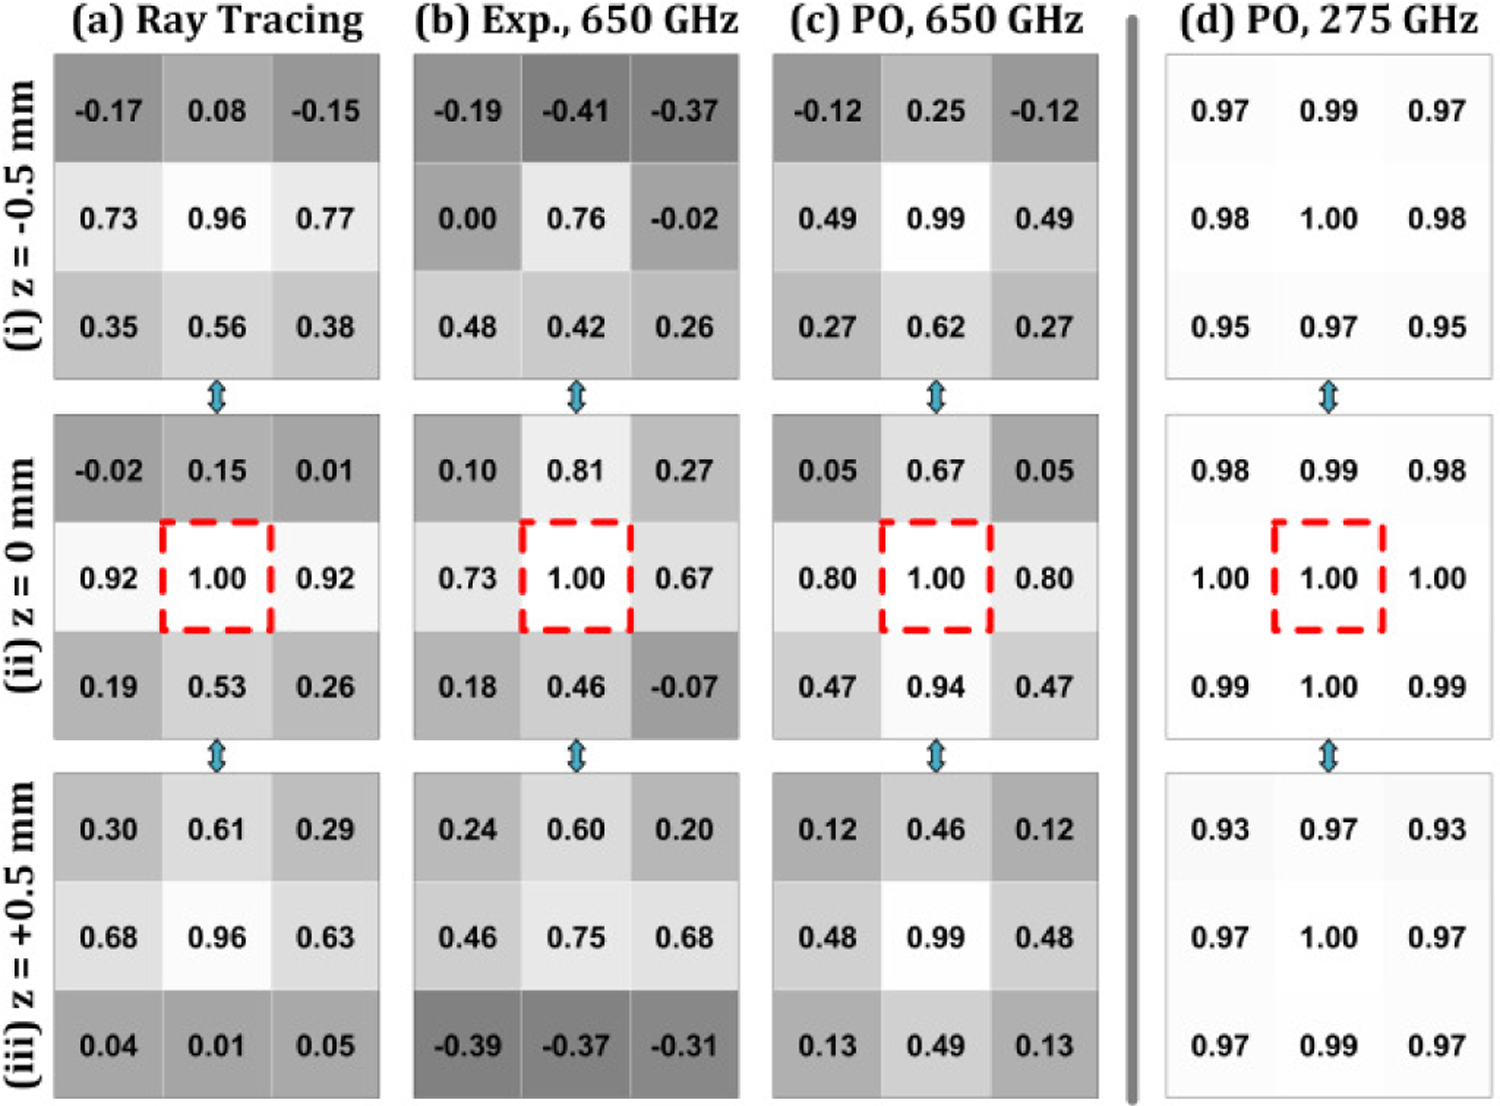
Zero Normalized Cross Correlation (ZNCC) analysis of image results in Figure 13. The modalities are arranged in columns (a-d) and the axial location of each transverse plane in rows (i-iii). The ZNCC score is housed in a box with a grayscale colormap ranging from −1 to 1. Each modality uses its own (0,0,0) image as the template.
The axially misaligned images in Figure 15(a.i) and Figure 15 (a.iii) correspond to the (0,0,0.5) and (0,0,−0.5) positions respectively and both produced ZNCCs of 0.96 suggesting limited sensitivity to displacement along the axis. These high SNCC are consistent with the similar appearance of the images.
The (x = ± 0.5, y = 0, z = 0) images in Figure 15(a.ii) both yield 0.92 for 0-axial displacement while the (x = 0, y = ± 0.5, z = 0) achieved a ZNCC of 0.15 and 0.53 for the positive and negative displacement respectively. The (x = ± 0.5, y = 0, z = − 0.5) images in Figure 15(a.1) are the only other maps that achieved a ZNCC above the 0.7 threshold. Note that while approximate symmetry is achieved about the y-axis for all three z-planes, the ZNCC in equivalent positions about the y-axis vary, at maximum, up to 7 parts in 100. For example, Figure 15(a.i) image (x = −0.5, y = −0.5, z = 0) and image (x = −0.5, y = −0.5, z = 0). This discrepancy is likely due to shot noise arising from a finite number of rays and the statistical distribution from which source ray location and angle are pulled.
The PO results in Figure 15c.i–iii demonstrate similar results where displacements along the z axis achieved a 0.99 ZNCC. However, nearly all transversely misaligned locations at the z = ± 0.5 planes produced a lower ZNCC than the ray tracing data sets. One outlier is the (x = 0, y = 0.5, z = 0) location which displayed a ZNCC of 0.94. The unmasked images are visually different while the masked FOV is quite similar.
The experimental results follow similar trends to the analysis of ray tracing and PO results albeit with less target locations exceeding the 0.7 threshold. Only the (x = 0, y = 0, z = ± 0.5) locations. The largest observed ZNCC is at (x = 0, y = 0.5, z = 0); just above the (x,y,z = 0) template. This is a departure from the simulations and is attributed to the apparent optical mirror misalignment as discussed in the section V.C.
The comparison PO results at 275 GHz are displayed in Figure 15(d.i–iii) and show limited sensitivity to misalignment. The smallest observed ZNCC is 0.93 and a total of target position images are completely indistinguishable from the template position (ZNCC = 1.)
MSSIM applied to the simulation and experimental results produced trends similar to the ZNCC as seen in Figure 16. Target displacement along the optical axis paired with no transverse misalignment is difficult to detect. One notable difference is that images generated with PO at 650 GHz generally outperforms the experiment. MSSIM is a global average of localized correlations and it appears that the coherence effects (ripple) observed in many of the misaligned images contributed to the differences between candidate image and template.
Figure 16.
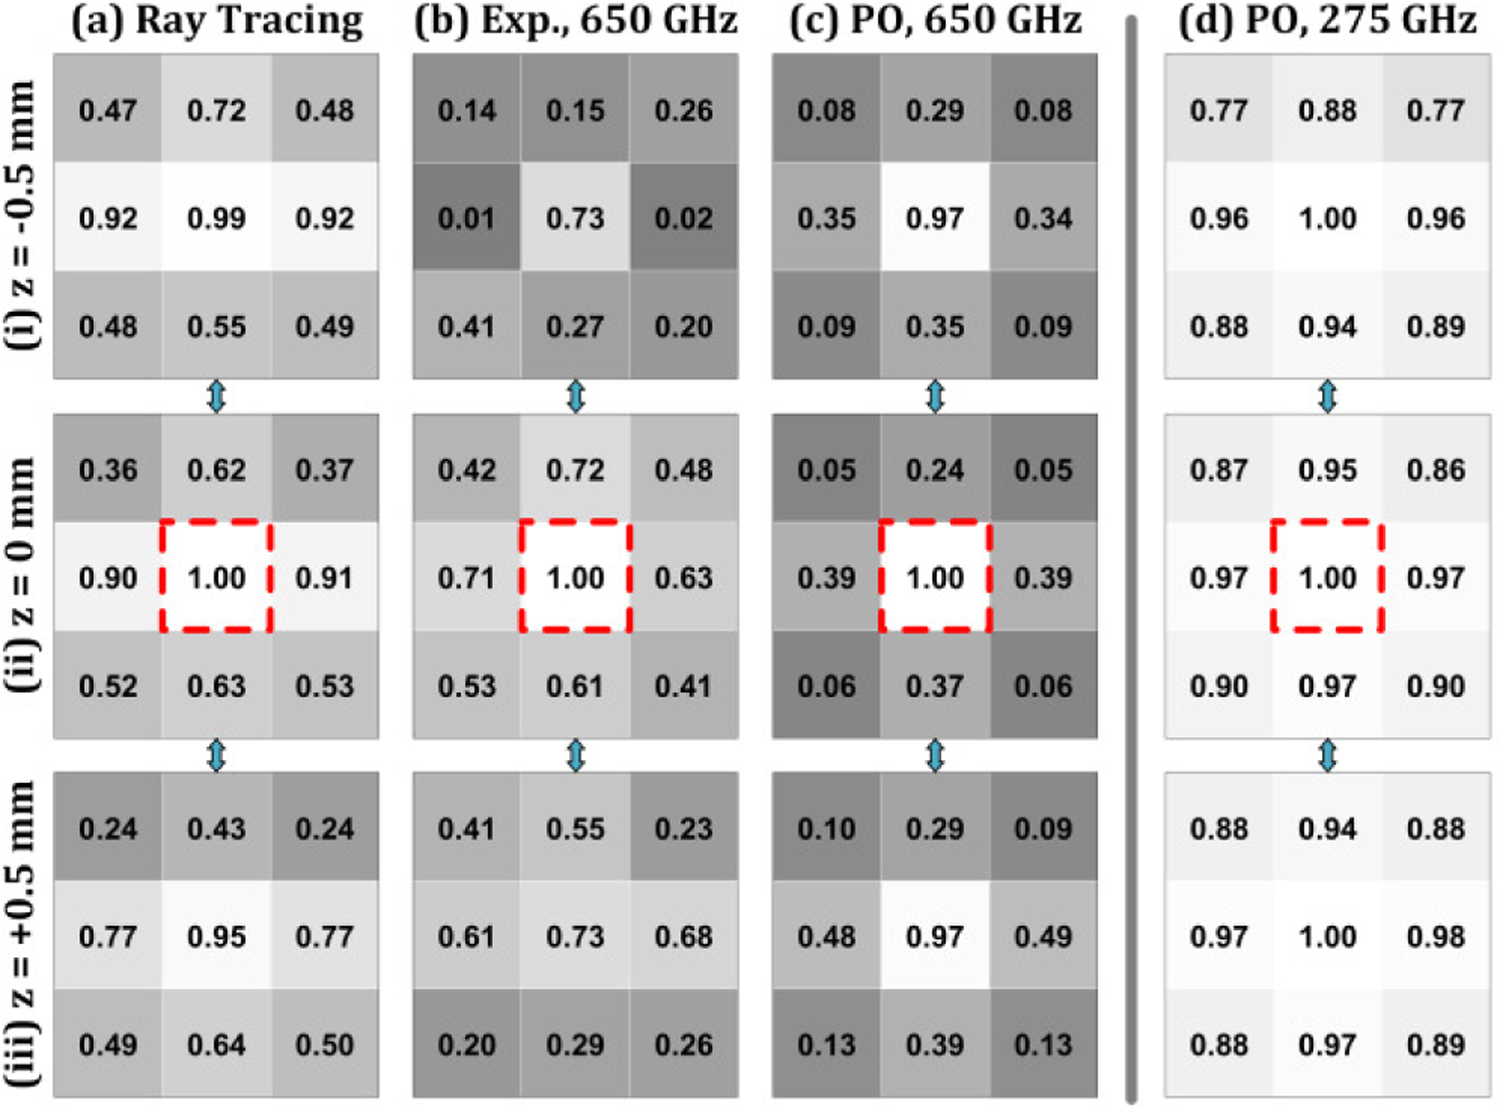
Mean Structural Similarity Index Measure (MSSIM) analysis of image results in Figure 13. The modalities are arranged in columns (a-d) and the axial location of each transverse plane in rows (i-iii). The MSSIM score is housed in a box with a grayscale colormap ranging from 0 to 1. Each modality uses its own (0,0,0) image as the template.
Another notable set of differences are the 275 GHz results where several MSSIM scores fall below the 0.8 threshold; e.g. (x = ± 0.5, y = 0.5, z = −0.5) in Figure 16(d.i). These scores suggest that SSIM is more sensitive than ZNCC at detecting asymmetries in image contrast in this context.
Finally, a 0.8 threshold applied to the MSSIM computed with the experimental images suggests sufficient sensitivity to all combinations of non-0 displacements. While contrast variation somewhat supports these results, the column registration (e.g. Figure 13.(b.ii) errors in some of the images corresponding to locations near the template are the likely culprits for the large sensitivity. The synchronicity between mirror actuation and data acquisition was randomly lost resulting in rows of pixels in adjacent columns not corresponding the contiguous region on the target. This results in the non-physical edges in contrast. Conversely, the ZNCC metric appears less sensitive to these errors and indicate that MSSIM may not be an ideal metric when the noise is low
VII. Conclusions
This work detailed the conception, design, construction, simulation, and experimental verification of a THz (650 GHz) imaging system for mmW (275 GHz) reflectometry alignment verification in corneal water content sensing. Compared to UV/VIS/NIR techniques, the THz band has the benefit of intrinsic compatibility with any mmW optical system. The alignment verification adjunct system leverages the extreme sensitivity of coupling efficiency to enable the detection of transverse/axial displacement of a spherical target surface.
The system used a total of 5 off-axis parabolic mirrors, a beam splitter, and a flat mirror mounted to a 2-axis galvanometric scanner to perform imaging. ABCD matrix analysis suggested tolerable degradation in optical performance over significant variations in collimated optical path length between the two large OAPs. GO and PO simulations demonstrated a good match to experiment and indicate positional sensitivity is due primarily to coupling efficiency but also to beam walk-off
Image similarity metrics suggest wavelength-order sensitivity to target displacement from the ideal position. Similarity metrics computed with the aligned template and 26 misaligned positions distributed on a 0.5 mm x 0.5 mm x 0.5 mm mesh returned significance for the majority of the cases.
There is a small volume (~ 2×2×2 mm3) over which the WR-3.4 signal is near maximum and the variation in total received WR-3.4 power is not a very sensitive function of the position. Additionally, the signal variation as a function of position within this volume could easily be mistaken for/attributed to variations in corneal tissue water content. Our previous work on permittivity extraction from tissue targets is supports this sensitivity.
Assuming that the optimal alignment positions of a millimeter wave, quasioptical transceiver and THz quasioptical transceiver can be collocated in practice, the combination of the proposed imaging system with a millimeter wave reflectometer makes practical sense. For target positions displaced by more than ~ 1 mm, the imaging system produces mostly noise even though substantial signal remains on the millimeter wave channel. Thus, this these positions can be easily rejected. For target positions that are displaced ~ 0.5 – 1 mm or ~ 1λ – 2λ from optimal, it’s quite clear from the THz image that the target is not optimally located. It’s less clear where the detection limit in the 0 – 0.5 mm (~ 0λ – 1λ) range. Additional experimental work with better target position control and expanded simulation analysis to characterize the ZNCC and MSSIM metrics in the presence of noise are needed to explore the limit.
As for real world application, we believe that simply identifying misalignment is sufficient whereas characterizing how the target is misaligned, is information that would not be easily used as online, real time control and adjustment of the system aperture, seems infeasible at this time. Moreover, given the difficulty of maintaining a steady gaze it’s reasonable to assume that, over a short time window, the cornea will pass through the optimal position and that this even will be detected by the THz imaging system.
Acknowledgment
This work is supported by Academy of Finland research project AGRUM (327640) through the Radiation Detectors for Health, Safety and Security (RADDESS) program and the US National Eye Institute (NEI) Grant# 5R01EY021590.
This work was supported in part by the National Eye institute under Grant Number 5R01EY021590. And as research project AGRUM through Academy of Finland programme Radiation Detectors for Health, Safety and Security (RADDESS). This work has been carried out in MilliLab, an external laboratory of the European Space Agency.
Biography

Yong Hu (Member, IEEE) received his bachelor’s degree in School of Manufacturing Science and Engineering, Sichuan University, Chengdu, China in 2011; M.Sc. degree in Department of Precision Instrumentation, Tsinghua University, Beijing, China in 2014; and Ph.D. degree in Bioengineering Department, University of California, Los Angeles (UCLA), Los Angeles, USA in 2018. He worked as a research scientist in Department of Head and Neck Surgery, UCLA, Los Angeles, USA from 2019 to 2021 and now as a research fellow in National University of Singapore. His current research interests include THz imaging, fluorescence lifetime imaging, hyperspectral imaging, and image processing for medical applications.

Mariangela Baggio was born in Camposampiero, Italy in 1992. She received her B. Sc. degree in Information Technology Engineering and M. Sc. degree in Telecommunication Engineering from the University of Padova, Italy in 2015 and 2018, respectively. She is currently pursuing her Ph.D. in Electrical Engineering at Aalto University, Finland. Her current research interests include mmw and THz techniques, quasioptical system design and THz sensing and imaging.

Shahab Oddin Dabironezare was born on September 2, 1991 in Mashhad, Iran. He received his M.Sc. degree and PhD in Electrical Engineering at Delft University of Technology, Delft, the Netherlands, in 2015 and 2020, respectively. He is currently a postdoctoral researcher at the Delft University of Technology where he is with the THz Sensing Group, Microelectronics Department. His research interests include wideband antenna designs for millimeter and sub-millimeter-wave applications, wide field-of-view imaging systems, quasi-optical systems, and absorber-based passive cameras.

Aleksi Tamminen (Member, IEEE) was born in Ruotsinpyhtää, Finland, in 1982. He received the B.Sc. (Tech.) and M.Sc. (Tech.) degrees in electrical engineering from Helsinki University of Technology, Espoo, Finland, in 2005 and 2007, respectively, and the Lic.Sc. (Tech.) and D.Sc. (Tech.) degrees from Aalto University (former Helsinki University of Technology), Espoo, in 2011 and 2013, respectively. From 2005 to 2013, he was with the Department of Radio Science and Engineering, Aalto University. His research work at Aalto University was related to antenna measurements and imaging at millimeter and submillimeter waves. From 2013 to 2018, he was a Research Scientist with Asqella Ltd., Helsinki, Finland. He was a Principal in the research and development of commercial submillimeter-wave imaging technology as well as in participating in academic research projects in the related field. Since 2018, he has been with Aalto University as a Research Fellow. He has authored or coauthored more than 50 scientific journal and conference publications as well as three patent applications. His current research interests are submillimeter- and millimeterwave projects including antenna measurements, sensing biological tissues, and imaging. Mr. Tamminen was a recipient of the Young Engineer Prize from the 5th European Radar Conference on November 31, 2008, as well as the Best Student Paper Award from the Global Symposium on Millimeter Waves 2010 on April 14–16, 2010. In addition to research, he served as the organizing secretary of international conference, the 6th ESA Workshop on MillimeterWave Technology and Applications, and the 4th Global Symposium on Millimeter Waves, held in Espoo in May 2011.

Brandon Toy is working on communication systems as an RF engineer in the aerospace industry. He received a bachelor’s degree in electrical engineering from University of California, Los Angeles and a master’s degree in electrical engineering from the California Institute of Technology. He is interested in the radio frequency applications for biomedical devices and space exploration.

Juha Ala-Laurinaho received the Diploma Engineer (M.Sc.) degree in mathematics and D.Sc. (Tech.) degree in electrical engineering from TKK Helsinki University of Technology, Finland, in 1995 and 2001, respectively. He has been with the TKK, currently Aalto University, serving in the Radio Laboratory in 1995–2007, in the Department of Radio Science and Engineering in 2008–2016, and currently in the Department of Electronics and Nanoengineering. Currently, he works as a Staff Scientist. Dr. Ala-Laurinaho has been a Researcher and Project Manager in various millimeter wave technology related projects. His current research interests are the antennas and antenna measurement techniques for millimeter and submillimeter waves, and the millimeter wave imaging.

Elliott R. Brown (Fellow, IEEE) received the Ph.D. degree in applied physics from the California Institute of Technology, Pasadena, CA, USA, in 1985. He is currently a Professor of physics and electrical engineering with Wright State University (WSU), Dayton, OH, USA, where he holds the Ohio Research Scholars Endowed Chair in sensors’ physics. He is conducting research and teaching courses in radiofrequency (RF) and terahertz (THz) sensor science and technology, and in solid-state physics and engineering. His THz research encompasses several topics, including ultralow noise rectifiers, photomixing sources, the THz phenomenology of biomaterials, and THz remote sensor and imager design and simulation. Other areas of research include multifunctional RF electronics and systems, biomedical ultrasonic imaging in and around hard tissue (in collaboration with the UCLA Medical and Dental Schools), and electronic and photonic transport in nanostructures. Prior to WSU, he was a Professor of electrical and computer engineering with the University of California, (Santa Barbara and Los Angeles campuses), and prior to that, a Program Manager with DARPA in the Electronics Technology Office, Arlington, VA, USA. He did his postdoctoral work with Lincoln Laboratory, Massachusetts Institute of Technology. Dr. Brown was a recipient of the award for Outstanding Achievement from the U.S. Office of the Secretary of Defense in 1998. He has been a Fellow of the American Physical Society since 2007.

Nuria Llombart (Fellow, IEEE) received the master’s degree in electrical engineering and the Ph.D. degree in EBG antennas from the Polytechnic University of Valencia, Valencia, Spain, in 2002 and 2006, respectively. During her master’s degree, she spent one year with the Friedrich-Alexander University of ErlangenNuremberg, Erlangen, Germany. She worked with the Fraunhofer Institute for Integrated Circuits, Erlangen. From 2002 to 2007, she was with the Antenna Group, TNO Defense, Security and Safety Institute, The Hague, The Netherlands, where she worked as a Ph.D. Student and then as a Researcher. From 2007 to 2010, she was a Postdoctoral Fellow with the California Institute of Technology, working with the Submillimeter Wave Advance Technology Group, Jet Propulsion Laboratory, Pasadena, CA, USA. She was a Ramón y Cajal Fellow with the Optics Department, Complutense University of Madrid, Madrid, Spain, from 2010 to 2012. In September 2012, she joined the Terahertz Sensing Group, Delft University of Technology, Delft, The Netherlands, where she became a Full Professor in February 2018. She has coauthored more than 150 journals and international conference contributions. Her research interests include the analysis and design of planar antennas, periodic structures, reflector antennas, lens antennas, and waveguide structures, with emphasis in the terahertz range. Dr. Llombart was a recipient of the H. A. Wheeler Award for the Best Applications Paper of 2008 in the IEEE TRANSACTIONS ON ANTENNAS AND PROPAGATION, the 2014 THz Science and Technology Best Paper Award of the IEEE Microwave Theory and Techniques Society, and several NASA awards. She was also a recipient of the 2014 IEEE Antenna and Propagation Society Lot Shafai Mid-Career Distinguished Achievement Award. She serves as a Board Member for the IRMMW-THz International Society. In 2015, she was a recipient of the European Research Council Starting Grant.

Sophie X. Deng received the B.S. degree in biochemistry from the City College of New York, New York, NY, USA, in 1991, and the Doctor of Medicine and Doctor of Philosophy degrees in immunology from the School of Medicine and Dentistry, University of Rochester, Rochester, NY, USA, in 2001. She completed the rigorous Medical Scientist Training Program with the School of Medicine and Dentistry, University of Rochester, Rochester, NY, USA. She is an Associate Professor with Cornea Division, Jules Stein Eye Institute, University of California (UCLA), Los Angeles, CA, USA. She did her residency in ophthalmology with the Illinois Eye and Ear Infirmary, Chicago. She subsequently, completed her fellowship in cornea, external ocular disease, and refractive surgery with the Jules Stein Eye Institute. She is a Specialist in corneal and external ocular diseases and cataracts. Her surgical areas include endothelial keratoplasty (DSEK and DMEK), deep anterior lamellar keratoplasty (DALK), penetrating keratoplasty, limbal stem cell transplantation, artificial cornea, and cataract. She is the Director of Cornea Biology Laboratory, Jules Stein Eye Institute, UCLA. Her research focuses on corneal epithelial stem cells regulation, deficiency, and regeneration. Her research aims to improve the current treatment for patients with limbal stem cell deficiency by using stem cell therapy to restore vision. In addition, she conducts clinical studies to develop new imaging and molecular tests to accurately diagnose and stage limbal stem cell deficiency.

Vincent P. Wallace (M’03) received the Ph.D. degree in medical physics from the University of London, London, U.K., in 1997. He has more than 18 years of experience in Biophotonics. After three years at the Beckman Laser Institute, UC Irvine, he joined Toshiba Research, Cambridge, U.K., to look at potential medical applications of terahertz radiation. TeraView Ltd., Cambridge, was spun-out of Toshiba Labs in April 2001. At TeraView, he led a group looking at medical applications of terahertz. In 2007, he moved to the University of Western Australia, where he continues to apply terahertz and other techniques to biomedical and clinical problems.

Zachary D. Taylor (Member, IEEE) received the B.S. degree in electrical engineering from the University of California (UCLA), Los Angeles, CA, USA, in 2004, and the M.S. and Ph.D. degrees in electrical engineering from the University of California (UCSB), Santa Barbara, CA, USA, in 2006 and 2009, respectively.,From 2013 to 2018, he was an Adjunct Assistant Professor with appointments with the Department of Bioengineering, Department of Electrical Engineering, and Department of Surgery, University of California (UCLA), Los Angeles, CA, USA. Since 2018, he has been an Assistant Professor with the Department of Electronics and Nanoengineering, Aalto University, Espoo, Finland. His current research interests include submillimeter-wave and terahertz (THz) imaging and sensing and THz frequency calibration techniques for antenna measurements, personnel imaging, and clinical diagnostics.
Appendix A: Visualization of Beams
Spot size on target
Analysis of the spot size on target at the extreme ends of the scanning range, defined by the OAP aperture diameter, are shown in Figure A17. Less distortion is seen for scanning using the more directive feed which leads to less diffraction effects from reflector edges. This is similar to the results from previous work [1, 2] in the main document
Figure A17.
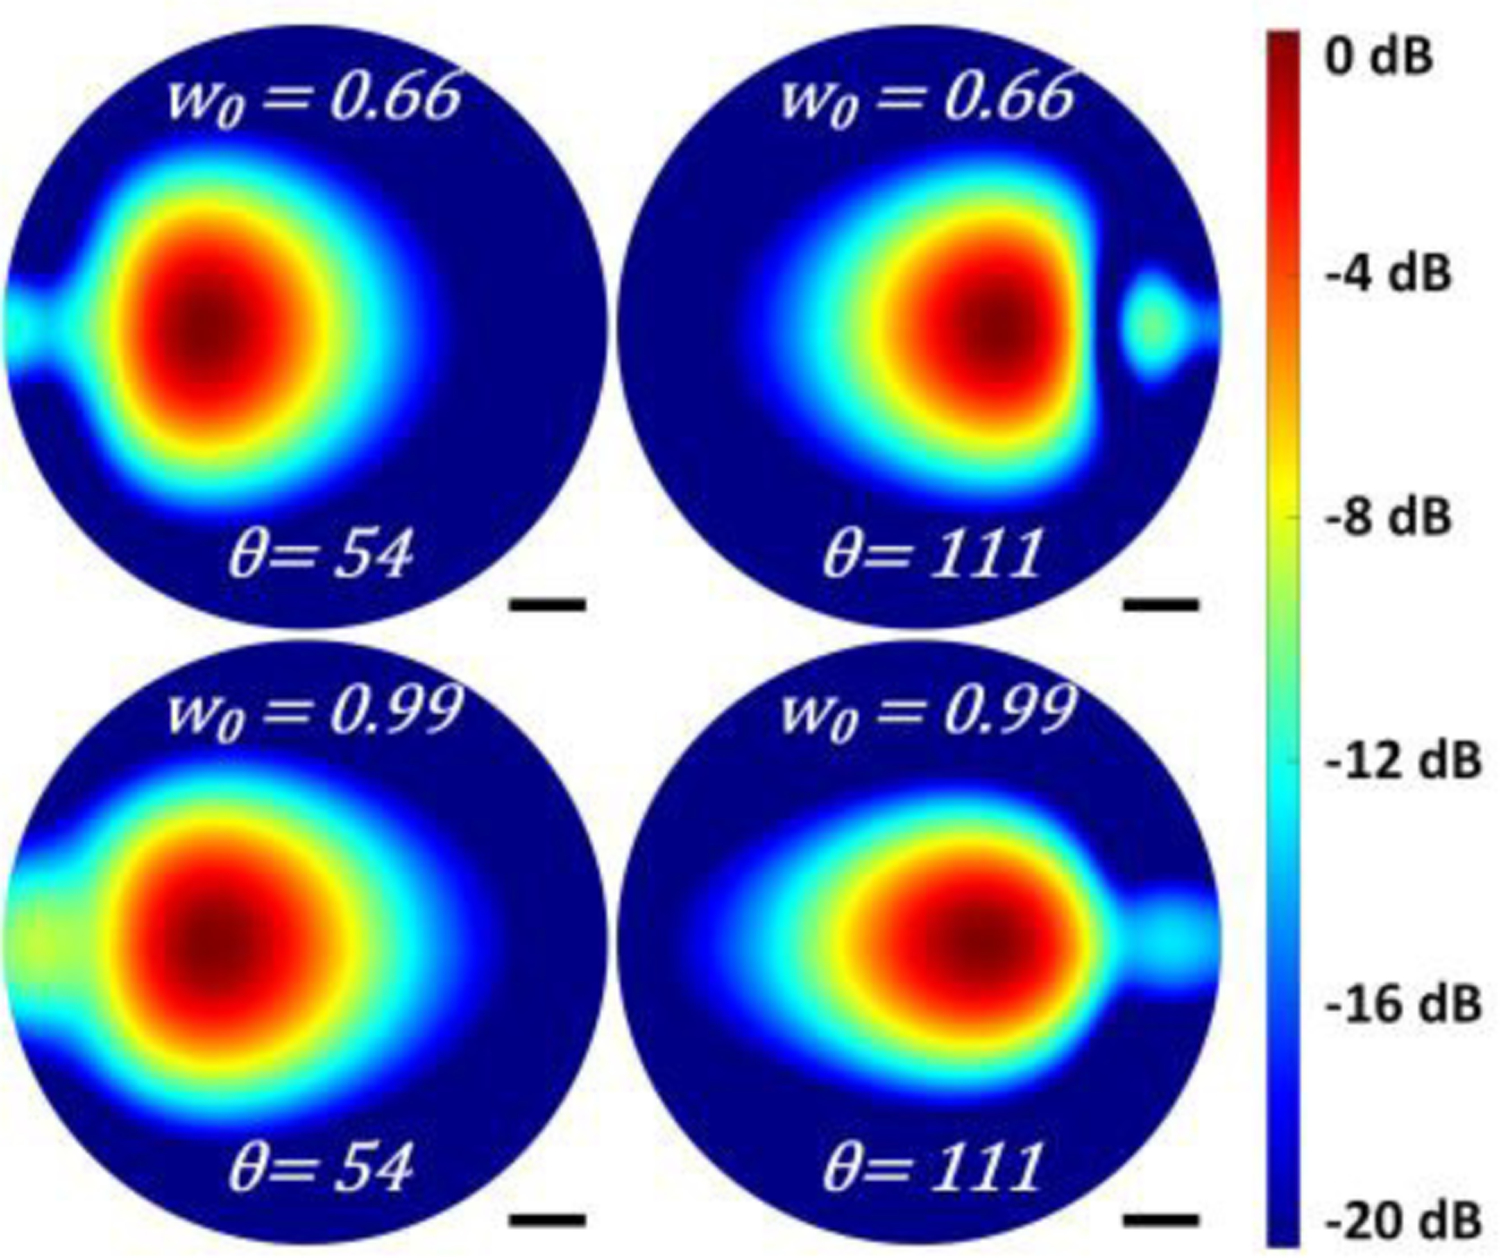
spot size on cornea. (left) the angles and collimated path lengths are demonstrated at the extreme points of the scanning range. (right) normalized Electric fields for different input beam waist radii for the largest (d0 = 177.8 mm) considered collimated path length.
Analysis of spillover
PO results for the final spot size, referenced to the initial spot size at the extreme edges of the scanning range are displayed in Figure A18 and are examples of the fields used in the computations represented by the dotted line trends in Figure 6(b). The left column labeled “input” shows the illumination beam immediately after collimation by the first 101.6 mm clear aperture OAP (OAP 2 in Figure 5). The middle and right columns are labeled “reflected” and show the beam at the input of OAP 2 after it has been focused by OAP 1, reflected by the cornea, and then collimated by OAP1.
Figure A18.
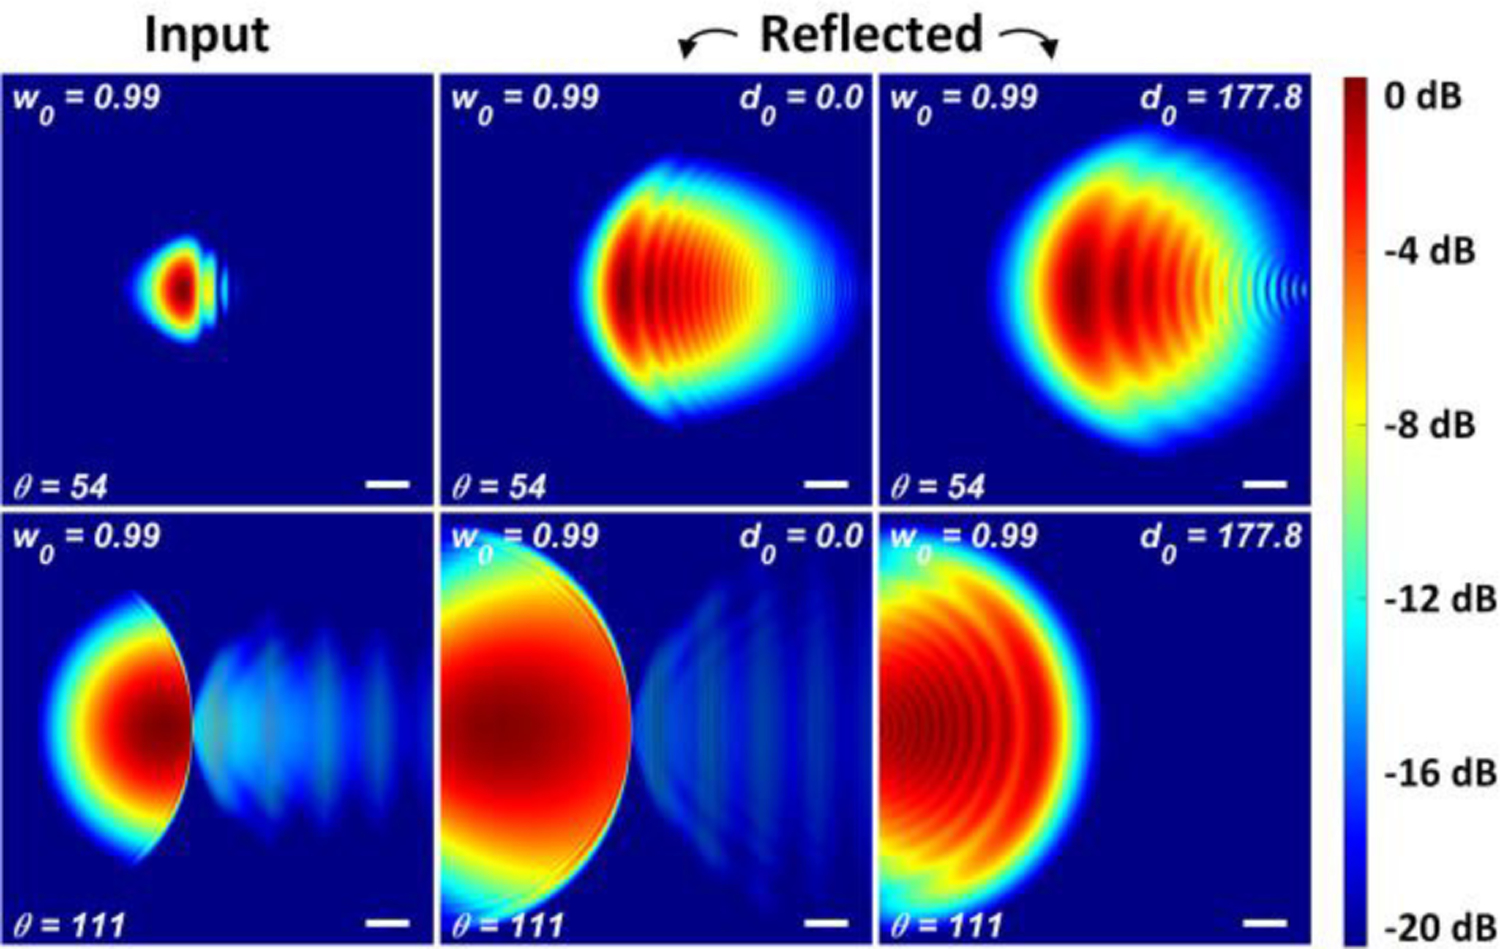
Input vs output transverse beam profiles for an input waist of 0.99 mm. The center column shows the reflected beams at θ = 54° and θ = 111° for a mirror separation distance of d0 = 0 mm. The right column reports reflected beams at the same angles but for a mirror separation distance of d0 = 177.8 mm
The reflected and incident beams are both extremely distorted for large θ scanning angles. A large portion of the power is diffracted in these cases from the top reflector’s right edge. Similar issues are noted for the small scanning angles at the left edge of the top reflector. With larger d0, the distorted incident and reflected fields for the scanning extremes manage to propagate longer, leading to more visible distortion ripples in the reflected fields even in θ =111° case (with shorter collimated path length).
The magnitude and phase of the reflected beam at 54 degrees and 111 degrees are shown in the Figure A19 for an input waist of 0.99 mm and a collimated beam path length of 178.8 mm. The reference magnitude and phase are displayed in the left column.
Figure A19.
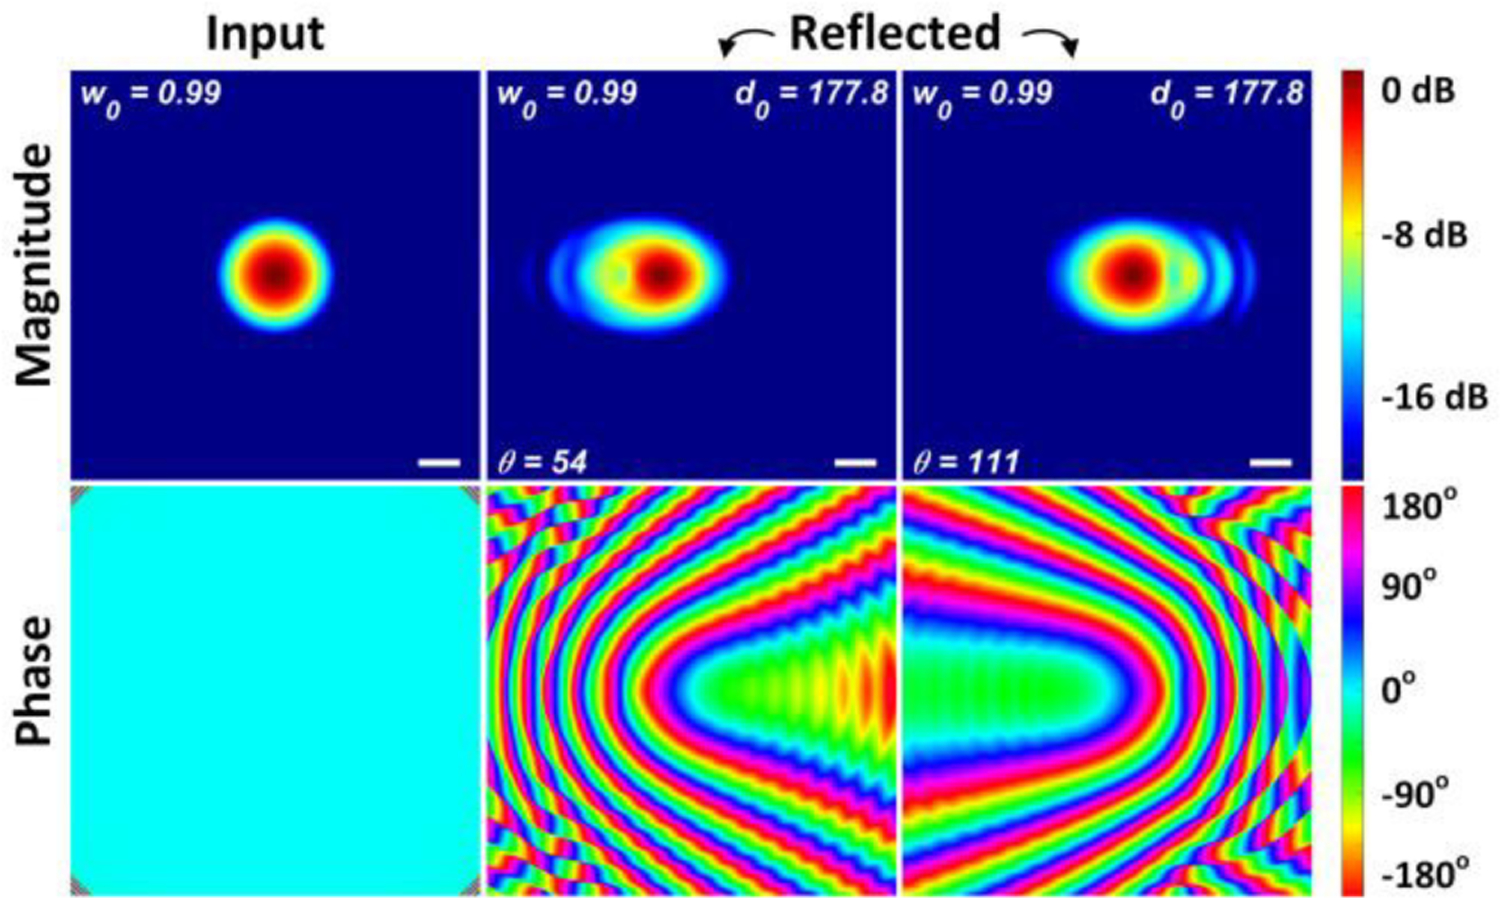
Magnitude and phase at the detector plane. (Left column) an ideal TEM0,0 Gaussian beam waist is placed at the input plane. (Middle) the reflected beam magnitude and phase sampled at the input plane after routing through OAP mirrors A and B, reflection from the spherical target and then back through OAP A and B. The scan mirror directs the beam centroid at an angle of θ = 54° w.r.t. the z-axis and the OAP mirror tip separation is d0 = 177.8 mm. (Right) same as middle except θ = 111°
Contributor Information
Yong Hu, Department of Bioengineering, University of California, Los Angeles, CA 90095 USA.
Mariangela Baggio, Department of Electronics and Nanoengineering, Aalto University, Espoo, FI-02150, Finland.
Shahab Dabironezare, Center for Wireless Systems and Technology, Delft University of Technology, 2628 CD Delft, The Netherlands.
Aleksi Tamminen, Department of Electronics and Nanoengineering, Aalto University, Espoo, FI-02150, Finland.
Brandon Toy, Electrical and Computer Engineering Department, University of California, Los Angeles, CA 90095 USA..
Juha Ala-Laurinaho, Department of Electronics and Nanoengineering, Aalto University, Espoo, FI-02150, Finland.
Elliott Brown, College of Engineering and Computer Science, Wright State University, Dayton, OH, 45435, USA.
Nuria Llombart, Center for Wireless Systems and Technology, Delft University of Technology, 2628 CD Delft, The Netherlands.
Sophie X. Deng, Cornea Division, University of California, Los Angeles, 90095-1436, USA
Vincent Wallace, Department of Engineering and Mathematical Sciences, University of Western Australia, Crawley, WA, 6009, Australia.
Zachary D. Taylor, Department of Electronics and Nanoengineering, Aalto University, Espoo, FI-02150, Finland
References
- [1].Sung S, Selvin S, Bajwa N, Chantra S, Nowroozi B, Garritano J, Goell J, Li A, Deng SX, Brown E, Grundfest WS, and Taylor ZD, “THz imaging system for in vivo human cornea,” Terahertz Science and Technology, IEEE Transactions on, vol. 7, 2017. [DOI] [PMC free article] [PubMed] [Google Scholar]
- [2].Sung S, Dabironezare S, Llombart N, Selvin S, Bajwa N, Chantra S, Nowroozi B, Garritano J, Goell J, Li A, Deng SX, Brown E, Grundfest WS, and Taylor ZD, “Optical system design for non-contact, normal incidence, THz imaging of in vivo human cornea,” Terahertz Science and Technology, IEEE Transactions on, vol. 7, 2017. [DOI] [PMC free article] [PubMed] [Google Scholar]
- [3].Taylor ZD, Garritano J, Shijun S, Bajwa N, Bennett DB, Nowroozi B, Tewari P, Sayre JW, Hubschman JP, Deng SX, Brown ER, and Grundfest WS, “THz and mm-Wave Sensing of Corneal Tissue Water Content: In Vivo Sensing and Imaging Results,” Terahertz Science and Technology, IEEE Transactions on, vol. 5, pp. 184–196, 2015. [DOI] [PMC free article] [PubMed] [Google Scholar]
- [4].Taylor ZD, Garritano J, Sung S, Bajwa N, Bennett DB, Nowroozi B, Tewari P, Sayre J, Hubschman JP, Deng S, Brown ER, and Grundfest WS, “THz and mm-Wave Sensing of Corneal Tissue Water Content: Electromagnetic Modeling and Analysis,” Terahertz Science and Technology, IEEE Transactions on, vol. 5, pp. 170–183, 2015. [DOI] [PMC free article] [PubMed] [Google Scholar]
- [5].Ozheredov I, Prokopchuk M, Mischenko M, Safonova T, Solyankin P, Larichev A, Angeluts A, Balakin A, and Shkurinov A, “In vivo THz sensing of the cornea of the eye,” Laser Physics Letters, vol. 15, p. 055601, 2018/04/13 2018. [Google Scholar]
- [6].Chen A, Virk A, Harris Z, Abazari A, Honkanen R, and Arbab MH, “Non-contact terahertz spectroscopic measurement of the intraocular pressure through corneal hydration mapping,” Biomedical Optics Express, vol. 12, pp. 3438–3449, 2021/06/01 2021. [DOI] [PMC free article] [PubMed] [Google Scholar]
- [7].Ke L, Zhang N, Wu QYS, Gorelik S, Abdelaziem A, Liu Z, Teo EPW, Mehta JS, and Liu Y-C, “In vivo sensing of rabbit cornea by terahertz technology,” Journal of Biophotonics, vol. n/a, p. e202100130. [DOI] [PubMed] [Google Scholar]
- [8].Angeluts AA, Balakin AV, Mishchenko MD, Ozheredov IA, Prokopchuk MN, Saphonova TN, and Shkurinov AP, “Application of THz reflectometry to eye cornea hydration measurements,” in 2016 41st International Conference on Infrared, Millimeter, and Terahertz waves (IRMMW-THz), 2016, pp. 1–2. [Google Scholar]
- [9].Rodrigues MM, Krachmer JH, Hackett J, Gaskins R, and Halkias A, “Fuchs’ Corneal Dystrophy,” Ophthalmology, vol. 93, pp. 789–796, 1986/06/01 1986. [PubMed] [Google Scholar]
- [10].Adamis AP, Filatov V, Tripathi BJ, and Tripathi R. A. m. C., “Fuchs’ endothelial dystrophy of the cornea,” Survey of Ophthalmology, vol. 38, pp. 149–168, 9// 1993. [DOI] [PubMed] [Google Scholar]
- [11].Mandell RB, Polse KA, Brand RJ, Vastine D, Demartini D, and Flom R, “Corneal hydration control in Fuchs’ dystrophy,” Investigative Ophthalmology & Visual Science, vol. 30, pp. 845–52, May 1, 1989. 1989. [PubMed] [Google Scholar]
- [12].Allan BD, Terry MA, Price FW Jr., Price MO, Griffin NB, and Claesson M, “Corneal transplant rejection rate and severity after endothelial keratoplasty,” Cornea, vol. 26, pp. 1039–42, Oct 2007. [DOI] [PubMed] [Google Scholar]
- [13].Aravena C, Yu F, and Deng SX, “Outcomes of Descemet Membrane Endothelial Keratoplasty in Patients With Previous Glaucoma Surgery,” Cornea, vol. 36, pp. 284–289, Mar 2017. [DOI] [PMC free article] [PubMed] [Google Scholar]
- [14].Wu EI, Ritterband DC, Yu G, Shields RA, and Seedor JA, “Graft rejection following descemet stripping automated endothelial keratoplasty: features, risk factors, and outcomes,” Am J Ophthalmol, vol. 153, pp. 949–957.e1, May 2012. [DOI] [PubMed] [Google Scholar]
- [15].Deng SX, Lee WB, Hammersmith KM, Kuo AN, Li JY, Shen JF, Weikert MP, and Shtein RM, “Descemet Membrane Endothelial Keratoplasty: Safety and Outcomes: A Report by the American Academy of Ophthalmology,” Ophthalmology, vol. 125, pp. 295–310, Feb 2018. [DOI] [PubMed] [Google Scholar]
- [16].Baggio M, Tamminen A, Nefedova I, Pälli SV, Ala-Laurinaho J, and Taylor Z, “Alignment sensitivity of a WR-3.4 band quasioptical system for corneal water content sensing,” in 2020 45th International Conference on Infrared, Millimeter, and Terahertz Waves (IRMMW-THz), 2020, pp. 1–2. [Google Scholar]
- [17].Tamminen A, Palli SV, Ala-laurinaho J, Salkola M, Raisanen A, and Taylor Z, “Quasioptics for corneal sensing at 220 – 330 GHz: design, evaluation, and ex-vivo cornea parameter extraction,” IEEE Transactions on Terahertz Science and Technology, pp. 1–1, 2020. [Google Scholar]
- [18].Tamminen A, Baggio M, Nefedova I, Sun Q, Presnyakov S, Ala-laurinaho J, Brown E, Wallace V, Macpherson E, Maloney T, Kravchenko N, Salkola M, Deng S, and Taylor Z, “Extraction of thickness and water content gradients in hydrogel-based, water-backed corneal phantoms via submillimeter wave reflectometry,” IEEE Transactions on Terahertz Science and Technology, pp. 1–1, 2021. [Google Scholar]
- [19].Tamminen A, Baggio M, Nefedova I, Sun Q, Anttila J, Ala-laurinaho J, Brown E, Wallace V, Macpherson E, Maloney T, Salkola M, Deng S, and Taylor Z, “Submillimeter-wave permittivity measurements of bound water in collagen hydrogels via frequency domain spectroscopy,” IEEE Transactions on Terahertz Science and Technology, pp. 1–1, 2021. [Google Scholar]
- [20].Larocca F, Chiu SJ, McNabb RP, Kuo AN, Izatt JA, and Farsiu S, “Robust automatic segmentation of corneal layer boundaries in SDOCT images using graph theory and dynamic programming,” Biomedical optics express, vol. 2, pp. 1524–1538, 2011. [DOI] [PMC free article] [PubMed] [Google Scholar]
- [21].Lu H, Wang M, Wang J, and Shen M, “Tear film measurement by optical reflectometry technique,” Journal of Biomedical Optics, vol. 19, p. 027001, 2014. [DOI] [PMC free article] [PubMed] [Google Scholar]
- [22].(2017, March 20). Laser Scanning Confocal Microscopy Available: https://www.microscopyu.com/tutorials/laser-scanning-confocal-microscopy
- [23].Briechle K and Hanebeck U, Template matching using fast normalized cross correlation vol. 4387: SPIE, 2001. [Google Scholar]
- [24].Baggio M, Hu Y, Tamminen A, Nefedova I, Ala-Laurinaho J, and Taylor Z, Submillimeter-wave imaging assisted alignment of millimeter-wave spectroscopic system for quantification of corneal water content vol. 11348: SPIE, 2020. [Google Scholar]
- [25].Zhou W, Bovik AC, Sheikh HR, and Simoncelli EP, “Image quality assessment: from error visibility to structural similarity,” IEEE Transactions on Image Processing, vol. 13, pp. 600–612, 2004. [DOI] [PubMed] [Google Scholar]
- [26].Castillo PA and Laredo JLJ, Applications of Evolutionary Computation: 24th International Conference, EvoApplications 2021, Held as Part of EvoStar 2021, Virtual Event, April 7–9, 2021, Proceedings: Springer International Publishing, 2021. [Google Scholar]


