

Abstract
Background
The co-existence of undernutrition and overnutrition is a global public health threat. We aim to report the burden of both nutritional deficiency (Protein-Energy Malnutrition) and overweight (high Body Mass Index) in Nepal over a decade (2010–2019) and observe the changes through trend charts.
Methods
We did a secondary data analysis using the Institute for Health Metrics and Evaluation (IHME)’s Global Burden of Disease (GBD) database to download age-standardized data on Protein Energy Malnutrition (PEM) and high Body Mass Index (BMI). We presented the trend of death, Disability Adjusted Life Years (DALYs), Years of Life Lost (YLL), and Years Lost due to Disability (YLD) of PEM and high BMI in Nepal from 2010 to 2019 and also compared data for 2019 among South Asian countries.
Results
Between 2010 and 2019, in Nepal, the Disability Adjusted Life Years (DALYs) due to PEM were declining while high BMI was in increasing trend. Sex-specific trends revealed that females had higher DALYs for PEM than males. In contrast, males had higher DALYs for high BMI than females. In 2019, Nepal had the highest death rate for PEM (5.22 per 100,000 populations) than any other South Asian country. The burden of PEM in terms of DALY was higher in under-five children (912 per 100,000 populations) and elderly above 80 years old (808.9 per 100,000 populations), while the population aged 65–69 years had the highest burden of high BMI (5893 per 100,000 populations). In the last decade, the DALYs for risk factors contributing to PEM such as child growth failure (stunting and wasting), unsafe water, sanitation and handwashing, and sub-optimal breastfeeding have declined in Nepal. On the contrary, the DALYs for risk factors contributing to high BMI, such as a diet high in sugar-sweetened beverages, a diet high in trans fatty acid, and low physical activity, have increased. This could be a possible explanation for the increasing trend of high BMI and decreasing trend of PEM.
Conclusion
Rapidly growing prevalence of high BMI and the persistent existence of undernutrition indicate the double burden of malnutrition in Nepal. Public health initiatives should be planned to address this problem.
Introduction
The co-existence of undernutrition and overnutrition is a global public health threat. Adults with obesity are at increased risk of developing non-communicable diseases such as diabetes, hypertension, stroke, cardiovascular diseases, and some forms of cancer [1]. On the other hand, being underweight is linked with consequences such as premature mortality, infirmities, impaired intellectual development, and poor self-rated health and well-being [2]. In 2016, 1.9 billion adults aged 18 years and above were overweight or obese, whereas 462 million adults were underweight globally [3]. Around 33% of the world’s population suffers from at least one form of malnutrition like wasting, stunting, vitamin and mineral deficiencies, overweight, and obesity [4]. Along with the health impacts, malnutrition also has serious consequences on countries’ social and economic development. Mortality and morbidities due to malnutrition could cost almost US$3.5 trillion annually, of which US$2.5 trillion is covered by undernutrition and micronutrient deficiency while US$1.4 trillion by overweight and obesity-related non-communicable diseases, which have a direct loss in human capital and productivity [5].
This double burden of malnutrition has been observed in many developing countries, including countries in South Asia, including Nepal [6–9]. In South Asian countries, the prevalence of underweight among children aged 24 to 59 months was 37%, 38%, 19%, 28%, and 29% in Bangladesh, India, Maldives, Nepal, and Pakistan, respectively. The prevalence of overweight amongst children was higher in Pakistan (7%) and Maldives(9%) and lower in Nepal, India, and Bangladesh (between 2% and 4%) [10, 11]. The Global Nutrition Report estimated that 17.4% of female and 16% of male adults in Nepal were underweight in 2016, while 22.8% of females and 19.1% of male adults were overweight in the same year [12]. The National Demographic and Health Survey (NDHS) 2016 reported the prevalence of underweight as 19.2% and the prevalence of overweight as 18.2% among Nepali adults [13].
Historically, significant focus in Nepal has been given to curbing undernutrition due to its high prevalence, and overnutrition is not given much attention. The NDHS, which is done every five years, started collecting overweight measures only since 2016; also the NDHS 2021 report has not been published yet, so there are not enough data points to observe a trend [14]. In this study, we used the Global Burden of Disease(GBD) database to analyze the trend of undernutrition and overnutrition in Nepal over a decade (2010–2019). We used Protein-Energy malnutrition, a primary form of malnutrition in Nepali children [15], as a measure of undernutrition and high Body Mass Index (BMI) as a measure of overnutrition. We further analyzed the trend by gender and additionally compared the burden with other South Asian countries. The findings from this study will help to observe trends in both forms of malnutrition in Nepal and help policymakers develop comprehensive nutrition strategies in Nepal that address the double burden of malnutrition.
Methods
Data source
We did a secondary data analysis using the Institute for Health Metrics and Evaluation’s (IHME) Global Burden of Diseases (GBD) database available online through the GBD results tool. The GBD contains estimates of the burden of diseases, including incidence, mortality, prevalence, years of life lost due to premature mortality(YLL), years lived with disability (YLD), and disability-adjusted life years (DALY) of various illnesses and injuries for 195 countries. GBD defines high BMI in adults 20 years and older as BMI greater than 20–25 kg/m2 and in children 19 years and younger as being obese or obesity as per International Obesity Task Force standards. They define PEM as a health loss associated with moderate and severe acute wasting [16, 17]. The detailed description of metrics, data collection procedures, and analytical approaches used for GBD are reported elsewhere [18]. The data input source tool of GBD showed a total of 9 high BMI-related research articles and 4 PEM-related articles used to create GBD estimates for Nepal [19].
Analysis
We downloaded the estimates and their 95% confidence interval for age-standardized deaths, Disability-Adjusted Life Years (DALYs), Years of Life Lost (YLL), Years Lost to Disability (YLD), rates per 100,000 population for Protein Energy Malnutrition (PEM), and high Body Mass Index (BMI) for Nepal from 2010–2019 in.csv format. We repeated the same data extraction procedure for other South Asian countries as comparators, including India, Bangladesh, Bhutan, Pakistan, Sri Lanka, Maldives, and Afghanistan. We used Microsoft Excel to create tables and figures. The download data steps with our comparison analysis and charts are included in the S1 File.
In this article, we present the trend of death, DALYs, YLL, and YLD of PEM, and high BMI in Nepal from 2010–2019 and compare data of 2019 among South Asian countries. We also presented changes in DALYs due to various risk factors in Nepal from 2010 to 2019.
Results
Fig 1 illustrates the trend in DALYs for PEM and high BMI in Nepal. Between 2010 to 2019, the DALYs due to PEM is declining, while the DALYs due to high BMI are increasing. The DALYs for PEM has dropped from 390 per 100,000 population in 2010 to 208 per 100,000 population in 2019. Meanwhile, the DALYs for High BMI has increased steadily from 953 in 2010 to 1354 per 100,000 population in 2019. Sex-specific trends revealed that females had higher DALY for PEM than males in the past decade. In contrast, males had higher DALYs for high BMI than females in the past decade.
Fig 1. Trend of DALY for Protein Energy Malnutrition and High Body Mass Index in Nepal (2010–2019).

Table 1 compares the death rate, DALYs, YLDs, and YLLs\ related to PEM and high BMI in Nepal with other South Asian countries. Although PEM was declining, Nepal had the highest death rate(5.22 per 100,000 population) for PEM than other South Asian countries. DALY for PEM in Nepal was slightly lower than the South Asia average but higher than Bangladesh, Bhutan, Sri Lanka, and the Maldives. With high BMI, Nepal had a higher death rate and DALY than Bangladesh and Maldives but lower than Bhutan, India, Pakistan, Sri Lanka, and Afghanistan. Among the South Asian countries, Pakistan had the highest DALYs (287.44 per 100,000) due to PEM, while Afghanistan had the highest death (177.28 per 100,000) and DALYs (5098.61 per 100,000) due to high BMI.
Table 1. DALY, YLL, YLD, Death for PEM and High BMI among South Asian countries (2019).
| Protein Energy Malnutrition (PEM) rates per 100,000 population (95% CI) |
High Body Mass Index (BMI) rates per 100,000 population (95% CI) |
|||||||
|---|---|---|---|---|---|---|---|---|
| Location | Death | DALY | YLD | YLL | Death | DALY | YLD | YLL |
| South Asia | 1.68 (2.21–1.23) | 217.60 (275.54–167.94) | 106.91 (150.39–68.02) | 110.68 (150.02–77.87) | 52.0 (77.93–30.92) | 1769.15 (2440.57–1043.51) | 373.15 (571.24–215.54) | 1356.58 (1945.68–812.62) |
| Nepal | 5.22 (6.86–3.89) | 208.01 (274.82–154.06) | 45.94 (66.65–29.22) | 162.06 (228.40–114.11) | 42.14 (70.53–20.02) | 1354.33 (2144.73–707.98) | 310.15 (497.09–157.17) | 1044.18 (1689.75–510.56) |
| Bangladesh | 2.03 (2.70–1.42) | 139.97 (193.56–98.33) | 46.17 (65.07–29.04) | 93.79 (144.50–55.63) | 33.29 (56.83–15.18) | 1149.48 (1836.28–590.90) | 233.99 (389.63–117.07) | 915.49 (1489.42–452.11) |
| Bhutan | 0.51 (1.23–0.18) | 83.61 (141.93–50.51) | 46.83 (70.61–28.17) | 36.77 (94.71–12.86) | 55.74 (87.03–27.83) | 1733.59 (2601.51–972.05) | 385.60 (597.06–217.41) | 1347.98 (2088.36–726.66) |
| India | 1.18 (1.77–0.77) | 208.04 (274.31–153.14) | 125.37 (176.17–79.73) | 82.67 (127.20–52.79) | 51.59 (75.68–30.12) | 1697.83 (2370.73–1015.12) | 383.16 (585.03–223.20) | 1314.66 (1909.49–784.11) |
| Pakistan | 3.50 (4.84–2.40) | 287.44 (388.80–209.55) | 56.24 (79.84–36.34) | 231.20 (327.84–154.47) | 92.24 (141.10–51.29) | 2777.63 (4165.90–1605.49) | 447.23 (699.17–245.93) | 2330.39 (3548.34–1308.63) |
| Sri Lanka | 0.76 (1.01–0.57) | 142.87 (196.35–96.13) | 129.49 (183.10–81.61) | 13.38 (17.94–10.01) | 66.84 (104.80–36.77) | 2073.38 (3078.99–1210.16) | 659.88 (989.68–369.35) | 1413.49 (2195.84–791.38) |
| Afghanistan | 2.38 (3.61–1.57) | 202.04 (300.72–137.94) | 37.0 (52.28–23.27) | 165.04 (262.13–102.69) | 177.28(256.14–109.10) | 5098.61 (7244.70–3230.86) | 670.18 (985.84–413.34) | 4428.42 (6447.93–2732.61) |
| Maldives | 1.28 (1.61–0.98 | 185.89 (261.52–124.41) | 161.83 (237.78–101.59) | 24.06 (30.78–18.86) | 35.54 (58.66–17.96) | 1229.06 (1838.10–699.19) | 376.09 (591.59–204.21) | 852.97 (1307.06–467.49) |
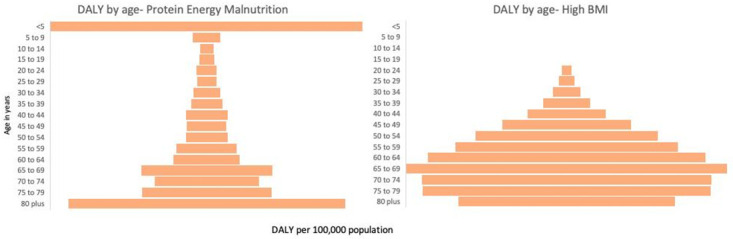
Fig 2 presents the age-wise distribution of DALYs for PEM and high BMI in Nepal in 2019, respectively. The burden of PEM in terms of DALYs was higher in under-five children and elderly above 80 years old while lowest in 10–14 years old (40.6 per 100,000 population). The rate of PEM started to decrease in the population above five years but began to increase consistently after the age of 50. In the case of high BMI, children below 19 years had a low burden, while the population aged 65–69 had the highest burden (5893 per 100,000 population). The rate of high BMI is observed to increase with the increase in age.
Fig 2. Age-Wise distribution of DALY for PEM and High BMI in Nepal (2019).
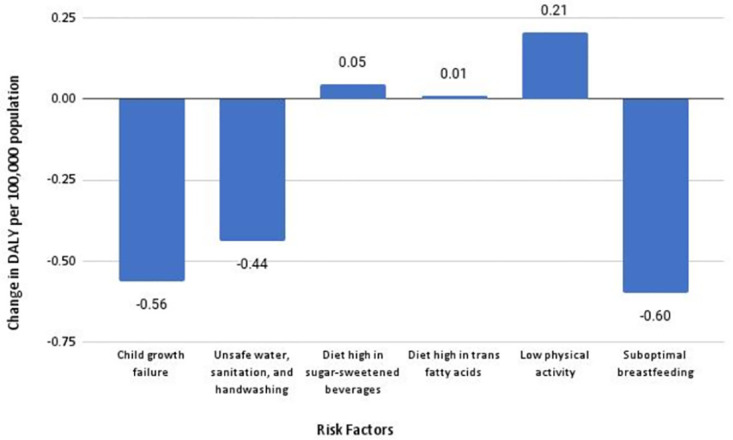
In Fig 3, we noticed a pattern of various contributing risk factors over the past decade in Nepal. Over the past decade, the DALYs for child growth failure (stunting and wasting), unsafe water, sanitation and handwashing, and sub-optimal breastfeeding, which are often associated with PEM, have declined. On the contrary, the DALYs for a diet high in sugar-sweetened beverages, a diet high in trans fatty acid, and low physical activity, which are often associated with high BMI, have increased.
Fig 3. Change in DALY due to various risk factors in Nepal between 2010–2019.
Discussion
Using the GBD data, we examined the trend of malnutrition (both protein-energy malnutrition and high body mass index) for the past ten years in Nepal. The findings of our study provide evidence for the existence of a dual burden of malnutrition. The pattern of undernutrition is declining; however, a significant population is still underweight. Meanwhile, overweight and obesity are becoming dominant forms of malnutrition, indicating a shift in the nutritional trend.
Prior studies in South Asian countries show consistent findings of the double burden of malnutrition with our study. A Bangladeshi study showed that 30% of the adults were underweight, 18.9% overweight, and 4.6% obese [20, 21]. Likewise, in 2012–13, a study in Pakistan indicated 13% undernutrition and 25% overweight in women [22]. A study in India also suggested that the high prevalence of undernutrition coexisted with overweight and obesity [2].
Our results examined that the trend of undernutrition is declining in Nepal. This is in line with studies in India and Nepal that showed that underweight among adults decreased by almost 15% [2] and stunting in under-five children decreased by 18% in urban settings [23]. Between 2006 to 2016, the NDHS reported a declining stunting prevalence among Nepali children from 39% to 29% and wasting from 49% to 36%.
From 2010 to 2019, we noticed a sharp rise in the rates of overweight and obesity in Nepal and other South Asian countries. India also showed an increasing pattern of obesity [24, 25]. From 1980 to 2013, the rate of obesity in South Asia increased by 5% [26]. Prevalence of obesity among women of reproductive age also increased by 6.2% in Bangladesh, 8.5% in Nepal, and 4.2% in India from 1996 to 2006 [27].
The findings of our study are also important as they highlight that women are at a higher risk of being undernourished than men. Gender disparity is observed in previous studies, showing that globally, women are more likely to be undernourished [28–30]. In the context of developing countries like Nepal, women’s reproductive health, poverty, lack of education, low social status, low access to health and social services, household work patterns, gender disparities, and socio-economics disparities are the possible reasons for women’s vulnerability towards suffering from malnourishment [31]. Though our study showed higher BMI in males than females, a few studies comparing obesity across countries show contrasting findings that the prevalence of obesity is typically higher in females [32–34].
We have found that the older population above 80 years was at more risk of being underweight. Possible explanations for this include aging is associated with loss of appetite, decrease in taste and smell, less physical activity, psychological disorders, deteriorating dental health causing difficulty in eating a variety of food, and chewing problems that can interfere with nutritional status resulting in malnourishment [35]. Our study also showed that under-five children were at higher risk of undernutrition. The lesser the age of children, the higher the risk of undernutrition [36–38]. Children under 12 months were twice as likely to be stunted than children aged 24 to 36 months [37]. Low household income, mother’s educational status, antenatal checkup, the health-seeking practice of mothers, diarrhea and respiratory infections within one month of birth, and mother’s nutritional status have been cited as the major associated factors for under-five malnutrition [38, 39].
Our study is the first to identify the trends in the dual burden of malnutrition among Nepalese over an extended period. We acknowledge that a large-scale primary data collection effort would have been the best approach to capture this trend in Nepal. In the absence of such, we have attempted this analysis through the Global Burden of Disease database. Our study is able to show the trend but is limited to offering explanations for such trends. Additional studies on various risk factors contributing to malnutrition in Nepal will be needed to identify areas of intervention.
Policy implications
Our analysis has a few policy implications. First, observing the high burden of undernutrition, along with a rapidly increasing trend of DALYs associated with high BMI, the government and non-governmental key stakeholders should think of revising the existing policies to curb the double burden of nutrition in Nepal. Second, the increasing prevalence of overweight/ high BMI shows that either the current policies are ineffective or there is a lack of concrete policies and programs to support healthy lifestyle adoption for Nepali people. Since the risk for other chronic diseases and the subsequent costs associated with being overweight or obese are high, a low-income country like Nepal should timely intervene in this burgeoning problem. Third, with disparities associated with overweight and underweight being much starker by gender and age groups, there is a high need for targeted interventions. Fourth and more importantly, the concerned stakeholders should generate robust evidence on direct and indirect factors associated with overweight and underweight at federal, provincial, and local levels to effectively formulate policies to curb malnutrition at different levels.
Conclusion
Our study provides evidence for the co-existence of undernutrition and overnutrition in Nepal. Nepal is going through a nutritional transition where undernutrition is declining but still prevalent, while obesity/overweight is increasing steadily. Undernutrition is higher in females, while high BMI is higher in males. The prevalence of overweight/obesity is low in under-five children, but undernutrition remains highest in that age group. The dual burden of malnutrition is alarming and should be taken into consideration. Public health interventions should be planned to emphasize a healthy diet and lifestyle. Our findings also substantiate the need for nutritional strategies that address the situation of dual burden of malnutrition in Nepal.
Supporting information
(XLSX)
Data Availability
Our study included use of aggregated third party data publicly available from the IHME GBD database. The Global Burden of Disease data are freely available to download from the GBD results tool (https://ghdx.healthdata.org/gbd-results-tool). A user account is not needed. Researchers can select the required year, sex, age group, location, metrics, measures, causes, and risk factors of their interest. Once the selections have been made, the data can be downloaded in CSV file format by providing a valid email address. When the file is ready for download, the website sends an email with the link to download the data. The downloaded data can easily be opened in Excel for analysis or other statistical software.
Funding Statement
The author(s) received no specific funding for this work.
References
- 1.Shafique S, Akhter N, Stallkamp G, de Pee S, Panagides D, Bloem MW. Trends of under- and overweight among rural and urban poor women indicate the double burden of malnutrition in Bangladesh. International Journal of Epidemiology. 2007. pp. 449–457. doi: 10.1093/ije/dyl306 [DOI] [PubMed] [Google Scholar]
- 2.Dutta M, Selvamani Y, Singh P, Prashad L. The double burden of malnutrition among adults in India: evidence from the National Family Health Survey-4 (2015–16). Epidemiol Health. 2019;41. doi: 10.4178/epih.e2019050 [DOI] [PMC free article] [PubMed] [Google Scholar]
- 3.World Health Organization.Malnutrition.2021. https://www.who.int/news-room/fact-sheets/detail/malnutrition
- 4.WHO | Double burden of malnutrition. 2017. http://www.who.int/nutrition/double-burden-malnutrition/en/
- 5.Food and Agriculture Organization of the United Nations.Understanding the true cost of malnutrition.2014. https://www.fao.org/zhc/detail-events/en/c/238389/
- 6.Kolčić I. Double burden of malnutrition: A silent driver of double burden of disease in low–and middle–income countries. J Glob Health. 2012;2. doi: 10.7189/jogh.02.020303 [DOI] [PMC free article] [PubMed] [Google Scholar]
- 7.Oddo VM, Rah JH, Semba RD, Sun K, Akhter N, Sari M, et al. Predictors of maternal and child double burden of malnutrition in rural Indonesia and Bangladesh. Am J Clin Nutr. 2012. Apr;95(4):951–8. doi: 10.3945/ajcn.111.026070 [DOI] [PubMed] [Google Scholar]
- 8.Estecha Querol S, Iqbal R, Kudrna L, Al-Khudairy L, Gill P. The double burden of malnutrition and associated factors among south Asian adolescents: Findings from the global school-based student health survey. Nutrients. 2021. Aug;13. doi: 10.3390/nu13082867 [DOI] [PMC free article] [PubMed] [Google Scholar]
- 9.Jayawardena R, Byrne NM, Soares MJ, Katulanda P, Hills AP. Prevalence, trends and associated socio-economic factors of obesity in South Asia. Obes Facts. 2013;6(5):405–14. doi: 10.1159/000355598 [DOI] [PMC free article] [PubMed] [Google Scholar]
- 10.Ziraba AK, Fotso JC, Ochako R. Overweight and obesity in urban Africa: A problem of the rich or the poor? BMC Public Health. 2009;9: 465. doi: 10.1186/1471-2458-9-465 [DOI] [PMC free article] [PubMed] [Google Scholar]
- 11.Hossain FB, Shawon MSR, Al-Abid MSU, Mahmood S, Adhikary G, Bulbul MMI. Double burden of malnutrition in children aged 24 to 59 months by socioeconomic status in five South Asian countries: evidence from demographic and health surveys. BMJ Open. 2020. Mar 16;10(3):e032866. doi: 10.1136/bmjopen-2019-032866 [DOI] [PMC free article] [PubMed] [Google Scholar]
- 12.Global Nutrition Report. Country Nutrition Profiles. https://globalnutritionreport.org/resources/nutrition-profiles/asia/southern-asia/nepal/
- 13.Shrestha N, Mishra SR, Ghimire S, Gyawali B, Pradhan PMS, Schwarz D. Application of single-level and multi-level modeling approach to examine geographic and socioeconomic variation in underweight, overweight and obesity in Nepal: findings from NDHS 2016. Sci Rep. 2020. Feb 12;10(1):2406. doi: 10.1038/s41598-019-56318-w [DOI] [PMC free article] [PubMed] [Google Scholar]
- 14.Nepal Demographic and Health Survey 2016. https://www.dhsprogram.com/pubs/pdf/fr336/fr336.pdf
- 15.Gurung G. Social determinants of protein-energy malnutrition: need to attack the causes of the causes. J Health Popul Nutr. 2010. Jun;28(3):308–9. doi: 10.3329/jhpn.v28i3.5562 [DOI] [PMC free article] [PubMed] [Google Scholar]
- 16.Global Burden of Disease Study 2017 (GBD 2017). High body-mass index- Level 2 risk. https://www.healthdata.org/results/gbd_summaries/2019/high-body-mass-index-level-2-risk
- 17.Global Burden of Disease Study 2017 (GBD 2017). Protein-energy malnutrition—Level 3 cause. http://www.healthdata.org/results/gbd_summaries/2019/protein-energy-malnutrition-level-3-cause
- 18.THE LANCET. Global, regional, and national incidence, prevalence, and years lived with disability for 354 diseases and injuries for 195 countries and territories, 1990–2017: a systematic analysis for the Global Burden of Disease Study 2017. 2018 Nov. [DOI] [PMC free article] [PubMed]
- 19.Global Burden of Disease Study 2017 (GBD 2017) Data Input Sources Tool.http://ghdx.healthdata.org/gbd-2017/data-input-sources?locations=
- 20.Biswas T, Uddin MJ, Mamun AA, Pervin S, P Garnett S. Increasing prevalence of overweight and obesity in Bangladeshi women of reproductive age: Findings from 2004 to 2014. PLoS One. 2017. Jul 28;12(7):e0181080. doi: 10.1371/journal.pone.0181080 [DOI] [PMC free article] [PubMed] [Google Scholar]
- 21.Biswas T, Garnett SP, Pervin S, Rawal LB. The prevalence of underweight, overweight and obesity in Bangladeshi adults: Data from a national survey. PLoS One. 2017. May 16;12(5):e0177395. doi: 10.1371/journal.pone.0177395 [DOI] [PMC free article] [PubMed] [Google Scholar]
- 22.Janjua NZ, Mahmood B, Bhatti JA, Khan MI. Association of household and community socioeconomic position and urbanicity with underweight and overweight among women in Pakistan. PLoS One. 2015. Apr 2;10(4):e0122314. doi: 10.1371/journal.pone.0122314 [DOI] [PMC free article] [PubMed] [Google Scholar]
- 23.Nepali S, Simkhada P, Davies I. Trends and inequalities in stunting in Nepal: a secondary data analysis of four Nepal demographic health surveys from 2001 to 2016. BMC Nutr. 2019. Mar 4;5:19. doi: 10.1186/s40795-019-0283-x [DOI] [PMC free article] [PubMed] [Google Scholar]
- 24.Luhar S, Mallinson PAC, Clarke L, Kinra S. Trends in the socioeconomic patterning of overweight/obesity in India: a repeated cross-sectional study using nationally representative data. BMJ Open. 2018. Oct 21;8(10):e023935. doi: 10.1136/bmjopen-2018-023935 [DOI] [PMC free article] [PubMed] [Google Scholar]
- 25.Verma M, Das M, Sharma P, Kapoor N, Kalra S. Epidemiology of overweight and obesity in Indian adults—A secondary data analysis of the National Family Health Surveys. Diabetes Metab Syndr. 2021. Jul-Aug;15(4):102166. doi: 10.1016/j.dsx.2021.06.003 [DOI] [PubMed] [Google Scholar]
- 26.IHME. Adult rates of overweight and obesity rise in Bangladesh. https://www.icddrb.org/dmdocuments/Bangladesh%20obesity%20release.pdf)
- 27.Balarajan Y, Villamor E. Nationally representative surveys show recent increases in the prevalence of overweight and obesity among women of reproductive age in Bangladesh, Nepal, and India. J Nutr. 2009. Nov;139(11):2139–44. doi: 10.3945/jn.109.112029 [DOI] [PubMed] [Google Scholar]
- 28.Crichton M, Craven D, Mackay H, Marx W, de van der Schueren M, Marshall S. A systematic review, meta-analysis and meta-regression of the prevalence of protein-energy malnutrition: associations with geographical region and sex. Age Ageing. 2019. Jan 1;48(1):38–48. doi: 10.1093/ageing/afy144 [DOI] [PubMed] [Google Scholar]
- 29.Kshatriya GK, Acharya SK. Gender Disparities in the Prevalence of Undernutrition and the Higher Risk among the Young Women of Indian Tribes. PLoS One. 2016. Jul 5;11(7):e0158308. doi: 10.1371/journal.pone.0158308 [DOI] [PMC free article] [PubMed] [Google Scholar]
- 30.Nour NN. Obesity in resource-poor nations. Rev Obstet Gynecol. 2010;3: 180–184. [PMC free article] [PubMed] [Google Scholar]
- 31.Elder L, Ransom E. Nutrition of Women and Adolescent Girls: Why It Matters.PRB.2003 Jul https://www.prb.org/resources/nutrition-of-women-and-adolescent-girls-why-it-matters/
- 32.Garawi F, Devries K, Thorogood N, Uauy R. Global differences between women and men in the prevalence of obesity: is there an association with gender inequality? Eur J Clin Nutr. 2014. Oct;68(10):1101–6. doi: 10.1038/ejcn.2014.86 [DOI] [PubMed] [Google Scholar]
- 33.Brooks R, Maklakov A. Sex differences in obesity associated with total fertility rate. PLoS One. 2010. May 12;5(5):e10587. doi: 10.1371/journal.pone.0010587 [DOI] [PMC free article] [PubMed] [Google Scholar]
- 34.Wells JC, Marphatia AA, Cole TJ, McCoy D. Associations of economic and gender inequality with global obesity prevalence: understanding the female excess. Soc Sci Med. 2012. Aug;75(3):482–90. doi: 10.1016/j.socscimed.2012.03.029 [DOI] [PubMed] [Google Scholar]
- 35.Hickson M. Malnutrition and ageing. Postgrad Med J. 2006. Jan;82(963):2–8. doi: 10.1136/pgmj.2005.037564 [DOI] [PMC free article] [PubMed] [Google Scholar]
- 36.Dahal K. Undernutrition and its determinants among under-five children of indigenous Thami population in Dolakha district, Nepal. International Journal of Child and Adolescent Health. 2020;13(1):97–105. [Google Scholar]
- 37.Shah SK. Prevalence of Undernutrition among Musahar Children Aged Between 12 To 59 Months in Urban Siraha District, Nepal. MOJ Public Health. 2016. doi: 10.15406/mojph.2016.04.00093 [DOI] [Google Scholar]
- 38.Paudel R, Gurung YB, Poudyal AK, Khatri B, Bhatta DR, Acharya D, et al. Socio-demographic and Healthcare-seeking Predictors of Undernutrition among Children Under-five Years of Age in a Western District of Nepal. Journal of Nepal Health Research Council. 2020. pp. 488–494. doi: 10.33314/jnhrc.v18i3.2875 [DOI] [PubMed] [Google Scholar]
- 39.Amare D, Negesse A, Tsegaye B, Assefa B, Ayenie B. Prevalence of Undernutrition and Its Associated Factors among Children below Five Years of Age in Bure Town, West Gojjam Zone, Amhara National Regional State, Northwest Ethiopia. Advances in Public Health. 2016;2016. doi: 10.1155/2016/7145708 [DOI] [Google Scholar]