

Abstract
Recent studies have demonstrated that regulatory T cells (Tregs) develop in the thymus via two pathways involving distinct Treg progenitors (TregP) - CD25+FOXP3− (CD25+ TregP) and CD25−FOXP3lo (FOXP3lo TregP) Treg progenitors. To examine this process in more detail we carried out single-cell RNA-Seq and TCR-Seq on sorted murine CD4+CD8+ double-positive (DP) thymocytes, CD4+ single -positive (CD4SP) thymocytes, CD25+FOXP3−CD73− TregP, CD25−FOXP3loCD73− TregP, newly generated mature CD25+FOXP3+CD73− Tregs and FOXP3+CD73+ recirculating/long-term resident Tregs (RT-Tregs). Sorted populations were individually hashtagged and then combined into one scRNA-Seq/TCR-Seq library before sequencing and subsequent analysis. We found that both CD25+ TregP and FOXP3lo TregP arise via an initial agonist activated state that gives rise to a second transitional stage before differentiating into mature Tregs. Using both scRNA-Seq and bulk RNA-Seq on sorted thymocyte subsets we demonstrate that CD25+ TregP are significantly enriched for Il2 production, suggesting that they are the major source of IL-2 needed to convert TregP into mature Tregs. Using TCR-Seq we found that several TCRs were clearly biased in favor of the conventional or Treg lineages, but that a large fraction of TCRs were found in both these lineages. Finally, we found that recirculating/resident Tregs in the thymus are not monomorphic but are composed of multiple distinct subsets and that these RT-Tregs express the most diverse TCR repertoire of all CD4SP thymocytes. Thus, our studies define multiple stages of Treg differentiation within the murine thymus and serve as a resource for future studies on CD4+ thymocyte development and Treg differentiation.
Introduction
Regulatory T cells (Tregs) play a critical role in preventing immune responses to self- or commensal-derived antigens, and in dampening immune responses to infections upon pathogen clearance (1, 2). Tregs also play critical roles in repairing damaged tissues following infections or injury (3). Finally, distinct types of Tregs are localized to different tissues where they play an important role in modulating the function of that tissue – for example, a subset of Tregs are known to affect metabolism in visceral adipose tissue (4, 5). The majority of Tregs develop in the thymus. Previous studies have begun to pick apart the mechanism by which Tregs develop in the thymus (1, 6, 7). However, a number of key outstanding questions remain. For example, although past studies have identified two distinct Treg progenitor (TregP) populations (CD25+FOXP3− and CD25−FOXP3lo)(6–9), the path by which CD4SP thymocytes differentiate into these TregP is still poorly defined. In addition, IL-2 produced by T cells is known to play a key role in converting TregP into mature CD25+FOXP3+ Tregs (10, 11). However, exactly which T cell subsets produce the IL-2 that drives this process remains unknown. Finally, a subset of mature Tregs that recirculate back to the thymus or are long-term thymic resident cells has been previously identified (12–15). However, these recirculating/resident Tregs also remain poorly characterized. Thus, multiple aspects of Treg differentiation in the thymus remain to be elucidated.
To better characterize the process by which Tregs differentiate in the thymus, we used scRNA-Seq and TCR-Seq to track Treg development in the thymus. Specifically, we used flow cytometry to isolate DP thymocytes and CD4SP thymocytes, as well as enriching for Treg progenitors (TregP), mature Tregs and recirculating/resident Treg populations. These populations were labeled with hashtag antibodies to allow us to track from which sorted population individual cells came from, and then pooled to generate single scRNA-Seq and TCR-Seq libraries. Our analysis established novel markers to characterize CD4SP maturation, identified new intermediate stages of Treg differentiation, and established unexpected diversity in the subset of recirculating/resident Treg population. In addition, TCR-Seq analysis demonstrated clear bias for some TCRs between the conventional and Treg lineages but also found significant but variable overlap between these populations for most TCRs.
Materials and Methods
Mice
Mice were housed in specific pathogen-free facilities at the University of Minnesota and experiments were conducted in accordance with protocols approved by the Institutional Animal Care and Use Committees of these respective institutions. Foxp3GFP (stock number 006772) were obtained from Jackson Laboratory while TCliβ x Tcra+/− mice have been described previously (16). Cells for single cell analysis were isolated from thymi of eight female mice, ranging from 45–56 days of age.
Sample preparation
Thymi were mechanically dissociated into 1xPBS with 2% FBS and 2mM ethylenediaminetetraacetic acid, pH 7.4 (Sort buffer) using frosted glass slides to create single cell suspensions. Single cell suspensions were passed through 70µm filters. As described in Figure 1a and Figure 2a, DP thymocytes were isolated from whole single cell suspensions while all other populations were isolated from thymocytes depleted of CD8+ and Ter119+ cells. Depletion was performed by incubating thymocytes with anti-CD8 and anti-Ter119 biotinylated antibodies followed by a wash and then binding to streptavidin microbeads (Miltenyi Biotec). Bound cells were washed then passed through 1 LS column/thymus suspension (Miltenyi Biotec). The flowthrough (enriched for CD4SP thymocytes) was collected, stained with fluorochrome conjugated antibodies and live-dead exclusion dye, and then denoted populations were sorted into separate tubes containing 1xPBS + 50% FBS on a FACS Aria II (BD Biosciences).
Sorted populations were spun down and resuspended in 100µl Sort buffer with 0.5µg of hashtag antibody (C0301-C0306, Biolegend) and incubated on ice for 30 minutes. Cells were washed 2 times in sort buffer prior to resuspension in 1xPBS with 5% FBS. All sorted cells were then mixed into a single tube at appropriate ratios before a wash and resuspension at 3000 cells/µl prior to capture for 10X Genomics Single Cell 5’ Solution and generation of one single-cell library (this approach eliminates concerns about batch effects that can occur when different library preps are compared).
Populations were sorted similarly for bulk RNA sequencing into RLT buffer with 2-mercaptoethanol. RNA was isolated from lysed cells using RNeasy Micro Spin Kit and libraries were prepared using SMARTer Stranded Total RNA-Seq Kit v2 - Pico Input Mammalian kit. These libraries were pooled and sequenced on a Novaseq S1 lane with 2 × 51-bp paired end reads.
Flow cytometry and antibodies
All flow cytometry analysis was conducted in the University of Minnesota Flow Cytometry Core Facility using BD LSR II and Fortessa cytometers (BD Biosciences). For surface staining, cells were stained for 20 min with fluorochrome-conjugated antibodies before washing and analysis or intracellular staining. Intracellular detection of FOXP3 was performed using the eBioscience Transcription Factor staining kit, with the fixation/perm incubation being performed at room temperature for 30 minutes and the intracellular staining being performed in 1xPermeablization buffer for 30 minutes at room temperature. Antibodies to mouse- CD4 (BV786- GK1.5- Biolegend, BV650- L3T4- Biolegend- 1:200), CD8 (BV786– 53-6.7- BD Biosciences, Biotin- 53–6.7- Tonbo Biosciences- 1:200), Ter119 (BD Biosciences, 1:200), CD25 (PerCP-Cy5.5- PC61.5- Tonbo Biosciences, BV421-PC61.5- Biolegend- 1:200), FOXP3 (AF488- FJK-16s- eBiosciences- 1:100), CD73 (PE-Cy7- TY/11.8- Biolegend, eF450- TY/11.8-eBiosciences- 1:200), TCR Vα2 (APC- B20.1- eBiosciences), TIM3 (PE- RMT3–23- Biolegend, 1:100), TIGIT (PE- GIGD7- eBiosciences, 1:100), ST-2 (PerCP-eF710- RMST2–33- eBioscience, 1:100), LAG3 (PE- C9B7W- eBiosciences, 1:100) and Ghost Red 780 (Tonbo Biosciences, 1:1000) were used for flow cytometry analysis.
Single-cell RNA sequencing
The 10X Genomics Chromium Next GEM Single Cell 5’ Kit (v2) was used to measure (1) mRNA transcript expression (RNA), (2) mouse-specific hashtag oligos (HTO) and (3) single cell T-cell receptor sequence (TCR). To enhance TCRα chain CDR3 detection, given the fixed TCRβ allele, we only amplified the TCRα sequence using the following primer sets:
Mouse T cell Mix 1:
Forward Primer (2uM final concentration): 5’-AATGATACGGCGACCACCGAGATCTACACTCTTTCCCTACACGACGCTC-3’
Reverse Outer Primer (0.5uM final concentration): 5’-CTGGTTGCTCCAGGCAATGG-3’
Mouse T cell Mix 2:
Forward Primer (0.5uM final concentration): 5’-AATGATACGGCGACCACCGAGATCT-3’
Reverse Inner Primer (0.5uM final concentration): 5’-AGTCAAAGTCGGTGAACAGGCA-3’
The library was sequenced on the NovaSeq 6000 (Illumina). Raw and processed data are available through the GEO accession GSE195820 (scRNA-Seq data) and GSE202871 (bulk RNA-Seq); the scRNA-Seq data in Figure 5c was previously deposited under GEO accession number GSE123067 (https://www.ncbi.nlm.nih.gov/geo/).
Single cell bioinformatic analyses
The 10X Genomics Cell Ranger (v3.1.0) software was used to demultiplex GEX and HTO sequences (‘mkfastq’) and map reads (mm10–3.0.0) and quantify transcripts (‘count’) to create count tables. The raw count tables were loaded into R (v3.5.0) and analyzed with the Seurat package (3.1.1) (17). The first filtering step used the HTODemux Seurat function on a HTO sample-based dataset to remove multiplets (k = 16). After filtering for multiplets, raw counts from the 14,790 cells were log-normalized and principal component analysis was performed on the 2000 most variable genes. The top 30 PCA vectors were used as input for UMAP analysis. Cells were then clustered using a range of resolutions (0.1 – 1.2) and differential expression was performed between clusters (Wilcoxon rank sum test) to classify cell populations. At a resolution of 0.8, three clusters were identified that showed evidence of cell death (clusters 1, 13 and 15). The cells in these three clusters were removed from the dataset and the analysis described above was repeated on the remaining 12,208 cells. Cell populations were classified with this final dataset using a resolution of 1.0. The VDJ data was processed using custom R scripts to filter out only the T-cell receptor alpha amino acid sequences (CDR3). The TCR alpha sequence data was then merged with the final single cell gene expression data (Seurat R object).
The Sigclust2 program was used to test the statistical significance of the hierarchical clustering (18) of the single cell RNA sequencing based on the mature vs immature CD4SP (cluster 1 vs cluster 2) positive gene list (Supplementary Table 1).
Bulk RNA-Seq bioinformatic analysis
Read mapping and quantification were performed using a custom MSI pipeline (19). In brief, fastq files were aligned to the GRCm38 reference genome using HiSAT2 (v.2.1.0)(20). The subread (V.1.4.6) featureCounts program (21) was used for quantification of aligned reads using the version 97 GRCm38 gtf from Ensembl (22). Following the CHURP pipeline, differential expression testing and pathway analysis were performed in R (v.3.5.2) (23). Count data were filtered to only keep genes that had a cpm (counts per million) value greater than 1 cpm in at least two samples across all experimental conditions. The quasi-liklihood test method was used to evaluate differential expression with edgeR (v.3.24.3) (24, 25). Gene set enrichment analysis and GO term enrichment analysis were conducted using the ClusterProfiler package (V 3.2.1) (26). Volcano plots were created with ggplpot2 (v 3.2.1)(27).
Results
Identification of developing thymocyte and Treg cell populations in the thymus
To better understand the developmental progression of Treg cells in the thymus we performed single-cell RNA sequencing on the following FACS isolated cell populations: (1) CD73lo- double positive (DP), (2) CD4 single positive (CD4+CD8−CD73−CD25−FOXP3−; ie, CD4SP), (3) CD25+ TregP (CD4+CD8−CD73−CD25+FOXP3−), (4) FOXP3lo TregP (CD4+CD8−CD73−CD25−FOXP3lo), (5) CD25+FOXP3+ Treg cells (CD4+CD8−CD73−CD25+FOXP3+) and (6) recirculating or resident thymic Treg cells (CD4+CD8−CD25+FOXP3+CD73int/hi; ie, RT-Treg). The marker CD73 was included as CD73− Treg cells in the thymus are virtually all newly generated de novo Tregs as opposed to long-term resident or recirculating Treg cells, while CD73+ Treg cells are substantially enriched for resident or recirculating Tregs (RT-Treg) (8). Cells were sorted from thymi from eight TCliβ x TCRα+/− x Foxp3GFP mice; DP thymocytes were sorted from whole thymus, while CD4+ thymocytes were sorted from cells depleted of CD8+ and Ter119+ cells. Following FACS isolation, each population was stained with a distinct oligo-labelled (hashtag) antibody cocktail, that recognizes CD45 and MHC-I, prior to mixing the six populations and creating a single 5’ scRNA-seq library (Figure 1a,b, Figure 2a). By enriching for rare Treg subsets we were able to better characterize stages of Treg differentiation although it is important to note that this distorts the normal frequency of these subsets in the UMAP plots shown in figure 1. To better evaluate changes in TCR repertoire we used mice with a fixed TCRβ “Tcliβ” (Trbv19) transgene and sorted only cells that expressed TCR Vα2 (encoded by Trav14) on the cell surface. Following sequencing, sample processing for quality, and multiplet identification and removal using hashtag labels, the data set contained 12,208 single cells, of which 6982 cells had a CDR3 clonotype confidently identified, distributed across fifteen distinct clusters (Figure 1b–d). Cell cycle status, as determined by Seurat Cell-Cycle scoring, was not a major determinant of cell clustering outside of 3 small populations of proliferating cells (Figure 2b). These proliferating cells included contaminating CD4−CD8−CD25+ double-negative stage 2 and 3 thymocytes (DN2 and DN3), proliferating pre-selection DP thymocytes, and a small number of proliferating CD4SP cells. Hashtagged populations exhibited distinct distributions across clusters (Figure 1e). This data set contained clusters of known thymocyte and Treg cell lineage developmental stages but also novel cell populations.
Figure 1.

a. Sorting scheme describing which markers and hashtag antibodies were used to sort and identify, respectively, the thymocyte populations used in this analysis. b. UMAP plot showing distribution of single cells based on hashtag labeling. c. UMAP plot showing the identical single cell distribution as b but using bio-informatic analysis to identify similar clusters of cells. d. Representation of hashtag identities across the 15 clusters identified in the data set.
Figure 2.

a. Sorting scheme to isolate respective populations and post-sort representation for sorted populations. b. Projection of cell cycle status using Seurat cell cycle scoring.
Defining maturation signatures in the CD4 lineage
CD4SP thymocytes arise from DP thymocytes. Consistent with previous studies (28, 29) we were able to identify both pre-selection and post-selection DP thymocytes. We also identified two distinct clusters within the non-Treg subset of CD4SP thymocytes (Figure 3a). These subsets were termed immature and mature CD4SP based on known markers associated with CD4+ thymocyte maturation. First, the chemokine receptor Ccr9, which is expressed by DP thymocytes and downregulated following positive selection (30), is expressed at higher levels in immature CD4SP versus mature CD4SP, while Ccr7, which is associated with medullary localization of single positive thymocytes (31), is upregulated in mature CD4SP (Figure 3b,c). Second, known markers associated with thymocytes receiving positive selection signals, such as Itm2a, Cd5 and Cd69 (32, 33), are more highly expressed in the immature CD4SP cluster (Figure 3c). Third, the mature CD4SP cluster exhibits upregulation of H2-K1, a gene upregulated as thymocytes receive tonic IFN signaling during the maturation process (34) (Figure 3b,c). Fourth, cells in the mature CD4SP cluster upregulate the transcription factor Klf2 that drives S1pr1 upregulation to facilitate thymic egress (35)(Figure 3b,c). Finally, transcription factors important for CD4+ lineage commitment are elevated in immature CD4SP cluster cells including Zbtb7b (ThPOK), Tox, Gata3 and Satb1. In contrast, mature CD4SP cells have reduced expression of Zbtb7b (ThPOK), Tox and Gata3 and significantly downregulated Satb1 (Figure 3b,c).
Figure 3.

a. UMAP plot showing location of the Immature and Mature CD4 SP thymocyte subsets. b. Heatmap showing expression levels of top 10 most differentially expressed genes between immature and mature CD4SP thymocytes. c. Violin plots showing relative expression levels of genes involved in transcription, maturation, thymus localization, TCR signaling or thymic egress. All comparisons were significantly different with p≤10−6 (see Supplemental Table 1)
In addition to the previously identified markers of CD4SP thymocyte maturation described above, we also found other previously undescribed markers associated with immature or mature CD4SP thymocytes (see supplemental table 1 for a comprehensive list of all significantly differentially expressed genes). For example, Ms4a4b and Ms4a6b, which encode transmembrane adaptors thought to modulate T cell activation thresholds (36), are expressed in a majority of mature CD4SP cells while relatively few immature cells express these genes (Figure 3b,c), suggesting that expression of Ms4a4b and Ms4a6b are accurate proxies for CD4SP maturity. Similarly, Itgb7, an integrin that is typically associated with gut T cell homing when paired with integrin α4 (37), is expressed in mature but not immature CD4SP clusters (Figure 3c). Conversely, the brain-type creatine kinase, Ckb, is expressed more highly in immature CD4SP than mature CD4SP (Figure 3c). Thus, upregulation of Ms4a4b, Ms4a6b and Itgb7, and downregulation of Ckb are novel markers that discriminate between immature and mature CD4SP thymocytes.
Characterization of distinct agonist selection clusters
Treg cell commitment is initiated by signaling via the TCR when thymocytes react strongly to antigens found within the thymus. To understand this earliest stage of Treg cell commitment we analyzed our scRNA-Seq dataset for clusters enriched in TCR target genes, which revealed two distinct cell clusters (Figure 4a). These clusters, termed CD25+ TregP agonist (Cluster 7) and FOXP3lo TregP agonist (Cluster 12), were largely comprised of cells with hashtag antibodies derived from the CD25+FOXP3−CD73− and CD25−FOXP3loCD73− TregP sorted populations, respectively (Figure 1e). However, contributions from other hashtags were observed in each cluster, including CD25−FOXP3− CD4SP thymocytes, which presumably had not yet upregulated Il2ra or Foxp3, suggesting that the TCR activation signature can be observed transcriptionally prior to the expression of these two markers previously used to define TregP subsets (Figure 1e). The CD25+ TregP agonist cluster may have more cells undergoing negative selection, given their reduced expression of Bcl2 and increased expression of Bax (Supplemental Table 1). This agrees with our previous observation that CD25+ TregP express increased expression of pro-apoptotic markers than FOXP3lo TregP (8). This increased apoptotic phenotype in CD25+ TregP agonist cells could be due to a less mature phenotype in comparison to FOXP3lo TregP agonist cells. The FOXP3lo TregP agonist cluster exhibits higher expression of several maturation markers, including Ms4a4b, Ms4a6b, Itgb7, S1pr1, Klf2, Sell, as well as a number of IFN stimulated genes (ISGs), consistent with the upregulation of ISGs in response to tonic IFN stimulation during thymocyte maturation (Supplemental Table 1). Interestingly, these two agonist selection clusters also exhibited differential upregulation of several TCR target genes, as well as a number of maturation markers. Cells in the FOXP3lo TregP agonist cluster have increased expression of Nr4a1 and Egr1 while CD25+ TregP agonist cells expressed more Tnfrsf9 (41BB) and Ikzf2 (Figure 4b–d). Although this appears to contradict our previously published findings (8) that CD25+ TregP exhibit higher levels of NUR77 than FOXP3lo TregP, it is important to note that we are comparing different types of cells in these two studies. CD25+ TregP agonist cells make up the majority of the CD25+ TregP subset (which is comprised of agonist and post agonist cells) while the FOXP3lo TregP agonist cluster represents a very small fraction of total FOXP3lo TregP cells. This points to an unexpected finding that at least some FOXP3lo TregP cells receive quite strong signals via their TCR. Thus, we can identify two clusters of cells receiving agonist selection signals and entering into either CD25+ or FOXP3lo TregP lineages that are transcriptionally distinct. It is important to note that the majority of cells with an agonist selection signature are found within the CD25+ TregP population, supporting the idea that CD25+ TregP cells contain more cells interacting strongly with thymic antigens than FOXP3lo TregP (8) (Figure 1e).
Figure 4.

a. UMAP plot showing location of the CD4+CD25+ TregP agonist and CD4+FOXP3lo TregP agonist thymocyte subsets. b. Heatmap showing expression levels of top 10 most differentially expressed genes between CD4+CD25+ TregP agonist and CD4+FOXP3lo TregP agonist thymocyte subsets. c. UMAP feature plot showing relative expression levels of Nr4a1. d. Violin plots showing relative expression levels of Egr1, Nr4a1, Ikzf2 and Tnfrsf9 between CD4+CD25+ TregP agonist and CD4+FOXP3lo TregP agonist thymocyte subsets. All comparisons were significantly different with p≤10−15 (see supplemental table 1).
CD25+ TregP cells receiving TCR stimulation produce IL-2
The final step in Treg cell differentiation in the thymus relies on IL-2, or to a lesser extent IL-15, mediated activation of STAT5 and upregulation of CD25 and FOXP3 (38–42). Previous studies have searched for the population of cells within the thymus that makes IL-2 to facilitate this second step with T cells emerging as the most important source driving Treg cell development (10, 11). However, the precise population of T cells that make IL-2 remains elusive. Recently, it was observed that self-reactive CD4+CD25+ thymocytes, not mature T cells, were the likely source of IL-2 in the thymus (10), but whether this came from developing CD25+ TregP or just recirculating activated CD4+CD25+CD73+ effector T cells was unclear. We first took a bulk RNAseq approach to determine which population of CD4+ thymocytes were capable of producing IL-2. We found that CD25+ TregP cells expressed detectable Il2 transcripts while non-Treg lineage CD4SP, FOXP3lo TregP (Figure 5a) and mature Treg cells did not (Supplemental Table 2). Given this observation we queried our scRNAseq data set for IL-2 expression and found that the highest expression could be found within CD25+ TregP undergoing agonist selection (Figure 5b); similar results were observed in an independent scRNA-Seq experiment of CD25+ TregP (Figure 5c). The number of cells making Il2 was quite low, which is consistent with the concept that developing TregP compete for limiting amounts of IL2 to complete their maturation (42). Thus, CD25+ TregP can provide the IL2 needed to complete the conversion of TregP cells into mature Tregs.
Figure 5.

a. Volcano plot of bulk RNA-Seq data showing number of genes differentially expressed between sorted CD4SP thymocytes and CD25+ TregP (top) or CD25+ TregP and FOXP3lo TregP (bottom); Il2 gene expression are significantly enriched in CD25+ TregP versus both CD4SP and FOXP3lo TregP. b. UMAP plots showing distribution of distinct thymocyte subsets (top panel) and feature plot showing cells expressing Il2 (bottom panel). c. (top) UMAP plots showing distribution of Il2 expression, (middle) clustering designations and top 10 differential genes (bottom) in the repeat single cell RNAseq experiment with sorted CD25+ TregP.
Each TregP population is comprised of an agonist selection and transitional cluster
The majority of cells from each sorted TregP population (CD25+FOXP3−CD73− TregP and CD25−FOXP3loCD73− TregP) are distributed across two clusters, the agonist selection cluster and an intermediate post-agonist cluster (Figure 6a). For CD25+ TregP the agonist selection cluster is a considerably larger component of the population while for FOXP3lo TregP the intermediate post-agonist population is dominant. Both intermediate post agonist populations appear more mature than their respective agonist selection clusters as evidenced by higher expression of Itgb7, Klf2 and Ms4a4b and lower expression of Cd24 on the post agonist cells (Figure 6b). Additionally, when we performed hierarchical clustering of the entire data set, the post-agonist clusters were more similar to the more mature subsets (mature CD4SP, mature de novo Treg and RT-Treg) while agonist clusters were more similar to immature CD4SP (Figure 5c). FOXP3lo TregP agonist cells clustered with CD25+ TregP post-agonist cells highlighting their increase in maturity versus CD25+ TregP cells receiving agonist stimulation (Figure 6c). Tnfrsf9 and Nr4a1, surrogates of TCR stimulation, are reduced in the intermediate post agonist clusters compared to the agonist clusters (Figure 6d), suggesting the intermediate populations are no longer receiving strong TCR stimulation. Il2rb and Tnfrsf18, previously used in tandem to label more committed TregP (6, 7), are indeed upregulated in the intermediate post agonist clusters relative to the agonist selection clusters (Figure 6d). An important caveat is that while our data suggest a trajectory from agonist TregP to post agonist TregP to mature Treg, it remains possible that some of the TregP cells fail to complete differentiation and either undergo apoptosis or revert to a CD25−FOXP3− CD4+ T cell state. Nevertheless, multiple well characterized markers of maturation provide evidence that cells in the agonist clusters precede the post-agonist stages.
Figure 6.

a. UMAP plot showing location of the CD4SP, CD4+CD25+ TregP agonist and post agonist, CD4+FOXP3lo TregP agonist and post agonist, and mature Treg thymocyte subsets. b. Violin plots showing differential expression of Itgb7, Klf2, Cd24a, and Ms4a4b. c. Hierarchical clustering of cell clusters in single cell RNAseq dataset. Statistically significant branch points are indicated in red and include the associated p-value. d. Violin plots showing differential expression between genes involved in cytokine signaling, TCR signaling and Treg signature. Statistical analysis of pairwise comparisons can be found in supplemental table 1.
Il2rb and Tnfrsf18 upregulation both function to increase IL-2 signaling and sensitivity (43). However, Cish and Socs1, canonical STAT5 targets, are only upregulated in the mature Treg cell cluster and not upregulated in the intermediate post agonist population (Figure 6d). Interestingly, the CD25+ TregP post agonist cluster downregulated Il2ra transcripts despite being sorted on CD25 protein expression (Figure 6d). Il2ra is upregulated by TCR and cytokine stimulation. Thus, loss of Il2ra expression in post-agonist cells may represent a loss of TCR driven Il2ra expression prior to upregulation via STAT5 activation during the final stage of Treg cell differentiation. For both pathways, Treg core genes, Foxp3, Il2ra and Tnfrsf18, are all more highly expressed in mature Treg cells than the post agonist populations (Figure 6d). Finally, previous studies have found that FOXO1 expression (which can induce Foxp3) precedes expression of FOXP3 in mature Tregs suggesting it is a key step in Treg differentiation (44). Consistent with this observation, we found that Foxo1 was expressed at low levels in the CD25+ TregP agonist subset but significantly increased in the CD25+ TregP post agonist subset prior to adopting the CD25+FOXP3+ mature Treg state. In contrast, Foxo1 levels were not significantly different between the FOXP3lo TregP agonist and post-agonist populations. This is perhaps not surprising as the FOXP3lo TregP agonist subset already expresses low levels of FOXP3. Collectively, these data support a developmental trajectory for both TregP populations comprised of an initial commitment via agonist selection, followed by an intermediate population with increased cytokine responsiveness, prior to cytokine stimulation and completion of Treg differentiation.
RT-Treg cells exhibit considerable heterogeneity
While our dataset had few mature Treg cells derived from the CD73− Treg hashtag, we did have CD73lo cells from the CD73+ hashtag that augment this de novo developing Treg population. We did not observe any dramatic differences in the de novo developing Treg cluster between the resolution analyzed throughout the text (1.0) and the 20th resolution (1.9) analyzed (Figure 1c, Figure 7a). Finally, we use the Clustree analysis tool to rigorously determine any breakdown of the de novo developing Treg cluster. Clustree analyzes the relationship of clusters over a range of resolutions, in this case 0–1.9, and displays this as a hierarchical tree with arrows indicating the relatedness and contributions of clusters from one resolution to the next. Clustree analysis further supported the stability of the de novo development Treg cluster with little mixing between the de novo developing Treg cluster and other clusters throughout the 20 resolutions analyzed (Figure 7b). Thus, despite developing from two distinct progenitor pathways and differentiating into numerous Treg types in the periphery, Treg cells in the thymus converge on a single, stable phenotype.
Figure 7.
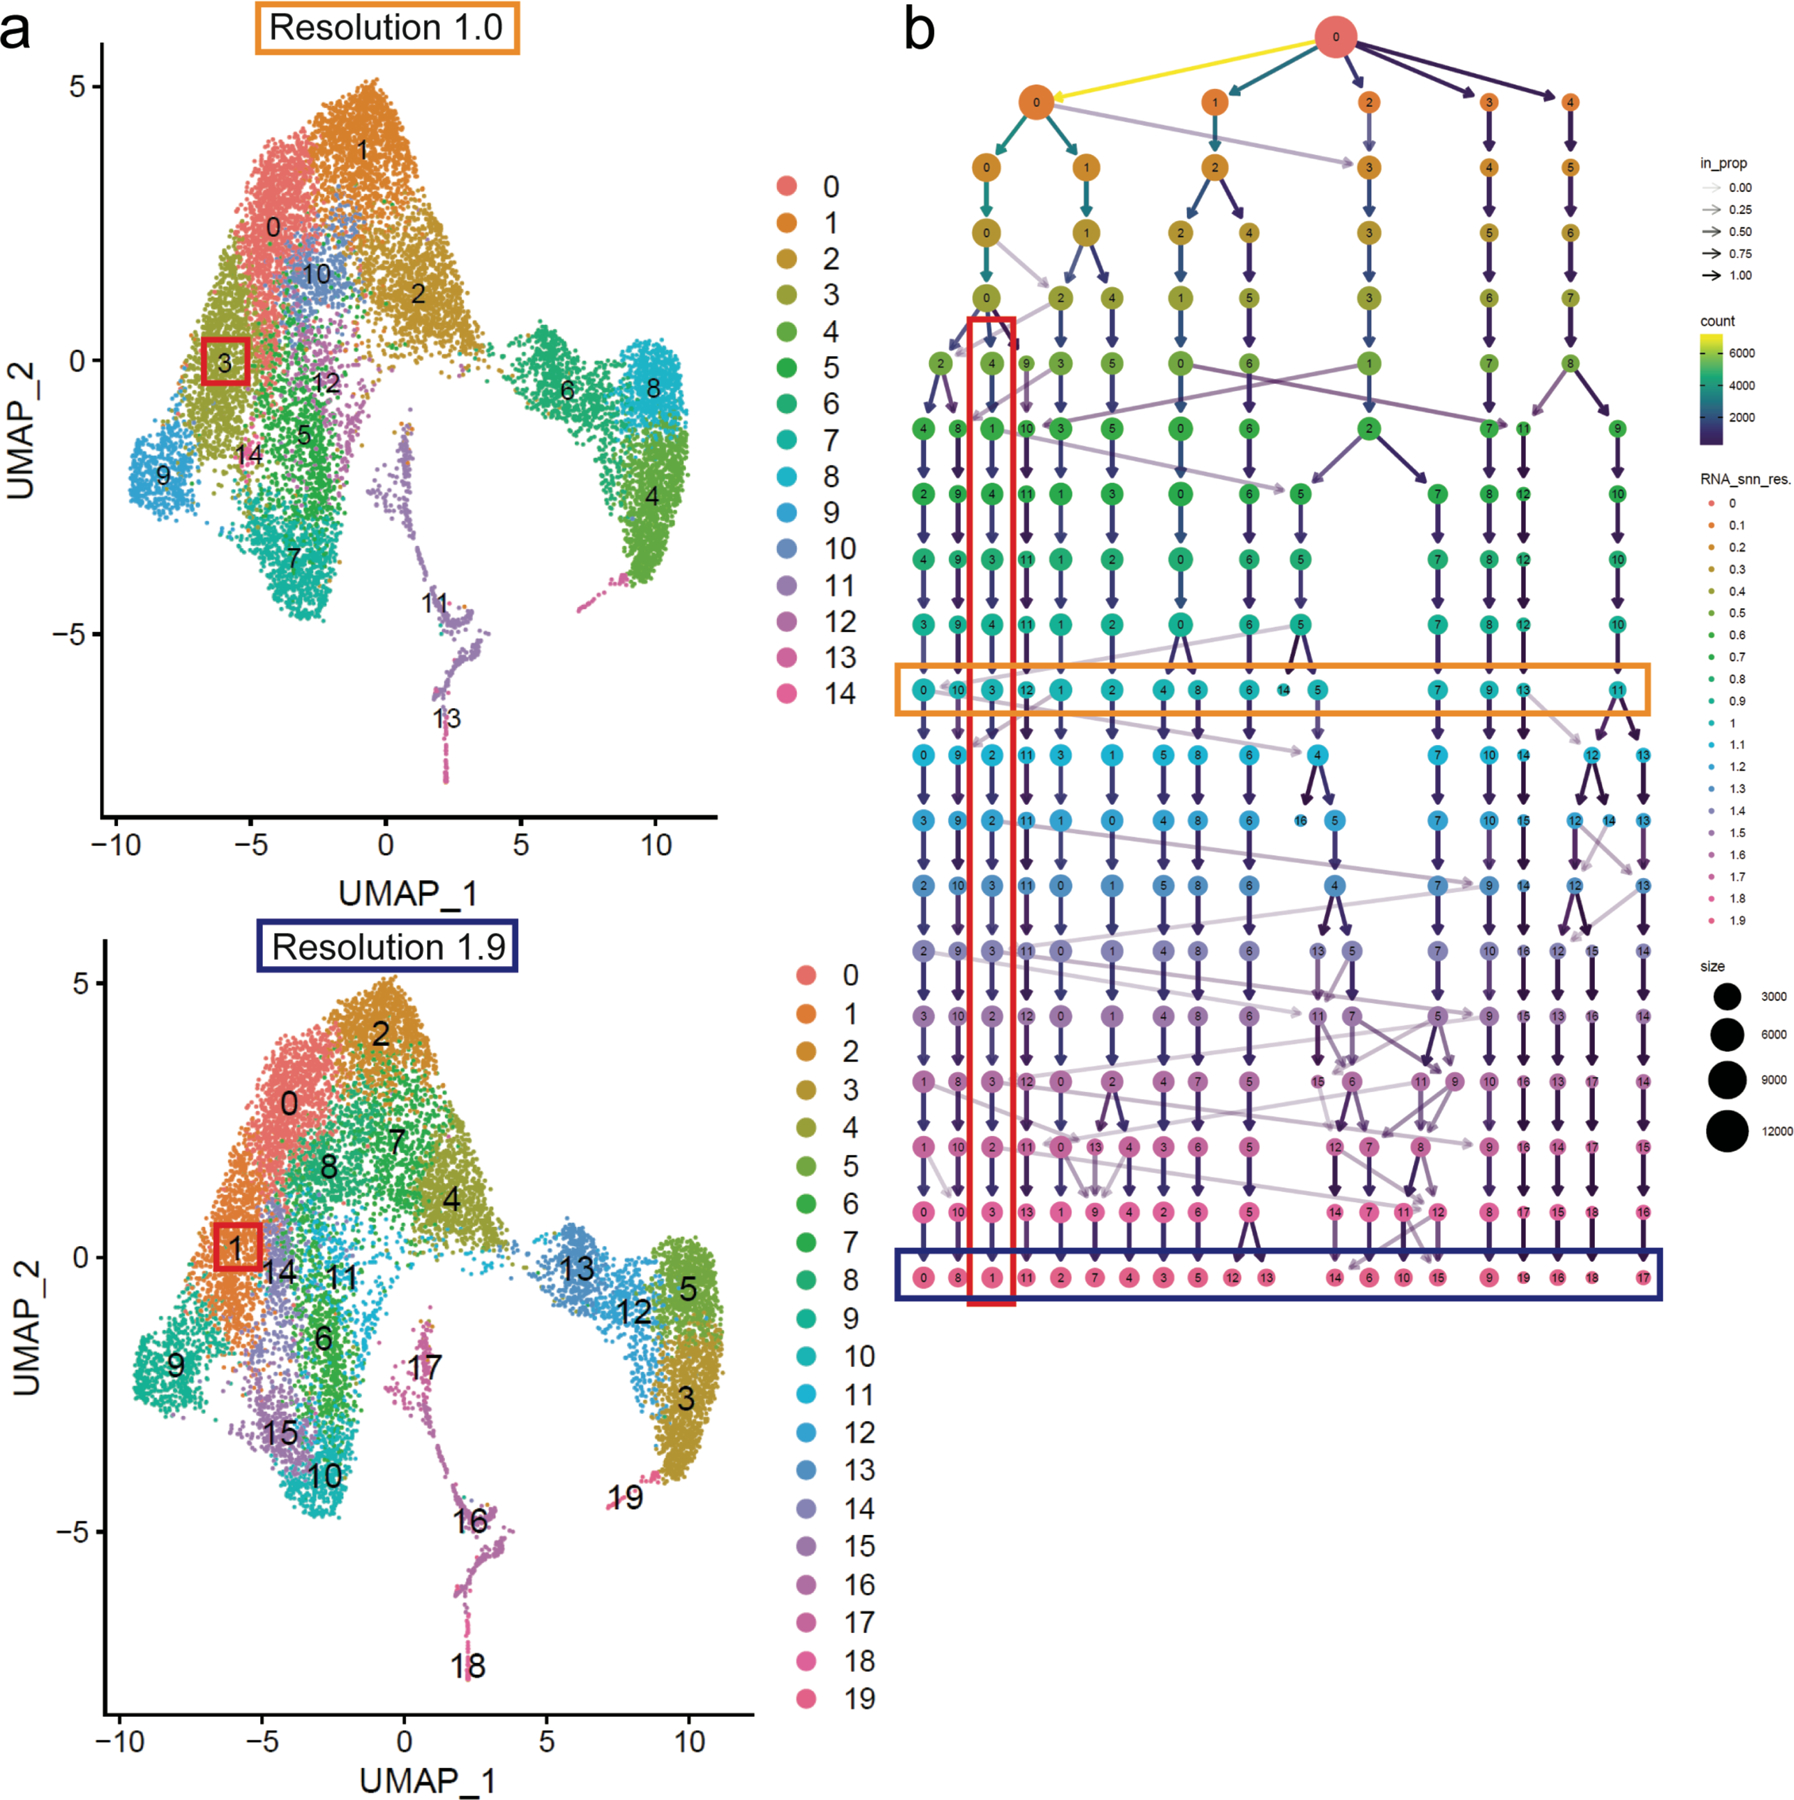
a. UMAP plot of cluster breakdown at resolution 1.0 (the resolution presented throughout the manuscript) and resolution 1.9 (highest resolution analyzed), the de novo mature Treg cell cluster is highlighted with a red box (cluster 3 in resolution 1.0 and cluster 1 in resolution 1.9). b. Clustree analysis of cluster breakdown from resolution 0.1–1.9, the de novo mature Treg cell is highlighted with a red box, resolution 1.0 is highlighted in the orange box and resolution 1.9 is highlighted by a blue box. In this schematic, each circle represents a cluster and each row represents a resolution (resolutions are also color coded to the key of resolutions (0–1.9) on the right of the figure). Arrows represent the redistribution of cells from a cluster in the previous resolution with the shade darkness of the arrow corresponding to what proportion of cells changed cluster identity (or remained in the same cluster) and the color representing the number of cells changing cluster identity. Cluster #’s correspond to the key found in supplemental table 1 (0=FOXP3lo TregP Post agonist, 1=Mature CD4SP, 2=Immature CD4SP, 3=De novo mature Treg, 4=Preselection DP1, 5=CD25+ TregP post-agonist, 6=Post-selection DP, 7=CD25+ TregP agonist, 8=Preselection DP2, 9=RT-Treg, 10=ISG, 11=Proliferation, 12=FOXP3lo Agonist, 13=Proliferation DN3, 14=Lag3hi RT-Treg).
Unlike the de novo developing CD73lo/- Treg cell population, we found that CD73hi recirculating and resident Treg cells (RT-Treg) exhibit considerable transcriptional heterogeneity. We took cells derived from the CD73+ hashtag and analyzed these cells in isolation. We were able to resolve CD73+ Treg cells into seven distinct clusters, although one cluster represented contaminating immature thymocytes, likely representing a CD25+ double negative thymocyte population, and another contained CD73lo de novo developing Treg cells or cells with a central Treg (cTreg) phenotype cells, defined by expression of Sell and Ccr7 (Figure 8a,b). The remaining cells included three populations with an intermediate phenotype between previously described central and effector Treg (eTreg) cells and two populations of highly differentiated Treg cells. The intermediate populations consisted of clusters defined by TCR signaling, IFN stimulation and a transitional population, sharing features of both cTreg and eTreg cells (Figure 8a–c). We also identified 2 clusters of highly differentiated Treg cells, one exhibiting a prototypical eTreg or activated phenotype, defined by Tnfrsf9, Myc, Mif, and cycling genes like Pcna (Supplemental Table 3), and one representing a previously described tissue-resident Treg cell phenotype, defined by upregulation of Il1rl1 and Icos and downregulation of Sell and Ccr7 (Figure 8c, Supplemental Table 3). The majority of tissue-resident-like Treg cells expressed Tigit. Within the tissue-resident-like cluster, subsets could be identified that expressed Havcr2 (TIM3), Il1rl1 (ST-2), and Lag3 (Figure 8c). We found similar populations that expressed TIM3, ST-2 or LAG3 and TIGIT by flow cytometry (Figure 8d). These data support the idea that RT-Treg cells are comprised of several distinct Treg cell subsets that likely exert distinct functions in regulating thymus function.
Figure 8.

a. Cells labeled with only the hashtag antibody associated with sorted RT-Treg cells were plotted as a unique UMAP plot and reclustered to show differential RT-Treg cell subsets. b. Heat map showing expression of top 5 most differentially expressed genes between the 5 distinct RT-Treg subsets and the contaminating immature thymocyte subset. c. UMAP feature plot showing expression of Nr4a1, Tigit, Havcr2, Il1rl1, and Lag3. d. Flow cytometry profiles showing expression of CD73 versus TIM3, ST-2, LAG3 and TIGIT on gated CD4+FOXP3+ Tregs.
TCR repertoire analysis reveals considerable overlap between conventional and Treg cell lineages in developing thymocytes
To track the TCR repertoire throughout development we reasoned that we needed to narrow our analysis to a limited TCR repertoire to ensure we could detect duplicate clonotypes and observe overlap between populations. In order to narrow the TCR repertoire, this experiment used mice expressing a fixed TCRb, TCliβ (16), and only TCR Vα2 expressing cells were used to generate the 5’ scRNAseq libraries. To evaluate the characteristics of TCR diversity within this data set, we calculated a normalized Simpsons index where 1 is maximum diversity and 0 is maximum clonality. In pre-selection DP thymocytes, we detected near maximum diversity with a normalized Simpsons index value of 0.88 and 0.96 for the two pre-selection DP populations. However, our TCR restriction strategy was successful in detecting clonal overlap between cells, as we could detect a narrowing of TCR repertoire diversity in the post-selection DP thymocyte cluster, which had a normalized Simpsons index of 0.69 (Figure 9a). Further, analysis of immature and mature CD4SP thymocytes revealed a further reduction in the Simpsons diversity index, down to 0.15 and 0.12 respectively (Figure 9a). Thus, the diversity of the TCR repertoire in this dataset is sufficiently narrow to allow comparisons between different populations of thymocytes and thymic Treg cells.
Figure 9.

a. Normalized Simpsons diversity index plotted for distinct thymocyte subsets. b. UMAP as displayed in figure 1c as a reference to interpret clonotype distributions in figure 7c. c. UMAP feature plots showing distribution of T cells expressing 4 distinct TCRs. CDR3–1, CDR3–3, CDR3–24 and CDR3–27 are the 1st, 3rd, 24th and 27th most abundant TCR clones we identified and are representative of the different TCR distribution patterns we have seen among clusters. d. Plot showing the degree of TCR overlap between CD4SP and “self-reactive” clusters (CD25+ TregP agonist and post-agonist, FOXP3lo TregP agonist and post-agonist, and mature Tregs) as the number of cells expressing a particular TCR clone increases.
To understand the relationship between TCR clone and phenotype we analyzed the distribution of individual clonotypes, defined as cells expressing the same CDR3 amino acid sequence, throughout different clusters. We found that TCR clonotype did relate to the phenotype of cells in the dataset with some clonotypes being biased towards Treg cell fate and agonist selection clusters while others were biased towards conventional T cell clusters (Fig 9b,c, Supplemental Table 4). Even within the Treg cell clusters, clonotypes could be observed that biased towards clusters associated with one TregP population versus the other (Fig 9b,c). However, clonotype identity is not deterministic of phenotype. A cursory scan through clonotype distributions over UMAP plots clearly showed that many clonotypes found in the conventional lineage were indeed capable of engaging strongly with self-antigens in the thymus, as shown by the clonotype’s representation in developing Treg or agonist selection clusters (Fig 9c). Approximately 31% of all clonotypes could be found in the mature CD4SP cluster and in the “self-reactive” clusters (CD25+ TregP agonist and post-agonist, FOXP3lo TregP agonist and post-agonist, and mature Tregs), suggesting considerable capacity for self-reactivity within the conventional CD4SP compartment competent to exit the thymus (Fig 9d). Similar analysis of clonotypes that were found in greater than 5 cells in the dataset revealed that 88.5% of mature CD4SP clonotypes were also found in the “self-reactive” clusters (Fig. 9d). This agrees with the notion of the inherent leakiness of central tolerance (45). While clonotype usage is generally associated with distinct differentiation trajectories in the thymus, the stochasticity of selection allows the same TCR clonotype to take on several distinct fates.
Discussion
To rigorously characterize Treg differentiation in the thymus, we carried out combined scRNA-Seq and TCR-Seq analysis of sorted populations of DP, CD4SP (non-Tregs), CD25+ TregP, FOXP3lo TregP, de novo mature Tregs and recirculating/resident Treg populations from the thymus. Each population was labeled with unique hashtag antibodies and then pooled to generate one scRNA-Seq and one TCR-Seq library. This approach allowed us to avoid artifacts associated with integrating different libraries and effectively eliminated most doublets by removing cells expressing more than one hashtag antibody. This resulted in a detailed dataset allowing us to better characterize stages of CD4SP maturation as well as the differentiation pathways that give rise to mature Tregs in the thymus. Specifically, we were able to confirm previous findings correlating the chemokine receptors CCR9 and CCR7 as well as MHCI, low level IFN gene expression and KLF2/S1PR with distinct stages of T cell maturation. However, we were also able to identify novel markers of CD4SP maturation including Ms4a4b and Ms4a6b which are upregulated on mature CD4SP thymocytes and creatine kinase b, which is expressed at higher levels on immature CD4SP thymocytes. Creatine kinases are important for bolstering thymocyte and T cell intracellular ATP (46), which is a critical source of phosphate for the phosphorylation events that are triggered by TCR stimulation. High Ckb in immature CD4SP may be important to facilitate reaching the TCR signaling thresholds required for positive selection (46) or may enhance TCR sensitivity of developing thymocytes to ensure cells that recognize self-antigen are deleted appropriately. Interestingly, Ckb remains highly expressed in the CD25+ TregP agonist and post agonist cell subsets (Supplemental Table 1). This observation is consistent with a role for Ckb in enhanced signaling as CD25+ TregP agonist thymocytes are thought to be highly self-reactive and enriched for cells undergoing negative selection (8). However, Ckb expression is significantly downregulated, even compared to mature CD4SP, in both de novo mature Treg cells and recirculating/resident thymic Treg cell (RT-Treg) populations (Supplemental Table 1). Thus, Ckb correlates with Treg differentiation although its functional role in this process remains to be precisely determined.
Previous studies found that T cells are the primary source of IL-2 required for Treg differentiation in the thymus. These studies also established activated CD4+CD25+ T cells as the primary source of IL-2 (10, 11). CD25+FOXP3− TregP are one potential population that matches this description. However, we have previously observed a population of activated CD4+ T cells that recirculates back to the thymus (CD25hi Rag2-GFP−)(8) and could also be a source of IL-2 for Treg differentiation. Thus, whether IL-2 producing cells were comprised of developing thymocytes or recirculating mature CD4+ T cells was not clear. Our findings establish the CD25+ TregP agonist subset as a significant producer IL-2 in the thymus, while we did not detect IL-2 in CD25+ TregP post agonist, FOXP3lo TregP agonist, or FOXP3lo TregP post agonist subsets. These findings suggest that CD25+ TregP can produce IL-2 needed for their differentiation in an autocrine manner. In contrast, FOXP3lo TregP presumably require paracrine production for their differentiation into mature Tregs. It will be interesting to establish whether this involves direct association of FOXP3lo TregP with CD25+ TregP. Alternatively, it is possible that thymic DCs, which we have previously shown express CD25 but not the IL2Rβ chain (11), may capture IL-2 and present it to developing FOXP3lo TregP. Finally, we did not capture recirculating mature T cells in our study and thus were unable to test how efficiently recirculating mature CD4+ T cells produce IL-2. However, studies comparing pLckCre x Il2FL/FL versus dLckCre x Il2FL/FL mice found that IL-2 produced from conventional mature T cells is dispensable for thymic Treg development (10), suggesting that recirculating T cells are not required for Treg development. Taken together these studies suggest that the primary source of IL-2 needed to drive Treg differentiation arises from cells found in the CD25+ TregP agonist cluster.
Another question of interest is to what degree the TCR repertoire of conventional T cells and Treg cells overlaps and whether some TCRs are biased for one pathway versus another. As expected, our studies found clear restriction in TCR diversity as thymocytes progress from the DP to the CD4SP stage. This presumably reflects deletion of thymocytes that fail positive selection or undergo early negative selection at the DP stage, as well as those that are selected into the CD8SP as opposed to the CD4SP lineage. We also observed that the conventional CD4SP subsets and de novo developing Treg lineages exhibited comparable TCR diversity, consistent with previous reports (47). However, clear patterns could be seen when examining individual TCRs. A large fraction of TCRs were found in both conventional and Treg lineages. However, we also observed that some TCRs were found exclusively in CD4SP non-Treg thymocytes, while others were found only in the Treg lineage. Thus, TCRs can exhibit a clear bias for one pathway over another. Nevertheless, negative selection/Treg differentiation is clearly leaky as a significant fraction of autoreactive TCRs escape those processes and give rise to conventional CD4+ T cells.
Finally, our studies also characterized recirculating/resident Treg populations in the thymus. The existence of this population has been known for several years (12–14). CD73hi RT-Tregs express lower levels of Ccr7 than newly generated CD73lo/- thymic Tregs. In contrast, RT-Tregs have upregulated Ccr6 (Supplemental Table 1), a feature they share with the earliest DN1 thymocyte progenitor cells, which use CCR6 to home to the thymus. Thus, RT-Treg cells express high levels of a key receptor involved in thymus homing. Interestingly, this population of T cells exhibited the highest degree of TCR diversity of any CD4SP thymocyte. Thus, this recirculating/resident population is selected for a very high degree of TCR diversity, which likely plays an important role in shaping Treg differentiation in the thymus. In addition to the high degree of TCR diversity, recirculating/resident Tregs also exhibit significant transcriptional heterogeneity, with over six different transcriptional subgroups. What cells these distinct subsets of recirculating Tregs interact with remains unknown as does their functional role in thymocyte and Treg differentiation. Future studies will be required to establish the function of these distinct recirculating/resident Treg subsets.
Supplementary Material
Key points.
Tregs develop via distinct agonist and post agonist stages
CD25+ TregP agonist cells are a main source of IL2 needed for Treg development
Thymic recirculating Tregs have highly diverse transcriptomes and TCRs
Acknowledgements
We thank A. Rost, N. Keller, G Hubbard and L. Heltemes-Harris for technical assistance with mouse breeding and genotyping, the University of Minnesota’s Supercomputing Institute for providing computing and bioinformatic resources, Emma Stanley, Jerry Daniel and Kenneth Beckman for assistance with 10X Genomics single cell capture, library preparation and sequencing, and Elyse Froehling for bulk RNAseq library preparation at the University of Minnesota Genomics Center, and Terese Martin, Jason Motl, and Paul Champoux for cell sorting and maintenance of the Flow Cytometry Core Facility at the University of Minnesota.
This work was supported by NIH grant R01 AI124512.
Abbreviations:
- DN
double-negative
- DP
double-positive
- Treg
regulatory T cell
- SP
single positive
- TregP
Treg progenitor
References
- 1.Owen DL, Sjaastad LE, Farrar MA. 2019. Regulatory T Cell Development in the Thymus. J Immunol 203: 2031–41 [DOI] [PMC free article] [PubMed] [Google Scholar]
- 2.Josefowicz SZ, Lu LF, Rudensky AY. 2012. Regulatory T cells: mechanisms of differentiation and function. Annu Rev Immunol 30: 531–64 [DOI] [PMC free article] [PubMed] [Google Scholar]
- 3.Sjaastad LE, Owen DL, Tracy SI, Farrar MA. 2021. Phenotypic and Functional Diversity in Regulatory T Cells. Frontiers in Cell and Developmental Biology 9 [DOI] [PMC free article] [PubMed] [Google Scholar]
- 4.DiSpirito JR, Zemmour D, Ramanan D, Cho J, Zilionis R, Klein AM, Benoist C, Mathis D. 2018. Molecular diversification of regulatory T cells in nonlymphoid tissues. Sci Immunol 3 [DOI] [PMC free article] [PubMed] [Google Scholar]
- 5.Feuerer M, Herrero L, Cipolletta D, Naaz A, Wong J, Nayer A, Lee J, Goldfine AB, Benoist C, Shoelson S, Mathis D. 2009. Lean, but not obese, fat is enriched for a unique population of regulatory T cells that affect metabolic parameters. Nat Med 15: 930–9 [DOI] [PMC free article] [PubMed] [Google Scholar]
- 6.Lio CW, Hsieh CS. 2008. A two-step process for thymic regulatory T cell development. Immunity 28: 100–11 [DOI] [PMC free article] [PubMed] [Google Scholar]
- 7.Burchill MA, Yang J, Vang KB, Moon JJ, Chu HH, Lio CW, Vegoe AL, Hsieh CS, Jenkins MK, Farrar MA. 2008. Linked T cell receptor and cytokine signaling govern the development of the regulatory T cell repertoire. Immunity 28: 112–21 [DOI] [PMC free article] [PubMed] [Google Scholar]
- 8.Owen DL, Mahmud SA, Sjaastad LE, Williams JB, Spanier JA, Simeonov DR, Ruscher R, Huang W, Proekt I, Miller CN, Hekim C, Jeschke JC, Aggarwal P, Broeckel U, LaRue RS, Henzler CM, Alegre ML, Anderson MS, August A, Marson A, Zheng Y, Williams CB, Farrar MA. 2019. Thymic regulatory T cells arise via two distinct developmental programs. Nat Immunol 20: 195–205 [DOI] [PMC free article] [PubMed] [Google Scholar]
- 9.Tai X, Erman B, Alag A, Mu J, Kimura M, Katz G, Guinter T, McCaughtry T, Etzensperger R, Feigenbaum L, Singer DS, Singer A. 2013. Foxp3 transcription factor is proapoptotic and lethal to developing regulatory T cells unless counterbalanced by cytokine survival signals. Immunity 38: 1116–28 [DOI] [PMC free article] [PubMed] [Google Scholar]
- 10.Hemmers S, Schizas M, Azizi E, Dikiy S, Zhong Y, Feng Y, Altan-Bonnet G, Rudensky AY. 2019. IL-2 production by self-reactive CD4 thymocytes scales regulatory T cell generation in the thymus. J Exp Med 216: 2466–78 [DOI] [PMC free article] [PubMed] [Google Scholar]
- 11.Owen DL, Mahmud SA, Vang KB, Kelly RM, Blazar BR, Smith KA, Farrar MA. 2018. Identification of Cellular Sources of IL-2 Needed for Regulatory T Cell Development and Homeostasis. J Immunol 200: 3926–33 [DOI] [PMC free article] [PubMed] [Google Scholar]
- 12.Zhan Y, Bourges D, Dromey JA, Harrison LC, Lew AM. 2007. The origin of thymic CD4+CD25+ regulatory T cells and their co-stimulatory requirements are determined after elimination of recirculating peripheral CD4+ cells. Int Immunol 19: 455–63 [DOI] [PubMed] [Google Scholar]
- 13.Yang E, Zou T, Leichner TM, Zhang SL, Kambayashi T. 2014. Both retention and recirculation contribute to long-lived regulatory T-cell accumulation in the thymus. Eur J Immunol 44: 2712–20 [DOI] [PMC free article] [PubMed] [Google Scholar]
- 14.Thiault N, Darrigues J, Adoue V, Gros M, Binet B, Perals C, Leobon B, Fazilleau N, Joffre OP, Robey EA, van Meerwijk JP, Romagnoli P. 2015. Peripheral regulatory T lymphocytes recirculating to the thymus suppress the development of their precursors. Nat Immunol 16: 628–34 [DOI] [PubMed] [Google Scholar]
- 15.McCaughtry TM, Wilken MS, Hogquist KA. 2007. Thymic emigration revisited. J Exp Med 204: 2513–20 [DOI] [PMC free article] [PubMed] [Google Scholar]
- 16.Hsieh CS, Liang Y, Tyznik AJ, Self SG, Liggitt D, Rudensky AY. 2004. Recognition of the peripheral self by naturally arising CD25+ CD4+ T cell receptors. Immunity 21: 267–77 [DOI] [PubMed] [Google Scholar]
- 17.Stuart T, Butler A, Hoffman P, Hafemeister C, Papalexi E, Mauck WM 3rd, Hao Y, Stoeckius M, Smibert P, Satija R. 2019. Comprehensive Integration of Single-Cell Data. Cell 177: 1888–902 e21 [DOI] [PMC free article] [PubMed] [Google Scholar]
- 18.Kimes PK, Liu Y, Neil hayes D, Marron JS. 2017. Statistical significance for hierarchical clustering. Biometrics 73: 811–821. [DOI] [PMC free article] [PubMed] [Google Scholar]
- 19.Baller J, Kono T, Herman A, Zhang Y. 2019. CHURP: A lightweight CLI framework to enable novice users to analyze sequencing datasets in parallel. Proceedings of the Practice and Experience in Advancedc Research computing on Rise of the Machines
- 20.Kim D, Langmead B, Salzberg SL. 2015. HISAT: a fast spliced aligner with low memory requirements. Nat Methods 12: 357–60 [DOI] [PMC free article] [PubMed] [Google Scholar]
- 21.Liao Y, Smyth GK, Shi W. 2013. The Subread aligner: fast, accurate and scalable read mapping by seed-and-vote. Nucleic Acids Res 41: e108. [DOI] [PMC free article] [PubMed] [Google Scholar]
- 22.Cunningham F, Achuthan P, Akanni W, Allen J, Amode MR, Armean IM, Bennett R, Bhai J, Billis K, Boddu S, Cummins C, Davidson C, Dodiya KJ, Gall A, Giron CG, Gil L, Grego T, Haggerty L, Haskell E, Hourlier T, Izuogu OG, Janacek SH, Juettemann T, Kay M, Laird MR, Lavidas I, Liu Z, Loveland JE, Marugan JC, Maurel T, McMahon AC, Moore B, Morales J, Mudge JM, Nuhn M, Ogeh D, Parker A, Parton A, Patricio M, Abdul Salam AI, Schmitt BM, Schuilenburg H, Sheppard D, Sparrow H, Stapleton E, Szuba M, Taylor K, Threadgold G, Thormann A, Vullo A, Walts B, Winterbottom A, Zadissa A, Chakiachvili M, Frankish A, Hunt SE, Kostadima M, Langridge N, Martin FJ, Muffato M, Perry E, Ruffier M, Staines DM, Trevanion SJ, Aken BL, Yates AD, Zerbino DR, Flicek P. 2019. Ensembl 2019. Nucleic Acids Res 47: D745–D51 [DOI] [PMC free article] [PubMed] [Google Scholar]
- 23.(2021) RCt. R: A language and environment for statistical computing. Vienna, Austria [Google Scholar]
- 24.McCarthy DJ, Chen Y, Smyth GK. 2012. Differential expression analysis of multifactor RNA-Seq experiments with respect to biological variation. Nucleic Acids Res 40: 4288–97 [DOI] [PMC free article] [PubMed] [Google Scholar]
- 25.Robinson MD, McCarthy DJ, Smyth GK. 2010. edgeR: a Bioconductor package for differential expression analysis of digital gene expression data. Bioinformatics 26: 139–40 [DOI] [PMC free article] [PubMed] [Google Scholar]
- 26.Wu T, Hu E, Xu S, Chen M, Guo P, Dai Z, Feng T, Zhou L, Tang W, Zhan L, Fu X, Liu S, Bo X, Yu G. 2021. clusterProfiler 4.0: A universal enrichment tool for interpreting omics data. Innovation (N Y) 2: 100141. [DOI] [PMC free article] [PubMed] [Google Scholar]
- 27.Wickham H 2016. ggplot2: Elegant Graphics for data Analysis. New York, NY: Springer-Verlag [Google Scholar]
- 28.Hogquist KA, Jameson SC, Heath WR, Howard JL, Bevan MJ, Carbone FR. 1994. T cell receptor antagonist peptides induce positive selection. Cell 76: 17–27 [DOI] [PubMed] [Google Scholar]
- 29.Davey GM, Schober SL, Endrizzi BT, Dutcher AK, Jameson SC, Hogquist KA. 1998. Preselection thymocytes are more sensitive to T cell receptor stimulation than mature T cells. J Exp Med 188: 1867–74 [DOI] [PMC free article] [PubMed] [Google Scholar]
- 30.Benz C, Heinzel K, Bleul CC. 2004. Homing of immature thymocytes to the subcapsular microenvironment within the thymus is not an absolute requirement for T cell development. Eur J Immunol 34: 3652–63 [DOI] [PubMed] [Google Scholar]
- 31.Misslitz A, Pabst O, Hintzen G, Ohl L, Kremmer E, Petrie HT, Forster R. 2004. Thymic T cell development and progenitor localization depend on CCR7. J Exp Med 200: 481–91 [DOI] [PMC free article] [PubMed] [Google Scholar]
- 32.Mick VE, Starr TK, McCaughtry TM, McNeil LK, Hogquist KA. 2004. The regulated expression of a diverse set of genes during thymocyte positive selection in vivo. J Immunol 173: 5434–44 [DOI] [PubMed] [Google Scholar]
- 33.Huang YH, Li D, Winoto A, Robey EA. 2004. Distinct transcriptional programs in thymocytes responding to T cell receptor, Notch, and positive selection signals. Proc Natl Acad Sci U S A 101: 4936–41 [DOI] [PMC free article] [PubMed] [Google Scholar]
- 34.Xing Y, Wang X, Jameson SC, Hogquist KA. 2016. Late stages of T cell maturation in the thymus involve NF-kappaB and tonic type I interferon signaling. Nat Immunol [DOI] [PMC free article] [PubMed] [Google Scholar]
- 35.Carlson CM, Endrizzi BT, Wu J, Ding X, Weinreich MA, Walsh ER, Wani MA, Lingrel JB, Hogquist KA, Jameson SC. 2006. Kruppel-like factor 2 regulates thymocyte and T-cell migration. Nature 442: 299–302 [DOI] [PubMed] [Google Scholar]
- 36.Howie D, Nolan KF, Daley S, Butterfield E, Adams E, Garcia-Rueda H, Thompson C, Saunders NJ, Cobbold SP, Tone Y, Tone M, Waldmann H. 2009. MS4A4B is a GITR-associated membrane adapter, expressed by regulatory T cells, which modulates T cell activation. J Immunol 183: 4197–204 [DOI] [PubMed] [Google Scholar]
- 37.Mora JR, Bono MR, Manjunath N, Weninger W, Cavanagh LL, Rosemblatt M, Von Andrian UH. 2003. Selective imprinting of gut-homing T cells by Peyer’s patch dendritic cells. Nature 424: 88–93 [DOI] [PubMed] [Google Scholar]
- 38.Fontenot JD, Rasmussen JP, Gavin MA, Rudensky AY. 2005. A function for interleukin 2 in Foxp3-expressing regulatory T cells. Nat Immunol 6: 1142–51 [DOI] [PubMed] [Google Scholar]
- 39.D’Cruz LM, Klein L. 2005. Development and function of agonist-induced CD25(+)Foxp3(+) regulatory T cells in the absence of interleukin 2 signaling. Nat Immunol 6: 1152–9 [DOI] [PubMed] [Google Scholar]
- 40.Burchill MA, Yang J, Vogtenhuber C, Blazar BR, Farrar MA. 2007. IL-2 receptor beta-dependent STAT5 activation is required for the development of Foxp3+ regulatory T cells. J Immunol 178: 280–90 [DOI] [PubMed] [Google Scholar]
- 41.Yao Z, Kanno Y, Kerenyi M, Stephens G, Durant L, Watford WT, Laurence A, Robinson GW, Shevach EM, Moriggl R, Hennighausen L, Wu C, O’Shea JJ. 2007. Nonredundant roles for Stat5a/b in directly regulating Foxp3. Blood 109: 4368–75 [DOI] [PMC free article] [PubMed] [Google Scholar]
- 42.Soper DM, Kasprowicz DJ, Ziegler SF. 2007. IL-2Rbeta links IL-2R signaling with Foxp3 expression. Eur J Immunol 37: 1817–26 [DOI] [PubMed] [Google Scholar]
- 43.Mahmud SA, Manlove LS, Schmitz HM, Xing Y, Wang Y, Owen DL, Schenkel JM, Boomer JS, Green JM, Yagita H, Chi H, Hogquist KA, Farrar MA. 2014. Costimulation via the tumor-necrosis factor receptor superfamily couples TCR signal strength to the thymic differentiation of regulatory T cells. Nat Immunol 15: 473–81 [DOI] [PMC free article] [PubMed] [Google Scholar]
- 44.Morgana F, Opstelten R, Slot MC, Scott AM, van Lier RAW, Blom B, Mahfouz A, Amsen D. 2022. Single-Cell Transcriptomics Reveals Discrete Steps in Regulatory T Cell Development in the Human Thymus. J Immunol 208: 384–95 [DOI] [PubMed] [Google Scholar]
- 45.Yu W, Jiang N, Ebert PJ, Kidd BA, Muller S, Lund PJ, Juang J, Adachi K, Tse T, Birnbaum ME, Newell EW, Wilson DM, Grotenbreg GM, Valitutti S, Quake SR, Davis MM. 2015. Clonal Deletion Prunes but Does Not Eliminate Self-Specific alphabeta CD8(+) T Lymphocytes. Immunity 42: 929–41 [DOI] [PMC free article] [PubMed] [Google Scholar]
- 46.Zhang Y, Li H, Wang X, Gao X, Liu X. 2009. Regulation of T cell development and activation by creatine kinase B. PLoS One 4: e5000. [DOI] [PMC free article] [PubMed] [Google Scholar]
- 47.Hsieh CS, Zheng Y, Liang Y, Fontenot JD, Rudensky AY. 2006. An intersection between the self-reactive regulatory and nonregulatory T cell receptor repertoires. Nat Immunol 7: 401–10 [DOI] [PubMed] [Google Scholar]
Associated Data
This section collects any data citations, data availability statements, or supplementary materials included in this article.