

Abstract
Nutrients and energy have emerged as central modulators of developmental programs in plants and animals1–3. The evolutionarily conserved target-of-rapamycin (TOR) kinase is a master integrator of nutrient and energy signalling that controls growth. Despite its important regulatory roles in translation, proliferation, metabolism, and autophagy2–5, little is known about how TOR shapes developmental transitions and differentiation. Here we show that glucose-activated TOR kinase controls genome-wide histone H3 trimethylation at K27 (H3K27me3) that regulates cell fates and development6–10. We identify FERTILIZATION-INDEPENDENT-ENDOSPERM (FIE), an indispensable component of Polycomb repressive complex 2 (PRC2) catalysing H3K27me36–8,10–12, as a surprising TOR target. Direct TOR phosphorylation promotes dynamic cytoplasm-to-nucleus translocation of FIE. The targeted FIE phosphorylation mutation abrogates global H3K27me3 landscape, reprograms transcriptome, and disrupts organogenesis in plants. Moreover, glucose-TOR-FIE-PRC2 signalling modulates vernalization-induced floral transition. We propose that this newly defined signalling axis serves as a nutritional checkpoint leading to epigenetic silencing of key transcription factor genes that specify stem-cell destiny in shoot and root meristems and control leaf, flower and silique patterning, branching, and vegetative-to-reproduction transition. The findings reveal a fundamental mechanism of nutrient signalling in direct epigenome reprogramming with broad relevance in the developmental control of multicellular organisms.
Glucose is a universal nutrient as the main energy supplier and metabolic/biomass precursor for most cells. Glucose also functions as an essential regulatory signal directly or indirectly controls diverse vital processes in multicellular organisms1–5. In photosynthetic plants, CO2 captured from the atmosphere leads to system-wide glucose signalling that plays pivotal roles in multiple developmental processes vital to agronomically important traits and crop yield including germination, stem cell to primordial proliferation, organ size and patterning, as well as shoot branching, flowering and fruit/seed development2–5,13–16. Notably, plant growth hormones and signalling peptides are ineffective in supporting plant development without the glucose signalling networks2–4. However, how glucose signalling modulates cell fates and organogenesis remains largely obscure2–5,13–16. The evolutionarily conserved TOR kinase is a major glucose signalling mediator that integrates nutrients and energy, as well as growth factors, hormones and environmental cues to control growth, development and aging2–5,17–19. Although plant TOR has been implicated in playing crucial roles from meristem activation to shoot/root growth and flowering2–5,15,17–22, the molecular mechanisms remain poorly understood.
Underlying cell fate specification and developmental transitions, epigenetic regulation on chromatin is the universal mechanism to establish and maintain cell and organ identity in plants and animals6–10. PRC2, catalysing histone H3K27me3 and triggering epigenetic silencing of key regulatory genes, are required for cell identity and plasticity to promote differentiation in various developmental programs6–8,10. Although both PRC2 and TOR are vital to diverse plant developmental processes, no direct molecular connection has been established between the PRC2-mediated global H3K27me3 regulation in organogenesis and TOR-associated dynamic nutrient and energy signalling network.
Glucose-TOR signalling modulates H3K27me3
To explore new mechanisms of the complex TOR signalling network in plant development, we conducted unbiased chemical screens for various molecular effects of different levels of TOR kinase deficiency in Arabidopsis thaliana2–5. Germinating seeds in liquid nutrient medium were treated with systematically varying concentrations of a potent ATP-competitive TOR inhibitor Torin22,4 at the initiation of postembryonic development. The S6K phosphorylation, an evolutionarily conserved indicator of TOR activity4,21, was strongly inhibited by Torin2 starting from 0.1 μM. Higher Torin2 concentrations (5–10 μM) abolished DNA replication monitored by quantitative incorporation of a thymidine analogue 5-ethynyl-2′-deoxyuridine (EdU)4 and retarded shoot and root development. Interestingly, reduced TOR activities calibrated by Torin2 at 0.5–10 μM gradually decreased the level of epigenomic mark H3K27me3 associated with developmental transitions and organ differentiation6–10. This new function of TOR signalling in chromatin regulation was genetically validated in estradiol-inducible TOR RNAi (tor-es) mutant plants4,21, as pS6K1(S449), EdU staining, high H3K27me3 and seedling development were all suppressed (Fig. 1a, Extended Data Fig. 1a, b). However, the H3K27me3 reduction was likely underestimated partially due to experimental limitations when DNA replication was abolished by 5–10 μM Torin2 or tor-es (Fig. 1a)4,15.
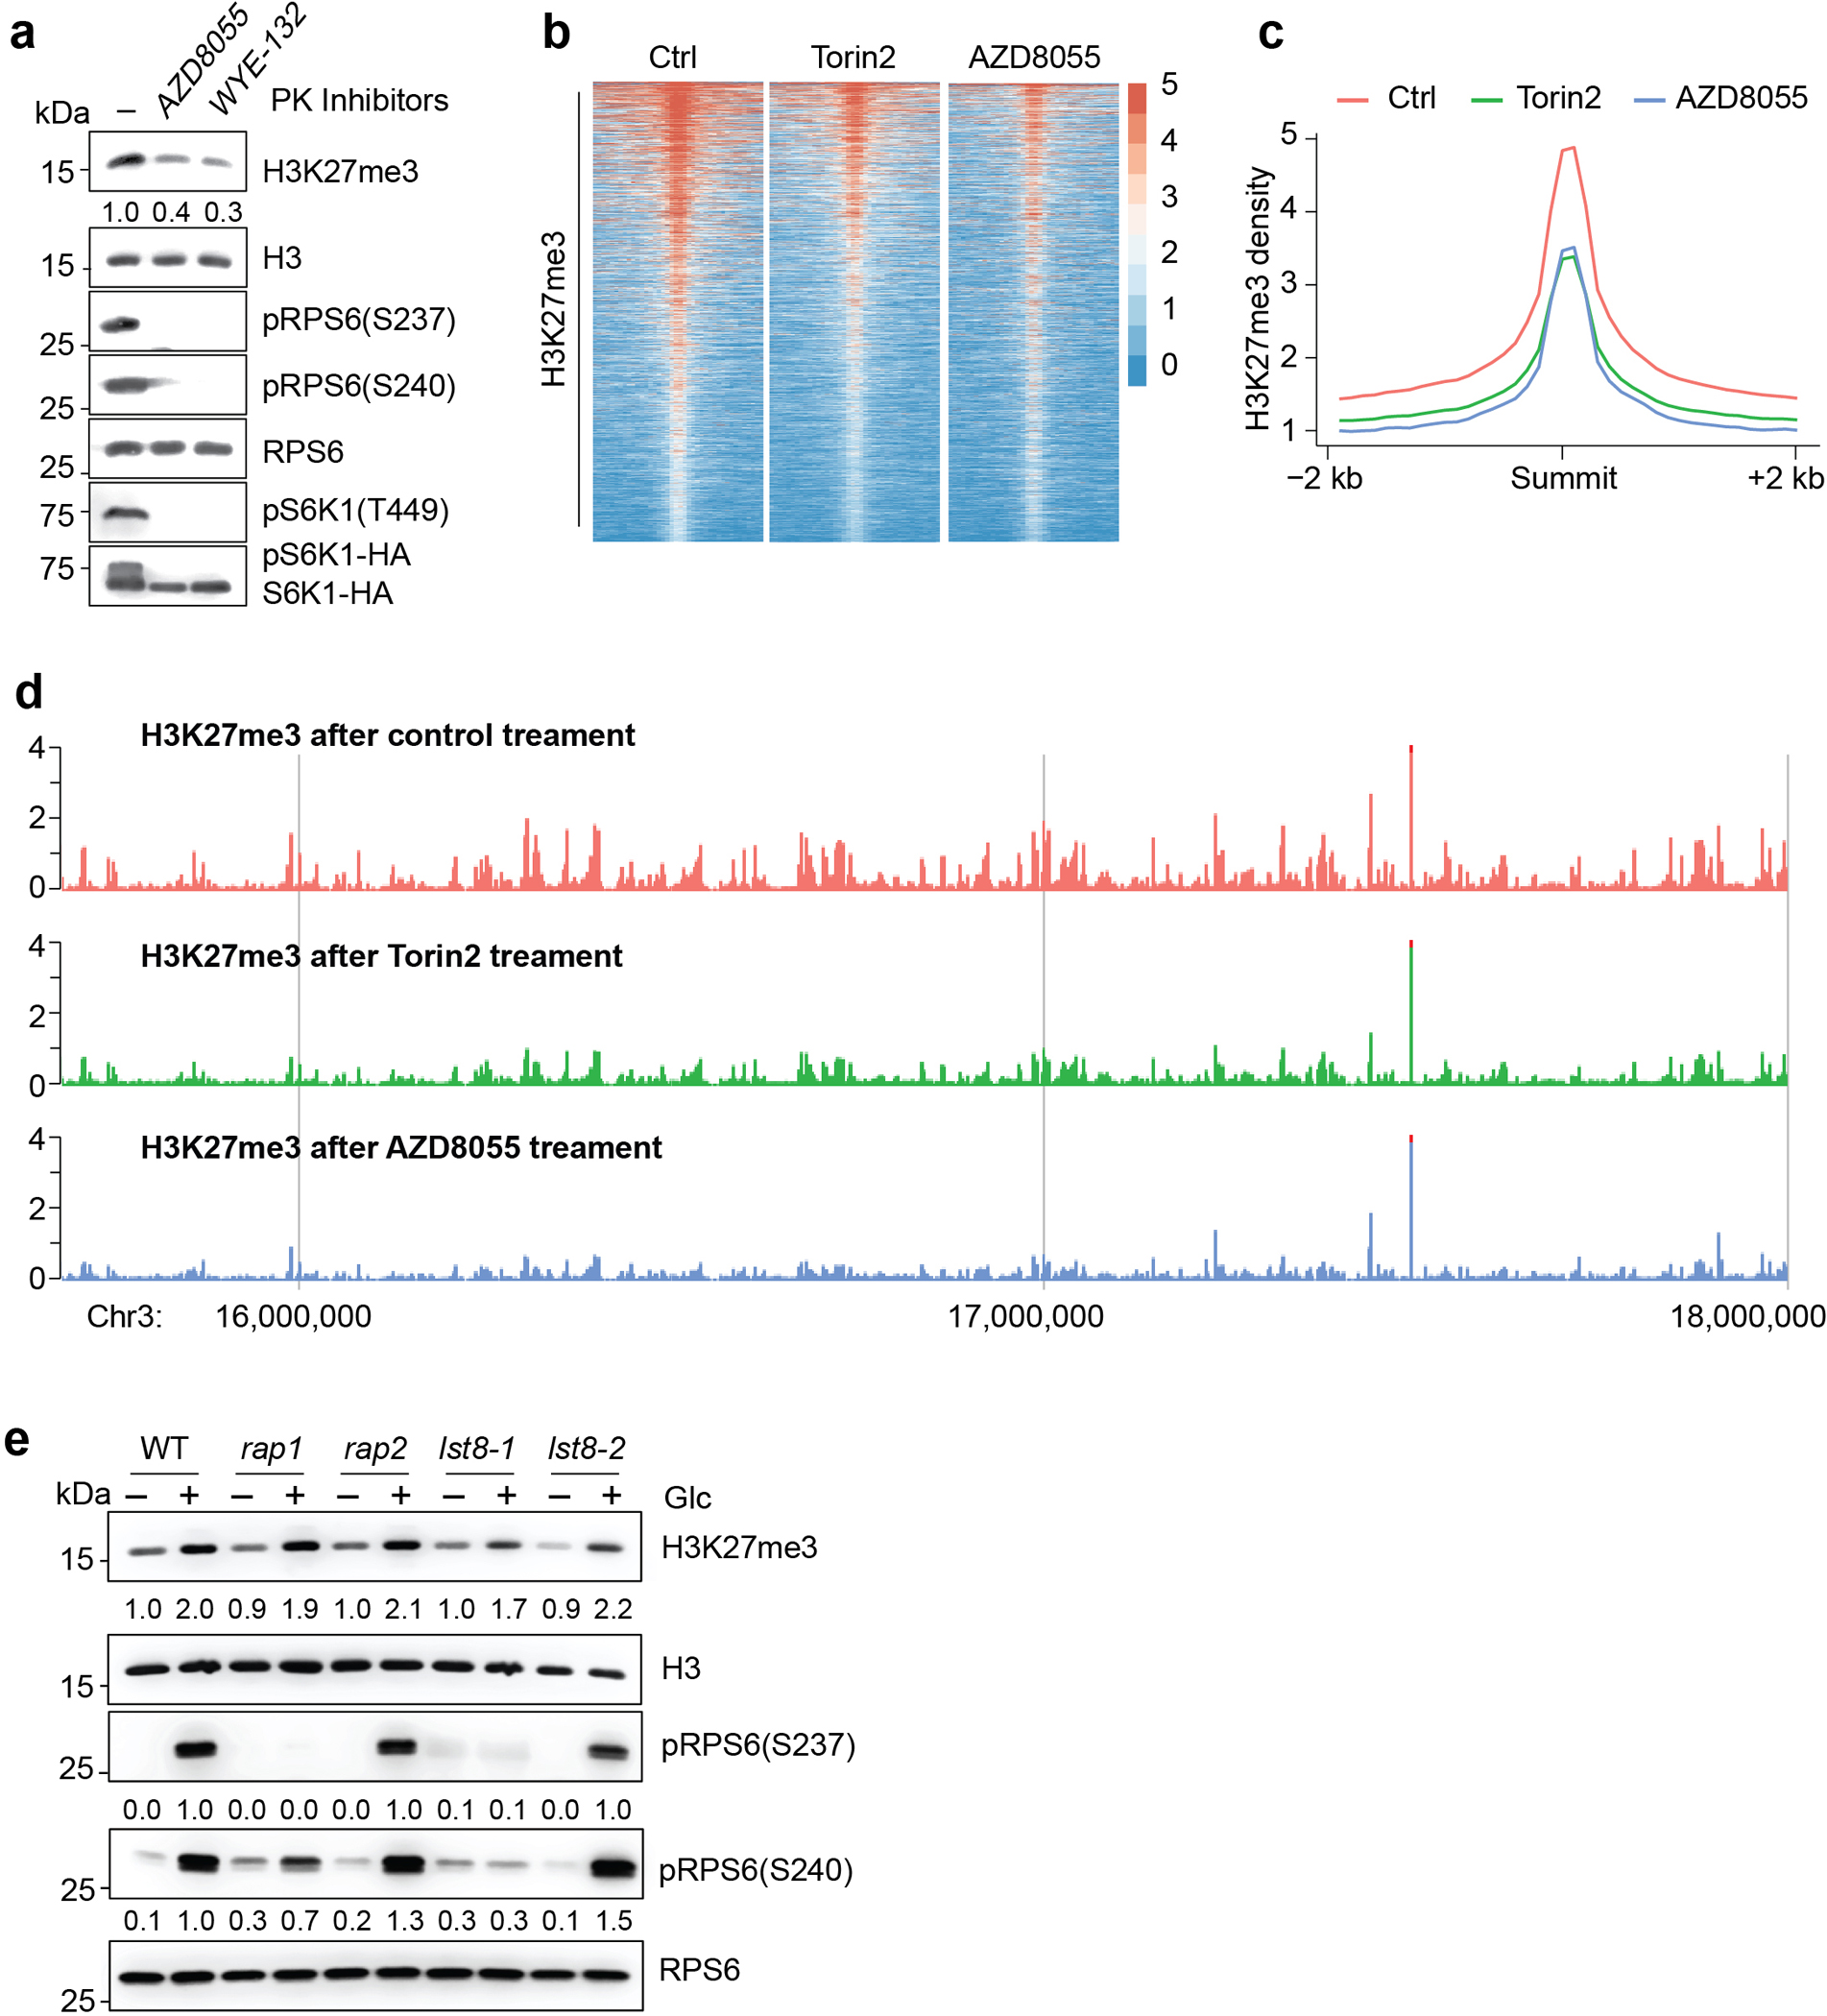
Fig. 1 |. Glucose-TOR Signalling specifically regulates global H3K27me3 dynamics.
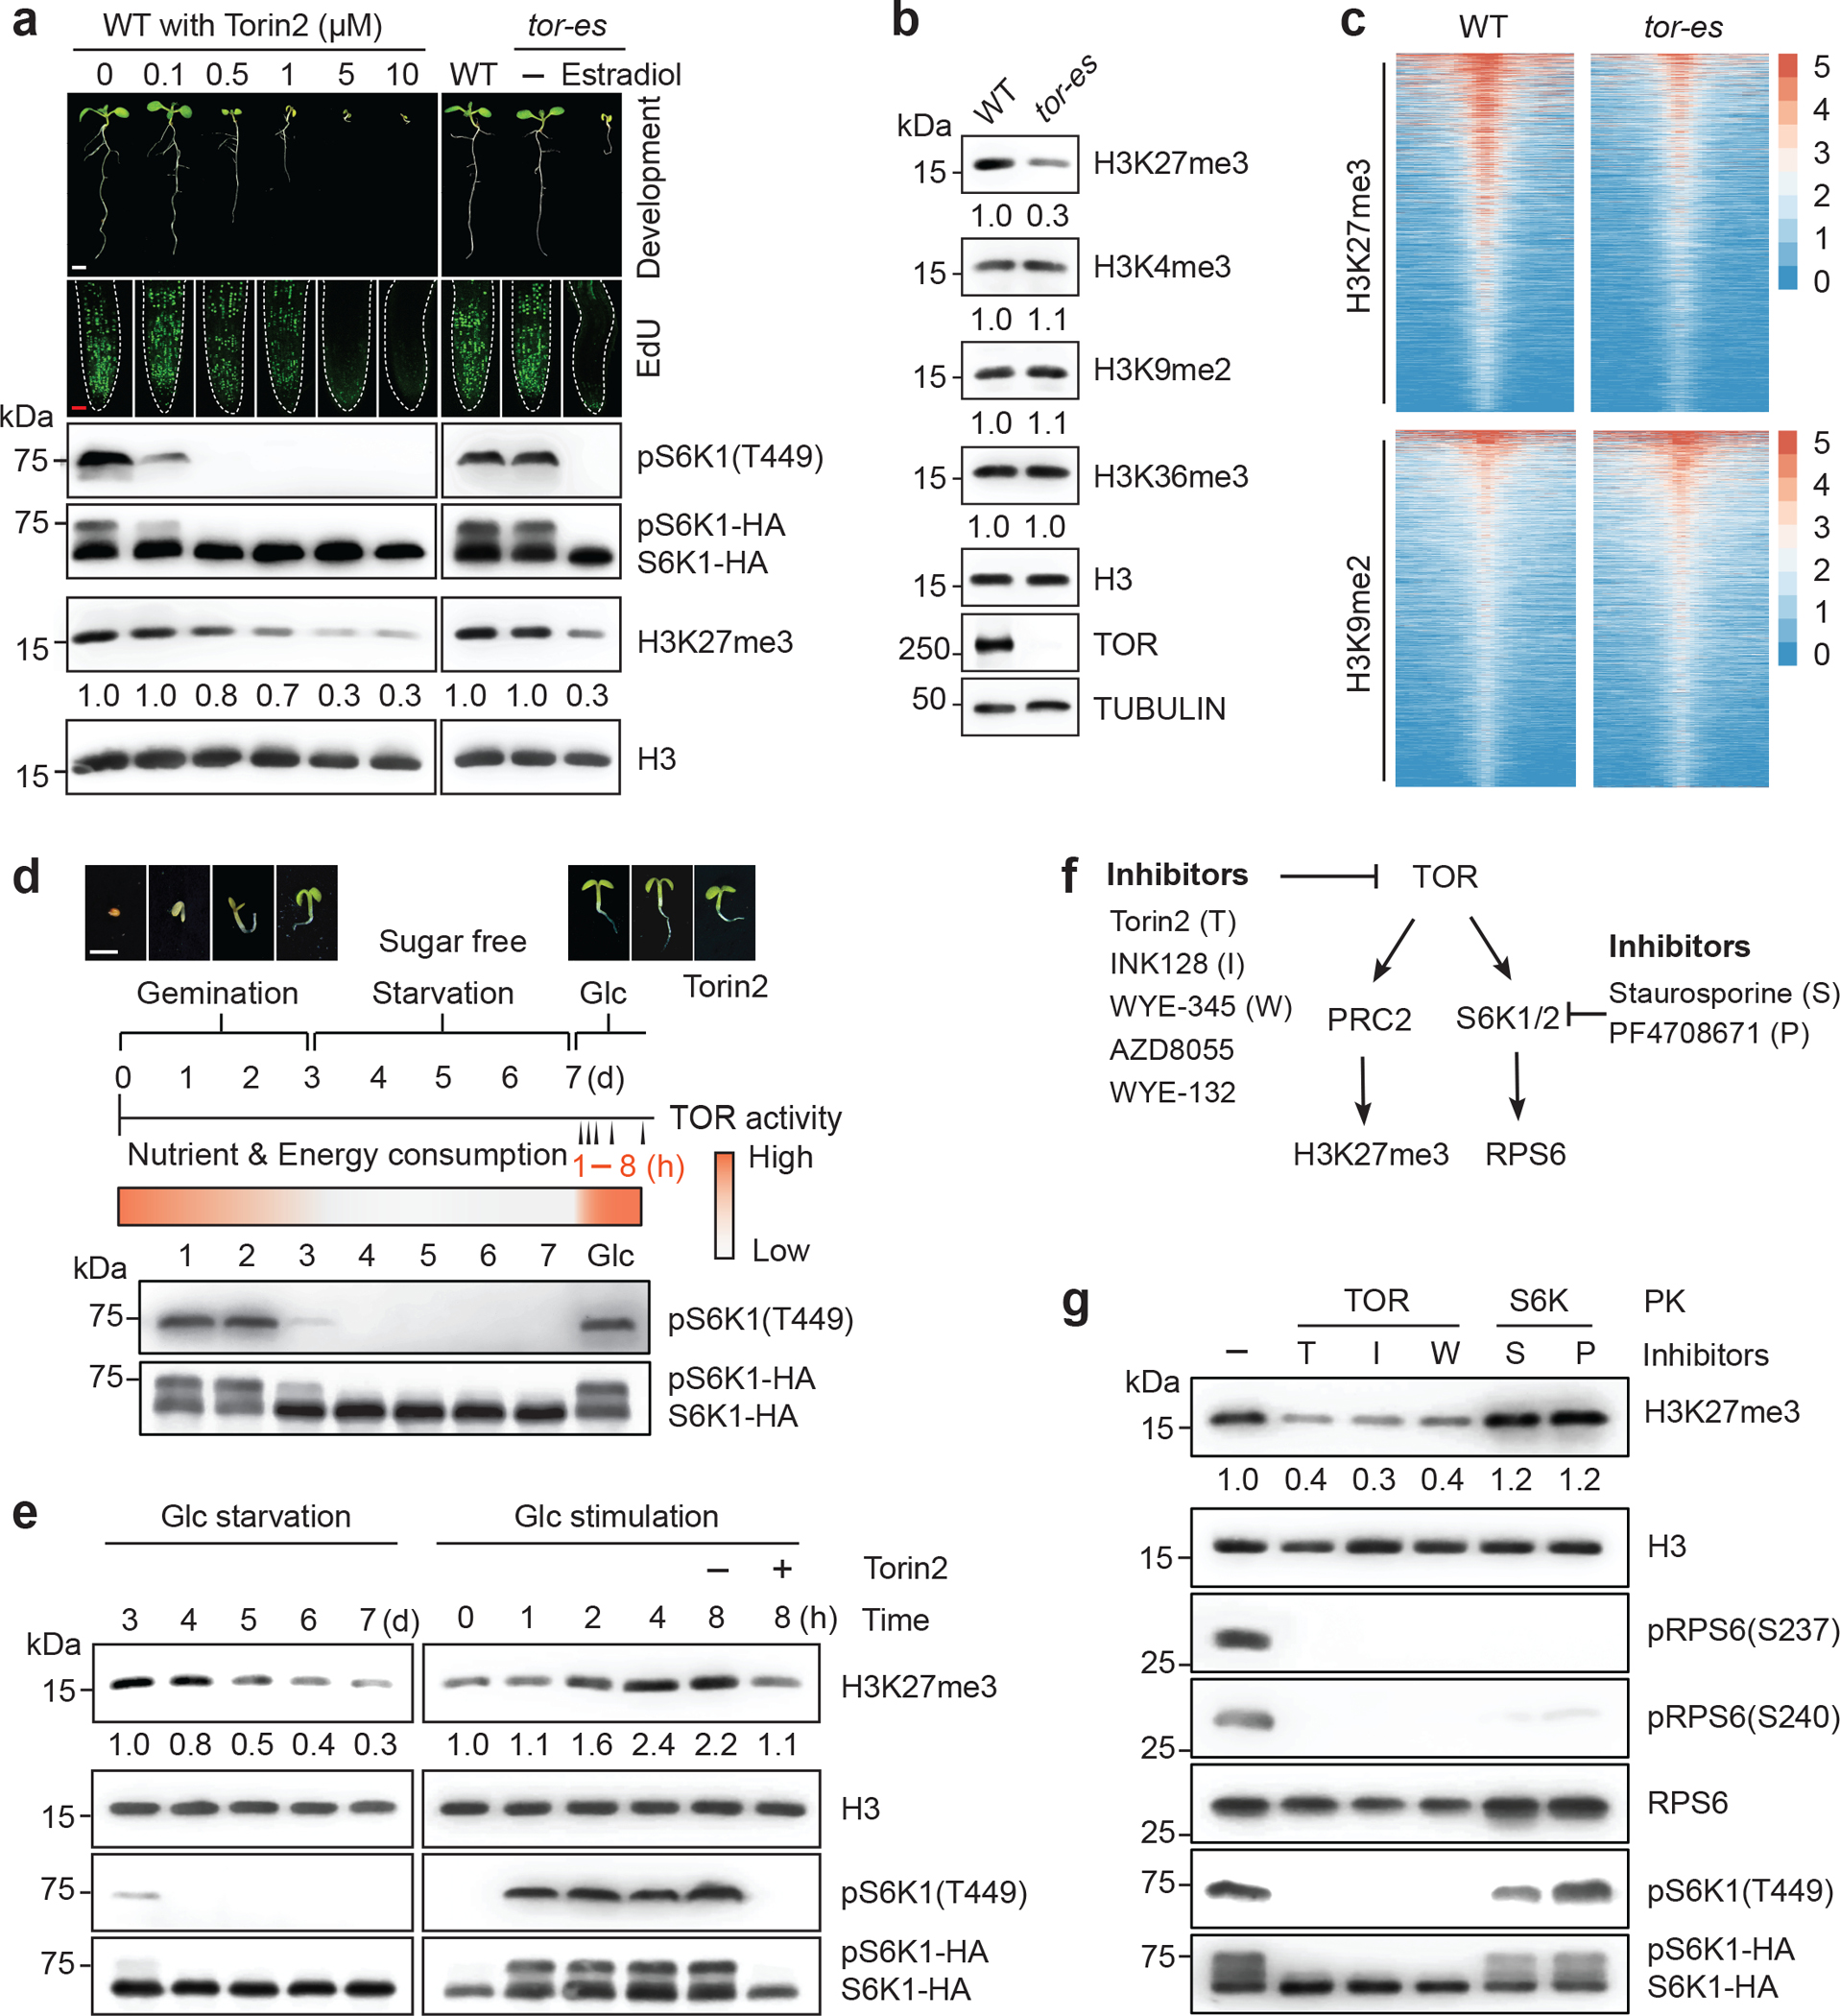
a, Distinct TOR activity thresholds regulate plant development. Seedling development, EdU staining, pS6K1(T449) phosphorylation, and H3K27me3 quantification in WT treated with different concentrations of Torin2 or in tor-es at 8 days after germination in rich medium. Images are representative of 10 seedlings. White scale bar, 2 mm. Red scale bar, 25 μm. b, Specific reduction of H3K27me3 levels in 7-d tor-es (10 μM estradiol for 3 d). c, Heatmap of H3K27me3 or H3K9me2 enrichment in WT and tor-es. The colour scale indicates reference-adjusted RPM (RRPM) surrounding peak summit from the ChIP-Rx-seq data. d, e, Glucose-TOR signalling rapidly regulates H3K27me3 dynamics. (d) Schematic presentation of experimental design for glucose regulation of TOR activity. d, day. h, hour. White scale bar, 2 mm. f, g, TOR but not S6K regulates global H3K27me3 levels. Torin2 (T), INK128 (I), and WYE-354 (W) are specific TOR inhibitors. Staurosporine (S) and PF4708671 (P) inhibit S6K1/2 activity. S6K activity is monitored by pRPS6(S237) and pRPS6(S240). Values are the relative level of histone modifications compared with the corresponding H3 control, with blot signals in WT set as 1.0. Experiments were conducted in three biological repeats with similar results. The samples derive from the same experiment and gels/blots were processed in parallel.
We next determined the specificity of TOR regulation of chromatin modifications by quantifying major histone methylation marks using immunoblot analyses in 7-d Arabidopsis wild-type (WT) and tor-es seedlings. H3K27me3, but not other histone marks, H3K4me3, H3K9me2 and H3K36me3, was specifically reduced in the tor-es mutant (Fig. 1b). We further performed quantitative chromatin immunoprecipitation with an exogenous reference genome followed by deep-sequencing (ChIP-Rx-seq)23. The average density plot and heatmap revealed a global reduction of H3K27me3 occupancy in tor-es, whereas the H3K9me2 level was unaffected. The reduction of H3K27me3 in tor-es was detected throughout the genome (Fig. 1c, Extended Data Fig. 1c, d, Supplementary Table 1), suggesting that the deposition and/or maintenance of H3K27me3 is regulated by TOR.
We then investigated TOR regulation of H3K27me3 in a physiological context by analysing H3K27me3 dynamics in the well-established heterotrophic to photoautotrophic transition stage when the endogenous sugar derived from the seed reserve is depleted three days after germination. Photosynthesis or exogenous glucose could activate TOR, which was monitored by the phosphorylation status of pS6K1(T449)4,21 under light4,15 (Fig. 1d, e). Arabidopsis seedlings germinated and grown in a sugar-free liquid medium naturally entered a reversible quiescent state in growth and development with decreased TOR activity at 3–7 days after germination4,15 (Fig. 1d). The H3K27me3 levels were maintained at 3–7 days in sugar-containing medium (Extended Data Fig. 1e) but were gradually reduced during the sugar starvation phase, which correlated with inactive TOR and stalled seedling development. Glucose rapidly stimulated TOR activity and de novo H3K27me3 accumulation within 2 h, suggesting the reprogramming of chromatin states. Consistently, the restoration of H3K27me3 levels was blocked by Torin2 (10 μM) during glucose stimulation (Fig. 1e).
To ensure TOR kinase specificity and to differentiate TOR regulation of H3K27me3 dynamics from the conserved pS6K1(T449) (Fig. 1a), seedlings were treated with structurally different chemical inhibitors that target TOR or S6K1 (Fig. 1f). All five TOR inhibitors, but not S6K1 inhibitors2,4, exerted significant global H3K27me3 reduction. TOR kinase inhibition by Torin2 and AZD8055 led to a similar genome-wide reduction of H3K27me3 occupancy as in tor-es by ChIP-Rx-seq analyses quantified by heatmap, average density plot and genome browser view (Fig. 1g and Extended Data Fig. 2a–d, Supplementary Table 2). In 7-d glucose-starved seedlings, the conserved TOR complex 1 (TORC1) components, RAPTOR1 (RAP1) and LST8–12–5, played essential roles in the glucose-mediated S6K phosphorylation of pRPS6(S237) and pRPS6(S240), which were differentially blocked in the key rap1 and lst8–1 mutants but not in rap2 or lst8–224–26. However, rap1 and lst8–1 could still significantly restore H3K27me3 levels by 25 mM glucose at 6 h (Fig. 1d–g, Extended Data Fig. 2e). The results were consistent with different TOR activity thresholds in modulating pS6K1(T449) and H3K27me3 revealed by chemical inhibitor screens (Fig. 1a, f, g, Extended Data Fig. 2a), and may suggest differential TOR kinase activation of distinct substrates beyond the canonical TORC1 in plants24,25.
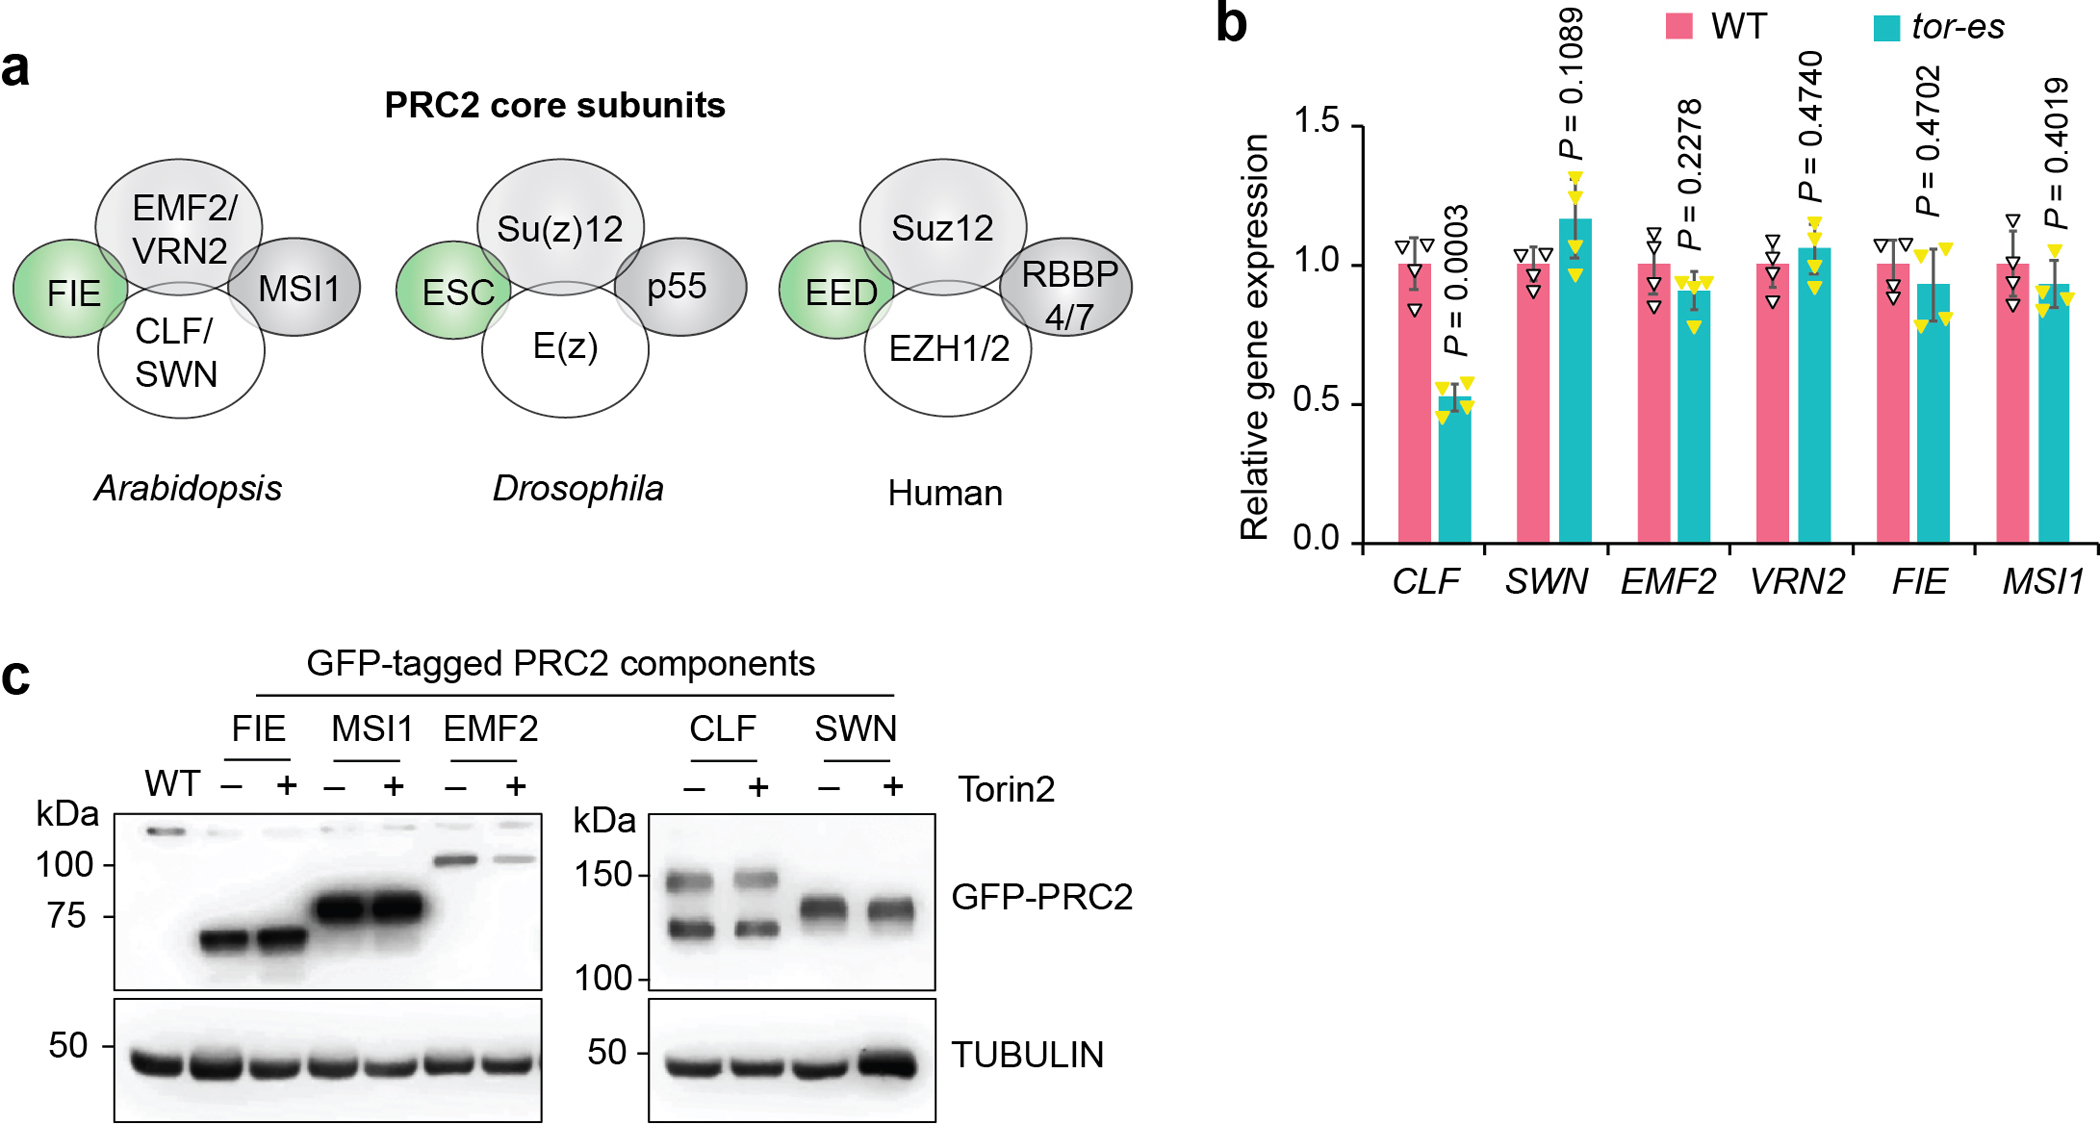
TOR kinase promotes nuclear FIE dynamics
The rapid H3K27me3 increase stimulated by glucose-TOR signalling and the genome-wide reduction of H3K27me3 in tor-es suggested that TOR might regulate the activity of nuclear PRC2. In postembryonic development, Arabidopsis PRC2 is composed of four evolutionarily conserved core subunits, including CURLY LEAF (CLF)/SWINGER (SWN) encoding methyltransferases, EMBRYONIC FLOWER2 (EMF2)/VERNALIZATION2 (VRN2) as scaffold proteins, histone-binding MULTICOPY-SUPPRESSOR-OF-IRA1 (MSI1), and the unique FIE with the WD40 structural fold6–8,10–12 (Extended Data Fig. 3a). We first examined the transcript and protein levels of PRC2 core components in tor-es or Torin2-treated seedlings, but only CLF transcript or EMF2 protein was partially reduced (Extended Data Fig. 3b, c). We postulated that TOR could interact with and phosphorylate the core components and activate PRC2. We employed a proximity-tagging system, pupylation-based interaction tagging (PUP-IT)27, to identify candidate substrates of TOR. A protein fusion between the bacterial Pup ligase (PafA) and the TOR-C-terminal kinase domain (TOR-C-PafA-HA) was generated and co-expressed with FLAG-tagged Pup(E) and MYC-tagged PRC2 components in mesophyll protoplasts (Fig. 2a). FIE was specifically pupylated by TOR-C-PafA-HA (Fig. 2b). FIE is an essential and unique component of PRC2 complex, as the fie null mutant abolishes global H3K27me3 and limits organogenesis beyond germination12. The specific interaction between TOR and FIE in vivo was confirmed by co-immunoprecipitation, which was significantly enhanced after stimulation by 5–50 mM glucose at 2 h (Fig. 2c, Extended Data Fig. 4a). FIE was directly phosphorylated in vitro by the TOR kinase immunoprecipitated from Arabidopsis plants4, which was specific and completely inhibited by Torin2 (Fig. 2d).
Fig. 2 |. Direct TOR phosphorylation promotes cytoplasm-to-nucleus translocation of FIE.
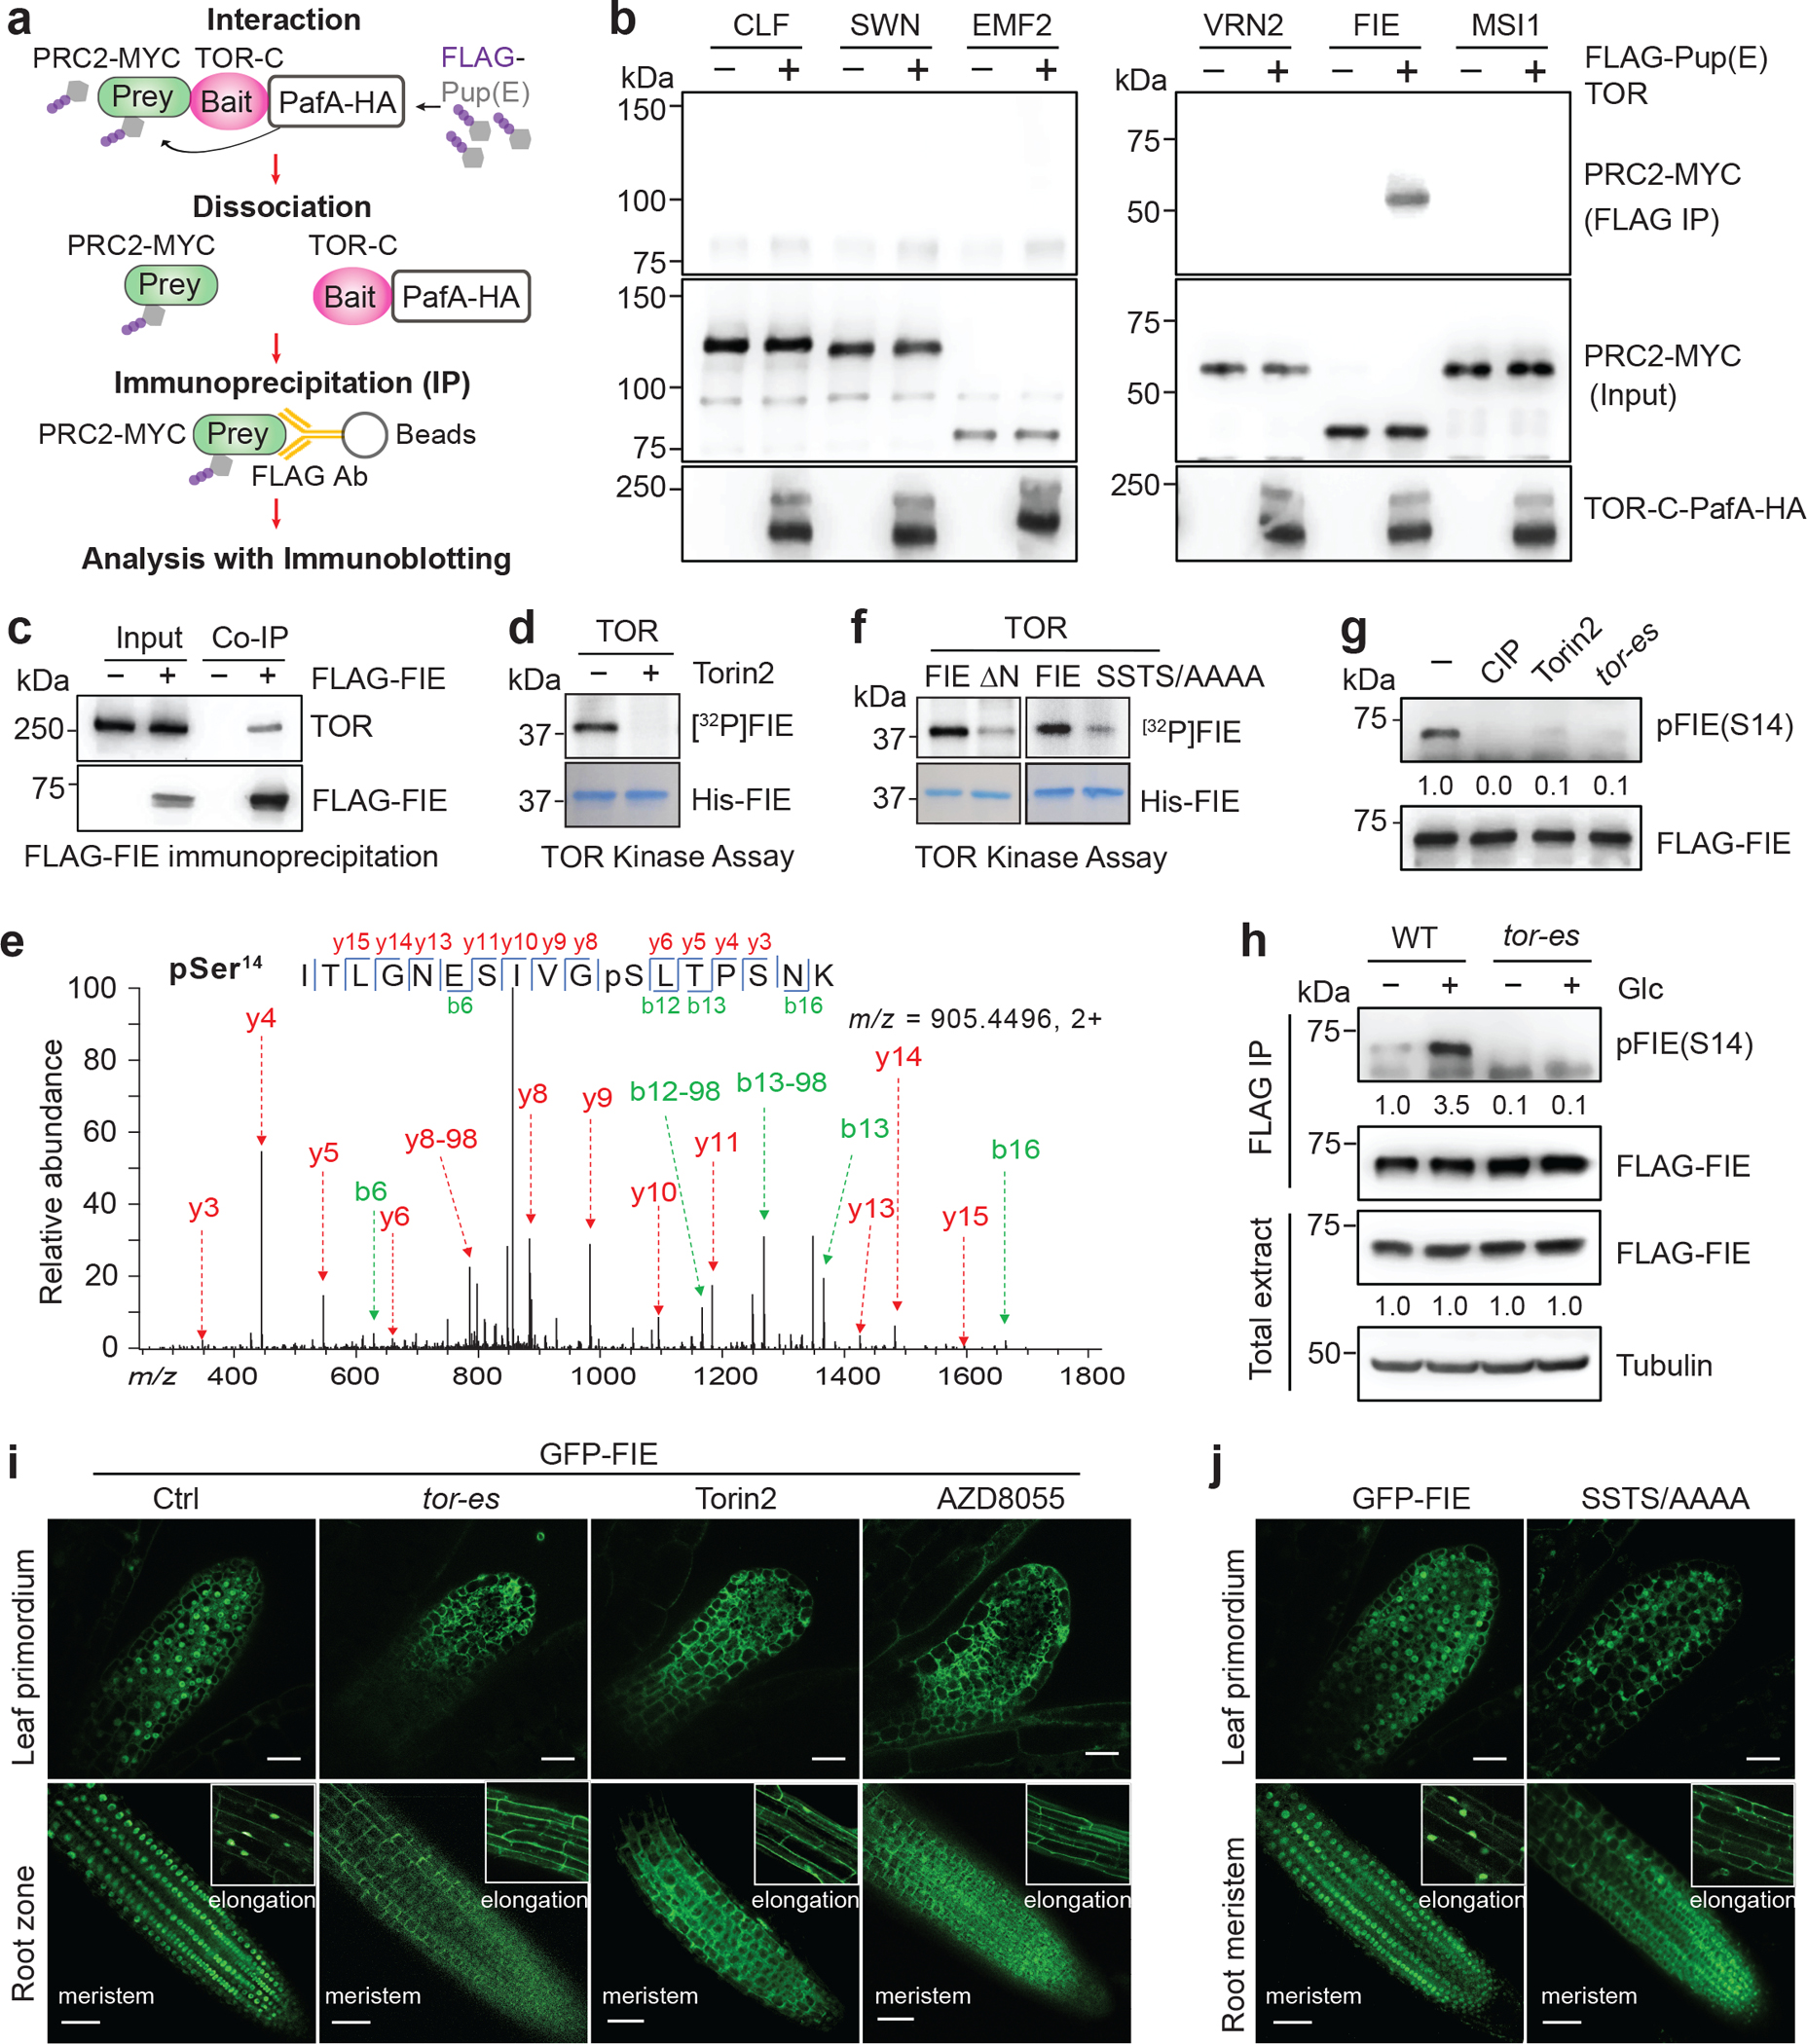
a, Schematic presentation of the proximity-tagging system PUP-IT. PafA, a bacterial Pup ligase, is fused to the C-terminus (1226–2480) of TOR (TOR-C) (bait). TOR-C-PafA-HA as a bait ligates 3XFLAG-Pup(E) to the K residue of interacting proteins (prey). The subunits of PRC2 were screened for interaction with TOR-C-PafA-HA by pupylation. b, Specific FIE and TOR interaction. Immunoblot analysis of PUP-IT screening of MYC-tagged PRC2 components with TOR-C-PafA-HA. c, TOR interacts with FIE in vivo. Coimmunoprecipitation (Co-IP) of FLAG-tagged FIE with TOR from formaldehyde crosslinked plants. Non-transgenic WT plants served as the control. d, TOR directly phosphorylates FIE in vitro. Phosphorylation of His-FIE by endogenous TOR from IP is shown with autoradiography (top). Protein loading control is shown by Coomassie blue staining (bottom). Torin2 specifically inhibits TOR kinase. e, S14 in FIE is phosphorylated by TOR in vivo by tandem mass spectrometry. f, Critical TOR phosphorylation sites in FIE. In vitro TOR kinase assays were conducted with FIE and mutants. ΔN, N-terminus deletion. SSTS/AAAA, the phosphorylation site mutant. g, Detection of FIE phosphorylation in vivo. CIP, calf Intestinal alkaline phosphatase. Values are the relative level of phosphorylation over the FLAG-GFP-FIE by IP, with blots in mock treatment set as 1.0. h, Glucose enhances pFIE(S14) levels. Immunoblot analysis of pFIE(S14) in FLAG-GFP-FIE by IP from 7-day starved and 25 mM glucose stimulated (2 h) WT and tor-es plants. i, j, Confocal images of GFP-FIE and GFP-FIE(SSTS/AAAA) in leaf primordia and roots. WT without (Ctrl) or with 10 μM of Torin2 or AZD treatment or tor-es (10 μM estradiol for 3 d). Inset, GFP images in the root elongation zone. Scale bar, 25 μm. Images are representative of six seedlings from three biological repeats. Data in b-g, and h are representatives of three biological replicates each. The samples derive from the same experiment and gels/blots were processed in parallel.
To define the TOR phosphorylation site in FIE, we analysed TOR-dependent phosphorylation sites from in vitro kinase assays by liquid chromatography-coupled tandem mass spectrometry (LC-MS/MS). We identified four main phosphorylation sites within the N-terminal domain of FIE, including S10, S14, T16 and S18 (Extended Data Fig. 4b–f). Structural modelling of FIE based EMBRYONIC ECTODERM DEVELOPMENT (EED), the human ortholog of FIE, predicted a flexible and S/T-rich N-terminal domain as a potential target for phosphorylation11,28 (Extended Data Fig. 4g). The phosphorylation of pS14, pT16 and pS18 in endogenous FIE was further validated by LC-MS/MS analyses in glucose-stimulated seedlings (Fig. 2e, Extended Data Fig. 4b). Since S14A was the only single mutation in FIE showing significant phosphorylation reduction in the TOR kinase assay, other phosphorylation sites likely play partially redundant and cooperative functions (Extended Data Fig. 4h). The FIE mutants with the N-terminal 34-residue deletion (ΔN) or the quadruple phosphorylation site mutant (SSTS to AAAA) was barely phosphorylated by TOR (Fig. 2f, Extended Data Fig. 4h). The key phosphorylation sites in FIE proteins are largely conserved among diverse flowering plants, including Arabidopsis, Brassica, soybean, rice, maize and wheat, and possibly in fly ESC and human EED, orthologs of plant FIE29 (Extended Data Fig. 5a, b).
To functionally validate and quantify endogenous FIE phosphorylation, we generated a phosphopeptide-specific antibody targeting the phosphorylated form of FIE at S14, which was the most highly enriched and confident site validated by LC–MS/MS analyses in vitro and in planta (Fig. 2e, Extended Data Fig. 4b, d). This antibody specifically recognized the TOR-phosphorylated FIE, but not the S14A mutant (Extended Data Fig. 5c). The in vivo phosphorylation of FIE at S14, pFIE(S14), immunoprecipitated from seedlings was not detectable after the calf-intestine phosphatase treatment. Moreover, pFIE(S14) was largely abolished in seedlings treated with Torin2 or in tor-es plants (Fig. 2g). Immunoblot analysis showed that pFIE(S14) was significantly induced within 2 h by 5–50 mM glucose after starvation, which was abolished in 7-d tor-es seedlings (Fig. 2h, Extended Data Fig. 5d). These results demonstrated that the N-terminus of FIE is directly phosphorylated in glucose-TOR signalling.
We next explored how TOR phosphorylation regulates FIE function. We found that the stability of GFP-FIE was not affected in both tor-es and Torin2-treated plants by immunoblot analysis (Extended Data Fig. 5e). The recombinant Arabidopsis PRC2 complexes with WT or the mutant form (SSTS/AAAA) of FIE exhibited similar H3K27me3 methyltransferase activity in vitro (Extended Data Fig. 5f). It has been reported that cytoplasmic FIE-GFP exclusively interacting with MEDEA (MEA) methyltransferase but not CLF or SWN in inflorescences. It was postulated that the cytoplasmic FIE-GFP might have alternative non-nuclear functions beyond chromatin methylation30. Here, we tested the possibility that TOR phosphorylation promotes the cytoplasm-to-nuclear translocation of GFP-FIE to activate PRC2 (Extended Data Fig. 6a). Distinct from the predominant nuclear localization in control plants grown in sugar-containing nutrient medium, GFP-FIE was primarily detected in the cytoplasm in differentiating leaf primordia and root elongation (insets) and root meristem zones when the TOR activity was inhibited in tor-es or by TOR inhibitor Torin2 or AZD8055 in 5-day seedlings (Fig. 2i, Extended Data Fig. 6b). However, the nuclear localization of other PRC2 components, GFP-CLF, SWN-GFP, EMF2-GFP or MSI1-GFP, was not altered by Torin2 treatment in roots (Extended Data Fig. 6c). Importantly, the mutation of four TOR-phosphorylated sites (SSTS/AAAA) compromised the nuclear translocation of GFP-FIE in protoplasts and in transgenic plants without affecting the protein level (Fig. 2j, Extended Data Fig. 6b, d, e). The C/N ratio of GFP-FIE quantitatively increased during the sugar starvation phase in the root elongation zone, while the C/N ratio was rapidly decreased upon glucose treatment after 5-d starvation (Extended Data Fig. 6f–j). Time-lapse live imaging showed that glucose rapidly stimulated real-time nuclear translocation of GFP-FIE within 2–4 h, coinciding with the H3K27me3 level increase (Fig. 1e, Supplementary Video). In contrast to the conventional view of a preformed nuclear PRC2 with FIE as a key static component interacting with CLF/SWN and binding to H3K27me3 in the nucleus6–8,10–12,30, the new findings revealed that FIE serves as a molecular bridge for a direct connection between glucose-TOR signalling and PRC2-regulated H3K27me3 dynamics and gene silencing.
TOR phosphorylation of FIE controls development
To elucidate the molecular functions of the phosphorylated FIE by TOR kinase, we introduced GFP-FIE or the phosphorylation site mutant (SSTS/AAAA) under the control of the FIE promoter into heterozygous fie/+ plants. Homozygous GFP-FIE/fie and SSTS/AAAA/fie plants were selected for genome-wide H3K27me3 and transcriptome analyses. Conditional fie mutants that bypass embryonic lethality were also generated to provide a parallel comparison with SSTS/AAAA/fie (Extended Data Fig. 7a–d). The estradiol-inducible fie-amiR-es transgenic lines eliminated FIE protein and exhibited consistent aberrant small, narrow and curled true leaves sharing some features with the occasional FIE co-suppressed plants31 (Extended Data Fig. 7b–d). The fie null mutant seeds generated with the heterozygous fie/+ cdka;1/+ pollen only forms undifferentiated callus-like structures after germination and blocked further postembryonic development12. Unlike fie, the new SSTS/AAAA/fie mutant and fie-amiR-es were weaker fie mutants capable of postembryonic development and organogenesis powered by photosynthesis or exogenous glucose4, thus provided a valuable platform to investigate the physiological functions of the glucose-TOR-FIE-PRC2 signalling network.
Quantitative immunoblot and ChIP-Rx-seq analyses revealed greatly decreased global H3K27me3 levels across the genome in the 14-d vegetative shoots of SSTS/AAAA/fie and fie-amiR-es mutants compared with those in WT and GFP-FIE/fie (Fig. 3a, b, Extended Data Fig. 7e, f, Supplementary Table 3). The SSTS/AAAA/fie mutant showed higher H3K27me3 reduction than those by TOR inhibition, suggesting that the phosphorylation mutant of FIE was decoupled from other TOR-regulated processes including DNA-replication that could limit H3K27me3 dilution when PRC2 was inhibited2–5,15 (Fig. 1a and Extended Data Fig. 1b–d, 2b–d). As a parallel control, GFP-FIE expression in the null fie mutant restored the H3K27me3 landscape (Fig. 3a, b, Extended Data Fig. 7e, f, Supplementary Table 3). Genome-wide H3K27me3 target genes previously identified by ChIP-chip analyses in 14–20-d WT seedlings significantly overlapped with our data by quantitative ChIP-Rx-seq analyses in 14-d WT shoots (Extended Data Fig. 7g)12,32. Consistent with the genome-wide profiling, H3K27me3 occupancy was decreased at selected target loci with key developmental roles6–8,12,31,32 in the SSTS/AAAA/fie and fie-amiR-es mutants (Fig. 3c).
Fig. 3 |. The targeted FIE phosphorylation mutation abrogates global H3K27me3 landscape to reprogram transcriptome and disrupt organogenesis.
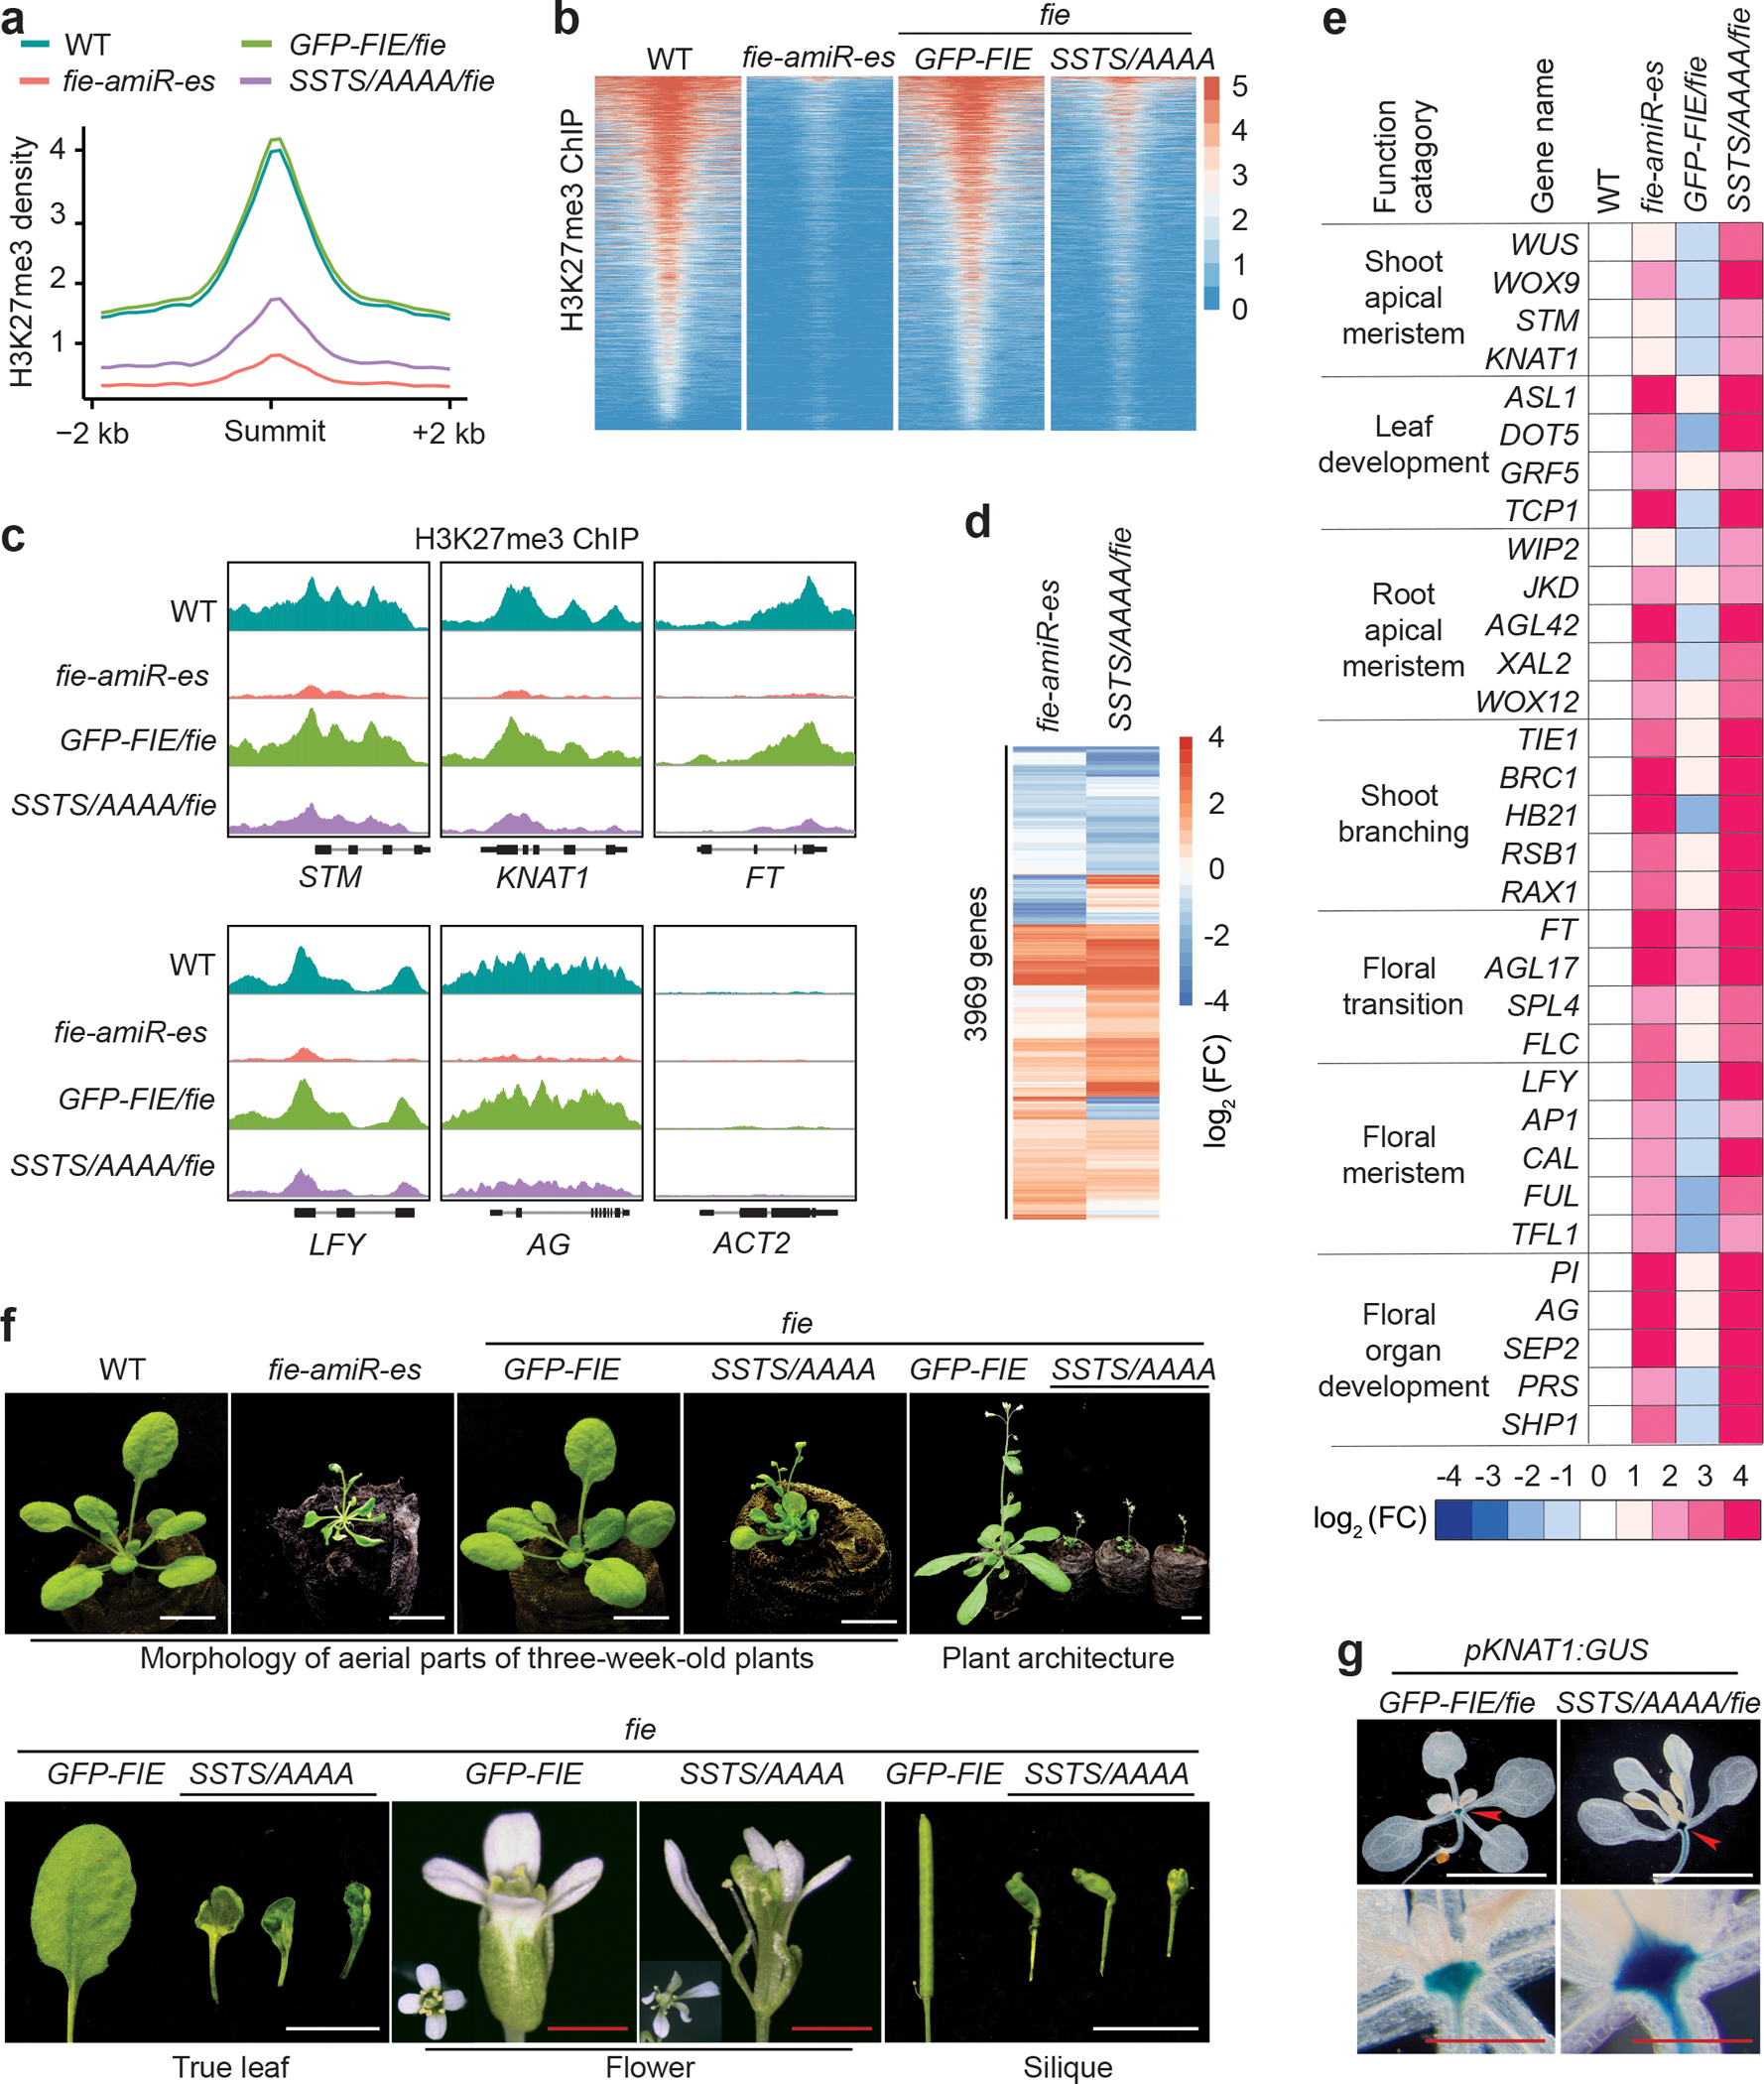
a, Significant reduction of global H3K27me3 levels in 14-day fie mutant plants. Metaplots show ChIP-Rx-seq read density of H3K27me3 ±2 kb from their peak summits. The ChIP-seq data are normalized with an exogenous reference genome. b, Depletion of H3K27me3 in fie mutants. Heatmap of H3K27me3 enrichment are shown. The colour scale indicates RRPM surrounding peak summit from the ChIP-Rx-seq data. c, The IGV browser view of H3K27me3 occupancy at PRC2 target genes. ACT2, a non-PRC2-target gene, serves as a negative control. d, Transcriptome reprogramming in 14-day fie mutants. Heatmap shows transcriptomic changes of fie-amiR-es (verse WT) and SSTS/AAAA (verse GFP-FIE) by RNA-seq analyses. e, Comparative expression analyses of key transcription factor genes in diverse developmental programs. A heatmap of RNA-seq data from triplicate biological samples prepared from WT, fie-amiR-es, GFP-FIE/fie, and SSTS/AAAA/fie plants is shown. The RNA expression data were normalized to the value in WT. f, The fie mutants display broad developmental aberrance. The fie-amiR-es and SSTS/AAAA/fie mutants exhibit small, narrow and curled leaves and flower prematurely (21d). The SSTS/AAAA/fie mutants develop thin, short and terminal inflorescence with aborted flower buds, narrow, split and twisted sepals and petals, enlarged carpel, as well as short, bulged and contorted siliques (30d). g, Histochemical staining of the 14-day pKNAT1-GUS transgenic plants in GFP-FIE/fie and SSTS/AAAA/fie. Red arrowhead, the shoot apical meristem. Three biological replicates, n > 10 plants in each experiment. White scale bar, 10 mm. Red scale bar, 1 mm.
Transcriptome profiling by RNA-seq identified a total of 3969 genes (|log2 fold change| ≥ 1; q ≤ 0.05, n=3) that were dysregulated in the 14-d shoots of SSTS/AAAA/fie and fie-amiR-es plants (Fig. 3d, Supplementary Table 4). To uncover the biological functions of the TOR-FIE-PRC2 signalling network, we defined the putative direct target genes that were marked by H3K27me3 and up-regulated in the SSTS/AAAA/fie mutant (Extended Data Fig. 8a, Supplementary Table 5). Gene Ontology analysis of 1081 (log2 fold change ≥ 1; q ≤ 0.05) TOR-FIE-PRC2 target genes revealed remarkable enrichment for transcription factors and regulators controlling a broad spectrum of developmental programs (Extended Data Fig. 8b, Supplementary Table 6). Notably, we identified 192 transcription factor genes (Supplementary Table 7) including master regulators with essential roles in stem-cell identity, cell fate determination, patterning, and developmental transitions that were significantly upregulated and associated with reduction of H3K27me3 in SSTS/AAAA/fie and fie-amiR-es mutants (Fig. 3e, Supplementary Table 5, 7). In particular, the expression of shoot apical meristem (SAM) specific transcription factors defining the indeterminant cell fate33, increased in the mutant plants. The abnormal expression of root quiescent centre and stem cell regulators34,35 were detected in the 14-d shoots. The key floral integrators controlling vegetative-to-reproductive transition were precociously derepressed at the vegetative seedling stage. We also observed the ectopic activation of floral meristem and floral homeotic genes36 in seedlings. Important transcription factor genes governing leaf development37,38, as well as shoot branching16,39, were also overexpressed in the SSTS/AAAA/fie and fie-amiR-es mutants (Fig. 3e, Extended Data Fig. 8c, Supplementary Table 5, 7).
In 7-d seedlings, grown in liquid medium and optimal for starvation, glucose, and tor-es experiments4,15,21, RT-qPCR analysis showed that a subset of TOR-FIE-PRC2-H3K27me3 target genes were upregulated and this was correlated with a reduction of H3K27me3 as shown by ChIP-qPCR analysis (Extended Data Fig. 8d, e). Consistently, in the sugar-starved 7-day seedlings, glucose initiated the repression of these genes correlated with elevated H3K27me3 at 6 h (Extended Data Fig. 8f, g). Although target gene regulation by tor-es or glucose was more subtle in 7-d seedlings than in 14-d SSTS/AAAA/fie and fie-amiR-es mutant plants (Fig. 3e and Extended Data Fig. 8c), our findings suggest that the glucose-TOR-FIE-PRC2 signalling pathway controls target genes encoding key transcription factors via an epigenomic mechanism (Supplementary Table 7). Future research will be required to elucidate the detailed integration of distinct TOR signalling mechanisms in temporospatial modulation of epigenomic and transcriptomic controls of key regulators in diverse processes during different stages of postembryonic development at organ, tissue and single-cell levels.
The consequences of H3K27me3 and transcriptome reprogramming in SSTS/AAAA/fie plants were clearly manifested in the profound disruption of temporal and spatial orders of the innate genetic programs guiding plant differentiation and development31,33–40. Strikingly, in 21–24-d plants covering broader developmental stages, the SSTS/AAAA/fie plants displayed grossly aberrant developmental phenotypes similar to those in fie-amiR-es lines, including early flowering, abnormalities in the size, morphology and patterning of leaves, flowers and siliques, reduced branching with miniature plant architecture and terminal flowers, infertility (Fig. 3f, Extended Data Fig. 7d), as well as enlarged SAM indicated by the pKNAT1:GUS reporter (Fig. 3g). The expression of GFP-FIE in the null fie mutant fully restored the size and morphology of organs, whole plant architecture, developmental timing, and fertility (Fig. 3f, Extended Data Fig. 7d). These data indicate that TOR phosphorylation of FIE plays a vital role in gating PRC2-mediated epigenomic reprogramming in diverse postembryonic developmental programs throughout the plant life.
Glucose-TOR-FIE signalling gates vernalization
To further explore how this direct molecular link between glucose-TOR signalling and H3K27me3 dynamics is involved in a defined developmental program, we studied vernalization-induced flowering. This process involves H3K27me3-mediated silencing of the floral transcription repressor FLOWERING LOCUS C (FLC) by prolonged cold treatment, which provides a paradigm to study environmentally regulated epigenetic dynamics during developmental phase transitions40–43. FLC was activated in the SSTS/AAAA/fie and fie-amiR-es mutants (Fig. 3e) and sugar accumulation was found to be associated with prolonged cold treatment and floral induction13,44,45, but its physiological importance remains a mystery. To decipher the role of glucose-TOR signalling in vernalization-mediated floral transition, we showed that prolonged cold exposure significantly induced sustained glucose accumulation in the Col-FRIGIDA (FRI) line (Fig. 4a). The functional FRI allele confers the vernalization-dependent floral transition in Arabidopsis42. The elevation of endogenous TOR activity quantified by pS6K1(T449) intimately matched the profile of intrinsic glucose surge during vernalization in FRI and was abolished by potent and specific TOR inhibitors, Torin2 or INK128 (1 μM) (Fig. 1f, g, Fig. 4b). These results suggest that glucose induced TOR activation may regulate vernalization.
Fig. 4 |. Glucose-TOR-FIE signalling stimulates vernalization-mediated floral transition.
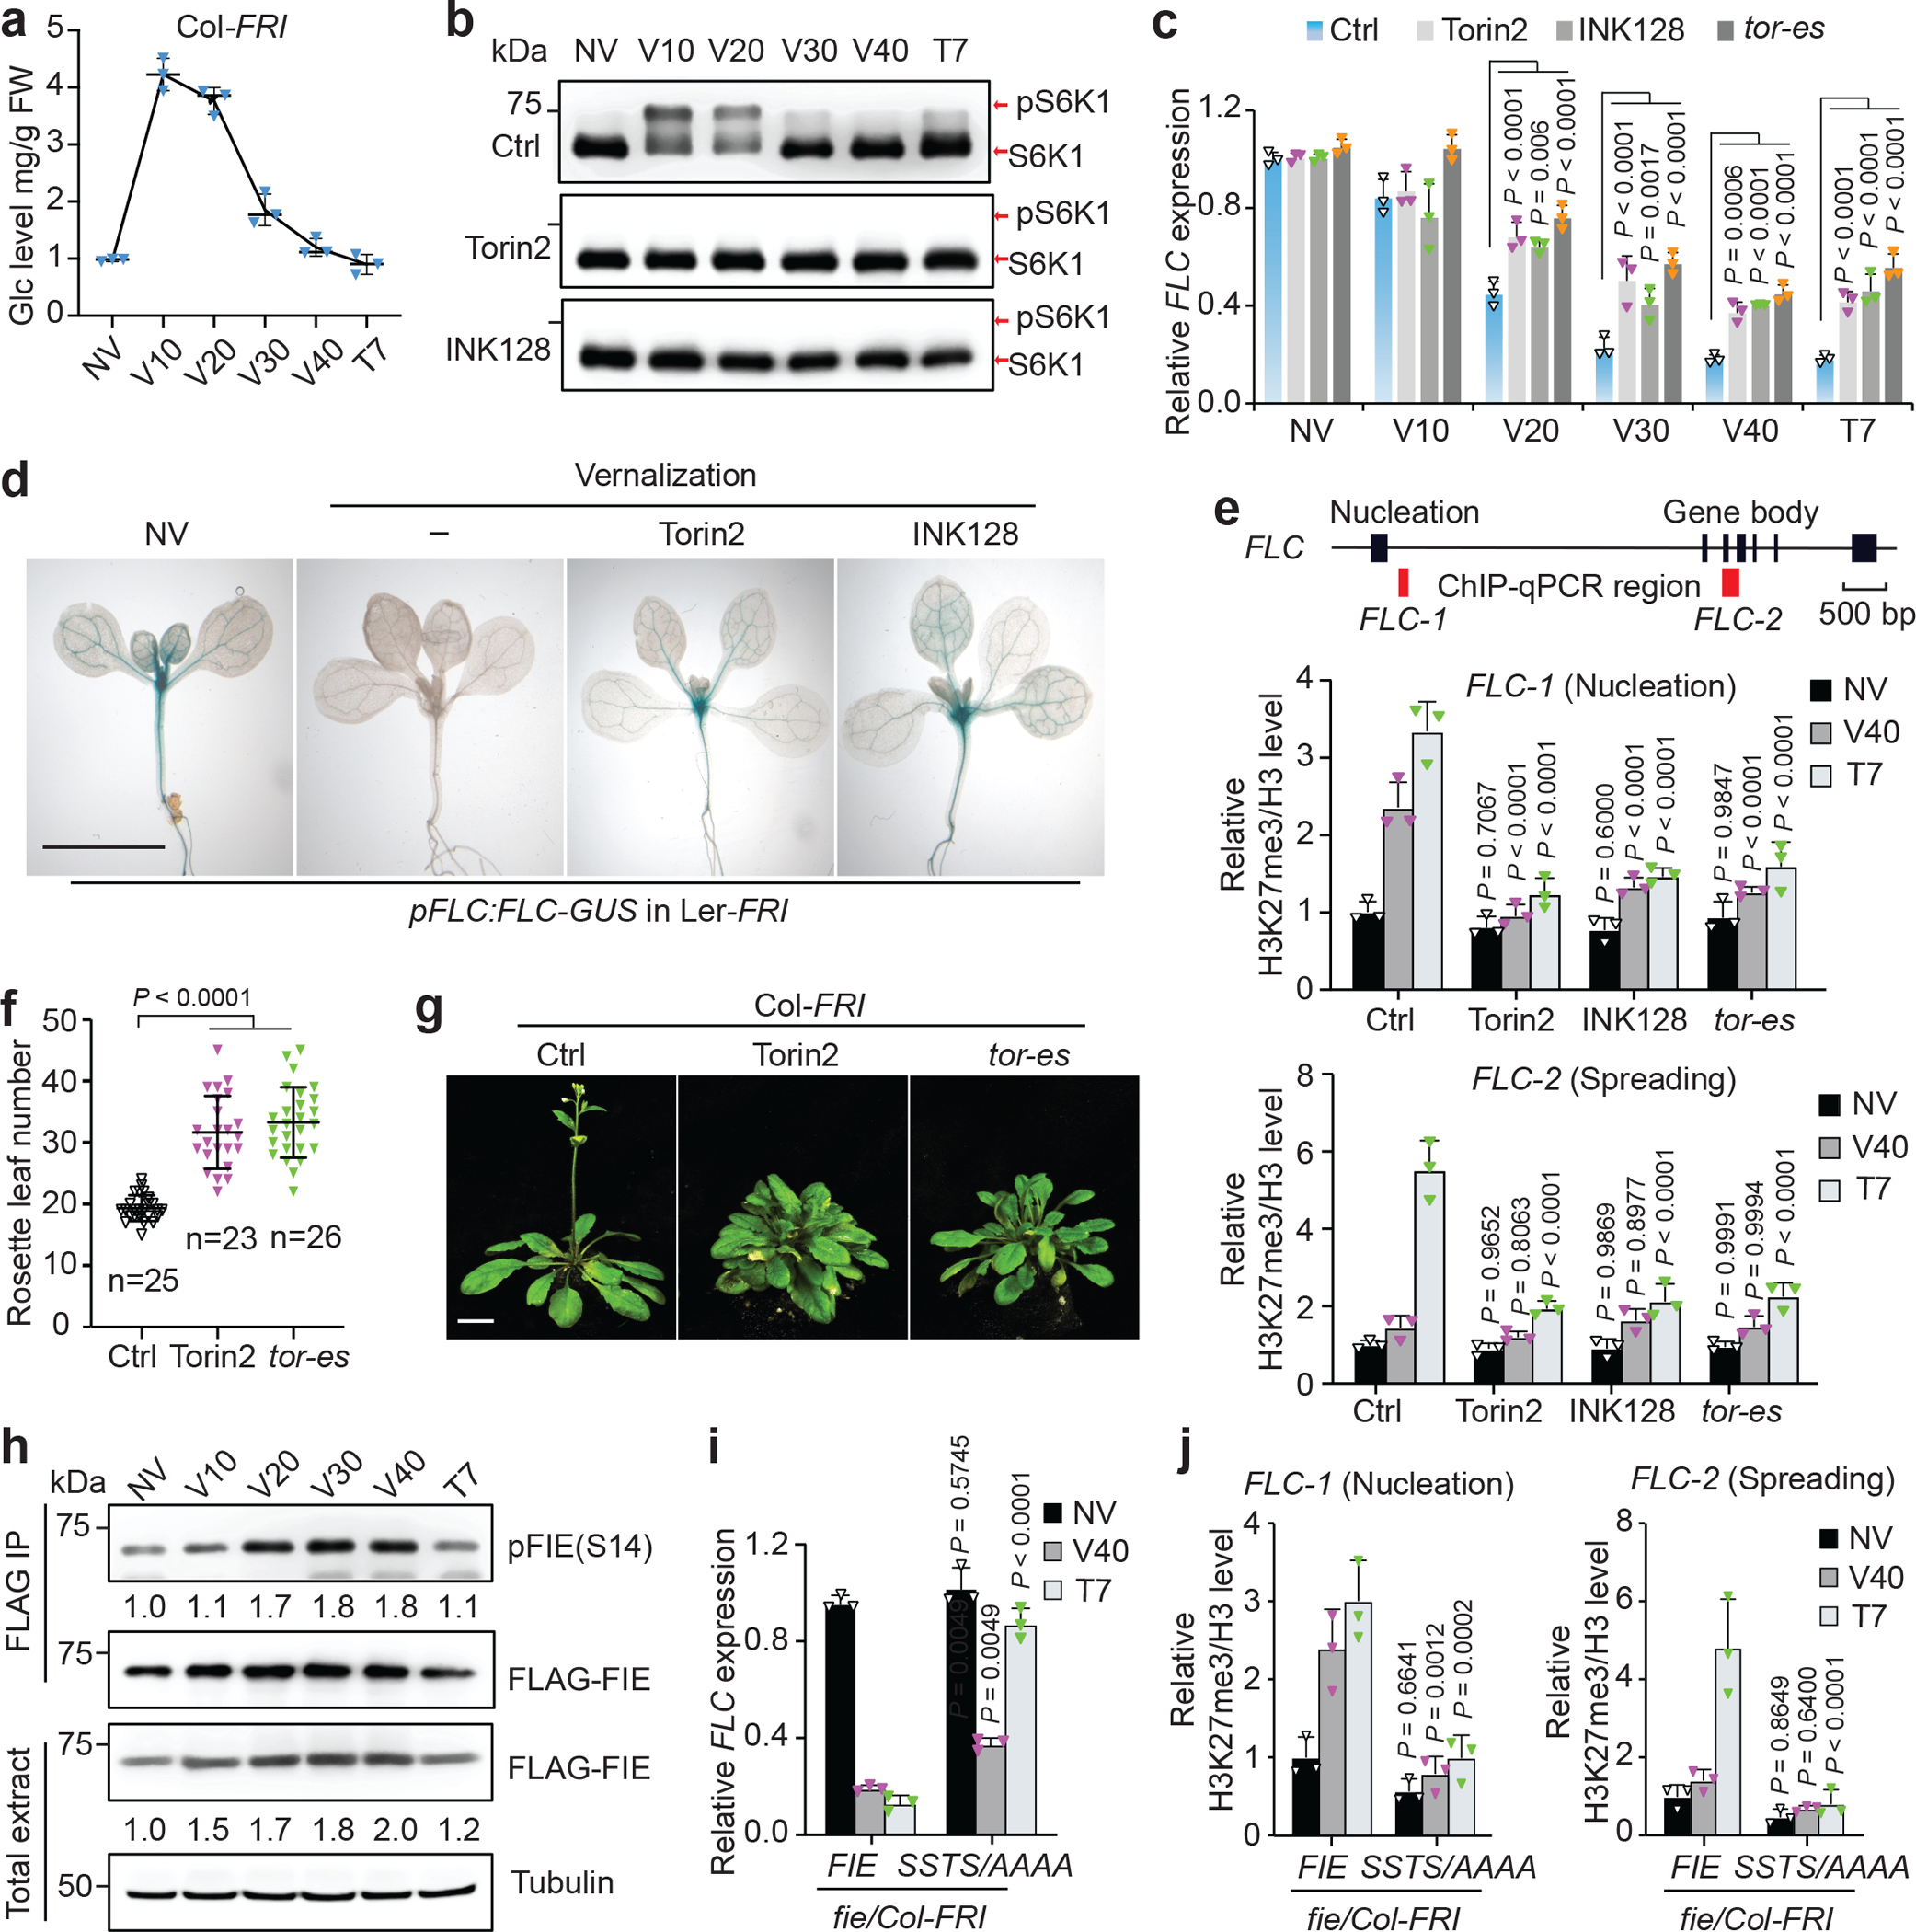
a, Vernalization induces glucose accumulation in Col-FRI plants. NV, non-vernalized. V, vernalization days at 4°C. T, postcold days at 22°C. (n = 3 biological repeats). b, Vernalization stimulates TOR activity. TOR activity is monitored by the band shift of S6K1-HA, indicating phosphorylated S6K1 (pS6K1). c, TOR promotes FLC repression by vernalization. d, TOR inhibitors prevent vernalization-mediated repression of the FLC reporter. Histochemical staining of the pFLC:FLC-GUS (Ler-FRI) transgenic plant before and after vernalization without or with TOR inhibitors (1 μM Torin2, INK128). Scale bar, 10 mm. e, TOR deficiency reduces H3K27me3 levels at FLC. Black boxes, exons. Red boxes, selected regions for H3K27me3 ChIP-qPCR analyses. bp, base pairs. FLC-1 and FLC-2 are located in the nucleation and spreading regions of H3K27me3 at FLC, respectively. f, TOR is required for vernalization. Flowering time analyses by counting rosette leaf numbers when bolting after vernalization. Data are shown as mean ± s.d. (n = individual plants). g, Representative flowering phenotype of the indicated plant at bolting after vernalization. Scale bar, 10 mm. h, Phosphorylated FIE is elevated during vernalization. Immunoblot analysis of the total and phosphorylated FIE proteins upon vernalization treatment. Values are the relative level of phosphorylated FIE/FLAG-FIE by IP. NV is set as 1.0. i, Repression of FLC by vernalization is diminished in SSTS/AAAA/fie/Col-FRI plants. j, Vernalization induced H3K27me3 levels during two silencing phases at FLC are compromised. c, i, Relative FLC/UBC21 expression normalized to the non-vernalized (NV) level of ctrl or fie/Col-FRI plants. e, j, Relative H3K27me3/H3 level normalized to that of ctrl or fie/Col-FRI plants under non-vernalized (NV) condition as 1. Data in c, e, i, j show mean ± s.d. from 3 biological replicates, two-way ANOVA with Tukey’s multiple comparisons test; f, one-way ANOVA with Tukey’s multiple comparisons test. Data in b and h are representatives of three biological replicates each. The samples derive from the same experiment and gels/blots were processed in parallel.
To strengthen the molecular link between the glucose-TOR-FIE-PRC2 signalling relay and vernalization, we quantified FLC expression, PRC2-mediated H3K27me3 marks on the FLC chromatin and flowering time. FRI was introduced into tor-es, GFP-FIE/fie and SSTS/AAAA/fie for comparative analyses. Cold-induced repression of FLC was impaired by specific TOR inhibitors and in the tor-es mutant (Fig. 4c), whereas the activation of VIN3 (VERNALIZATION INSENSITIVE3) was unaffected during the same cold exposure (Extended Data Fig. 9a). To monitor the FLC expression dynamics and locations in intact plants, the transgenic pFLC:FLC-GUS (Ler FRI) line carrying the FLC promoter and a GUS translational fusion was visualized by histochemical staining. Consistent with the RNA expression results, the reduction of the FLC reporter expression in the SAM and vasculature upon vernalization was prevented by TOR inhibitors (Fig. 4d).
Cold-induced silencing of FLC by PRC2 was characterized by two phases: the initial nucleation and the propagation of H3K27me3 on the FLC locus42. We found that both phases were impaired in tor-es or by TOR inhibitors (Fig. 4e, Extended Data Fig. 9b). In addition, plants with conditional TOR deficiency during vernalization exhibited delayed flowering time after returning to ambient temperature with full TOR activity (Fig. 4f, g). These results demonstrate that FLC repression during vernalization requires TOR activity. Prolonged cold treatment markedly increased the accumulation of glucose (Fig. 4a), pS6K1 (Fig. 4b), pFIE(S14), total FIE protein level (Fig. 4h), and the quantitative nuclear localization of GFP-FIE (Extended Data Fig. 9c, d), which prompted the initial nucleation of H3K27me34,40,42,43. The phosphorylation and nuclear localization of FIE were sustained even after the extraordinary glucose surge was declined after 30 days of vernalization presumably due to continuous energy expenditure with limited photosynthesis under cold treatment4,46. The steady state glucose level, TOR activity and FIE phosphorylation and localization resumed to support normal and dynamic photosynthesis-driven glucose-TOR-FIE signalling for the maintenance and spreading of H3K27me3 after plants were returned to the warm temperature4,40,42,43,46. The differential dynamics of pS6K1 and pFIE dephosphorylation during vernalization (Fig. 4b, h) suggested that distinct glucose-TOR substrates for divergent downstream signalling processes may exhibit different kinetics and regulation. Vernalization-mediated FLC repression was diminished during the cold exposure but recovered after cold in the SSTS/AAAA/fie mutant (Fig. 4i), resembling the vernalization-defective vin3, vrn2 and vrn5 mutants40,42. Consistently, the nucleation and spreading of H3K27me3 enrichment at FLC in response to vernalization were abolished in the SSTS/AAAA/fie mutant plants (Fig. 4j, Extended Data Fig. 9e). Together, these data indicate that specific FIE phosphorylation by glucose-TOR signalling modulate vernalization-mediated floral transition.
Discussion
In this study, we report the direct molecular link between glucose-TOR signalling and PRC2 regulation. TOR kinase, activated by glucose derived from local or systemic carbon sources, phosphorylates FIE at S14 and other cooperative sites (S10/T16/S18) and promotes its cytoplasm-to-nucleus translocation to enhance PRC2 activity. In the nucleus, the active FIE-PRC2 complex is likely recruited by transcription repressors, cis-regulatory elements, and non-coding RNAs to deposit H3K27me3 for silencing of key transcription factor genes that modulate cell fate determination, developmental transitions and organ patterning in Arabidopsis6–8,10,40,42,43,47–49. We propose that this newly defined signalling axis serves as a nutritional checkpoint for regulating PRC2 activity throughout key differentiation phases and processes during plant postembryonic development (Fig. 3, 4 and Extended Data Fig. 10). Interestingly, a recent preprint reported TOR regulation of H3K27me3 target genes that are activated by stress conditions beyond normal developmental programs or vernalization50.
A fascinating feature of the postembryonic growth and development in plants is the indeterminate stem cell niche in the meristems, which continuously supply new cells for root, leaf, stem, flower, and fruit organogenesis beyond the simple embryo designed for nutrient storage and dormancy12,33,34. Our genome-wide analyses define diverse master transcription factors as target genes of the glucose-TOR-PRC2 signalling network and key to major developmental programs (Fig. 3, 4, Extended Data Fig. 8, 10, Supplementary Table 7). This glucose-stimulated epigenomic network promotes faithful differentiation and developmental transitions, including stem cell to meristem/primordium switch, juvenile to adult organogenesis, axillary meristem to branching, and reproductive processes from flowering to silique development (Extended Data Fig. 10a). This new molecular switch ensures that the proliferation and differentiation processes during organ growth and patterning in time and space are integrated and coordinated with adequate nutrient and energy support. Importantly, under the prolonged-cold condition, the glucose-activated TOR-FIE-PRC2 relay overrides the default vegetative program by silencing the floral repressor FLC, which may suggest how sugars support the vernalization-induced flowering44 (Extended Data Fig. 10b). These molecular connections provide a long-sought mechanistic explanation for how glucose signalling regulates multiple developmental processes in plants. This study advances a conceptual understanding of how multicellular organisms transmit systemic nutrient information to remodel global chromatin states and modulate local cellular chromatin regulators, thus orchestrating the transcriptional landscape that is central to cell fate regulation in diverse developmental programs.
METHODS
Plasmid constructs and the generation of transgenic plants
The pFIE:FLAG-GFP-FIE construct includes 2.5kb upstream and 1.3kb downstream sequences of the FIE coding region in the pCAMBIA1300 binary vector as previously described for generating transgenic plants51. The triple FLAG tag sequence was introduced along with the promoter sequence and GFP was inserted between the FLAG and the first ATG codon sequences. The phosphorylation site mutation pFIE-FLAG-GFP-FIE (SSTS/AAAA) construct was generated by replacing the FIE sequence using site-directed mutagenesis. These binary plasmids were transformed into heterozygote fie+/− (GK-534F01–020364) mutant plants by using the Agrobacterium tumefaciens (strain GV3101)-mediated floral-dip method52. Positive transformants were selected based on hygromycin resistance and confirmed by immunoblot analysis using an anti-FLAG antibody. At the T3 generation, GFP-FIE/fie and SSTS/AAAA/fie plants were confirmed by genotyping using primers listed in Supplementary Table 8.
To generate the estradiol-inducible FIE artificial miRNA mutant (fie-amiR-es) transgenic plants, optimal amiRNAs were first selected using the epitope-tagged protein-based amiRNA (ETPamir) screens in protoplast assays53. To generate the amiRNA expression constructs, candidate amiRNA sequences were cloned into the pUC119-RCS plasmid. To generate the target construct for amiRNA screens, the coding region of the FIE cDNA was PCR amplified and cloned into the plasmid with a heat shock promoter (pHSP) to generate pHSP-FIE-FLAG-NOS. The pHBT-GFP-HA plasmid was used as a control for protoplast co-transfection and internal control as described53. After screening in protoplast, the optimal amiRNA was amplified and transferred to the estradiol-inducible vector pLB1254. Positive transformants were selected based on kanamycin resistance.
For the PUP-IT proximity-tagging system27 (for Fig. 2a, 2b), the sequences of p2X35S-3XFLAG-pup (E) and pUBQ10-PafA-HA were synthesized and inserted into the pCAMBIA1300 binary vector, resulting in pCambia-PUP-IT. The sequence encoding the C-terminus (1226–2480) of TOR (TOR-C) was amplified by PCR to generate the plasmid with pUBQ10-TOR-C-PafA-HA and p2X35S- 3XFLAG-pup (E). The coding region sequences of PRC2 components, including CLF, SWN, EMF2, VRN2, FIE and MSI1, were amplified by PCR and cloned into the pHBT-MYC plant expression vector55. For the confocal imaging of FIE mutants in mesophyll protoplasts, the coding region of FIE was first amplified by PCR and cloned into the pHBT-GFP expression vector, resulting in pHBT-GFP-FIE. The mutant variants were generated by site-directed mutagenesis using pHBT-GFP-FIE as a template. For the expression of recombinant FIE protein and its mutant variant proteins in E. coli, the coding region of FIE was first amplified by PCR and cloned into the pET14b expression vector, resulting in pET14b-FIE. The mutant variants were generated by site-directed mutagenesis using pET14b-FIE as a template. We produced the recombinant protein for each of four core subunits of the plant PRC2 complexes using the SF9 insect cells. The coding sequences of FIE and its phosphorylation site mutation SSTS/AAAA with triple-FLAG tags at the N-terminus were cloned into the pFastBac1 vector. The coding sequences of the other PRC2 subunits CLF, EMF2 and MSI1 were cloned into the pFastBac1 vector with His tags at their N-terminus. All constructs were verified by Sanger-sequencing. The primers used for plasmid construction and site-directed mutagenesis are listed in Supplementary Table 8.
Plant materials
The Arabidopsis thaliana ecotype Columbia (Col-0) was used as wild-type (WT) plants in this study, unless otherwise stated. The estradiol-inducible RNAi tor-es mutant and the S6K1-HA transgenic line have been described previously21. The transgenic plants expressing PRC2 components, pSWN:SWN-GFP56, p35S:GFP-CLF57, pEMF2:EMF2-GFP58, pMSI1:MSI1-GFP58 have been described previously. The T-DNA null mutants in canonical TORC1, including raptor1 (SALK_078159)24, raptor2(SALK_043920)24, lst8–1-2 (SAIL_641_D10)25, and lst8–2 (SALK_018605), were confirmed by genotyping and qRT-PCR in this study. Transgenic plants GFP-FIE/fie, SSTS/AAAA/fie, and fie-amiR-es were generated in this study as described below. Col-FRISF2 (Col-FRI)42 and pFLC:FLC-GUS in Ler-FRI59 lines were used for the vernalization analysis. The pFIE:FLAG-GFP-FIE construct was introduced into Col-FRI, tor-es or fie-amiR-es by genetic crossing, antibiotic selected, and confirmed by PCR-based genotyping and immunoblot analyses. Col-FRI was crossed with S6K1-HA, tor-es, GFP-FIE/fie or SSTS/AAAA/fie and confirmed by PCR-based genotyping and immunoblot analyses. The pKNAT1:GUS60 line was introduced into GFP-FIE/fie and SSTS/AAAA/fie by genetic crossing and confirmed by PCR-based genotyping.
Plant growth conditions
Seeds were surface sterilized with 70% ethanol and bleach (25% bleach + 0.02% Triton X-100 for 10 min), washed with sterile water three times, and stratified at 4°C for three days prior to plating. Sterilized seeds were planted and germinated in a nutrient rich sugar-containing medium, liquid ½ MS medium (½ MS, 2 mM MES, and 0.5% sucrose, pH 5.7) or on solid ½ MS medium (½ MS, 2 mM MES, 0.5% sucrose, and 0.6% phytoagar, pH 5.7). To analyse the effect of TOR activity on plant growth and development (for Fig. 1a, Extended Data Fig. 1a, 1b), Torin2 at indicated concentrations (0, 0.1, 0.5, 1, 5, 10 μM), 10 μM estradiol, or DMSO only, were added at the time of seed germination for 8 days. To quantify the histone methylation marks and gene expressions in WT and the tor-es mutant (for Fig. 1b, 1c, Extended Data Fig. 1a–d, 3b, 8d, 8e), seeds were planted and germinated in liquid ½ MS medium (½ MS, 2 mM MES, and 0.5% sucrose, pH 5.7) for seven days. On the fourth day, 10 μM estradiol was added to the medium to deplete TOR in tor-es plants. For the sugar starvation experiment (for Fig. 1d, 1e, Extended Data Fig. 2e, 8f, 8g), WT, S6K1-HA or the indicated mutant Arabidopsis seedlings were grown in sugar-free liquid ½ MS medium (½ MS, 2 mM MES, pH 5.7) for seven days. The endogenous glucose from the seed is depleted three days after germination4. Glucose (25 mM) was added on the eighth day for the indicated time (for Fig. 1d, 1e) or 6 h (for Extended Data Fig. 2e, 8f, 8g) to stimulate TOR signalling. For the experiments with TOR or S6K inhibitors (for Fig. 1f, 1g, Extended Data Fig. 2a–d), WT or S6K1-HA seedlings were grown in liquid ½ MS (with 0.5% sucrose, PH 5.7) medium for four days and treated with DMSO as the control or 10 μM of different chemical inhibitors that target TOR or S6K1 for three days. Unless otherwise indicated, plants were grown at 23/20°C, 12 h/12 h light/dark, 60% RH, and 75 μ mol m−2 s−1 of light.
Generation, purification and application of the pFIE(S14) antibody
The phospho-site-specific anti-pFIE(S14) antibody was custom-made by ABclonal (Woburn, MA, USA). Briefly, a phosphopeptide (NESIVGpSLTPSN-C) was synthesized and conjugated to keyhole limpet hemocyanin carrier for the immunization of four rabbits. The polyclonal antiserum was first affinity-purified using the phosphopeptide, and the elution was then passed over the column coupled with the non-phospho-peptide (NESIVGSLTPSN-C) to remove nonspecific antibodies61. The pFIE(S14) antibody was first tested by dot blot assays against the phospho- and non-phospho-peptides. The anti-pFIE(S14) antibody was further validated by immunoblot analyses against the His-FIE or His-FIE(S14A) proteins without or with TOR phosphorylation after the in vitro kinase assay.
To detect the phosphorylated pFIE(S14) in vivo, pFIE(S14) antibody was used to detect the FLAG-GFP-FIE protein immunoprecipitated from transgenic plants by immunoblot analyses. Specifically, GFP-FIE/fie or tor-es seedlings expressing FLAG-GFP-FIE were grown in liquid ½ MS (with 0.5% sucrose, PH 5.7) medium for eight days (for Fig. 2g). The medium was changed to liquid ½ MS without sugar and the seedlings were starved in dark for two days. Glucose (25 mM) was added to the medium for two hours to stimulate TOR activity. To deplete TOR, tor-es seedlings was induced by 10 μM β-estradiol for four days. For Torin2 treatment, 2 μM Torin2 was added into the medium one day before harvesting the samples. To examine glucose induced FIE phosphorylation (for Fig. 2h, Extended Data Fig. 5d), GFP-FIE/fie seedlings were grown in sugar-free liquid ½ MS medium (½ MS, 2 mM MES, pH 5.7) for seven days. Glucose (25 mM) was added to the medium for two hours on the eighth day to stimulate TOR signalling.
Approximately five g (about 1000) seedlings were collected and ground to fine powder with a mortar and pestle in liquid nitrogen and suspended in 5 ml of extraction buffer (25 mM Tris-HCl pH7.6, 150 mM NaCl, 5 mM EDTA, 10 mM p-nitrophenyl phosphate, 20 mM β-glycerophosphate, 10 mM sodium pyrophosphate, 2 mM Na3VO4, 1 mM NaF, 1% NP-40, 10% glycerol, 1Xprotease inhibitor cocktail tablet, and 1 X Phosphatase Inhibitor Cocktail Tablet PhosSTOP). The tissues were further homogenized by grinding thoroughly and then centrifuged in an SS34 rotor for 25 min at 12,500 rpm and the supernatant was saved. The pellets were resuspended in two ml of lysis buffer (25 mM Tris-HCl, pH 7.6, 75 mM NaCl, 5 mM EDTA, 1% Triton X-100, 0.1% SDS, 10 mM p-nitrophenyl phosphate, 20 mM β-glycerophosphate, 10 mM sodium pyrophosphate, 2 mM Na3VO4, 1 mM NaF, 10% glycerol, 1Xprotease inhibitor cocktail tablet, and 1 X Phosphatase Inhibitor Cocktail Tablet PhosSTOP) and sonicated for 1 min (10s on, 20s off). The supernatant from the two-step extraction was combined and incubated with 100 ml of pre-washed anti-FLAG M2 Agarose Beads (Sigma, A2220) at 4°C for two h with rotation. Beads were washed five times with extraction buffer. Proteins were then eluted from the anti-FLAG M2 Agarose beads with 50 μl of 300 mg/ml of 3xFLAG peptide (Sigma, F 4799) five times at room temperature. The elution was precipitated with an equal volume of 20% TCA/acetone and washed with acetone. The pellet was resuspended in 100 μl of 1X calf intestinal alkaline phosphatase (CIP) buffer. For CIP treatment, 50 μl of FLAG-GFP-FIE protein solution was mixed with or without (mock) 10U CIP (New England Biolabs, M0290) for one h at 37 °C. The reaction was stopped by adding 2X sample buffer and boiled for 5 min at 95°C before running the SDS-PAGE gel. Site-specific phosphorylation was detected by immnoblot analysis with pFIE(S14) antibody at 1:500 dilution in 5% BSA.
RNA extraction and gene expression analysis
Whole seedlings from liquid medium or the aerial parts of plants from the agar plate were harvested and frozen in liquid nitrogen. Total RNA was isolated from seedlings ground in liquid nitrogen and extracted using the protocol with the Trizol reagent (Invitrogen). Total RNA (0.5 ug/20 ul reaction) was treated with DNase I (RQ1 RNase-free DNase I, Promega), and converted to cDNA using M-MLV reverse transcriptase (RNase H minus, Point Mutant, Promega) and oligo(dT) primer according to the manufacturer’s guidelines. Quantitative PCR was carried out as described62 using the primers listed in Supplementary Table 8. The relative gene expression was normalized to the expression of UBQ10 (AT4G05320), UBC21 (At5g25760) or ACTIN2 (At5g09810). At least triplicate biological samples were analysed with consistent results.
To analyse the perturbed global gene expression pattern in the fie-amiR-es and SSTS/AAAA/fie mutants, RNA-seq analyses were carried out as described51. Seedlings of WT, fie-amiR-es, GFP-FIE/fie or STSS/AAAA/fie were grown on ½ MS (with 0.5% Sucrose, pH 5.7) agar medium for two weeks (For Fig. 3a–e, 3g, Extended Data Fig. 7a–c). For the inducible fie-amiR-es mutant, 10 mM estradiol was added into the medium at the beginning of germination to induce FIE depletion. The aerial part of plants was collected for RNA extraction at two weeks. Total RNA (0.5 μg) was used for preparing the library with NEBNext® Ultra II™ RNA Library Prep Kit for Illumina® sequencing according to the manufacturer’s guidelines. For the DNA fragment enrichment step, the template was amplified by PCR for eight cycles with adaptors of different barcodes. The libraries were sequenced using an Illumina HiSeq4000 at GENEWIZ Next Generation Sequencing centre, and 150 bp pair-end reads were generated.
ChIP analysis
ChIP-seq data were processed and analysed as previously described with minor modification63. Briefly, Plants (1 g) were ground into fine powder in liquid nitrogen and suspended with 10 ml nuclei isolation buffer (10 mM HEPES pH 8.0, 1 M sucrose, 5 mM KCl, 5 mM EDTA, 0.6% Triton X-100, 0.4 mM PMSF, and fresh protease inhibitor cocktail). The homogenate was incubated with 1% formaldehyde for 15 min and stopped with 125 mM glycine. The extract was filtered through double layers of wet Miracloth and centrifuged at 1,500 g for 10 min at 4°C. The nuclei pellet was washed 3 times with 10 ml nuclei isolation buffer. The pellet was resuspended in 0.2 ml nuclei lysis buffer (50 mM Tris-HCl pH 8.0, 10 mM EDTA, 1% SDS, and fresh protease inhibitor cocktail) and sonicated for 3X10 min, 30s on 30s off at high setting, and then diluted 10-fold to 2 ml with ChIP dilution buffer (1.1 % Triton X-100, 1.2 mM EDTA, 16.7 mM Tris-HCl pH 8.0, 167 mM NaCl, and fresh protease inhibitor cocktail). Chromatin was immunoprecipitated with an antibody at 4 °C overnight with rotation. Each antibody, against H3 (Abcam, 1791,1:1000), H3K27me3 (Millipore, 07–449,1:200) and H3K9me2 (Abcam 1220, 1:200), was bound to the prewashed protein A or G Dyna-beads (40 ml) for 1 h at 4oC with rotation. The immunoprecipitated chromatin was washed twice with each of the following solutions for 5 min at 4 °C: 1 mL of low salt buffer, high salt buffer, LiCl buffer, and TE buffer. Protein complexes were eluted from beads with 400 μl of elution buffer (1% SDS and 0.1 M NaHCO3) at 65°C for 10 min. The eluted chromatin was reverse crosslinked with 0.2 M NaCl at 65°C overnight, and treated with RNase A (0.2 mg/ml) at 37 °C for 1 h, proteinase K at 50 °C for 1 h, and purified with phenol:chlorophorm followed by ethanol precipitation. The enriched DNA was subjected to quantitative PCR (qPCR) analysis or library construction and Illumina sequencing for ChIP-seq analysis.
ChIP-qPCR was performed using the iQ SYBR green supermix (Bio-Rad) and normalized using H3 level as an internal standard. H3K27me3 enrichment is shown as the percentage of H3. Three biological replicates were performed for each experiment. Primer sequences used for ChIP-qPCR are listed in Supplementary Table 8.
To quantitatively compare genome-wide H3K27me3 levels across plant samples, a method called ChIP with reference exogenous genome (ChIP-Rx) was performed with minor modifications as previously described23. Defined quantities (one-tenth) of the reference chromatin from Human 293T cells were added into Arabidopsis chromatin from one g seedings before immunoprecipitation.
To determinate the concentration of chromatin, 10 μl from 2 ml of Arabidopsis chromatin was reverse crosslinked, digested with RNase A and proteinase K, and followed by DNA purification as described above. The concentration of purified DNA was determined using Qubit dsDNA High-Sensitivity Assays (Invitrogen). The DNA concentration of 10 μl chromatins from 106 human HEK293T cells was also isolated and determined with the same method. One-tenth of human chromatin (about 10 μg DNA) compared with the Arabidopsis chromatin was mixed with each of different Arabidopsis samples (about 100 μg DNA) before immunoprecipitation. Purified DNA (5 ng) after ChIP was used for preparing the library with NEBNext® Ultra II™ DNA Library Prep Kit for Illumina® according to the manufacturer’s guidelines. For the DNA fragments enrichment step, the templates were amplified for eight cycles with adaptors of different barcodes. The libraries were sequenced using an Illumina HiSeq4000 at GENEWIZ Next Generation Sequencing centre and 150 bp pair-end reads were generated.
In vivo co-immunoprecipitation (CO-IP) assay
To capture the dynamic interaction between TOR kinase and substrates in vivo, TOR activity was synchronized and stimulated by starvation and glucose depletion, and formaldehyde crosslinking was applied to stabilize the TOR-substrate interaction. Specifically, transgenic Arabidopsis seedlings expressing FLAG-GFP-FIE or Col-0 seedlings as the control were grown in liquid ½ MS (with 0.5% sucrose, PH 5.7) medium for eight days (for Fig. 2c). Then the liquid medium was changed to ½ MS without sugar and the seedlings were starved in dark for 3 days. Glucose (25 mM) was added into the medium for two h to stimulate TOR activity. To test the effect of glucose concentration on the interaction between TOR and FIE (Extended Data Fig. 4a), transgenic seedlings expressing FLAG-GFP-FIE were grown in sugar-free liquid ½ MS medium (½ MS, 2 mM MES, pH 5.7) for seven days. Different concentration of glucose (0, 0.1, 0.5, 1, 5, 10, 20, 25 mM) was added to the medium for two hours on the eighth day to stimulate TOR signalling. Whole seedlings were crosslinked in 1% formaldehyde for 15 min and collected after removing all the liquid with Kimwipes. Crosslinked plants were ground into powder with liquid nitrogen and suspended in extraction buffer (25 mM Tris-HCl pH7.6, 150 mM NaCl, 5 mM MgCl2, 10% glycerol, 0.1% NP-40, 0.5 mM DTT, and fresh protease inhibitor cocktail). After centrifugation at 18,000 rpm in a microfuge at 4°C for 20 min, the supernatant was incubated with pre-washed anti-FLAG M2 Agarose Beads (Sigma, A2220) at 4°C for two h with rotation. Beads were washed five times with extraction buffer. Protein complexes were eluted twice with 3XFLAG peptide. The eluted and input samples were mixed with 2X sample buffer and boiled for 10 min at 95°C before gel electrophoresis (SDS-PAGE) and immunoblot analysis.
Protein expression and purification
Recombinant proteins were expressed in Escherichia coli Rosetta 2 (DE3) pLysS Cells (Novagen). E. coli cells transfected with expression plasmids were first grown in 80% LB/20% TB medium with ampicillin (100 μg/ml) at 37°C until reaching 0.6 OD600. The cell culture was cooled to 18°C and protein expression was induced with 0.5 mM isopropyl β-d-1- thiogalactopyranoside for 18 h. Cells were collected, resuspended in lysis buffer (50 mM pH 7.4 HEPES, 300 mM NaCl, 20 mM imidazole, and fresh protease inhibitor cocktail), and lysed by sonication. The supernatants were incubated with Ni-NTA agarose (Qiagen) for 2 h at 4°C. The Ni-NTA agarose was washed four times with washing buffer (50 mM pH 7.4 HEPES, 300 mM NaCl, 40 mM imidazole). The recombinant protein was eluted with elution buffer (50 mM pH 7.4 HEPES, 300 mM NaCl, 250 mM imidazole, and fresh protease inhibitor cocktail) for 10 min at room temperature and concentrated by Amicon® Ultra-15 10K filter (Millipore). Proteins were stored at −80 °C after being flash-frozen in liquid nitrogen.
Histone methyltransferase assays with purified PRC2 complexes
Each of the four core components of the Arabidopsis PRC2 complexes, including CLF, EMF2, MSI1, and FIE (WT or SSTS/AAAA mutant) were expressed in insect Sf9 cells using the standard Bac-to-Bac baculovirus expression system (Invitrogen). The Sf9 cells were infected with equal amounts of baculovirus for expressing each subunit at the density of 1.8 × 10⁶ cells/mL. The cells were harvested and frozen with liquid nitrogen after 72 h incubation at 130 rpm at 27°C. Insect cells were resuspended in lysis buffer (20 mM HEPES at pH 7.9, 300 mM KCl, 1.5 mM MgCl2, 1 mM PMSF, 0.5 mM DTT, and 0.1% Triton X-100), and sonication 10 × 20 sec on ice. After centrifugation at 18,000 rpm in a microfuge at 4°C for 20 min, the supernatant was incubated with pre-washed anti-FLAG M2 Agarose Beads (Sigma, A2220) at 4°C for 2 h with rotation. Beads were washed five times with extraction buffer. Protein complexes were eluted twice with 3XFLAG peptide at room temperature. The protein buffer was changed to storage buffer (20 mM HEPES at pH 7.9, 300 mM KCl, 1.5 mM MgCl2, 10% glycerol) and concentrated by Amicon® Ultra-15 10K filter (Millipore). Proteins were stored at −80 °C after being flash-frozen in liquid nitrogen. The Histone lysine methyltransferase assay was performed as previously described64. Briefly, 0.3 μg of recombinant PRC2 complexes (with WT or SSTS/AAAA mutant form of FIE) were incubated with 1 μg of H3 (New England Biolabs, M2503S) in the reaction buffer (20 mM HEPES at pH 7.9, 2 mM MgCl2, 1 mM DTT, and 10 μM SAM) for 2 h at 30°C. The reaction was stopped by addition of 4× loading dye and heated for 5 min at 95°C. The quantitative level of H3K27me3 was detected by immunoblot analyses using specific anti-H3K27me3 antibody as described above.
TOR kinase assay
In vitro TOR kinase assay was performed as previously described4. To immunoprecipitate the endogenous TOR complexes, WT seeds were germinated and grown in liquid medium (½ MS, 0.5% sucrose, pH 5.7, 6 seedlings/1 mL each well in 6-well plates) for 7 days. The same fresh medium (1 ml) was replenished for 2 more h to maximize TOR activity. TOR complexes purified from 6 seedlings could be used for 10 kinase reactions. For in vitro kinase assay (for Fig. 2d, 2f, Extended Data Fig. 4h), 1 μg of His-FIE or the mutant proteins were incubated with the immunoprecipitated TOR kinase on the beads in the kinase buffer (25 mM HEPES, pH 7.4, 50 mM KCl, 10 mM MgCl2, 1 mM DTT, 10 μM cold ATP, 2 μCi [γ-32P]-ATP) at 30°C for 30 min with shaking at 1000 rpm. For TOR inhibitor treatment, the immunoprecipitated TOR kinase on the beads was pre-incubated with 1 μM Torin2 for 10 min at room temperature before the kinase assay. The reaction was stopped by adding 2XSDS-PAGE loading buffer. After gel electrophoresis (SDS-PAGE) and subsequent gel drying, protein phosphorylation was visualized by autoradiography using the Typhoon imaging system (GE Healthcare, Chicago, IL, USA).
Tandem mass spectrometry analysis
To identify the TOR phosphorylation sites in FIE, five micrograms of His-FIE recombinant proteins were subjected to in vitro TOR kinase assay in the kinase buffer for 2 h at 30°C. The phosphorylated His-FIE was separated by 10% SDS-PAGE gel. The gel was stained with Thermo GelCode Blue Safe Protein Stain and destained with ddH2O. The His-FIE band was excised and subjected to in-gel digestion with trypsin. The phospho-peptides were enriched using the TiO2/ZrO2 media from Glygen65 and subjected to LC-MS/MS analysis using the Orbitrap Fusion Tribrid mass spectrometer (Thermo Scientific, San Jose, CA, USA)66. The raw data of LC-MS/MS spectra was analysed by the Mascot search engine (version 2.2, Matrix Science, London, UK). The parameters were: Arabidopsis TAIR 10 database (32,785 entries, https://www.arabidopsis.org/), precursor mass tolerance at 10 ppm, fragment mass tolerance at 0.8 Da, trypsin with one missed cleavage, oxidation (M) and phosphorylation (S, T, Y) as dynamic modifications. The identified phosphorylated peptides and each phosphorylation site assignment were confirmed by manual inspection of the precursor mass and fragmentation ions. To validate the FIE phosphorylation sites from in vivo immunoprecipitation using FLAG antibody, the FLAG-GFP-FIE protein was immunoprecipitated from 100 g transgenic seedlings at 8 days as described above (for Fig. 2e, Extended Data Fig. 4b). The FLAG-GFP-FIE protein was separated and excised from SDS-PAGE gel and subjected to in-gel digestion with trypsin. The phosphopeptides were enriched and analysed using the same LC-MS/MS method, except that targeted precursor ions and charge states (+2 and +3) were put in the inclusion list for targeted MS/MS acquisition. The accurate precursor mass and corresponding MS/MS spectra were validated using the synthetic phosphopeptide.
Protoplast assays for microscopy detection, PUP-IT and amiRNA screening
Mesophyll protoplasts were isolated from four-week-old WT leaves and transfected essentially as described67. For the PUP-IT proximity-tagging system (for Fig. 2a, b), protoplasts (2× 10⁵) in 1 ml MMg (0.4 M mannitol, 15 mM MgCl2, 4 mM MES, pH5.7) were co-transfected with 100 μg of pUBQ10-TOR-C-PafA-HA-p2X35S- 3XFLAG-pup (E) and 100 μg of HBT-PRC2-MYC expressing different PRC2 components. Transfected protoplasts were incubated in 5 ml WI (0.5 M mannitol, 20 mM KCl, 4 mM MES, pH5.7) in a 10 cm plate at room temperature for 12 h. The protoplast pellet was lysed in 1 ml extraction buffer (25 mM Tris-HCl pH7.6, 150 mM NaCl, 5 mM MgCl2, 10% glycerol, 0.1% NP-40, 0.5 mM DTT, and fresh protease inhibitor cocktail) with 0.1% SDS and subjected to immunoprecipitation using anti-FLAG M2 Agarose Beads (Sigma, A2220) as described above. The input and immunoprecipitated proteins were mixed with 2X sample buffer and boiled for 10 min at 95°C before gel electrophoresis and immunoblot analysis. For the confocal imaging of FIE and mutant proteins in mesophyll protoplasts (for Extended Data Fig. 5f), 200 μl protoplasts (4× 10⁴) were co-transfected with 38 μg of plasmid DNA to expression GFP-FIE or various mutants and 2 μg of pHBT-HY5–mCherry to express HY5-mCherry as a control for protoplast co-transfection and nuclear localization. Transfected cells were incubated in 1 ml WI in a 6-well plate at room temperature for 10 h before imaging with a Leica TCS SP8 laser scanning confocal microscopy (Leica). For optimal amiRNA screening (for Extended Data Fig. 7a), 200 μl protoplasts (4× 10⁴) were co-transfected with 35 μg of plasmid DNA expressing each candidate amiRNA (the empty amiRNA expression plasmid served as a control), 4 μg of pHSP-FIE-FLAG plasmid, and 1 μg pHBT-GFP-HA plasmid (as a transfection internal control). Transfected cells were incubated in WI in a 6-well plate at room temperature for 3 h before the heat shock pulse at 37°C for 1 h. Protoplasts were harvested for immunoblot analysis after three more hours of incubation at room temperature.
Vernalization treatment
For all the vernalization experiments (for Fig 4, Extended Data Fig. 9), plants were in or crossed into the FRISF2(Col-FRI or Ler-FRI) background42. Plants were grown on solid ½ MS (pH 5.7) medium (30 ml medium/35 seedlings/100 mm plates) or in liquid ½ MS (with 0.5% sucrose, pH 5.7) medium (1 ml medium/6 seedlings/each well in 6-well-plates, or 10 ml medium/50 seedlings/100 mm plates) for chemical treatments under a 12 h light/12 h dark photoperiod condition at 23°C/20°C. For chemical treatments and GFP imaging (Fig. 4b–e, Extended Data Fig. 9a–d), liquid medium was used for more effective chemical penetration and handling intact roots for confocal imaging. For the other experiments, solid medium was used (Fig. 4a, 4h–j, Extended Data Fig. 9e). For glucose measurement, the results were more consistent using the solid medium for fresh weight measurement and tissue grinding. It was much easier to select the SSTS/AAAA/fie mutant when grown on a solid medium (Fig. 4i, j, Extended Data Fig. 9e). Notably, the results for gene expression and H3K27me3 dynamic during vernalization were similar when using liquid (Fig. 4b, e Extended Data Fig. 9b) or solid medium (Fig. 4i, j, Extended Data Fig. 9e). Plant samples harvested at 8 days before vernalization were referred as NV. Seedlings were vernalized from the 8th day under an 8h light/16h dark short-day condition at 4°C with 60% RH and 40 μ mol m−2 s−1 of light for 40 days (V), and then transferred back to the normal temperature condition (T) for seven more days for sample collection. For the tor-es mutant with the Col-FRI background, 10 μM estradiol was added into the medium three days before vernalization. For Torin2 and INK128 treatment, 1 μM inhibitor was added in the medium one day before vernalization. Plant samples were harvested every ten days during cold treatment, and medium with estradiol or inhibitors were also refreshed every ten days. Collected samples were subjected to RNA expression quantification by RT-qPCR analysis and H3K27me3 quantification by ChIP-qPCR analysis. For glucose measurement during vernalization, plant materials were washed twice with cold water and frozen after removing all the liquid with Kimwipes. The glucose level was measured using the Glucose Assay Kit (Colorimetric) according to the manufacturer’s guidelines. For GUS histochemical staining, pFLC:FLC-GUS (Ler-FRI) seedlings before and after 40 days of vernalization were collected and stained essentially as described68. Flowering time was measured by counting rosette leaves at the time of bolting.
Protein blot analysis
Plants were harvested, frozen, and ground into fine powder with a blue pestle in liquid nitrogen in a microfuge tube. For total protein extract, an equal volume of 2X SDS-PAGE protein loading buffer was added to each sample and boiled for 10 min. To detect histone proteins, nuclear extract enriched with histone was prepared as described69 and denatured by boiling in protein loading buffer. After centrifugation, the supernatant of each protein sample was separated by SDS-PAGE and transferred to the PVDF membrane for immunoblot analysis. Protein blots were probed using antibodies against TOR (1:1000)21, pFIE(S14) (1:500), pS6K1(T449) (1:500)21, RPS670 (1:5000), pRPS6(S237) (1:3000), pRPS6(S240)71 (1:3000), H3 (Abcam, ab1791, 1:5000), H3K4me3 (Abcam, ab8580, 1:1000), H3K9me2 (Abcam 1220, 1:1000), H3K27me3 (Millipore, 07–449, 1:1000), H3K36me3 (Abcam, ab9050, 1:1000), Tubulin (Sigma, T6199, 1:5000), GFP (CLONTECH, 632381, 1:5000), HA-HRP (Sigma,12013819001,1:5000), FLAG-HRP (Sigma, A8592, 1:5000), and MYC-HRP (Roche,1–814-150, 1:1000), Anti-Mouse IgG-HRP (Sigma, A4416, 1:5000), Anti-Rabbit IgG-HRP (Sigma, A0545, 1:5000). The signal intensity of each blot was quantified by ImageJ.
Confocal Microscopy
Transgenic plants expressing various GFP fusion proteins were grown in liquid ½ MS medium with 0.5% sucrose, pH 5.7 (for Fig 2i, 2j, Extended Data Fig. 6c, 6d). Transgenic plants expressing GFP-FIE or GFP-FIE(SSTS/AAAA) were grown without treatment for 4 days for image acquisition of leaf primordia and root elongation and root meristem zones. For TOR inhibitor treatment, plants were grown for 4 days and treated with 10 μM Torin2 or AZD8055 for 24 h before imaging. For plants in the tor-es mutant background, 10 μM estradiol was added to the medium at the second day and incubated for three days before the image acquisition. For quantitative imaging of the dynamic GFP-FIE C/N ratio under sugar starvation, plants were geminated and grown in liquid ½ MS medium without sugar. Pictures were taken every day from day 2 to 6 (Extended Data Fig. 6f, 6g). For sugar starvation and glucose stimulation experiments (Extended Data Fig. 6h, 6i, 6j, Supplementary Movie), plants were grown in liquid ½ MS medium without sugar for 5 days before glucose (25 mM) stimulation for 6 h before imaging. Plants for imaging were transferred into 35 mm glass bottom dish with 20 mm micro-well filled with 300 μl liquid ½ MS medium with 25 mM glucose and immediately used for time-lapse live imaging with 10 min intervals for 6 h. For imaging GFP-FIE and GFP-tagged FIE variants in protoplasts, transfected cells as previously described67 were incubated at room temperature for 10 h before imaging.
Confocal images were acquired using the Leica Application Suite X software on a Leica TCS SP8 (Leica) confocal microscope with the 20X objective lens for roots and protoplasts or the 40X water lens for leaf primordia. The scanning resolution was set to 1,024 Å X 1,024 or 2,048 Å X 2,048 pixels. To obtain fluorescence images of roots and protoplasts, the excitation was set at 488 nm (GFP) or 587 nm (mCherry) and emission at 494–541 nm (GFP) or 595–625 nm (mCherry). To obtain fluorescence images of leaf primordia, GFP and autofluorescence were visualized by excitation at 488 nm using the argon laser and emission at 510–520 nm (GFP) or 660–680 nm (autofluorescence). The autofluorescence signal was removed by applying the Channel and Spectral Dye Separation tool (Leica). For time-lapse live imaging, images were captured every 10 mins for 6 h and replayed as a Movie. The images were collected and processed using Adobe Photoshop software. Quantification of subcellular localization of GFP-FIE were performed using LAS X (Leica Application Suite v. X3.1.1.15751, Wetzlar, Germany). The GFP fluorescence intensity from the whole-cell and nuclear areas was measured. The fluorescence of the nuclear area was considered as GFP-FIE in the nucleus (N), and the fluorescence in the cytosol (C) was determined by subtracting the nucleus from the entire cell. The relative GFP fluorescent intensity between the cytosol (C) and nucleus (N) was analysed and presented as the quantitative C/N ratio from more than 15 cells in three biological replicates.
Processing and analysis of the ChIP-seq data
ChIP-seq data were processed and analysed as previously described72. Briefly, the quality of each sequencing library was assessed by examining fastq files with FastQC (version 0.11.5). Then, sequencing adaptors were removed using Trimmomatic (version 0.36)73. The Sickle program was used to eliminate bases with low quality scores (< 20) and short reads (length < 20). The remaining clean reads were aligned to the reference sequence. The ChIP-seq reads were mapped to Arabidopsis (TAIR10) and human (hg19) combined genomes, using BWA-MEM (version 0.7.15-r1142-dirty). Moreover, the view function of samtools (version 1.6) was used to remove reads with quality (Q) < 20 [Q = −10log10 (p), where p is an estimate of the probability that the alignment does not correspond to the read’s true point of origin]. The rmdup function of samtools (version 1.6) was used to remove duplicated reads mapped to exactly the same position because they were considered to be artifacts caused by PCR during the library construction step. The number of reads mapped to human genome was used to calculate reference derived normalization factor as previously described23. MACS274 utility callpeak was used to identify read-enriched regions (peaks) and utility pileup was used to generate bedgraph files with default settings. The number of reads in the bedgraphs was then scaled by the reference derived normalization factor to generate reference-adjusted reads per million (RRPM). The bedGraphToBigWig (version 4) of UCSC was used to transfer bedgraph files to bigwig files, and then the bigwig files were loaded onto JBrowse75 (version 1.12.1) for data visualization. Target genes were defined as genes with a peak within or near the gene body (±2 kb). For profiling the modification surrounding peak summits, regions from 2kb upstream and 2 kb downstream of peak summits were divided into 40 tiles in total (20 upstream tiles and 20 downstream tiles), the RRPM value in each title of each peak was used to plot heatmap and the average RRPM value in each tile was used to make a line plot.
Processing and analysis of the RNA-sequencing data
The RNA-seq reads were mapped to the Arabidopsis (TAIR10) genome with HISAT276 program (version 2.1.0). The featureCount program of Subread77 package (version 1.5.3) was used to quantify the RNA-seq expression levels of the TAIR10 annotated gene models. DESeq278 was used to determine the significance of the differential expression between samples with the combined criteria: |log2 fold change| ≥ 1 and FDR ≤ 0.05. We added a pseudocount of 0.01 to DESeq2 normalized expression values to recalculate log2 fold change, which helped us avoid infinite values resulting from zero counts and seek some DEGs with relative low counts.
Gene Ontology term enrichment analysis
The GO term enrichment analysis was performed using The TAIR GO term enrichment tool BiNGO (http://www.psb.ugent.be/cbd/papers/BiNGO/Home.html)79. Briefly, we first compiled the genes that are targeted by H3K27me3 and upregulated in STSS/AAAA/fie (Supplementary Table 5). Next, Fisher’s exact test (FDR <0.05) was used by the website to identify GO terms that are significantly over-represented with the compiled gene list. Genes from “not assigned” group were manually checked to identify the ones related to “regulation of transcription, DNA-templated (GO:0006355)”. The categories in biological process with fold enrichment > 2 and FDR< 10−10 were selected and presented in Extended Data Fig. 8b and Supplementary Table 6.
Chemical inhibitors for TOR kinase and S6K
The ATP-competitive chemical inhibitors for both mTORC1 and mTORC2, Torin2, AZD8055, INK128, WYE132 and WYE345, were tested empirically for efficacy in intact Arabidopsis seedlings and used in this study2,15,80–85. The second-generation ATP-competitive TOR kinase inhibitors, Torin2 and INK128, have been examined by kinome-wide selectivity profiles to ensure the specificity for TOR kinase inhibition80–82, and INK128 was shown to be effective in mammalian culture cells and in mice82. Torin2 was used for the initial chemical screens in seedlings up to 8-d treatment at different concentrations because Torin2 shows slower dissociation from TOR kinase and is more effective in sustained blocking of mTOR1 and mTORC2-mediated pAKT(S473) than AZD8055 in human cells84 and in Arabidopsis seedlings15. Chemical inhibitors for S6K, staurosporin and PF-4708671, were previously described4,86.
Statistics
For most of the quantitative data shown in this paper represent mean ± s.d. from at least three biological replicates. Statistical analyses were performed with GraphPad Prism 9 software. Unless otherwise specified, statistical significance was determined with the unpaired two-tailed Student’s t-test when comparing two groups and one-way or two-way ANOVA when comparing more than two groups with Tukey’s multiple comparisons test. The exact P values are indicated in the figures.
Extended Data
Extended Data Fig. 1 |. TOR controls the global H3K27me3 level and development.
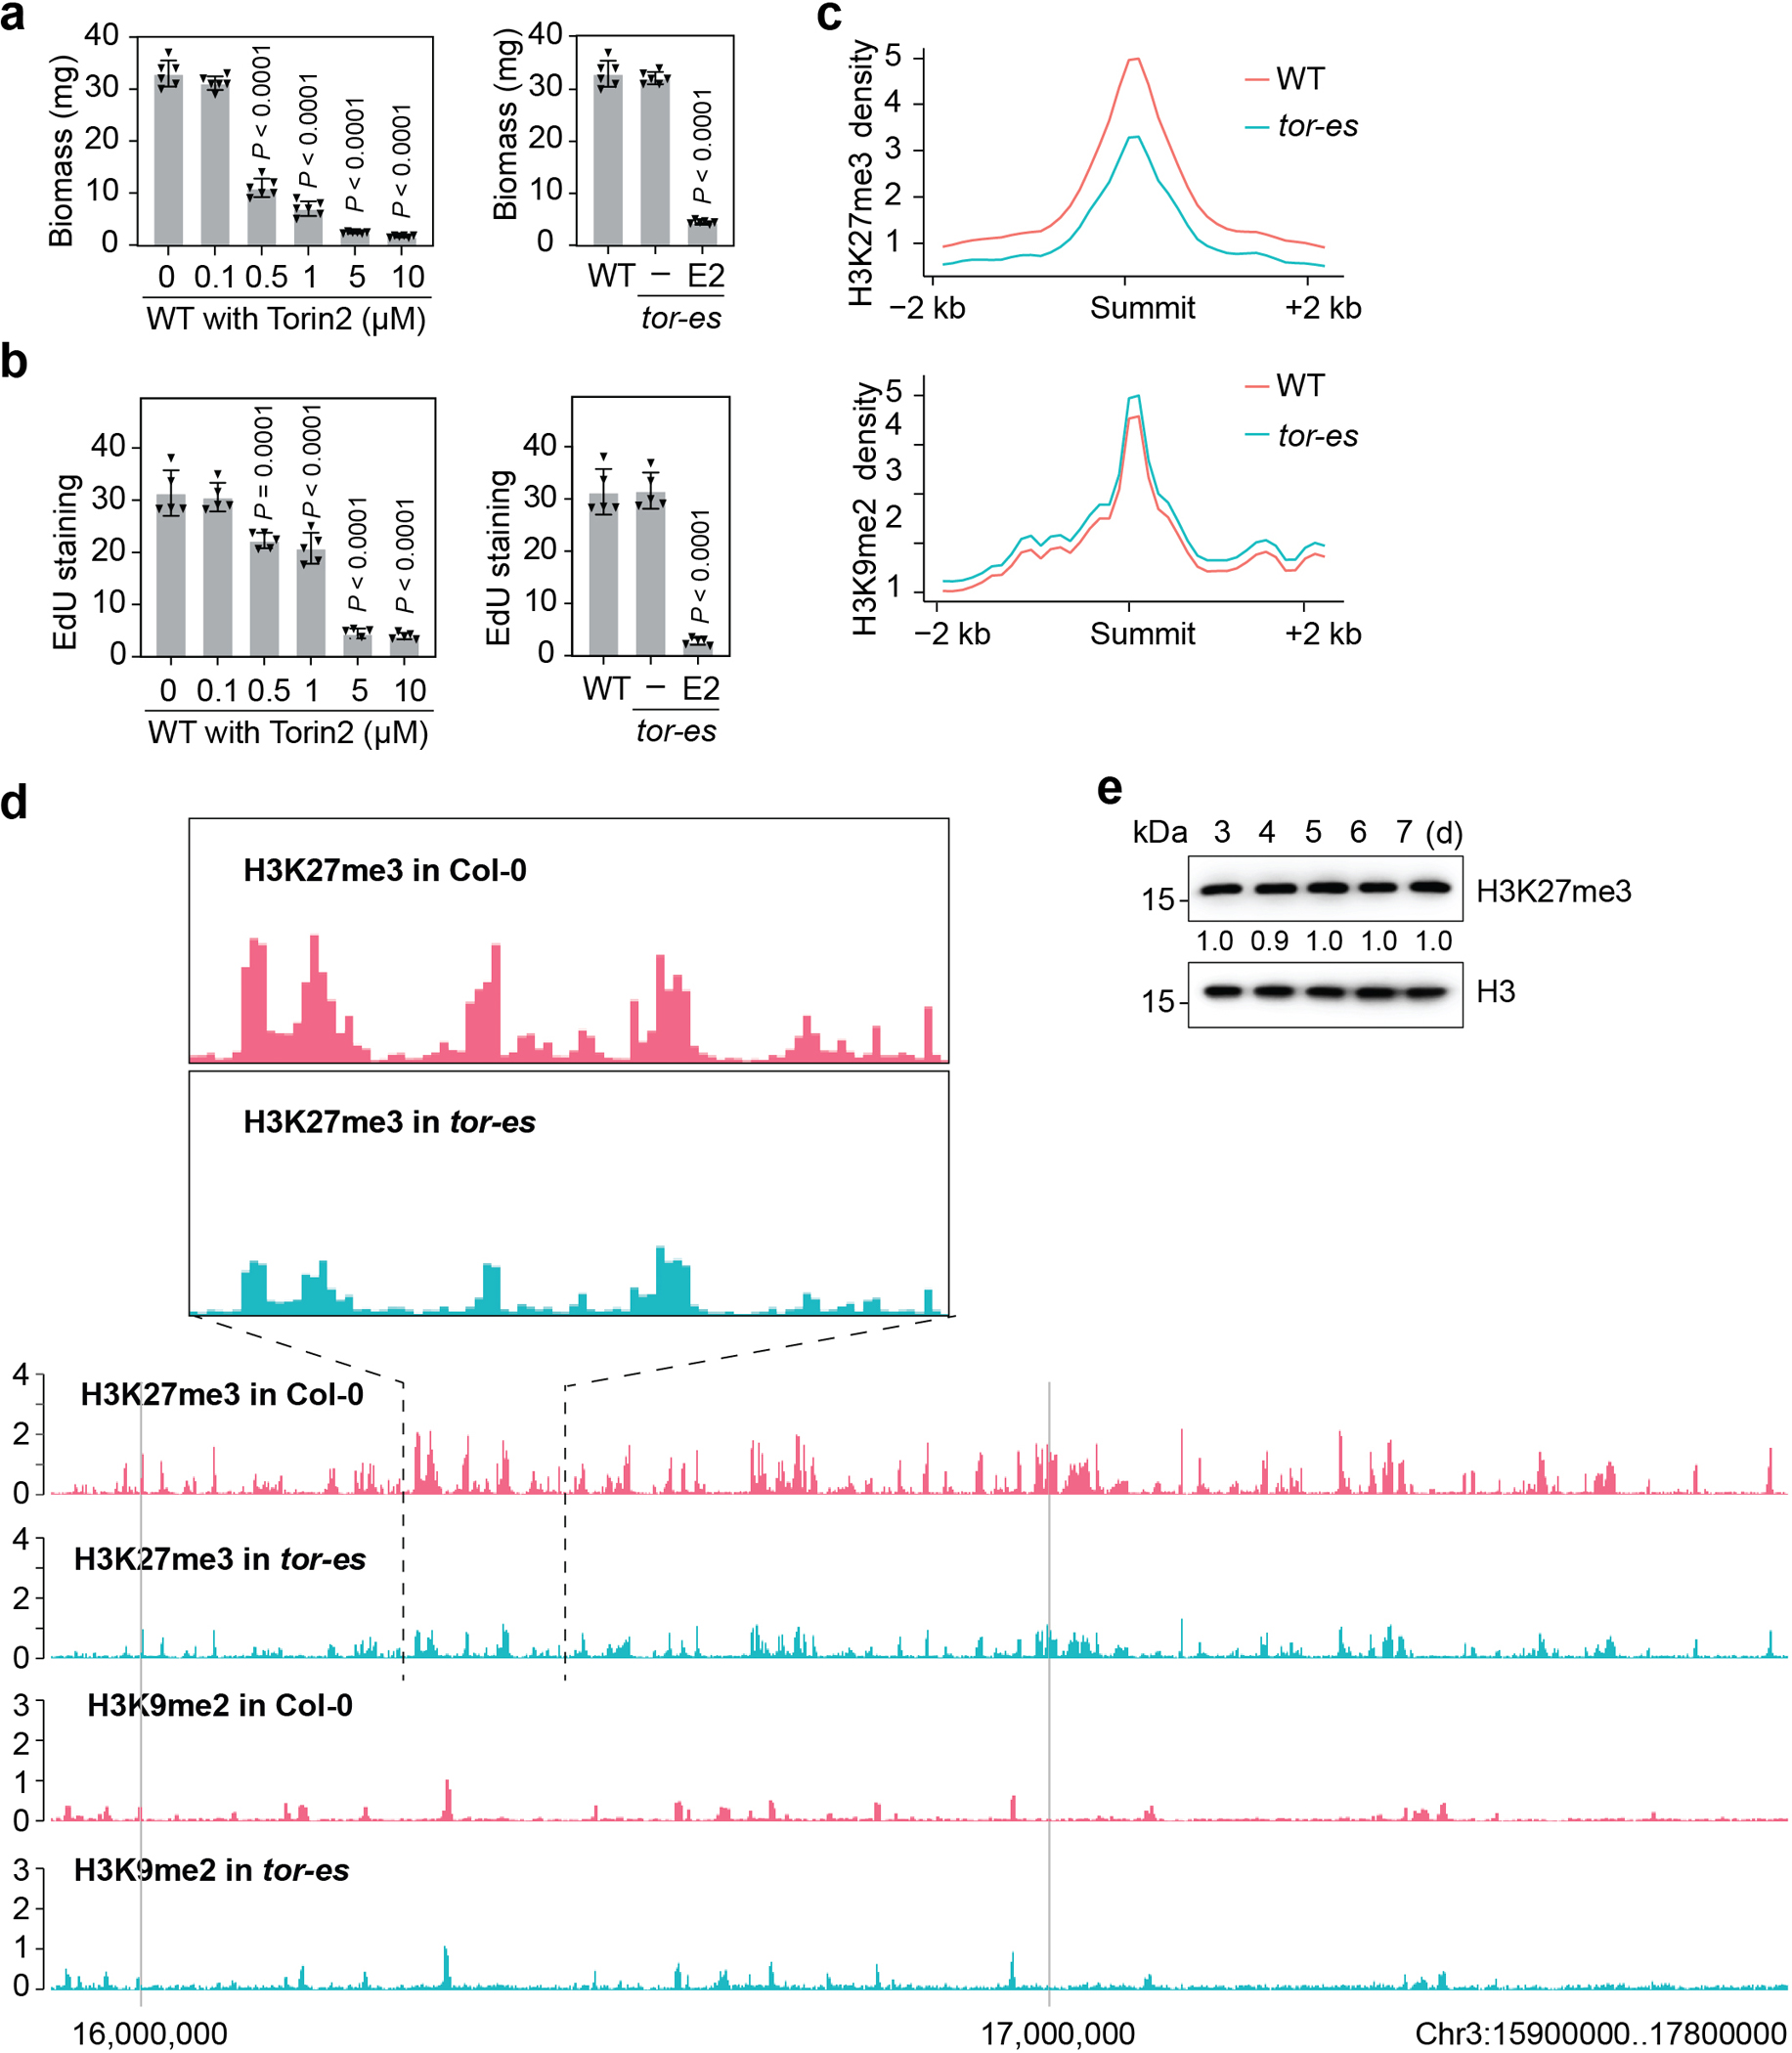
a, TOR differentially regulates seedling biomass. WT seedlings treated with different concentrations of Torin2 or tor-es seedlings at 8 days after germination. (n = 6 seedlings). b, Distinct TOR activity thresholds regulate DNA replication. Quantification of EdU staining in roots (n = 5 seedlings). c, Metaplots showing ChIP-Rx-seq read density. H3K27me3 and H3K9me2 in 7-day WT and tor-es. The ChIP-seq data are normalized with an exogenous reference genome. The peak summits ±2 kb is shown. d, Genome browser view of H3K27me3 and H3K9me2 ChIP-seq read densities in WT and tor-es. The Arabidopsis genome region within Chr3:15900000..17800000 is shown. An enlarged view of a selected region is shown on the top. e, The H3K27me3 level in plants grown in sugar-containing medium. d, day. Values are the relative level of H3K27me3 compared with the corresponding H3 control, with immunoblot signals in day3 set as 1.0. Experiments were conducted in three biological repeats with similar results. Data in a, b show mean ± s.d., one-way ANOVA with Tukey’s multiple comparisons test.
Extended Data Fig. 2 |. TOR controls the global H3K27me3 level.
a-d, TOR regulates global H3K27me3 levels. a, TOR but not S6K regulates global H3K27me3 levels. WT or S6K1-HA transgenic seedlings were treated with 10 μM of different inhibitors for 3 days. At 7 days, TOR activity was monitored by pS6K1(T449) and the band shift of pS6K1-HA. S6K activity was monitored by pRPS6(S237) and pRPS6(S240). The intensity of each immunoblot was quantified by ImageJ. Values are the relative level of H3K27me3 compared with the corresponding H3 control, with immunoblots in mock set as 1.0. b, Heatmap of H3K27me3 enrichment in plants with or without TOR inhibitor treatment. The colour scale indicates reference-adjusted RPM (RRPM) surrounding peak summit from the ChIP-Rx-seq data. c, Metaplots showing H3K27me3 ChIP-Rx-seq read density in plants with or without TOR inhibitor treatment. The ChIP-seq data are normalized with an exogenous reference genome. The peak summits ±2 kb is shown. d, Genome browser view of H3K27me3 ChIP-seq read densities. The Arabidopsis genome region within Chr3:15800000..18000000 is shown. e, Differential regulation of S6K and H3K27me3 in rap1 and lst8–1 mutants. The restoration of H3K27me3 was induced by 25 mM glucose for 6 h in 7-d sugar-starved seedlings. TOR-S6K activity was monitored by pRPS6(S237) and pRPS6(S240). The intensity of each immunoblot was quantified by ImageJ. Values for H3K27me3 are the relative level of H3K27me3 compared with the corresponding H3 control, with immunoblots in WT before glucose stimulation set as 1.0. Values for RPS6 phosphorylation are the relative level of pRPS6(S237) and pRPS6(S240) compared with the corresponding RPS6 control, with immunoblots in WT after glucose stimulation set as 1.0. Data in a and e are representatives of three biological replicates each.
Extended Data Fig. 3 |. The transcript and protein levels of PRC2 components are not regulated by TOR.
a, Evolutionarily conserved core PRC2 subunits in Arabidopsis, Drosophila and mammals. PRC2 components regulating plant postembryonic development are shown. b, RT-qPCR analysis of genes encoding PRC2 components in 7-day WT and tor-es. ACT2 transcripts served as an internal control for normalization. Data show mean ± s.d. from 4 biological replicates. Data were analysed by unpaired two-sided Student’s t test. c, GFP-tagged PRC2 components are not regulated by TOR. Torin2 (10 μM) was added for 24 h in 7-d seedlings. Tubulin was used for the loading control for the immunoblot analyses. Experiments were conducted in three biological repeats with similar results.
Extended Data Fig. 4 |. TOR directly interacts with and phosphorylates FIE.
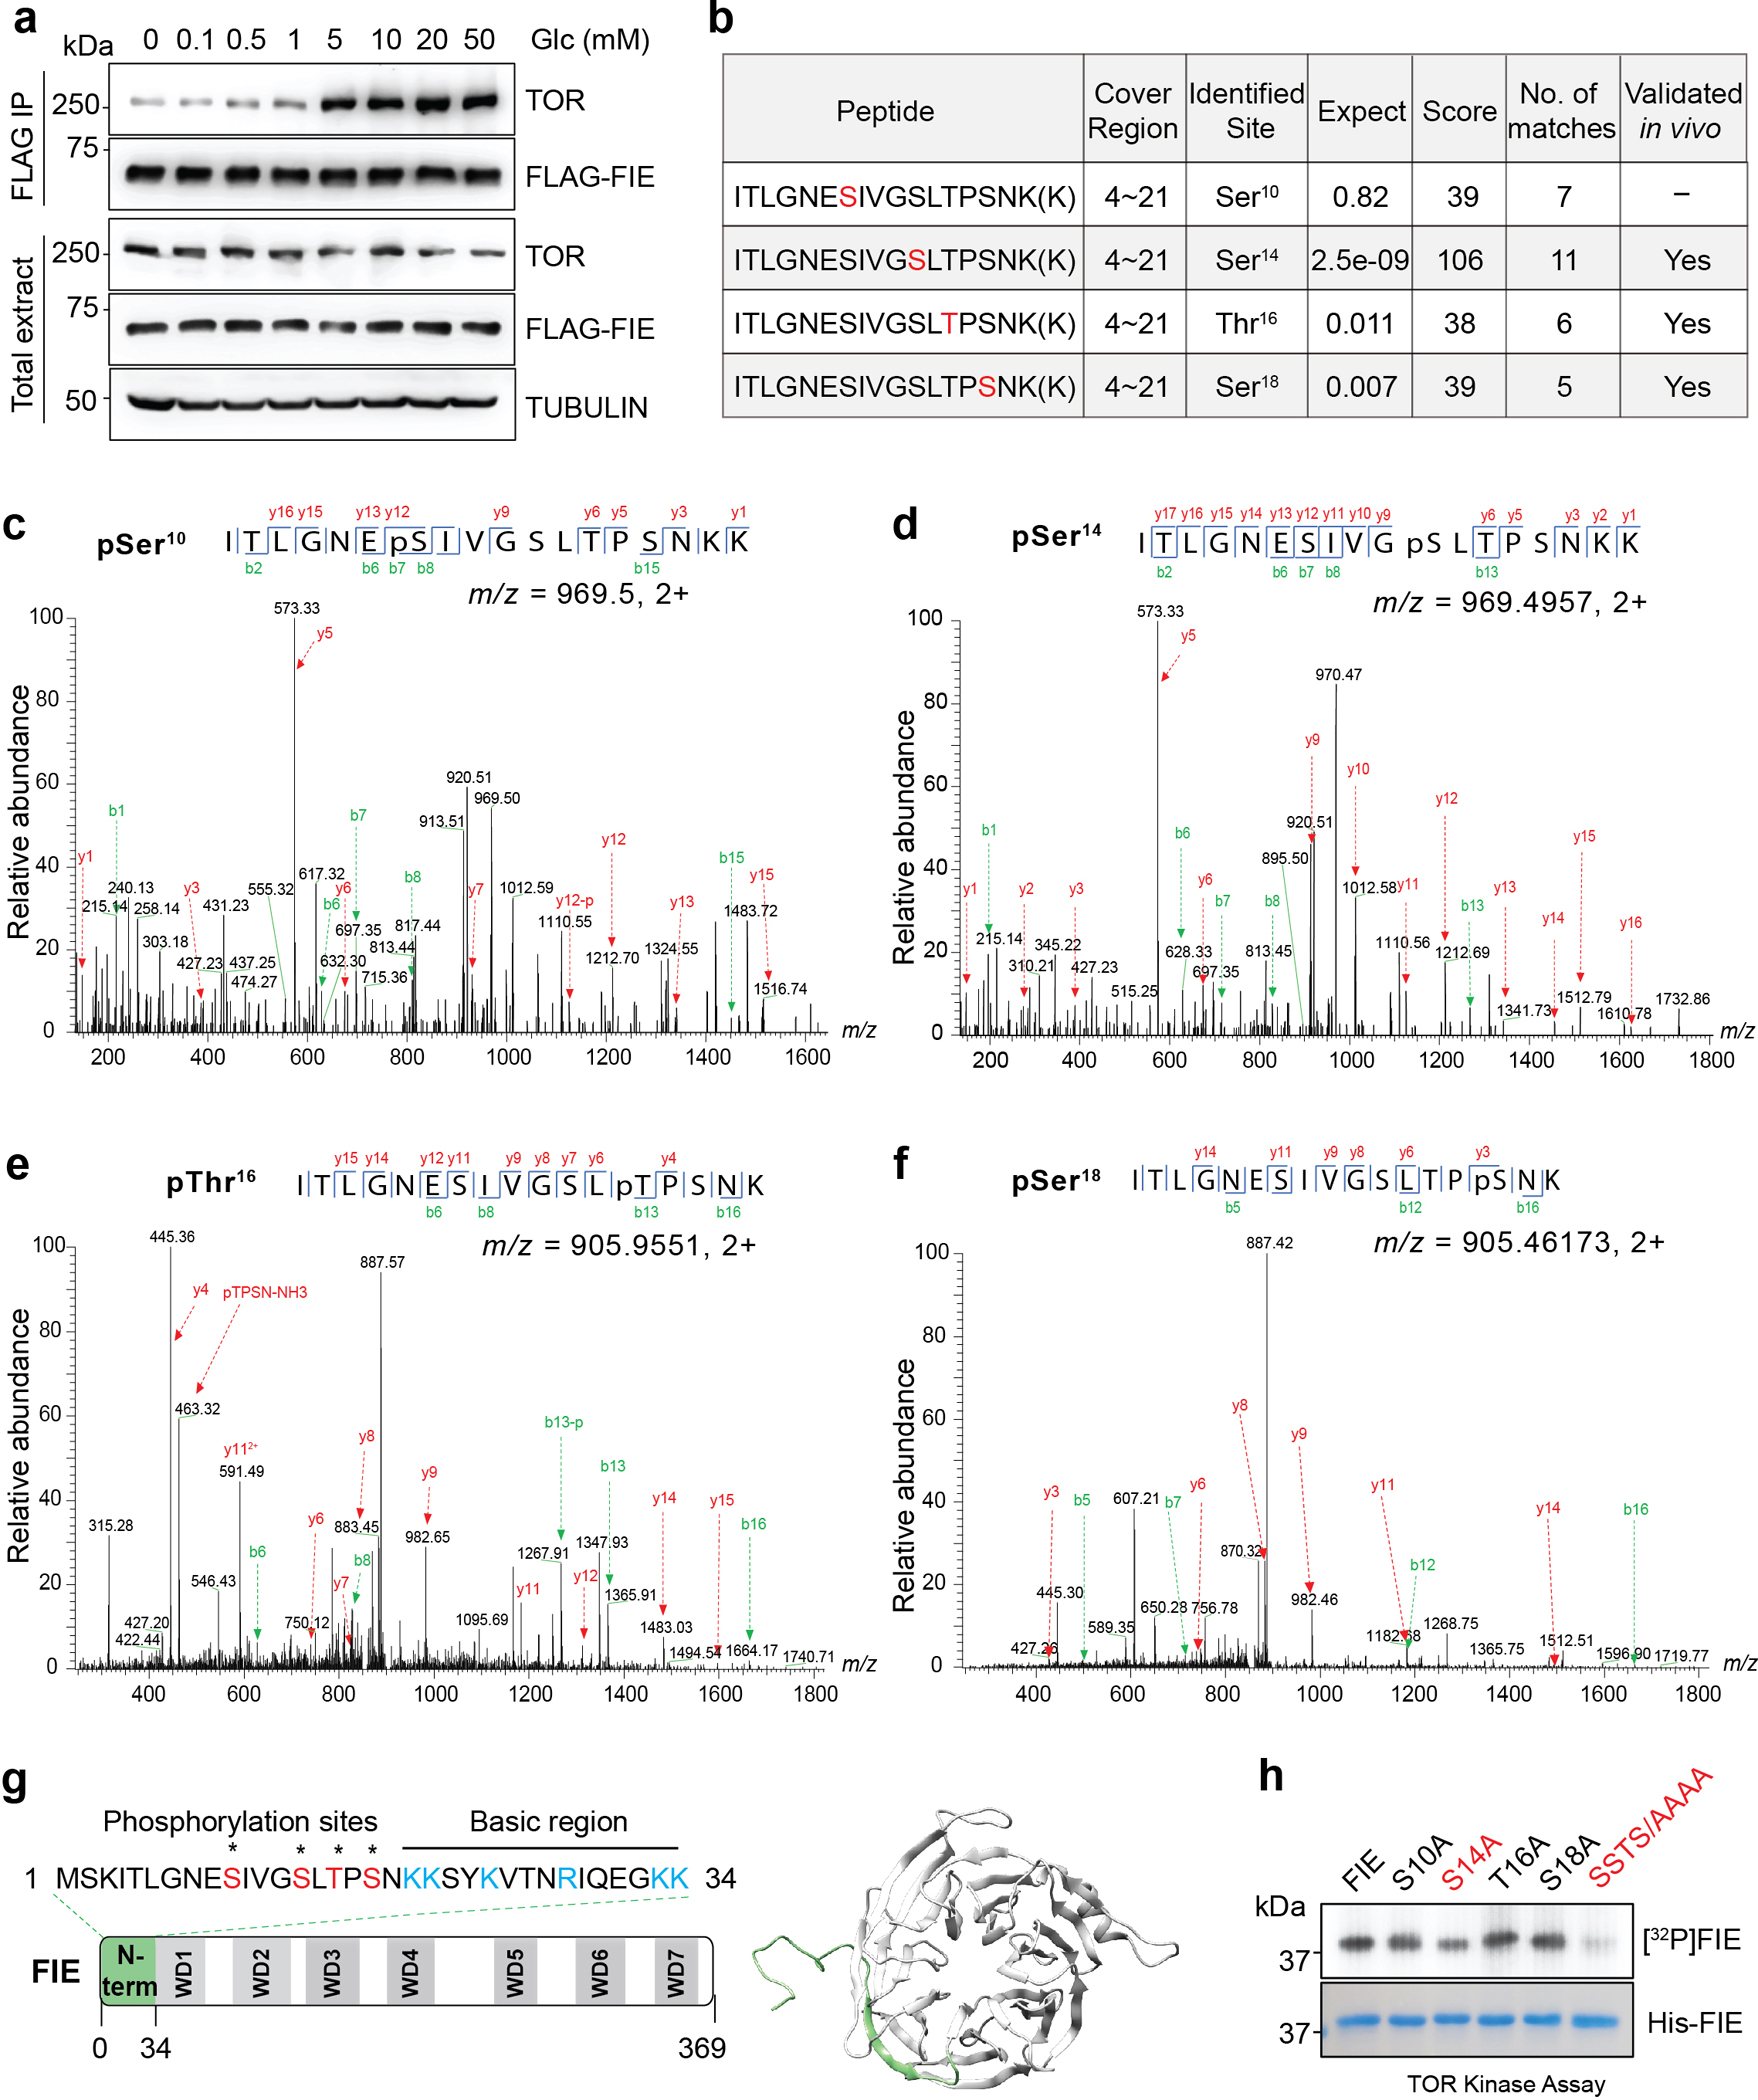
a, Glucose enhances the interaction between TOR and FIE in vivo. Coimmunoprecipitation (Co-IP) of FLAG-tagged FIE with TOR from starved (7 d) and glucose stimulated (2 h) plants. Glc, Glucose. b, Summary of the TOR phosphorylation sites of FIE identified by LC-MS/MS analysis. The corresponding phosphopeptides and its covered regions are listed. Expected, the expect value indicates the probability that the peptide is matched by chance. Smaller value indicates more significance of the peptide identification. Score, the score value represents a calculation of how well the observed spectrum fits to the identified peptide. Higher value indicates higher confidence of the peptide identification. No. of matches, the total number of matched peptides with the same modifications and sites from three biological repeats. Validated in vivo, the modified peptides were identified from in vivo FLAG-FIE immunoprecipitation. c, Mass spectrometric analysis of pS10 peptide from in vitro TOR kinase assay. d, Mass spectrometric analysis of pS14 peptide from in vitro TOR kinase assay. e, Mass spectrometric analysis of pT16 peptide from in vitro TOR kinase assay. f, Mass spectrometric analysis of pS18 peptide from in vivo FLAG-FIE immunoprecipitation. g, The predicted FIE structure. The N-terminal 34 aa sequence is shown with phosphorylation sites (red) identified by mass spectrometry and the basic residues (blue). The predicted 3D structure of FIE by modelling is shown with the flexible N-terminal domain highlighted in green (right). h, TOR phosphorylation of FIE variants by in vitro kinase assays. Single or quadruple mutants of FIE protein was used as the substrate. Phosphorylation of His-FIE by TOR is shown with autoradiography (top). Protein loading control is shown by Coomassie blue staining (bottom). Experiments were conducted in three biological repeats with similar results.
Extended Data Fig. 5 |. Conservation of the key TOR phosphorylation sites in plant FIE and animal orthologs.
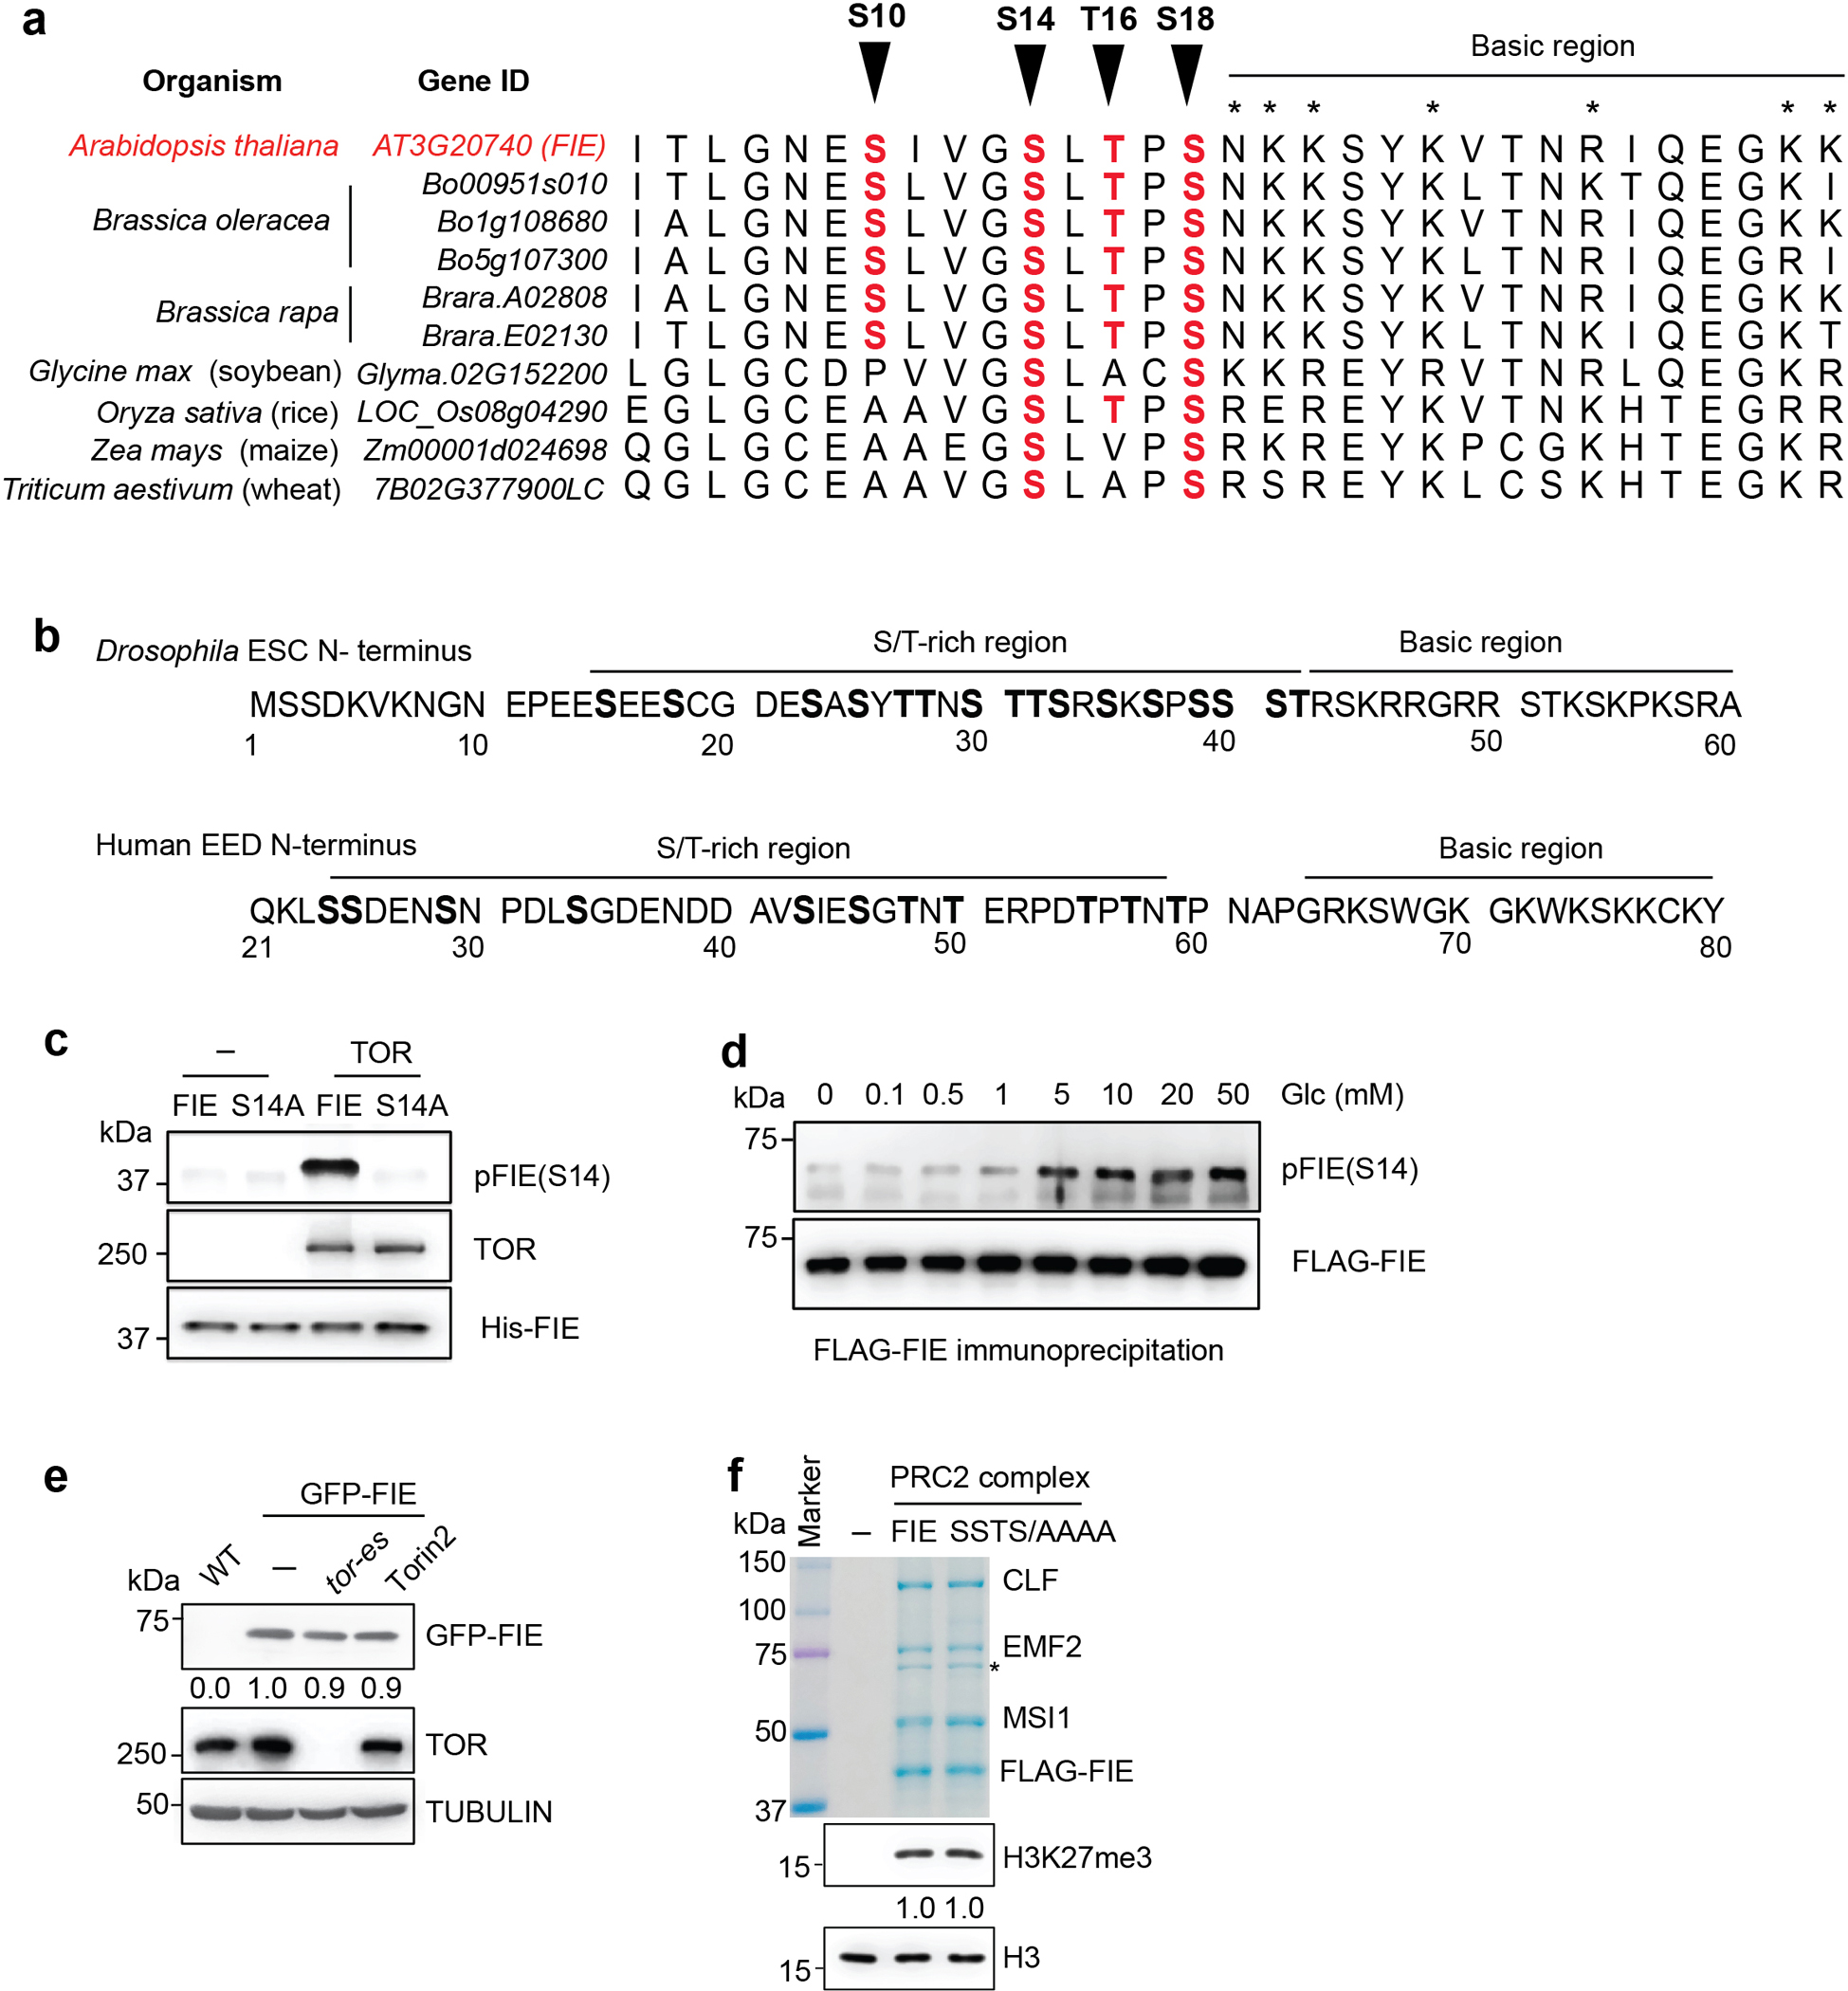
a, Phosphosite conservation was analysed by multiple sequence alignment of FIE proteins from reference organisms using PLAZA 4.0 Dicots (https://bioinformatics.psb.ugent.be/plaza/versions/plaza_v4_dicots/). The selection of reference organisms includes Arabidopsis, Brassica, soybean, rice, maize and wheat. The four arrow heads indicate the potential phosphorylation residues. b, N-terminal sequences of Drosophila ESC (residues 1–60) and human EED (residues 21–80) are shown. Highly conserved positions of S/T-rich and basic regions are indicated. c, Immunoblot validation of pFIE(S14) specific antibody using the in vitro TOR-FIE kinase assay. d, Glucose enhances pFIE(S14) levels. Immunoblot analysis of pFIE(S14) after IP with anti-FLAG in starved (7 d) transgenic FLAG-GFP-FIE seedlings and stimulated by different concentrations of glucose for 2 h. e, GFP-FIE protein levels are not regulated in tor-es or Torin2 treated 7-d seedlings. A specific TOR antibody was used to detect endogenous TOR by immunoblot analysis. Tubulin served as the loading control. Values are the relative level of GFP-FIE over Tubulin, with blots in mock treatment set as 1.0. f, In vitro histone methyltransferase assays using H3 substrate and recombinant Arabidopsis PRC2 complexes from insect Sf9 cells. The complexes stained by Coomassie blue were purified with FLAG-tagged WT or the mutant form (SSTS/AAAA) of FIE. The * indicates a nonspecific protein from insect cells. The H3K27me3 was detected by immunoblot and quantified by comparing to the corresponding H3 control.
Extended Data Fig. 6 |. Glucose-TOR specifically promotes the cytoplasm-to-nucleus translocation of FIE to enhance the PRC2 activity in the nucleus.
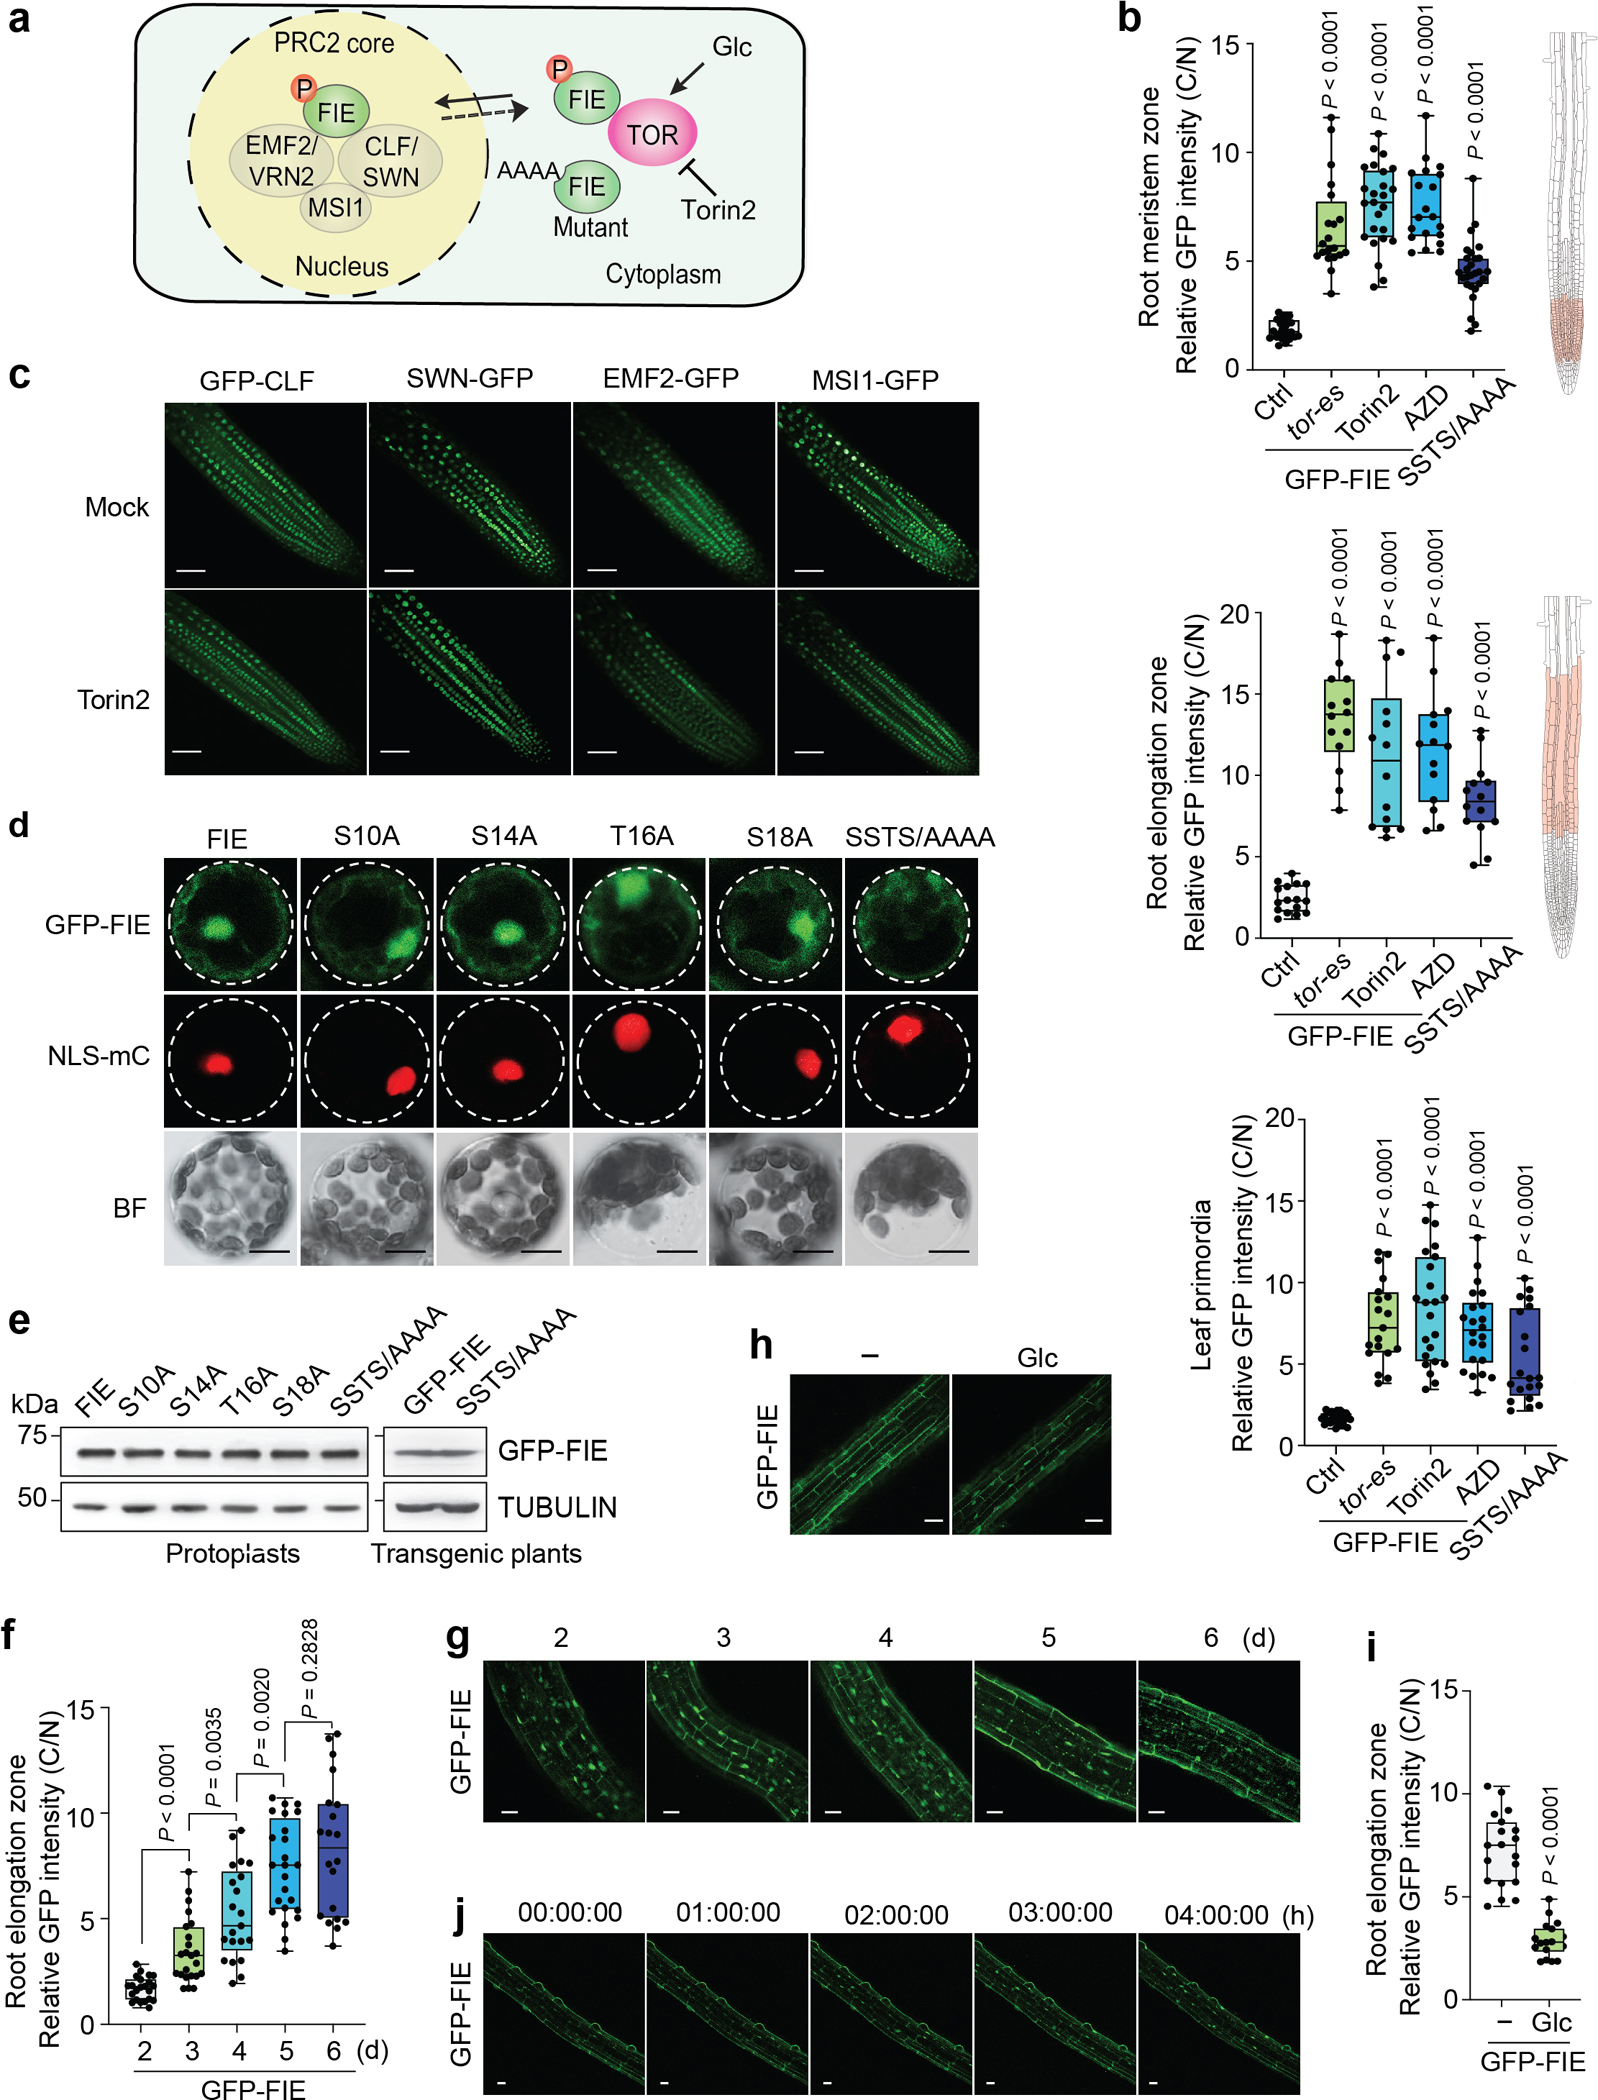
a, A proposed model for the cytoplasm-to-nucleus translocation of FIE regulated by TOR. FIE mainly localizes in the cytoplasm at low TOR activity and its phosphorylation by glucose-activated TOR stimulates its nuclear entry to enhance PRC2 activity. Blocking TOR activity or mutation of the phosphorylation sites inhibited the nuclear translocation of FIE. b, Quantitative confocal imaging of GFP-FIE and GFP-FIE(SSTS/AAAA) in leaf primordia and roots. The cytoplasm/nucleus (C/N) signal intensity ratio of GFP-FIE or GFP-FIE(SSTS/AAAA) at the single-cell level was measured by quantitative confocal imaging using the Leica LAS-X software. WT seedlings (5 d) expressing GFP-FIE without (Ctrl) or with 10 μM of Torin2 or AZD treatment (24 h) or tor-es (10 μM estradiol for 3 d) were examined. Root elongation zone and root meristem zone are illustrated. c, Confocal images of GFP-tagged PRC2 components in the meristem zone of roots. Plants were imaged with or without (Mock) Torin2 treatment. d, Confocal images of GFP-tagged FIE and mutants in protoplasts. BF, bright field. NLS–mC denotes nuclear HY5–mCherry as a control for protoplasts co-transfection and nuclear localization. Scale bars, 10 μm. Images are representative of 10 protoplasts from three biological repeats. e, Immunoblot analysis of GFP-tagged FIE variants expressed in protoplast and transgenic plants. Tubulin was used for the loading control. Data are representatives of three biological replicates. f, g, The dynamics of GFP-FIE during glucose starvation. f, Confocal images of GFP-FIE from 2–6 d in the root elongation zone in glucose-free medium. g, Quantitative confocal imaging of GFP-FIE C/N ratio. h, i, j, Glucose stimulates dynamic nuclear translocation of GFP-FIE after starvation in the root elongation zones. h, Confocal images of GFP-FIE without or with 25 mM glucose stimulation for 6 h in starved seedlings (5 d). i, Quantitative confocal imaging of GFP-FIE C/N ratio. j, Time-lapse live imaging of glucose stimulated nuclear translocation of GFP-FIE in the root elongation zone. Representative images were taken from Supplementary movie at 1–4 h time points after 25 mM glucose stimulation. The experiment was repeated three times with similar results. b, f, i, In the boxplots, data were analysed from more than 15 cells from three experiments, and are expressed as mean ± s.d. Centre line, median; box limits, 25th and 75th percentiles; the whiskers indicate data’s minimum and maximum; the points represent each individual value. Statistical significance was determined by unpaired two-sided Student’s t test. c, g, h, j, Images are representative of six seedlings from three biological repeats. Scale bar, 25 μm.
Extended Data Fig. 7 |. Generation and characterization of estradiol-inducible fie-amiR-es and SSTS/AAAA/fie mutants.
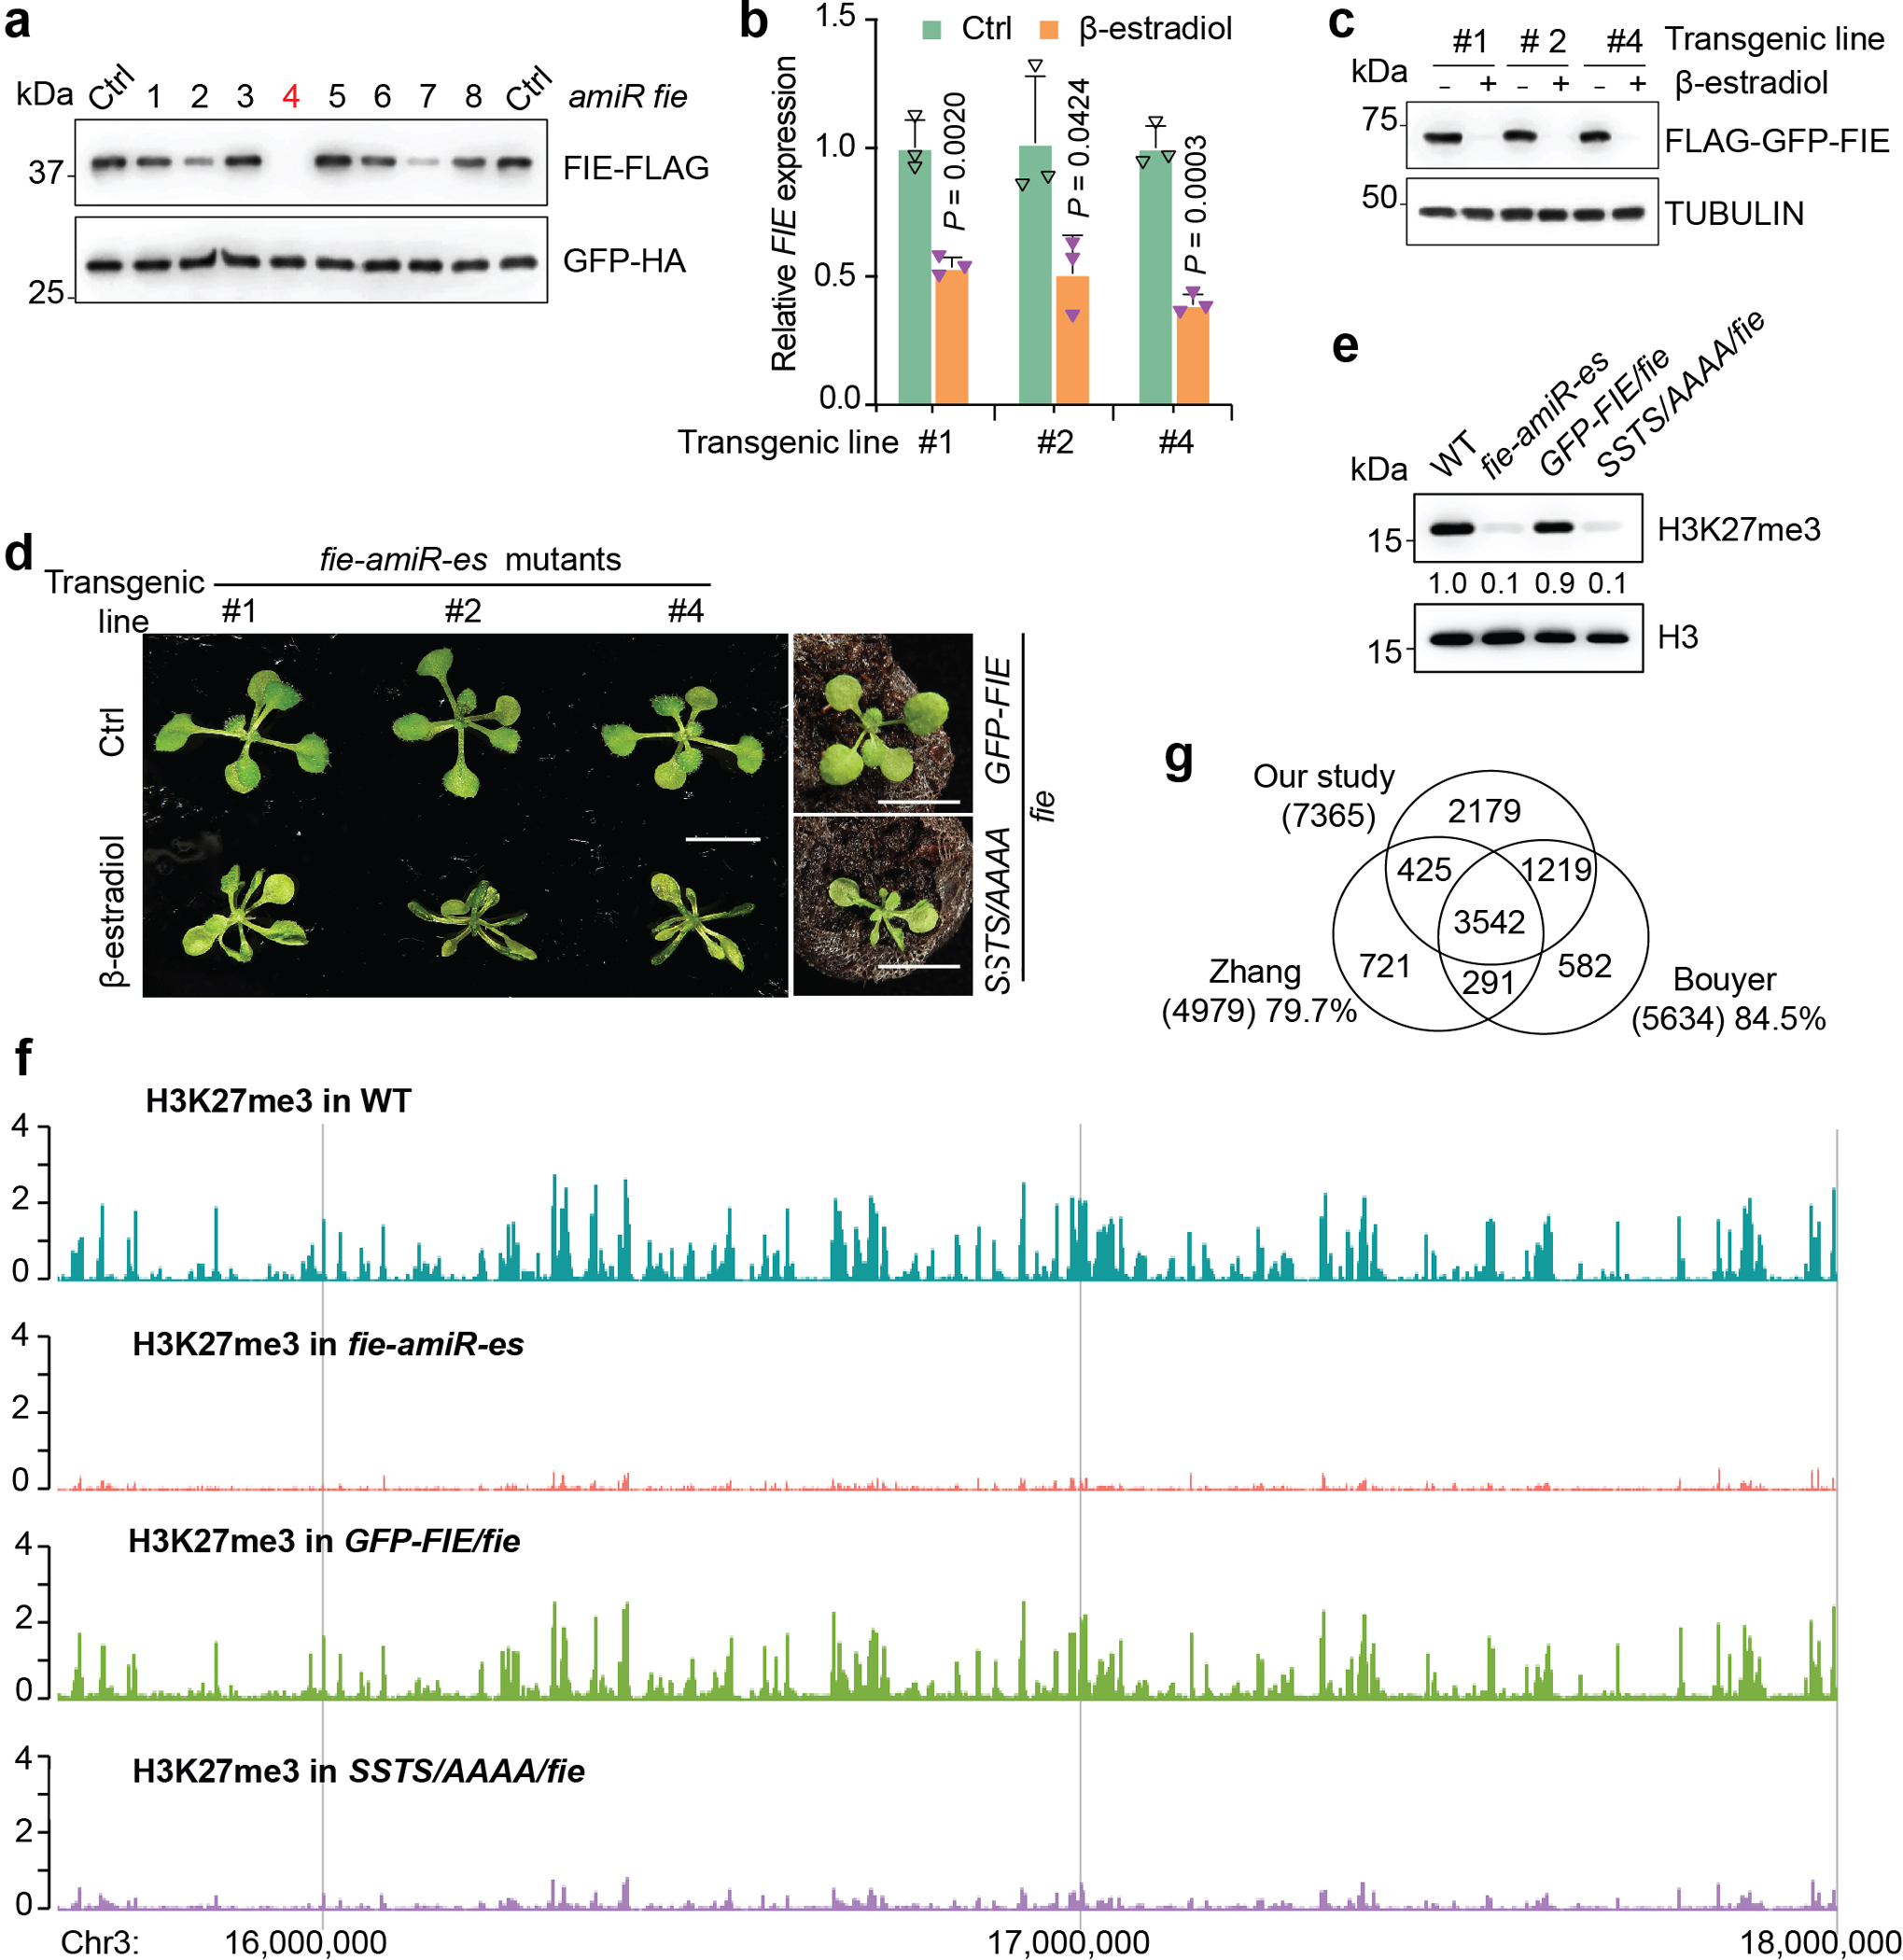
a, Screening of optimal amiRNA in the protoplast system. Empty amiRNA expression vector as a control (Ctrl) or each of the eight amiRNA candidate plasmids was co-transfected with a heat shock promoter-driven FIE-FLAG plasmid. The HBT-GFP-HA plasmid serves as an internal control for all co-transfection experiments. Immunoblot analysis indicated similar GFP-HA protein levels. The most potent amiRNA4 abolished FIE-FLAG expression and was chosen to generate estradiol-inducible fie-amiR-es transgenic plants. b, RT-qPCR analysis of FIE transcripts in 14-day transgenic fie-amiR-es lines without or with 10 μM of estradiol treatment. UBQ10 transcripts served as an internal control for normalization. Data show mean ± s.d. from 3 biological replicates. Data were analysed by unpaired two-sided Student’s t test. c, Protein blot analysis of FIE protein levels in 14-day transgenic fie-amiR-es lines. Three independent fie-amiR-es lines were crossed to the FLAG-GFP-FIE transgenic plant. The FLAG-GFP-FIE protein was eliminated with 10 μM of estradiol treatment. Tubulin was used for the loading control. d, The development phenotype of the fie-amiR-es lines was similar to that of the SSTS/AAAA/fie mutant. Three independent fie-amiR-es lines and the SSTS/AAAA/fie mutant showed small, narrow and curled leaves. The GFP-FIE/fie plant showed normal development. Scale bar, 10 mm. Experiments were conducted in three biological repeats with similar results. e, The H3K27me3 level was greatly decreased in 14-day fie mutant plants. Values are the relative level of H3K27me3 compared with the corresponding H3 control, with immunoblot signals in WT set as 1.0. f, Genome browser view of H3K27me3 ChIP-seq read densities. The Arabidopsis genome region within Chr3:15800000..18000000 is shown. g, Venn diagram of H3K27me3 target genes in Arabidopsis from three independent genome wide analyses. The H3K27me3 targets in our study cover 79.7% of genes from Zhang et al. and 84.5% of genes from Bouyer et al.12. Data in a, c, and e are representatives of three biological replicates each.
Extended Data Fig. 8 |. The TOR-FIE-PRC2-TR relay plays a central role in diverse developmental programs.
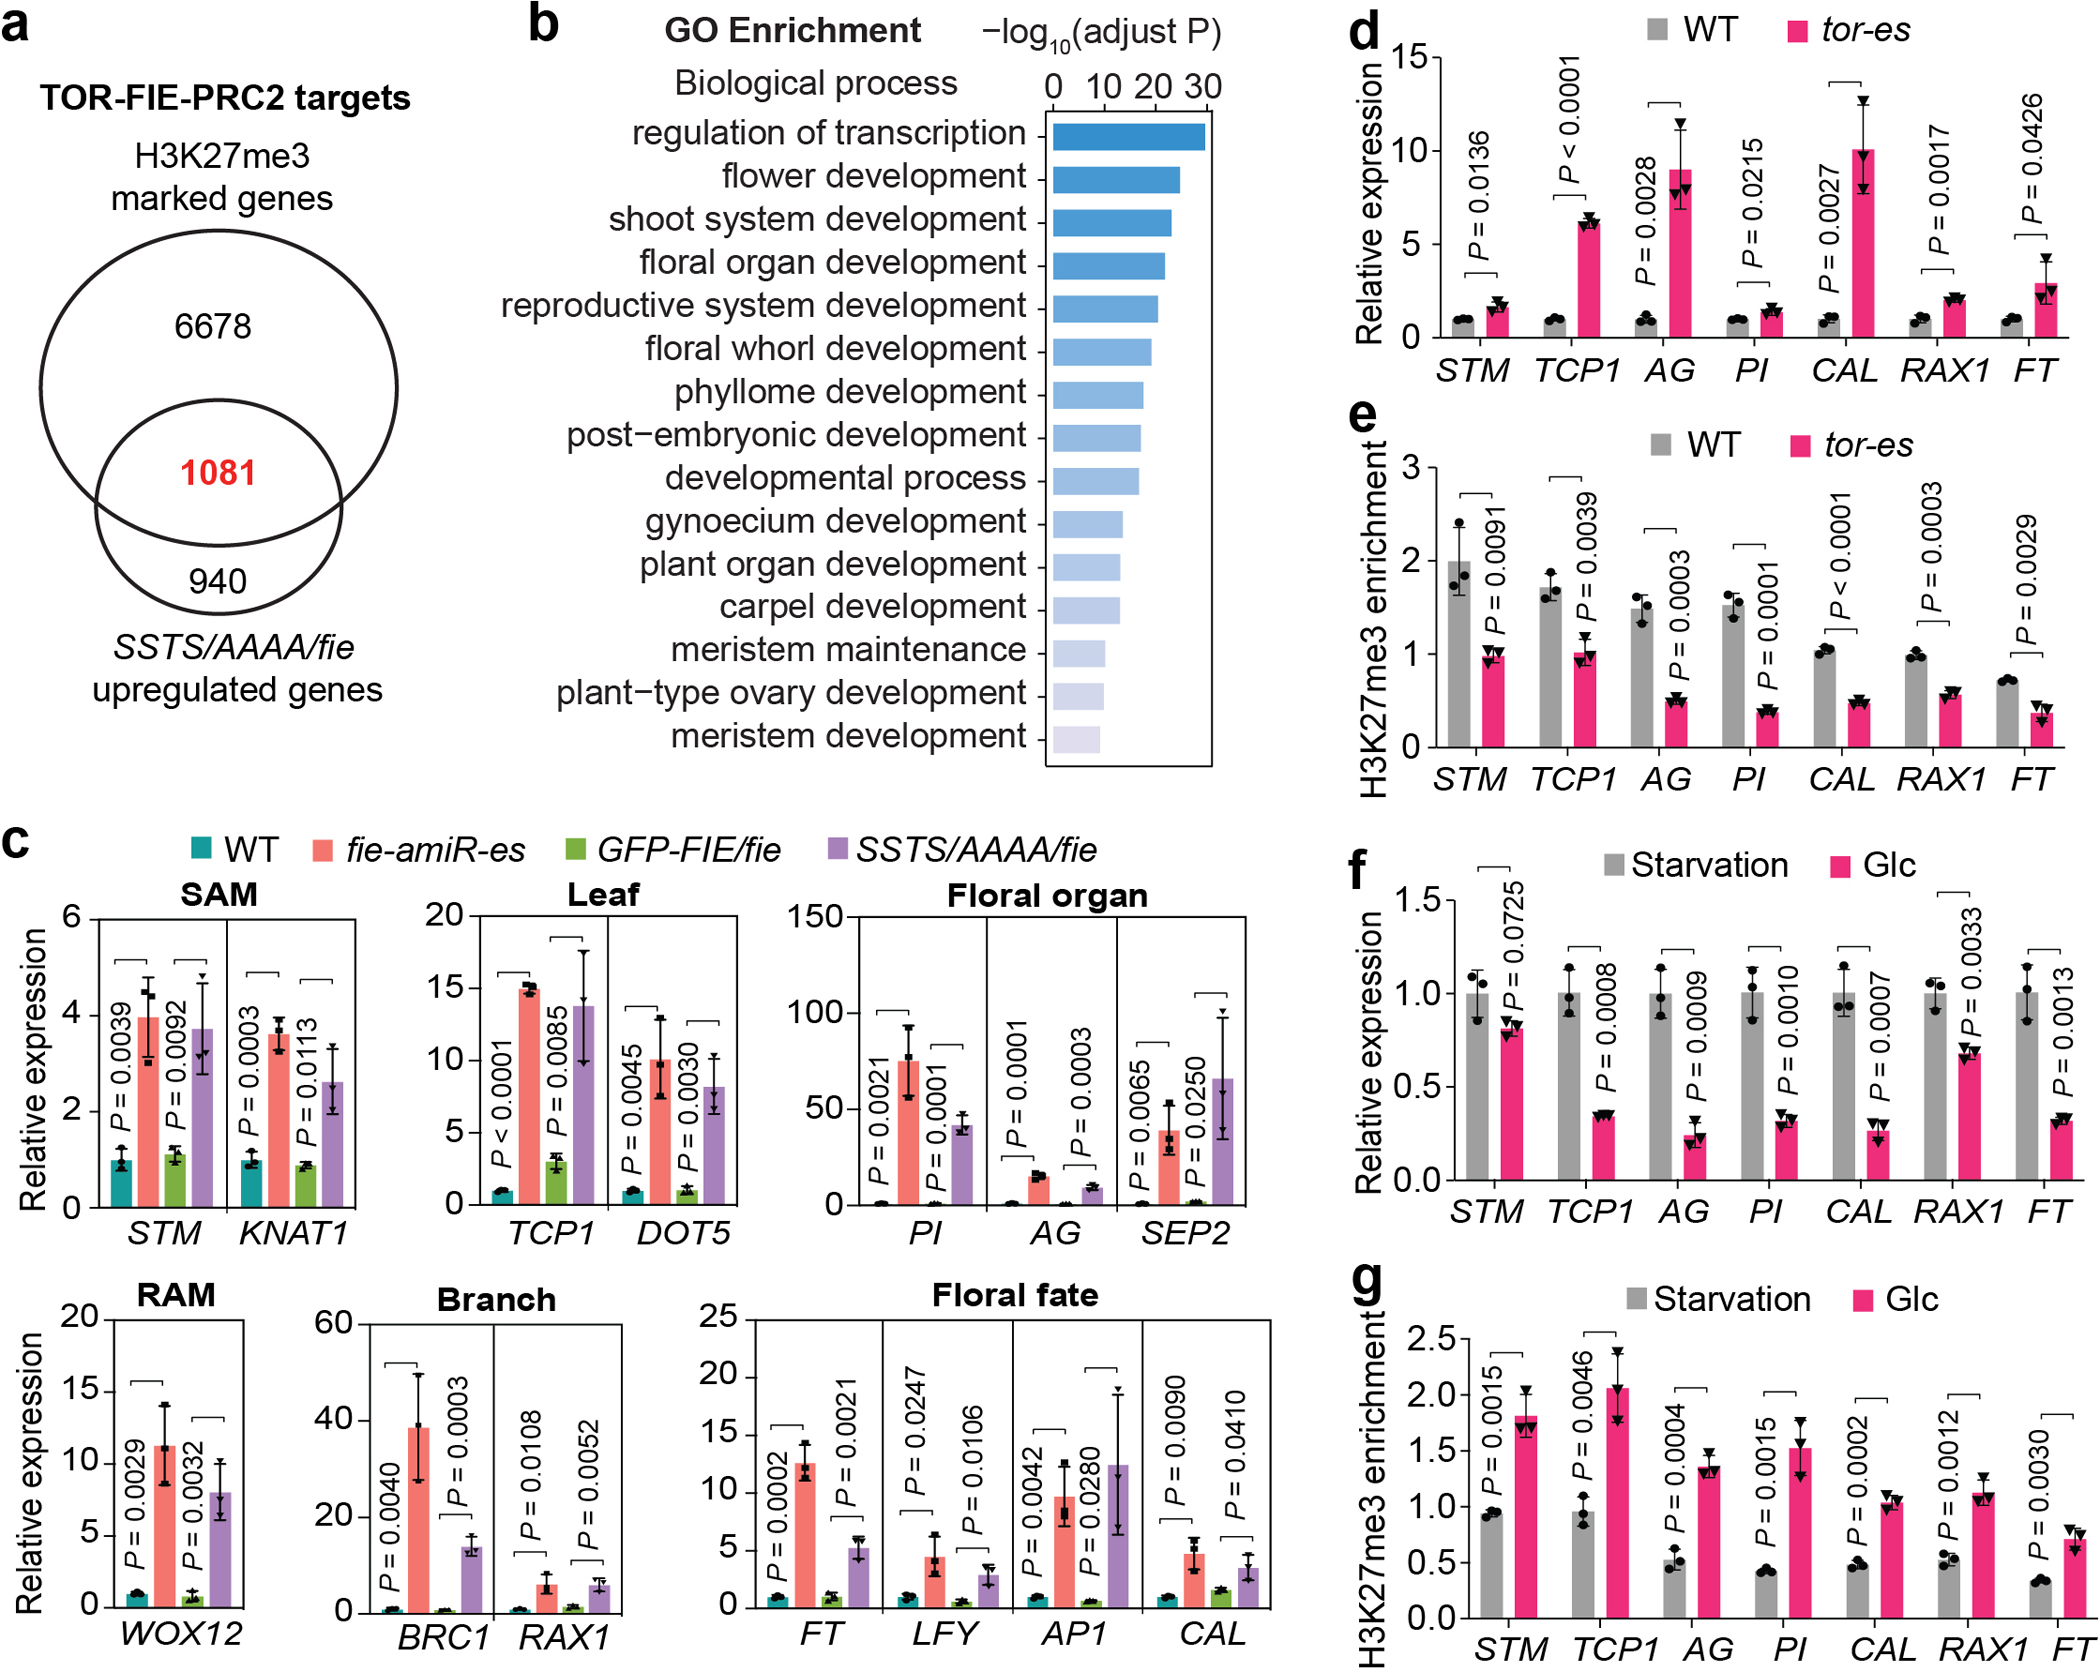
a, TOR-FIE-PRC2 target genes. These genes are marked by H3K27me3 and upregulated in the SSTS/AAAA/fie mutant. b, Gene Ontology enrichment analysis of TOR-FIE-PRC2 target genes in biological process terms related to transcriptional regulation and development. Fisher’s exact test was used by the BiNGO to identify GO terms that are significantly over-represented with the compiled gene list. FDR, false discovery rate. The categories in biological process with fold enrichment > 2 and FDR< 10−10 were selected and presented. c, PRC2 target genes are transcription regulators upregulated in fie mutants (14d). UBQ10 or ACT2 transcripts served as an internal control for normalization. d, f, RT-qPCR analysis of TOR-FIE-PRC2 target genes in WT and tor-es. (d) In sugar-containing medium or (f) in sugar-free medium and without or with 25 mM glucose stimulation for 6 h after starvation (7 d). UBC21 transcripts served as an internal control for normalization. e, g, ChIP-qPCR analysis of H3K27me3 enrichment on TOR-FIE-PRC2 target genes in 7-day WT and tor-es. (e) in sugar-containing medium or (g) in sugar-free medium and without and with 25 mM glucose stimulation for 6 h after starvation (7 d). ChIP-qPCR data were normalized to percentage of input DNA. c-g, Data show mean ± s.d. from 3 biological replicates. Data were analysed by unpaired two-sided Student’s t test.
Extended Data Fig. 9 |. VIN3 expression, H3K27me3 enrichment at FLC, and GFP-FIE nuclear translocation during vernalization.
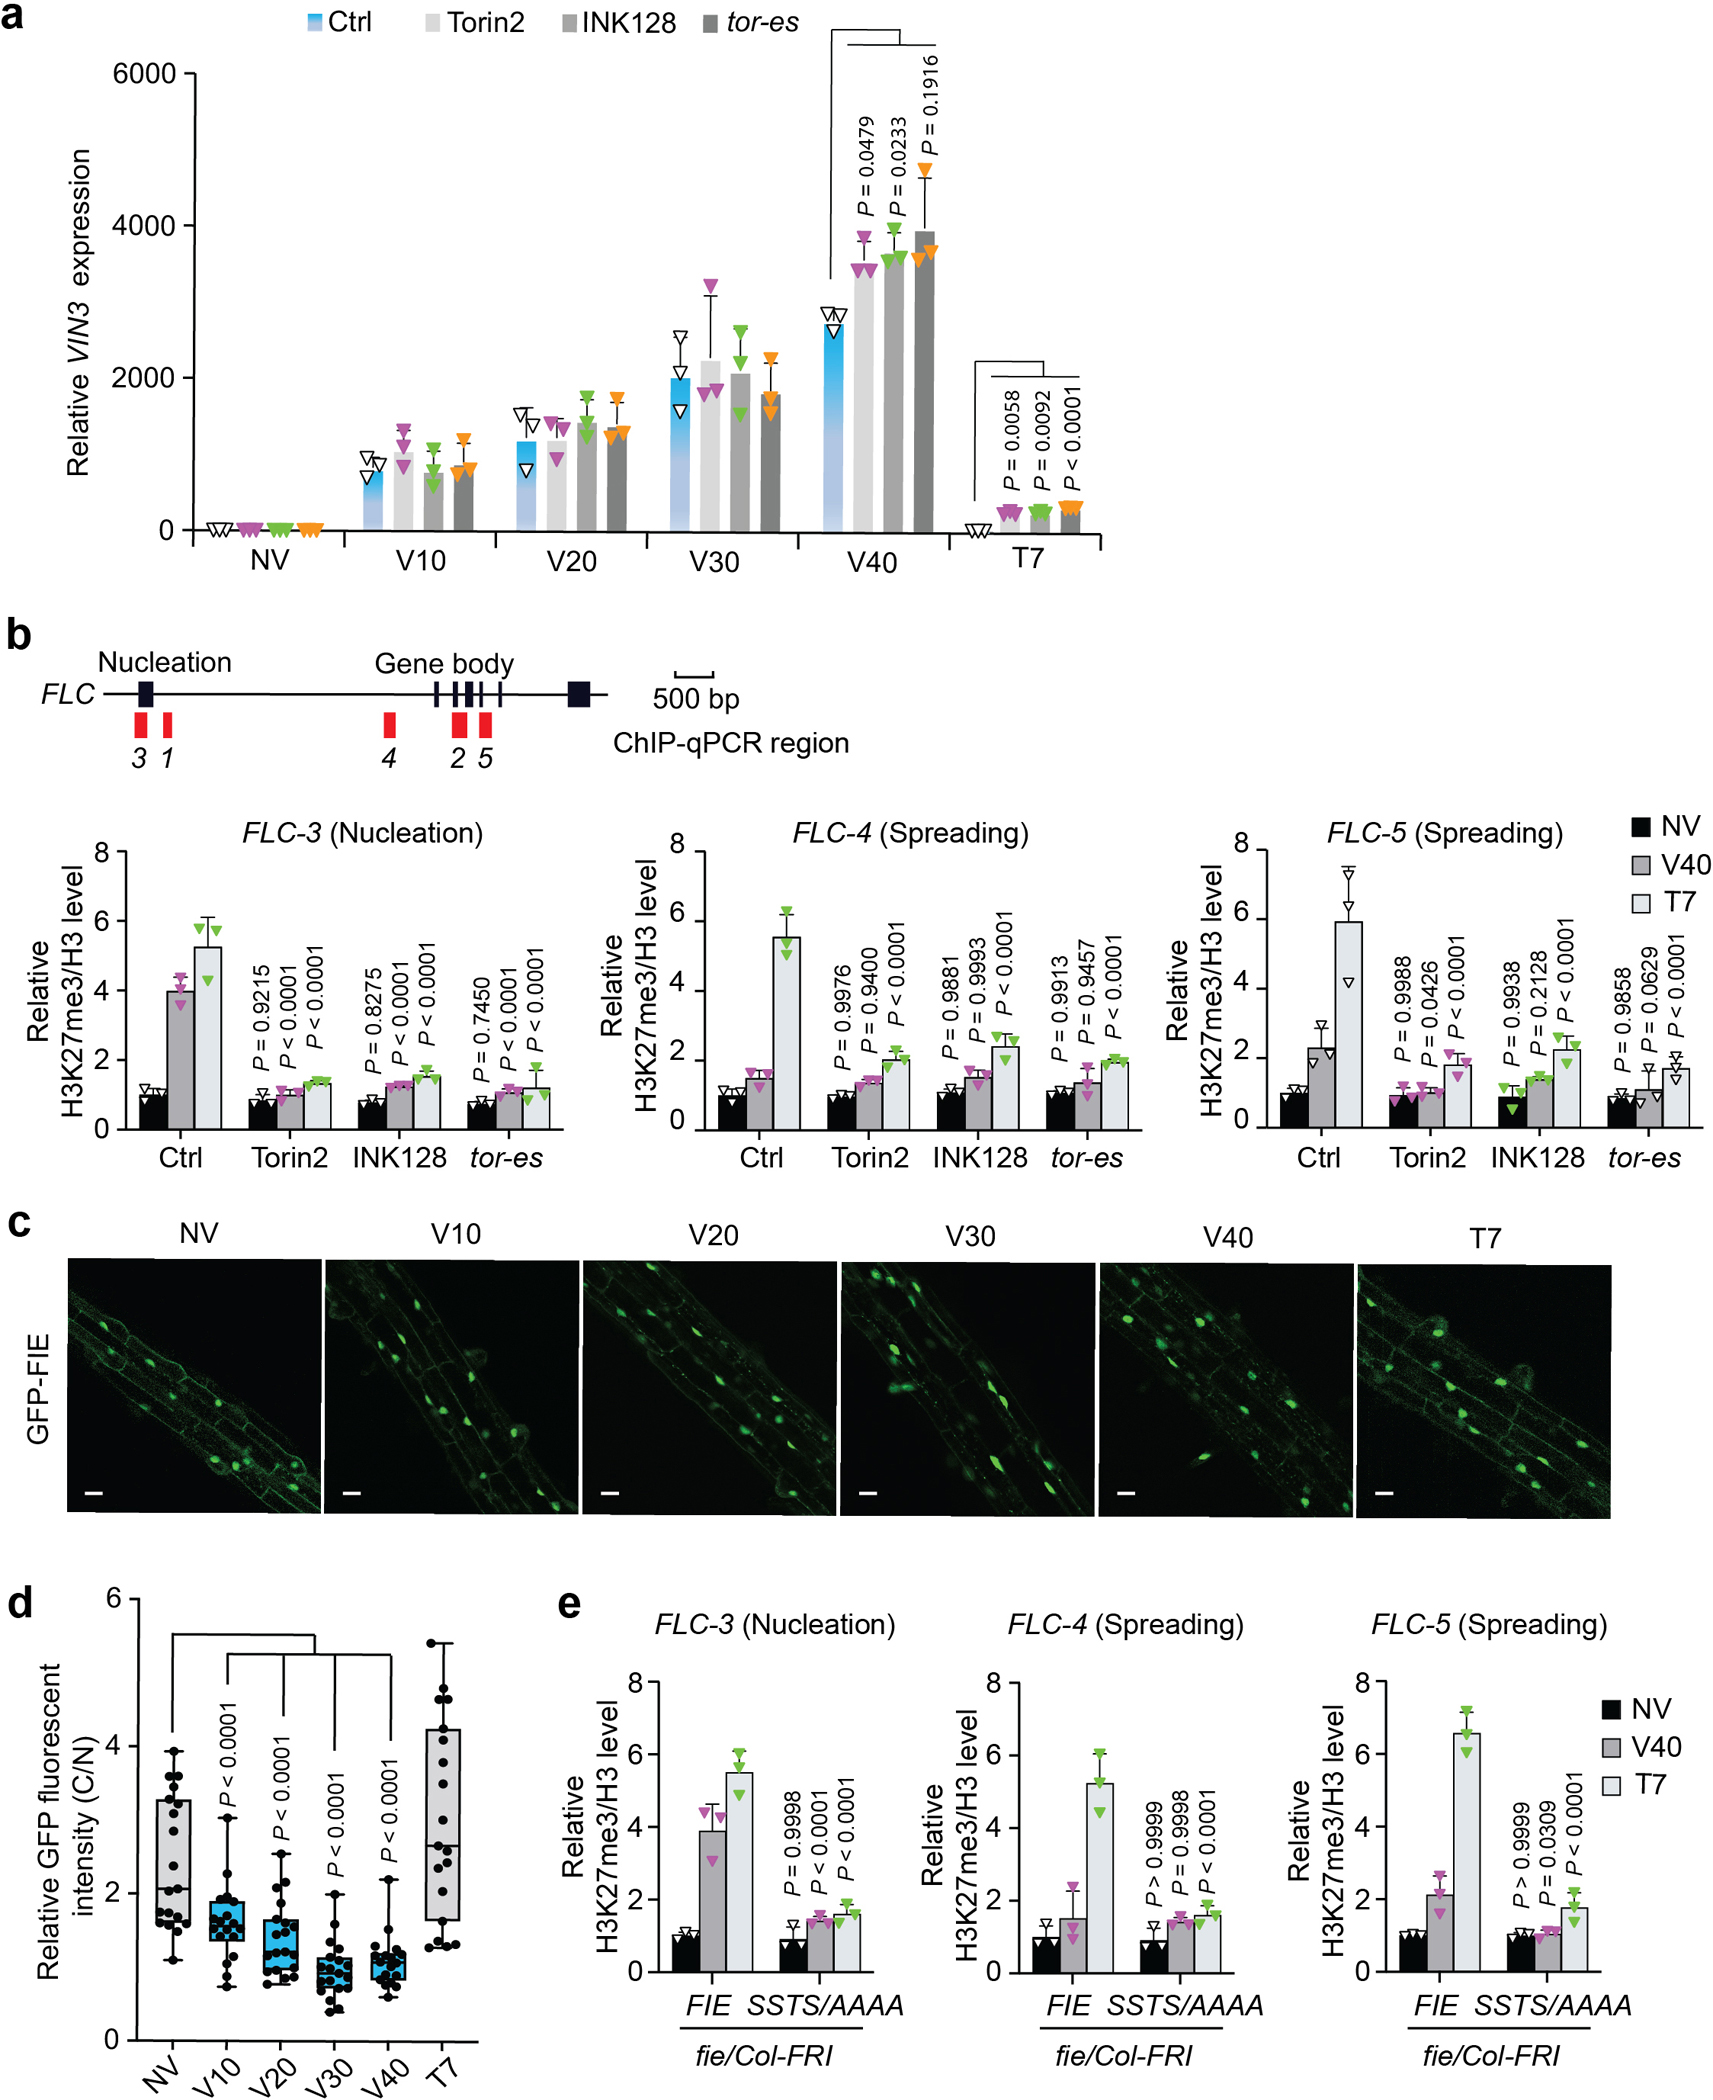
a, VIN3 Induction by vernalization is not regulated by TOR. Seedlings were treated at 4°C to induce vernalization for the indicated days without (Ctrl) or with TOR inhibitors (1 μM Torin2 and INK128), or in the inducible tor-es mutant. Data are relative to the UBC21 (At5g25760) expression as a control gene and normalized to non-vernalized (NV) levels of ctrl plants. Data show mean ± s.d. from 3 biological replicates, two-way ANOVA with Tukey’s multiple comparisons test. b, TOR deficiency reduces H3K27me3 levels at FLC. Relative H3K27me3/H3 level normalized to that of ctrl plants under non-vernalized (NV) condition as 1. Black boxes, exons. Red boxes, selected regions for H3K27me3 ChIP-qPCR analyses. bp, base pairs. FLC-3 and FLC-4,5 are located in the nucleation and spreading regions of H3K27me3 at FLC, respectively. c, d, Prolonged cold treatment prompts the nuclear localization of GFP-FIE in the elongation zones of roots. c, Confocal images of GFP-FIE during vernalization. Images are representative of six seedlings from three biological repeats. Scale bar, 25 μm. d, Quantitative confocal imaging of GFP-FIE in the root elongation zone. The cytoplasm/nucleus (C/N) signal intensity ratio of GFP-FIE at the single-cell level was measured by quantitative confocal imaging using the Leica LAS-X software. In the boxplot, data were analysed from more than 15 cells from three experiments, and are expressed as mean ± s.d. Centre line, median; box limits, 25th and 75th percentiles; the whiskers indicate data’s minimum and maximum; the points represent each individual value. Statistical significance was determined by unpaired two-sided Student’s t test. e, Vernalization induced H3K27me3 levels at FLC are compromised in AAAA/fie-FRI. Relative H3K27me3/H3 level was normalized to that of fie/Col-FRI plants under non-vernalized (NV) condition as 1. Data in b, e show mean ± s.d. from 3 biological replicates, two-way ANOVA with Tukey’s multiple comparisons test; NV, non-vernalized. V, vernalization days at 4°C. T, postcold days at 22°C.
Extended Data Fig. 10 |. Model of the Glucose-TOR-FIE-PRC2 signalling network governing diverse developmental programs.
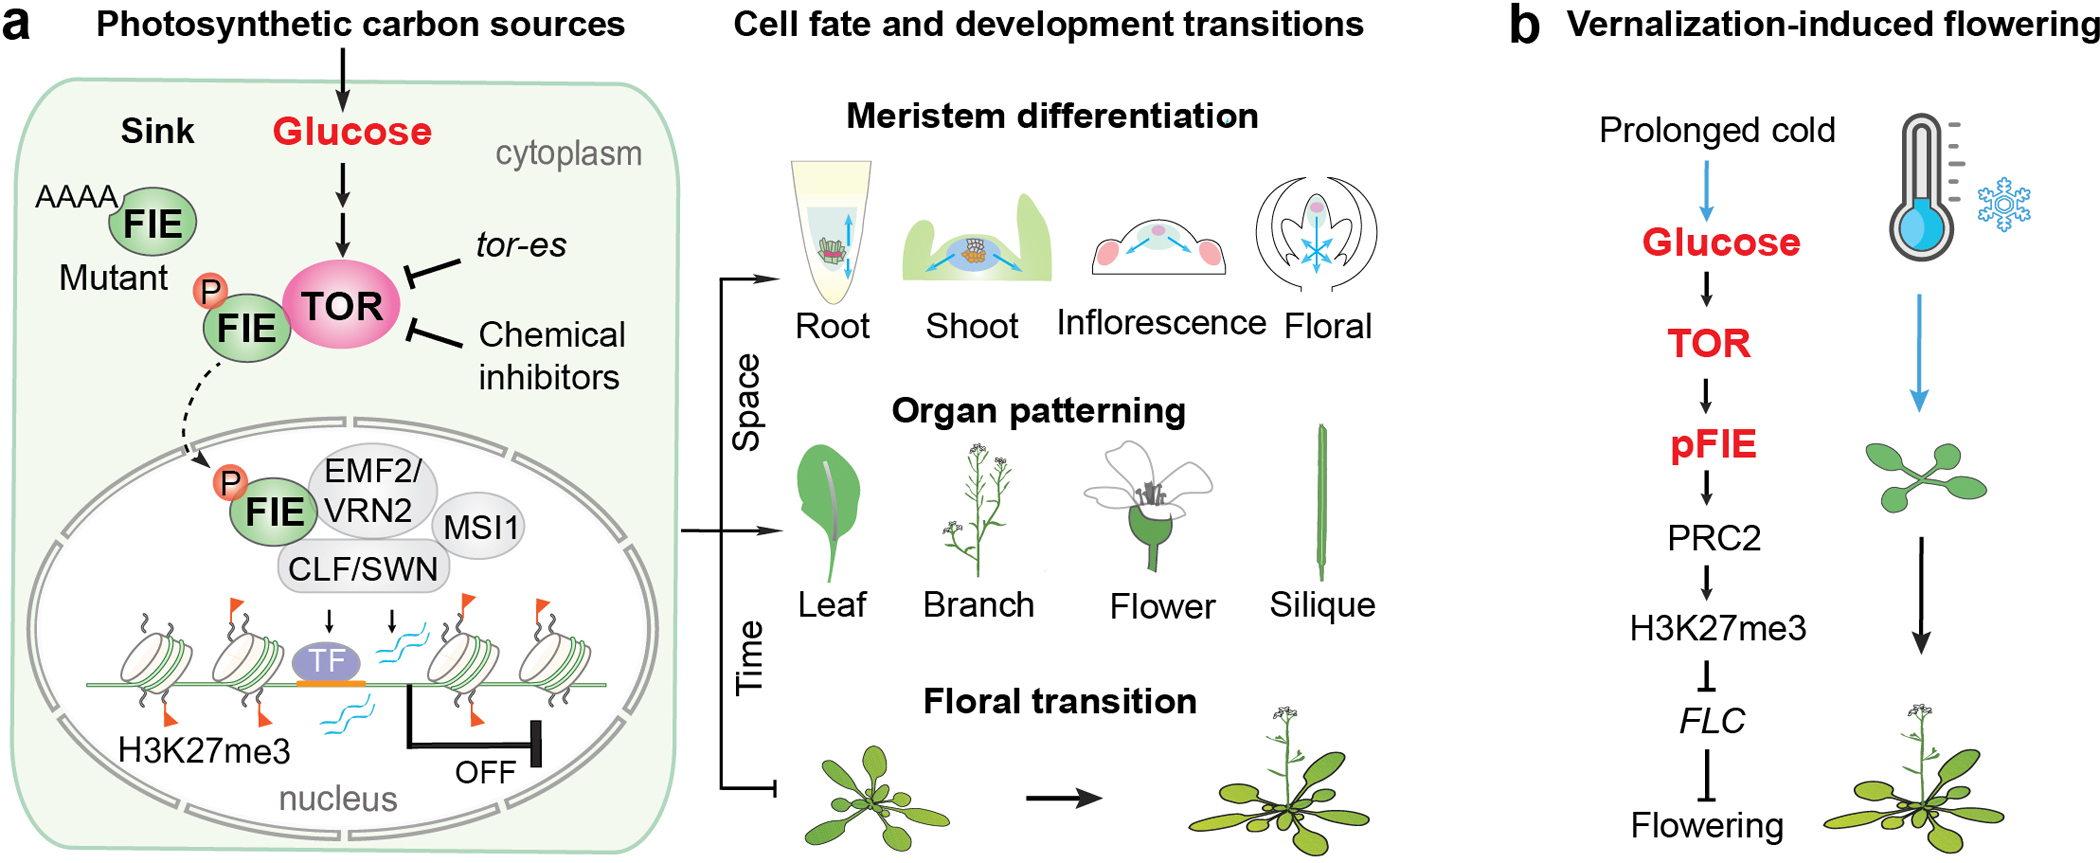
a, The Glucose-TOR-FIE-PRC2 signalling network. Optimal photosynthesis in source leaves produces sugars that are transported to energy demanding sinks, including apical and lateral meristems, developing leaf primordia and young leaves, roots, flowers, fruits and seeds, to support their growth and development. In the sink, glucose derived from local or systemic carbon sources is metabolized to activate TOR kinase, which interacts with and phosphorylates FIE in the cytoplasm. The phosphorylated FIE is translocated into the nucleus to enhance PRC2 activity, which are recruited to the specific chromatin loci by transcription factors (TF), cis-regulatory elements (orange bar), and noncoding RNAs (blue waving lines) to deposit H3K27me3 and silence master transcription regulators controlling diverse developmental programs. This molecular mechanism orchestrates plant developmental fates, organogenesis, patterning and provides a direct and global mechanistic connection between glucose-TOR signalling and development. b, The Glucose-TOR-FIE-PRC2-FLC relay overrides the default vegetative developmental program to promote flowering. This molecular mechanism may underly the link between glucose and vernalization-mediated floral transition stimulated by prolonged cold exposure.
Supplementary Material
Acknowledgements
We thank A. von Arnim, D. Anwesha, S.H. Wu, and C. Meyer for sharing pRPS6(S237), pRPS6(S240) and RPS6 antibodies with detailed protocols; C. Meyer, J. Brunkard, C. Dean, D. Bouyer, Y. H. Cui, J. Goodrich, S. Brady, M. de Lucas and ABRC for providing Arabidopsis lines; H.Y. Qi for supplying the human 293T cells; J. Bush for plant management; S. Jiang and F. Marchan for help with insect cell expression system; B. Ardehali, C. Tsokos, F.K. Hsieh and C.H Yang for sharing reagents and discussions; C. Dufresne from Thermo Scientific Training Institute for advice on LC-MS/MS analysis; X. Fang, A. Diener, L. Li, J. Bush, T.C. Chen and H.Y. Cho for critical reading of the manuscript. This work was supported by the NIH grants GM060493 and GM129093 to J.S. and R.Y., the Agriculture and Food Research Initiative (2020-67013-31615) from the USDA-NIFA to S.X.C., and National Natural Science Foundation of China (31770285) to Y.Z.
Footnotes
Competing interests The authors declare no competing interests.
Code availability
Analysis codes are available upon reasonable request for Lead Contact/corresponding author. No custom codes were central to the conclusions of the paper.
Data availability
Sequencing data are deposited to the Gene Expression Omnibus (accession no. GSE161807). All other data of this manuscript are presented in the main text or in the supplementary materials (uncropped blots and gel images and source data behind all graphs). The sequences of proteins were obtained from TAIR (https://www.arabidopsis.org/) and NCBI (https://www.ncbi.nlm.nih.gov/). The 3D protein structures were predicted by RaptorX (http://raptorx.uchicago.edu//). The pCambia-PUP-IT vector was deposited to Addgene (#186478). The plasmids and the transgenic Arabidopsis seeds generated in this study are available upon request.
References
- 1.Krejci A & Tennessen JM Metabolism in time and space - exploring the frontier of developmental biology. Development 144, 3193–3198, doi: 10.1242/dev.150573 (2017). [DOI] [PubMed] [Google Scholar]
- 2.Shi L, Wu Y & Sheen J TOR signaling in plants: conservation and innovation. Development 145, doi: 10.1242/dev.160887 (2018). [DOI] [PMC free article] [PubMed] [Google Scholar]
- 3.Li L, Liu KH & Sheen J Dynamic Nutrient Signaling Networks in Plants. Annu Rev Cell Dev Biol 37, 341–367, doi: 10.1146/annurev-cellbio-010521-015047 (2021). [DOI] [PMC free article] [PubMed] [Google Scholar]
- 4.Xiong Y et al. Glucose-TOR signalling reprograms the transcriptome and activates meristems. Nature 496, 181–186, doi: 10.1038/nature12030 (2013). [DOI] [PMC free article] [PubMed] [Google Scholar]
- 5.Dobrenel T et al. TOR Signaling and Nutrient Sensing. Annu Rev Plant Biol 67, 261–285, doi: 10.1146/annurev-arplant-043014-114648 (2016). [DOI] [PubMed] [Google Scholar]
- 6.Mozgova I & Hennig L The polycomb group protein regulatory network. Annu Rev Plant Biol 66, 269–296, doi: 10.1146/annurev-arplant-043014-115627 (2015). [DOI] [PubMed] [Google Scholar]
- 7.Pu L & Sung ZR PcG and trxG in plants - friends or foes. Trends Genet 31, 252–262, doi: 10.1016/j.tig.2015.03.004 (2015). [DOI] [PubMed] [Google Scholar]
- 8.Bieluszewski T, Xiao J, Yang Y & Wagner D PRC2 activity, recruitment, and silencing: a comparative perspective. Trends Plant Sci 26, 1186–1198, doi: 10.1016/j.tplants.2021.06.006 (2021). [DOI] [PubMed] [Google Scholar]
- 9.Atlasi Y & Stunnenberg HG The interplay of epigenetic marks during stem cell differentiation and development. Nat Rev Genet 18, 643–658, doi: 10.1038/nrg.2017.57 (2017). [DOI] [PubMed] [Google Scholar]
- 10.Schuettengruber B, Bourbon HM, Di Croce L & Cavalli G Genome Regulation by Polycomb and Trithorax: 70 Years and Counting. Cell 171, 34–57, doi: 10.1016/j.cell.2017.08.002 (2017). [DOI] [PubMed] [Google Scholar]
- 11.Margueron R et al. Role of the polycomb protein EED in the propagation of repressive histone marks. Nature 461, 762–767, doi: 10.1038/nature08398 (2009). [DOI] [PMC free article] [PubMed] [Google Scholar]
- 12.Bouyer D et al. Polycomb repressive complex 2 controls the embryo-to-seedling phase transition. PLoS Genet 7, e1002014, doi: 10.1371/journal.pgen.1002014 (2011). [DOI] [PMC free article] [PubMed] [Google Scholar]
- 13.Bernier G & Perilleux C A physiological overview of the genetics of flowering time control. Plant Biotechnol J 3, 3–16, doi: 10.1111/j.1467-7652.2004.00114.x (2005). [DOI] [PubMed] [Google Scholar]
- 14.Yu S, Lian H & Wang JW Plant developmental transitions: the role of microRNAs and sugars. Curr Opin Plant Biol 27, 1–7, doi: 10.1016/j.pbi.2015.05.009 (2015). [DOI] [PubMed] [Google Scholar]
- 15.Li X et al. Differential TOR activation and cell proliferation in Arabidopsis root and shoot apexes. Proc Natl Acad Sci U S A 114, 2765–2770, doi: 10.1073/pnas.1618782114 (2017). [DOI] [PMC free article] [PubMed] [Google Scholar]
- 16.Barbier FF, Dun EA, Kerr SC, Chabikwa TG & Beveridge CA An Update on the Signals Controlling Shoot Branching. Trends Plant Sci 24, 220–236, doi: 10.1016/j.tplants.2018.12.001 (2019). [DOI] [PubMed] [Google Scholar]
- 17.Deprost D et al. The Arabidopsis TOR kinase links plant growth, yield, stress resistance and mRNA translation. EMBO Rep 8, 864–870, doi: 10.1038/sj.embor.7401043 (2007). [DOI] [PMC free article] [PubMed] [Google Scholar]
- 18.Ryabova LA, Robaglia C & Meyer C Target of Rapamycin kinase: central regulatory hub for plant growth and metabolism. J Exp Bot 70, 2211–2216, doi: 10.1093/jxb/erz108 (2019). [DOI] [PMC free article] [PubMed] [Google Scholar]
- 19.Wu Y et al. Integration of nutrient, energy, light, and hormone signalling via TOR in plants. J Exp Bot 70, 2227–2238, doi: 10.1093/jxb/erz028 (2019). [DOI] [PMC free article] [PubMed] [Google Scholar]
- 20.Ren M et al. Target of rapamycin signaling regulates metabolism, growth, and life span in Arabidopsis. Plant Cell 24, 4850–4874, doi: 10.1105/tpc.112.107144 (2012). [DOI] [PMC free article] [PubMed] [Google Scholar]
- 21.Xiong Y & Sheen J Rapamycin and glucose-target of rapamycin (TOR) protein signaling in plants. J Biol Chem 287, 2836–2842, doi: 10.1074/jbc.M111.300749 (2012). [DOI] [PMC free article] [PubMed] [Google Scholar]
- 22.Caldana C et al. Systemic analysis of inducible target of rapamycin mutants reveal a general metabolic switch controlling growth in Arabidopsis thaliana. Plant J 73, 897–909, doi: 10.1111/tpj.12080 (2013). [DOI] [PubMed] [Google Scholar]
- 23.Orlando DA et al. Quantitative ChIP-Seq normalization reveals global modulation of the epigenome. Cell Rep 9, 1163–1170, doi: 10.1016/j.celrep.2014.10.018 (2014). [DOI] [PubMed] [Google Scholar]
- 24.Anderson GH, Veit B & Hanson MR The Arabidopsis AtRaptor genes are essential for post-embryonic plant growth. BMC Biol 3, 12, doi: 10.1186/1741-7007-3-12 (2005). [DOI] [PMC free article] [PubMed] [Google Scholar]
- 25.Moreau M et al. Mutations in the Arabidopsis homolog of LST8/GbetaL, a partner of the target of Rapamycin kinase, impair plant growth, flowering, and metabolic adaptation to long days. Plant Cell 24, 463–481, doi: 10.1105/tpc.111.091306 (2012). [DOI] [PMC free article] [PubMed] [Google Scholar]
- 26.Forzani C et al. Mutations of the AtYAK1 Kinase Suppress TOR Deficiency in Arabidopsis. Cell Rep 27, 3696–3708 e3695, doi: 10.1016/j.celrep.2019.05.074 (2019). [DOI] [PubMed] [Google Scholar]
- 27.Liu Q et al. A proximity-tagging system to identify membrane protein-protein interactions. Nat Methods 15, 715–722, doi: 10.1038/s41592-018-0100-5 (2018). [DOI] [PubMed] [Google Scholar]
- 28.Kallberg M et al. Template-based protein structure modeling using the RaptorX web server. Nat Protoc 7, 1511–1522, doi: 10.1038/nprot.2012.085 (2012). [DOI] [PMC free article] [PubMed] [Google Scholar]
- 29.Tie F, Siebold AP & Harte PJ The N-terminus of Drosophila ESC mediates its phosphorylation and dimerization. Biochem Biophys Res Commun 332, 622–632, doi: 10.1016/j.bbrc.2005.04.157 (2005). [DOI] [PubMed] [Google Scholar]
- 30.Oliva M et al. FIE, a nuclear PRC2 protein, forms cytoplasmic complexes in Arabidopsis thaliana. J Exp Bot 67, 6111–6123, doi: 10.1093/jxb/erw373 (2016). [DOI] [PMC free article] [PubMed] [Google Scholar]
- 31.Katz A, Oliva M, Mosquna A, Hakim O & Ohad N FIE and CURLY LEAF polycomb proteins interact in the regulation of homeobox gene expression during sporophyte development. Plant J 37, 707–719, doi: 10.1111/j.1365-313x.2003.01996.x (2004). [DOI] [PubMed] [Google Scholar]
- 32.Zhang X et al. Whole-genome analysis of histone H3 lysine 27 trimethylation in Arabidopsis. PLoS Biol 5, e129, doi: 10.1371/journal.pbio.0050129 (2007). [DOI] [PMC free article] [PubMed] [Google Scholar]
- 33.Aichinger E, Kornet N, Friedrich T & Laux T Plant stem cell niches. Annu Rev Plant Biol 63, 615–636, doi: 10.1146/annurev-arplant-042811-105555 (2012). [DOI] [PubMed] [Google Scholar]
- 34.Pierre-Jerome E, Drapek C & Benfey PN Regulation of Division and Differentiation of Plant Stem Cells. Annu Rev Cell Dev Biol 34, 289–310, doi: 10.1146/annurev-cellbio-100617-062459 (2018). [DOI] [PMC free article] [PubMed] [Google Scholar]
- 35.Denyer T et al. Spatiotemporal Developmental Trajectories in the Arabidopsis Root Revealed Using High-Throughput Single-Cell RNA Sequencing. Dev Cell 48, 840–852 e845, doi: 10.1016/j.devcel.2019.02.022 (2019). [DOI] [PubMed] [Google Scholar]
- 36.Liu C, Thong Z & Yu H Coming into bloom: the specification of floral meristems. Development 136, 3379–3391, doi: 10.1242/dev.033076 (2009). [DOI] [PubMed] [Google Scholar]
- 37.Wang L et al. Transcriptional regulation of strigolactone signalling in Arabidopsis. Nature 583, 277–281, doi: 10.1038/s41586-020-2382-x (2020). [DOI] [PubMed] [Google Scholar]
- 38.Petricka JJ, Clay NK & Nelson TM Vein patterning screens and the defectively organized tributaries mutants in Arabidopsis thaliana. Plant J 56, 251–263, doi: 10.1111/j.1365-313X.2008.03595.x (2008). [DOI] [PubMed] [Google Scholar]
- 39.Yang Y et al. The TIE1 transcriptional repressor controls shoot branching by directly repressing BRANCHED1 in Arabidopsis. PLoS Genet 14, e1007296, doi: 10.1371/journal.pgen.1007296 (2018). [DOI] [PMC free article] [PubMed] [Google Scholar]
- 40.Menon G, Schulten A, Dean C & Howard M Digital paradigm for Polycomb epigenetic switching and memory. Curr Opin Plant Biol 61, 102012, doi: 10.1016/j.pbi.2021.102012 (2021). [DOI] [PMC free article] [PubMed] [Google Scholar]
- 41.Ruelens P et al. FLOWERING LOCUS C in monocots and the tandem origin of angiosperm-specific MADS-box genes. Nat Commun 4, 2280, doi: 10.1038/ncomms3280 (2013). [DOI] [PubMed] [Google Scholar]
- 42.Yang H et al. Distinct phases of Polycomb silencing to hold epigenetic memory of cold in Arabidopsis. Science 357, 1142–1145, doi: 10.1126/science.aan1121 (2017). [DOI] [PubMed] [Google Scholar]
- 43.Questa JI, Song J, Geraldo N, An H & Dean C Arabidopsis transcriptional repressor VAL1 triggers Polycomb silencing at FLC during vernalization. Science 353, 485–488, doi: 10.1126/science.aaf7354 (2016). [DOI] [PubMed] [Google Scholar]
- 44.Purvis ON Vernalization of Fragments of Embryo Tissue. Nature 145, 462 (1940). [Google Scholar]
- 45.Klotke JK, J., Gatzke N, Heyer AG Impact of soluble sugar concentrations on the acquisition of freezing tolerance in accessions of Arabidopsis thaliana with contrasting cold adaptation – evidence for a role of raffinose in cold acclimation. Plant Cell Environ 27, 1395–1404 (2004). [Google Scholar]
- 46.Zhao Y, Antoniou-Kourounioti RL, Calder G, Dean C & Howard M Temperature-dependent growth contributes to long-term cold sensing. Nature 583, 825–829, doi: 10.1038/s41586-020-2485-4 (2020). [DOI] [PMC free article] [PubMed] [Google Scholar]
- 47.Heo JB & Sung S Vernalization-mediated epigenetic silencing by a long intronic noncoding RNA. Science 331, 76–79, doi: 10.1126/science.1197349 (2011). [DOI] [PubMed] [Google Scholar]
- 48.Xiao J et al. Cis and trans determinants of epigenetic silencing by Polycomb repressive complex 2 in Arabidopsis. Nat Genet 49, 1546–1552, doi: 10.1038/ng.3937 (2017). [DOI] [PubMed] [Google Scholar]
- 49.Zhou Y et al. Telobox motifs recruit CLF/SWN-PRC2 for H3K27me3 deposition via TRB factors in Arabidopsis. Nat Genet 50, 638–644, doi: 10.1038/s41588-018-0109-9 (2018). [DOI] [PubMed] [Google Scholar]
- 50.Dong Y et al. TOR represses stress responses through global regulation of H3K27 trimethylation in plants. bioRxiv preprint, doi: 10.1101/2021.03.28.437410 (2021). [DOI] [PubMed] [Google Scholar]
- 51.Wang H et al. Arabidopsis Flower and Embryo Developmental Genes are Repressed in Seedlings by Different Combinations of Polycomb Group Proteins in Association with Distinct Sets of Cis-regulatory Elements. PLoS Genet 12, e1005771, doi: 10.1371/journal.pgen.1005771 (2016). [DOI] [PMC free article] [PubMed] [Google Scholar]
- 52.Clough SJ & Bent AF Floral dip: a simplified method for Agrobacterium-mediated transformation of Arabidopsis thaliana. Plant J 16, 735–743, doi: 10.1046/j.1365-313x.1998.00343.x (1998). [DOI] [PubMed] [Google Scholar]
- 53.Li JF et al. Comprehensive protein-based artificial microRNA screens for effective gene silencing in plants. Plant Cell 25, 1507–1522, doi: 10.1105/tpc.113.112235 (2013). [DOI] [PMC free article] [PubMed] [Google Scholar]
- 54.Brand L et al. A versatile and reliable two-component system for tissue-specific gene induction in Arabidopsis. Plant Physiol 141, 1194–1204, doi: 10.1104/pp.106.081299 (2006). [DOI] [PMC free article] [PubMed] [Google Scholar]
- 55.Liu KH et al. Discovery of nitrate-CPK-NLP signalling in central nutrient-growth networks. Nature 545, 311–316, doi: 10.1038/nature22077 (2017). [DOI] [PMC free article] [PubMed] [Google Scholar]
- 56.Shu J et al. Genome-wide occupancy of histone H3K27 methyltransferases CURLY LEAF and SWINGER in Arabidopsis seedlings. Plant Direct 3, e00100, doi: 10.1002/pld3.100 (2019). [DOI] [PMC free article] [PubMed] [Google Scholar]
- 57.Schubert D et al. Silencing by plant Polycomb-group genes requires dispersed trimethylation of histone H3 at lysine 27. EMBO J 25, 4638–4649, doi: 10.1038/sj.emboj.7601311 (2006). [DOI] [PMC free article] [PubMed] [Google Scholar]
- 58.de Lucas M et al. Transcriptional Regulation of Arabidopsis Polycomb Repressive Complex 2 Coordinates Cell-Type Proliferation and Differentiation. Plant Cell 28, 2616–2631, doi: 10.1105/tpc.15.00744 (2016). [DOI] [PMC free article] [PubMed] [Google Scholar]
- 59.Angel A, Song J, Dean C & Howard M A Polycomb-based switch underlying quantitative epigenetic memory. Nature 476, 105–108, doi: 10.1038/nature10241 (2011). [DOI] [PubMed] [Google Scholar]
- 60.Ori N, Eshed Y, Chuck G, Bowman JL & Hake S Mechanisms that control knox gene expression in the Arabidopsis shoot. Development 127, 5523–5532 (2000). [DOI] [PubMed] [Google Scholar]
- 61.Arur S & Schedl T Generation and purification of highly specific antibodies for detecting post-translationally modified proteins in vivo. Nat Protoc 9, 375–395, doi: 10.1038/nprot.2014.017 (2014). [DOI] [PMC free article] [PubMed] [Google Scholar]
- 62.Niu Y & Sheen J Transient expression assays for quantifying signaling output. Methods Mol Biol 876, 195–206, doi: 10.1007/978-1-61779-809-2_16 (2012). [DOI] [PubMed] [Google Scholar]
- 63.Yamaguchi N et al. PROTOCOLS: Chromatin Immunoprecipitation from Arabidopsis Tissues. Arabidopsis Book 12, e0170, doi: 10.1199/tab.0170 (2014). [DOI] [PMC free article] [PubMed] [Google Scholar]
- 64.Jacob Y et al. Selective methylation of histone H3 variant H3.1 regulates heterochromatin replication. Science 343, 1249–1253, doi: 10.1126/science.1248357 (2014). [DOI] [PMC free article] [PubMed] [Google Scholar]
- 65.Zhang T, Schneider JD, Zhu N & Chen S Identification of MAPK Substrates Using Quantitative Phosphoproteomics. Methods Mol Biol 1578, 133–142, doi: 10.1007/978-1-4939-6859-6_10 (2017). [DOI] [PubMed] [Google Scholar]
- 66.Pang Q et al. Proteomics and phosphoproteomics revealed molecular networks of stomatal immune responses. Planta 252, 66, doi: 10.1007/s00425-020-03474-3 (2020). [DOI] [PubMed] [Google Scholar]
- 67.Yoo SD, Cho YH & Sheen J Arabidopsis mesophyll protoplasts: a versatile cell system for transient gene expression analysis. Nat Protoc 2, 1565–1572, doi: 10.1038/nprot.2007.199 (2007). [DOI] [PubMed] [Google Scholar]
- 68.Cervera M Histochemical and fluorometric assays for uidA (GUS) gene detection. Methods Mol Biol 286, 203–214, doi: 10.1385/1-59259-827-7:203 (2005). [DOI] [PubMed] [Google Scholar]
- 69.Ye R et al. Cytoplasmic assembly and selective nuclear import of Arabidopsis Argonaute4/siRNA complexes. Mol Cell 46, 859–870, doi: 10.1016/j.molcel.2012.04.013 (2012). [DOI] [PubMed] [Google Scholar]
- 70.Chen GH, Liu MJ, Xiong Y, Sheen J & Wu SH TOR and RPS6 transmit light signals to enhance protein translation in deetiolating Arabidopsis seedlings. Proc Natl Acad Sci U S A 115, 12823–12828, doi: 10.1073/pnas.1809526115 (2018). [DOI] [PMC free article] [PubMed] [Google Scholar]
- 71.Enganti R et al. Phosphorylation of Ribosomal Protein RPS6 Integrates Light Signals and Circadian Clock Signals. Front Plant Sci 8, 2210, doi: 10.3389/fpls.2017.02210 (2017). [DOI] [PMC free article] [PubMed] [Google Scholar]
- 72.Li Z et al. The bread wheat epigenomic map reveals distinct chromatin architectural and evolutionary features of functional genetic elements. Genome Biol 20, 139, doi: 10.1186/s13059-019-1746-8 (2019). [DOI] [PMC free article] [PubMed] [Google Scholar]
- 73.Bolger AM, Lohse M & Usadel B Trimmomatic: a flexible trimmer for Illumina sequence data. Bioinformatics 30, 2114–2120, doi: 10.1093/bioinformatics/btu170 (2014). [DOI] [PMC free article] [PubMed] [Google Scholar]
- 74.Zhang Y et al. Model-based analysis of ChIP-Seq (MACS). Genome Biol 9, R137, doi: 10.1186/gb-2008-9-9-r137 (2008). [DOI] [PMC free article] [PubMed] [Google Scholar]
- 75.Buels R et al. JBrowse: a dynamic web platform for genome visualization and analysis. Genome Biol 17, 66, doi: 10.1186/s13059-016-0924-1 (2016). [DOI] [PMC free article] [PubMed] [Google Scholar]
- 76.Kim D, Langmead B & Salzberg SL HISAT: a fast spliced aligner with low memory requirements. Nat Methods 12, 357–360, doi: 10.1038/nmeth.3317 (2015). [DOI] [PMC free article] [PubMed] [Google Scholar]
- 77.Liao Y, Smyth GK & Shi W The Subread aligner: fast, accurate and scalable read mapping by seed-and-vote. Nucleic Acids Res 41, e108, doi: 10.1093/nar/gkt214 (2013). [DOI] [PMC free article] [PubMed] [Google Scholar]
- 78.Love MI, Huber W & Anders S Moderated estimation of fold change and dispersion for RNA-seq data with DESeq2. Genome Biol 15, 550, doi: 10.1186/s13059-014-0550-8 (2014). [DOI] [PMC free article] [PubMed] [Google Scholar]
- 79.Maere S, Heymans K & Kuiper M BiNGO: a Cytoscape plugin to assess overrepresentation of gene ontology categories in biological networks. Bioinformatics 21, 3448–3449, doi: 10.1093/bioinformatics/bti551 (2005). [DOI] [PubMed] [Google Scholar]
- 80.Liu Q et al. Discovery of 9-(6-aminopyridin-3-yl)-1-(3-(trifluoromethyl)phenyl)benzo[h][1,6]naphthyridin-2( 1H)-one (Torin2) as a potent, selective, and orally available mammalian target of rapamycin (mTOR) inhibitor for treatment of cancer. J Med Chem 54, 1473–1480, doi: 10.1021/jm101520v (2011). [DOI] [PMC free article] [PubMed] [Google Scholar]
- 81.Liu Q et al. Selective ATP-competitive inhibitors of TOR suppress rapamycin-insensitive function of TORC2 in Saccharomyces cerevisiae. ACS Chem Biol 7, 982–987, doi: 10.1021/cb300058v (2012). [DOI] [PMC free article] [PubMed] [Google Scholar]
- 82.Hsieh AC et al. The translational landscape of mTOR signalling steers cancer initiation and metastasis. Nature 485, 55–61, doi: 10.1038/nature10912 (2012). [DOI] [PMC free article] [PubMed] [Google Scholar]
- 83.Liu Q et al. Kinome-wide selectivity profiling of ATP-competitive mammalian target of rapamycin (mTOR) inhibitors and characterization of their binding kinetics. J Biol Chem 287, 9742–9752, doi: 10.1074/jbc.M111.304485 (2012). [DOI] [PMC free article] [PubMed] [Google Scholar]
- 84.Liu Q et al. Characterization of Torin2, an ATP-competitive inhibitor of mTOR, ATM, and ATR. Cancer Res 73, 2574–2586, doi: 10.1158/0008-5472.CAN-12-1702 (2013). [DOI] [PMC free article] [PubMed] [Google Scholar]
- 85.Montane MH & Menand B ATP-competitive mTOR kinase inhibitors delay plant growth by triggering early differentiation of meristematic cells but no developmental patterning change. J Exp Bot 64, 4361–4374, doi: 10.1093/jxb/ert242 (2013). [DOI] [PMC free article] [PubMed] [Google Scholar]
- 86.Pearce LR et al. Characterization of PF-4708671, a novel and highly specific inhibitor of p70 ribosomal S6 kinase (S6K1). Biochem J 431, 245–255, doi: 10.1042/BJ20101024 (2010). [DOI] [PubMed] [Google Scholar]
Associated Data
This section collects any data citations, data availability statements, or supplementary materials included in this article.
Supplementary Materials
Data Availability Statement
Sequencing data are deposited to the Gene Expression Omnibus (accession no. GSE161807). All other data of this manuscript are presented in the main text or in the supplementary materials (uncropped blots and gel images and source data behind all graphs). The sequences of proteins were obtained from TAIR (https://www.arabidopsis.org/) and NCBI (https://www.ncbi.nlm.nih.gov/). The 3D protein structures were predicted by RaptorX (http://raptorx.uchicago.edu//). The pCambia-PUP-IT vector was deposited to Addgene (#186478). The plasmids and the transgenic Arabidopsis seeds generated in this study are available upon request.