Abstract
Purpose
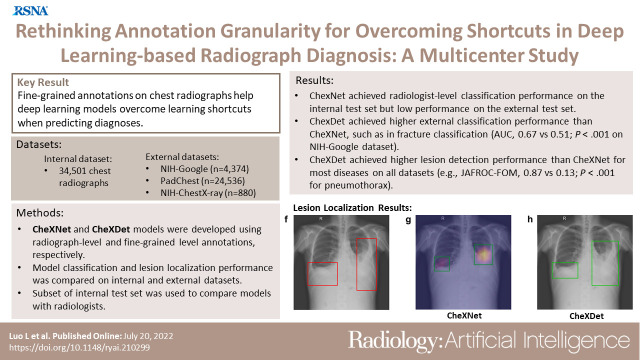
To evaluate the ability of fine-grained annotations to overcome shortcut learning in deep learning (DL)–based diagnosis using chest radiographs.
Materials and Methods
Two DL models were developed using radiograph-level annotations (disease present: yes or no) and fine-grained lesion-level annotations (lesion bounding boxes), respectively named CheXNet and CheXDet. A total of 34 501 chest radiographs obtained from January 2005 to September 2019 were retrospectively collected and annotated regarding cardiomegaly, pleural effusion, mass, nodule, pneumonia, pneumothorax, tuberculosis, fracture, and aortic calcification. The internal classification performance and lesion localization performance of the models were compared on a testing set (n = 2922); external classification performance was compared on National Institutes of Health (NIH) Google (n = 4376) and PadChest (n = 24 536) datasets; and external lesion localization performance was compared on the NIH ChestX-ray14 dataset (n = 880). The models were also compared with radiologist performance on a subset of the internal testing set (n = 496). Performance was evaluated using receiver operating characteristic (ROC) curve analysis.
Results
Given sufficient training data, both models performed similarly to radiologists. CheXDet achieved significant improvement for external classification, such as classifying fracture on NIH Google (CheXDet area under the ROC curve [AUC], 0.67; CheXNet AUC, 0.51; P < .001) and PadChest (CheXDet AUC, 0.78; CheXNet AUC, 0.55; P < .001). CheXDet achieved higher lesion detection performance than CheXNet for most abnormalities on all datasets, such as detecting pneumothorax on the internal set (CheXDet jackknife alternative free-response ROC [JAFROC] figure of merit [FOM], 0.87; CheXNet JAFROC FOM, 0.13; P < .001) and NIH ChestX-ray14 (CheXDet JAFROC FOM, 0.55; CheXNet JAFROC FOM, 0.04; P < .001).
Conclusion
Fine-grained annotations overcame shortcut learning and enabled DL models to identify correct lesion patterns, improving the generalizability of the models.
Keywords: Computer-aided Diagnosis, Conventional Radiography, Convolutional Neural Network (CNN), Deep Learning Algorithms, Machine Learning Algorithms, Localization
Supplemental material is available for this article
© RSNA, 2022
Keywords: Computer-aided Diagnosis, Conventional Radiography, Convolutional Neural Network (CNN), Deep Learning Algorithms, Machine Learning Algorithms, Localization
Summary
Fine-grained annotations (ie, lesion bounding boxes) help chest radiograph diagnosis models overcome learning shortcuts by enabling the models to identify the correct lesion areas, leading to significantly improved radiograph-level classification performance.
Key Points
■ A deep learning model trained with chest radiograph–level annotations (CheXNet) achieved radiologist-level performance on the internal testing set, such as achieving an area under the receiver operating characteristic (ROC) curve (AUC) of 0.93 in classifying fracture but made decisions from regions other than the true signs of the diseases, leading to dramatically degraded external performance for external test.
■ A deep learning model trained with fine-grained lesion-level annotations (CheXDet) also achieved radiologist-level performance on the internal testing set, with significant improvement for external performance, such as in classifying fractures on the National Institutes of Health (NIH) Google dataset (CheXDet AUC, 0.67; CheXNet AUC, 0.51; P < .001) and on the PadChest dataset (CheXDet AUC, 0.78; CheXNet AUC, 0.55; P < .01).
■ CheXDet achieved higher lesion localization performance than CheXNet for most abnormalities on all datasets, such as in detecting pneumothorax on the internal testing sets (CheXDet jackknife alternative free-response ROC [JAFROC] figure of merit [FOM], 0.87; CheXNet JAFROC FOM, 0.13; P < .001) and the external NIH ChestX-ray14 dataset (CheXDet JAFROC FOM, 0.55; CheXNet JAFROC FOM, 0.04; P < .001).
Introduction
As a driving force of the current technological transformation, robust and trustworthy artificial intelligence is in greater need than ever. Despite achieving expert-level accuracies on many disease-screening tasks (1–9), deep learning (DL)–based (10) artificial intelligence models can make correct decisions for the wrong reasons (11–13) and demonstrate considerably degraded performance when applied to external data (13–15). This phenomenon is referred to as "shortcut learning" (16), wherein deep neural networks unintendedly learned dataset biases (17) to fit the training data quickly. Specifically, dataset biases are the patterns that frequently co-occurred with the target disease and are more easily recognized than the true disease signs (18). Although widely adopted DL diagnosis models are often developed with image-level binary annotations (with “1” indicating the presence and "0" indicating the absence of disease), such spurious correlations could be captured by the DL model to fit the training data quickly (11,19). For example, previous studies have found that DL-based classification models could rely on hospital tokens (see examples in Figure E1 [supplement]) to decide whether a chest radiograph contains pneumonia, fracture, or even COVID-19 lesions (12,13,20), leading to concerns about the credibility of the DL models.
A possible way to alleviate shortcut learning is enlarging the learned distribution of the model by incorporating more training data (15,20). Previous works have also proposed using annotations, such as bounding boxes of objects to constrain the DL models to learn from targeted regions (12,21,22). However, several questions are yet to be explored: Would increasing training data always lead to a better disease classification model? Could fine-grained annotations alleviate shortcut learning and substantially improve the DL models? More important, does overcoming shortcut learning help improve the generalizability of DL models on multicenter data?
In this study, we developed a classification model using radiograph-level annotations (CheXNet [4]) and a detection model using lesion-level annotations (CheXDet) for an extensive comparison on the tasks of disease classification and lesion detection. We aimed to investigate the ability of fine-grained annotations on chest radiographs to improve DL model–based diagnosis.
Materials and Methods
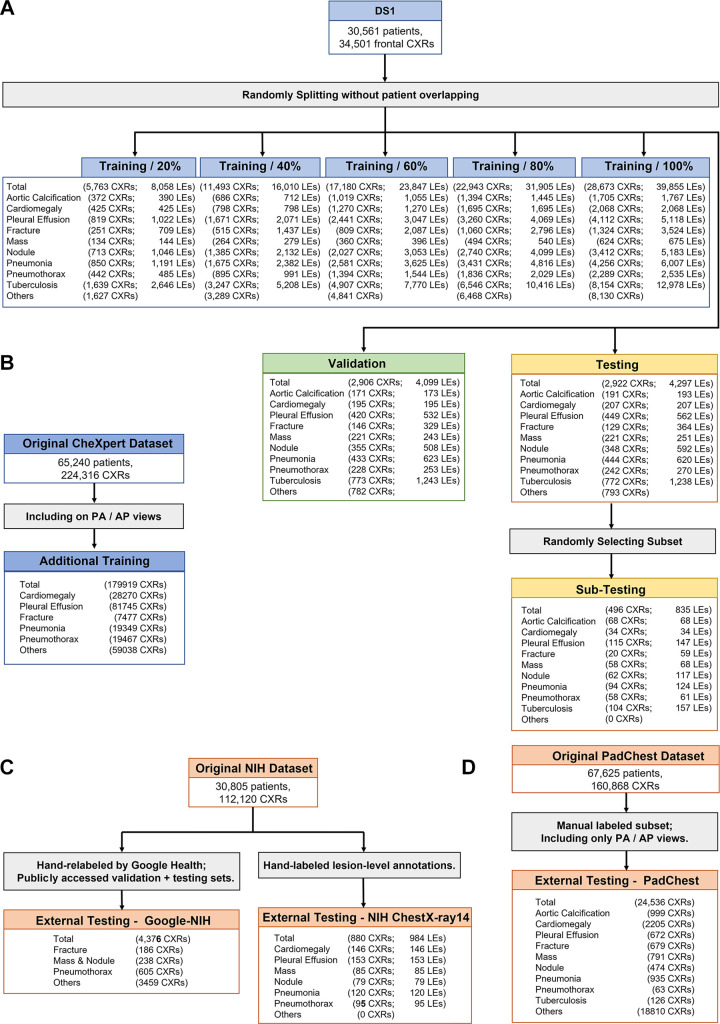
This retrospective study was approved by the institutional ethical committee (approval no. YB-2021–554). The requirement for individual patient consent was waived, and all data from the institution were de-identified. Other data used for additional training or testing were publicly available. Figure 1 illustrates the construction and splitting of all datasets. This study followed the Standards for Reporting of Diagnostic Accuracy reporting guideline.
Figure 1:
Flowchart of images used from different cohorts. (A) Split of dataset 1 (DS1), where five training sets containing different numbers of images and lesions were used for developing different versions of the models, a tuning set was used to select the best models, and a testing set was used for final evaluation. A subset was further randomly selected from the testing set for comparing the deep learning models with radiologists. (B) Frontal chest radiographs (CXRs) from the original CheXpert dataset were used as the additional training data. (C) Two subsets from the original National Institutes of Health (NIH) dataset were used for external testing. (D) The manually labeled posterior-anterior (PA) and anterior-posterior (AP) views from the PadChest dataset were used for external testing. LEs = lesions.
Construction of Internal Dataset
We retrospectively collected 34 501 frontal-view chest radiographs and corresponding text reports of 30 561 patients from the clinical picture archiving and communication system from January 1, 2005, to September 31, 2019. This dataset is referred to as dataset 1 (DS1), in which each radiograph was labeled “yes” or “no” for presence of nine diseases (cardiomegaly, pleural effusion, mass, nodule, pneumonia, pneumothorax, tuberculosis, fracture, and aortic calcification) and each contained bounding boxes (ie, fine-grained annotations) of the corresponding lesions. The radiographs were split into three different sets for training (n = 28 673), tuning (n = 2906), and internal testing (n = 2922) without overlapping of patients. To assess the influence of the training data scale, we developed several different versions of the models using random samples containing 20% (n = 5763), 40% (n = 11 493), 60% (n = 17 180), 80% (n = 22 943), and 100% of the training set. In addition, a subset (n = 496) was randomly sampled from the internal testing set to compare the performance between the models and radiologists.
Ground Truth Labeling of DS1
For each radiograph in DS1, two readers were assigned for ground truth labeling from a cohort of 10 radiologists (with 4–30 years of experience in general radiology). The chest radiographs and text reports were provided to the readers to label the mentioned pathologic findings and bounding boxes of the lesions. The radiologists’ consensus with the text report was considered as the ground truth. For annotations of lesion bounding boxes, disagreements between the two readers were reviewed by another senior radiologist (with at least 20 years of experience) from the cohort who made the final decision. These readers were not further involved in evaluation of model performance. All readers were provided with a graphical user interface–based annotation infrastructure. All images were kept the same size as their original Digital Imaging and Communications in Medicine format. The readers could zoom in and out using the software and change the window settings of the images, and images were viewed using monitors with resolutions equivalent to those used in clinical reporting. All readers were provided with the same guidelines for the annotation software and rules.
External Testing Datasets and Additional Training Data
Three publicly available datasets were used for external testing: (a) the National Institutes of Health (NIH) Google dataset: a subset from the original NIH ChestX-ray14 database (23) containing 4376 frontal chest radiographs; each radiograph was labeled with “yes” or “no” findings of airspace opacity, fracture, mass or nodule, or pneumothorax by at least three radiologists from Google Health (7), and the latter three classes overlapped with those in DS1; (b) the PadChest dataset: a subset from the original PadChest (24) was used, containing 24 536 frontal radiographs labeled by trained physicians at the radiograph level; PadChest contained all nine classes in DS1; and (c) the NIH ChestX-ray14 dataset: 880 frontal chest radiographs with bounding-box annotations of lesions hand labeled by a board-certified radiologist were used, in which six diseases (cardiomegaly, pleural effusion, nodule, mass, pneumonia, and pneumothorax) overlapped with the annotations from DS1.
Moreover, to evaluate whether increasing training data led to better performance for CheXNet (4), 179 919 frontal chest radiographs from the CheXpert dataset (25) were included as additional training data. This dataset was automatically annotated at the radiograph level with text reports by a natural language processing algorithm.
Implementation of CheXNet and CheXDet
CheXNet is a 121-layer, densely connected network (DenseNet-121) (26), which was trained with radiograph-level annotations to predict existence of the nine diseases (Fig E2 [supplement]). CheXNet contained four dense blocks, in which the features from every shallow layer were concatenated and fed into the deeper layers for better gradient backpropagation. A convolutional layer and a pooling layer were appended after each dense block to conduct dimension reduction. The original output layer (1000-way softmax) of DenseNet-121 was replaced with a nine-way sigmoid layer (nine neurons, each of which was tailed with a sigmoid function to output disease probability).
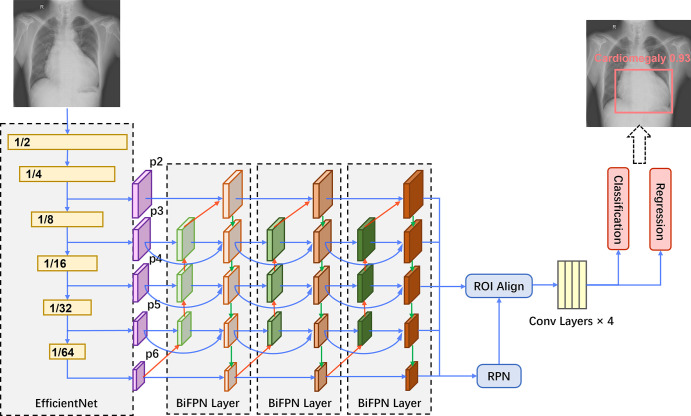
CheXDet is a two-stage object detection network trained with lesion-level annotations to output lesion bounding boxes and the disease probabilities of suspected abnormal regions (Fig 2). In brief, CheXDet used EfficientNet (27) as the feature extractor and three bidirectional feature pyramid network (28) layers for feature aggregation and enrichment. The bidirectional feature pyramid network features were further fed into a region proposal network (29) module and a region of interest alignment module (30) for object proposal generation. The proposal features were further fed into four convolutional layers, and two fully connected layers were then used to conduct classification and bounding-box regression based on the proposals, respectively.
Figure 2:
CheXDet architecture. An EfficientNet backbone is used for feature extraction, which also downsamples the data in width and height. The multiscale features (ie, p2, p3, p4, p5, and p6) are then fed into three bidirectional feature pyramid network (BiFPN) layers for information aggregation and enrichment. The bidirectional feature pyramid network introduces top-down feature aggregation (red arrows), bottom-up feature aggregation (green arrows), and feature aggregation from the same scales (blue arrows). Next, a region proposal network (RPN) module and a region of interest (ROI) alignment module are used to generate bounding-box proposals based on the bidirectional feature pyramid network features. The proposal features are further fed into four convolutional (conv) layers. Finally, two fully connected layers conduct classification and regression based on the proposals, respectively, and generate the predictions.
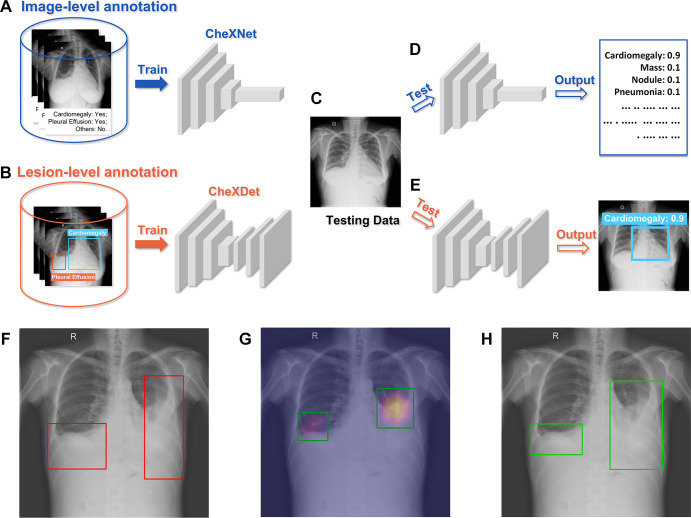
Five versions of CheXNet and CheXDet were developed with 20%, 40%, 60%, 80%, and 100% of DS1 training data. For simplicity, we use subscripts in model names to indicate how much data were used to develop the model (eg, CheXDet20 indicates the CheXDet model developed with 20% of the training data). Moreover, we developed another version of CheXNet with training data from both DS1 and CheXpert, and this model is indicated as CheXNet100+. All hyperparameters of the models were tuned on the tuning set (see the details in sections 2.1 and 3.1 of Appendix E1 [supplement]). Figure 3 illustrates the brief training and testing processes of CheXNet and CheXDet. More details of the development processes for the two models can be found in sections 2 and 3 of Appendix E1 (supplement).
Figure 3:
Training-testing flows of CheXNet and CheXDet. (A) CheXNet is trained with radiograph-level annotations that indicate whether specific diseases exist on the whole radiograph. (B) CheXDet is trained with lesion-level annotations that further point out the exact locations of lesions with bounding boxes. (C) A testing chest radiograph. (D) CheXNet predicts the probabilities of each abnormality. (E) CheXDet could identify the lesion regions with corresponding disease scores. (F) Another testing image with pleural effusion lesions bounded in the red boxes. (G) The localization results were given by CheXNet using the class activation map method, which is widely adopted by researchers to interpret the results of a deep classification model. Lighter color indicates a higher probability of abnormality found by CheXNet. The top 40% pixels on the heatmaps are bounded by the green boxes as the final localization results. (H) The localization results given by CheXDet are indicated with green boxes.
Data Preprocessing
The original DS1 chest radiographs were gray-scale UNIT16 images in Digital Imaging and Communications in Medicine format. The chest radiographs went through several preprocessing steps before being used to train the DL models. We first calculated the mean and variance of each chest radiograph and clipped the range of intensity values into [mean – 3 × variance, mean + 3 × variance] to reduce the outlier points. Each image was then normalized to have zero mean and unit variance. The radiographs from datasets other than DS1 were directly normalized to have an intensity range of zero mean and unit variance.
We concatenated three copies of one chest radiograph to construct three-dimensional inputs for the DL models. For CheXNet, the input chest radiographs were linearly scaled into [0, 1] and resized to 512 × 512 pixels. For CheXDet, the global mean and variance computed from ImageNet (31) were used for final normalization, and the input images were resized to 768 × 768 pixels. For data augmentation, we randomly flipped the input images horizontally to enrich the training data.
Model Evaluation and Comparison
To study shortcut learning and the effect of fine-grained annotations, we evaluated CheXNet and CheXDet performance in two tasks: disease classification and lesion localization.
For the disease classification task, we compared performance on the internal testing set between CheXNet and CheXDet with varying numbers of training data. We also compared CheXNet100+ with CheXNet100 to validate whether incorporating additional training data improves classification performance. On the testing subset, we compared CheXNet100 and CheXDet100 with three radiologists (with 4, 13, and 19 years of experience in chest radiology, respectively; they were not the original chest imagers and were not involved in the ground truth labeling). For the lesion detection task, we compared CheXNet100 with CheXDet20, CheXDet40, CheXDet60, CheXDet80, and CheXDet100.
To investigate whether the models could achieve acceptable performance (eg, performance similar to that of the radiologists), we compared CheXNet100 and CheXDet100 with the three radiologists mentioned before. These radiologists were asked to independently classify the radiographs from the testing subset given only the image data. Readers’ performance was reported in sensitivities and specificities for each disease. More details of the reader study process can be found in section 1 of Appendix E1 (supplement).
If shortcut learning was alleviated, the model would learn more precise features for the diseases, improving their generalizability for external testing. Therefore, disease classification performance of CheXNet100, CheXNet100+, CheXDet20, and CheXDet100 were evaluated on NIH Google and PadChest. Note that NIH Google contains a class “Mass or Nodule,” which treats nodule and mass as the same class. We thus took the maximum prediction between the two classes, mass and nodule, to be a single probability for the class “Mass or Nodule.” External lesion localization performance of CheXNet100, CheXDet20, and CheXDet100 was evaluated on the NIH ChestX-ray14 dataset. Although the external datasets did not cover all diseases studied in DS1, we reported performance on the classes that overlapped with those used in DS1.
Evaluation Metrics and Statistical Analysis
To evaluate the disease classification performance, we used the area under the receiver operating characteristic (ROC) curve (AUC). We used the DeLong test (32) to compute the 95% CIs and P values for the ROC curves. CheXNet generates radiograph-level probabilities for each disease, and the AUCs could hence be directly computed. CheXDet outputs multiple bounding boxes with disease probabilities for each image, and we took the maximum probability among every box as the radiograph-level prediction and computed the AUCs.
To evaluate the lesion localization performance, we used the weighted alternative free-response ROC as the figures of merit (FOMs) by jackknife alternative free-response ROC (JAFROC) (version 4.2.1; https://github.com/dpc10ster/WindowsJafroc). We performed the 95% CI computation and significance test for JAFROC FOMs, applying the Dorfman-Berbaum-Metz model with the fixed-case, random-reader method (33). For CheXDet, we filtered out the generated bounding boxes with a threshold wherein the summation of sensitivity and specificity was the highest, and the remaining bounding boxes were used to compute the JAFROC of CheXDet. For CheXNet, we thresholded the heatmaps generated by the gradient-weighted class activation map (hereafter, Grad-CAM [34]) and obtained the connected components as the detection results. A predicted bounding box would be regarded as a true positive if the intersection over union with a ground truth bounding box was greater than 0.5. The generated bounding boxes were then used to compute the JAFROC of CheXNet. More details for obtaining lesion-level results of CheXNet are in section 2.2 of Appendix E1 (supplement).
All statistical tests were two sided. All the measurements and statistical analyses were done using R software, version 3.6.0 (35). We reported P values after adjustment with the Benjamini-Hochberg procedure (36) to control the false discovery rate for multiple testing, and we considered a postadjusted P < .05 to indicate a statistically significant difference.
Data Availability
The code used in this study can be acquired upon reasonable request from the corresponding author (H.C.).
Results
Summary of Datasets
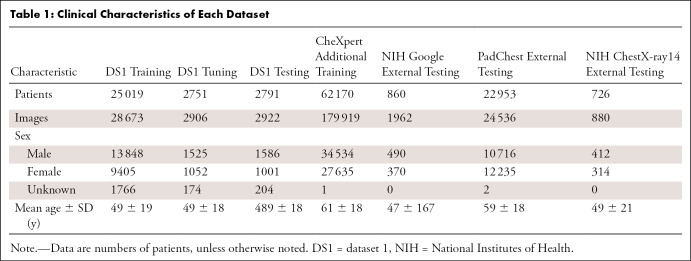
For DS1, the mean ± SD for patient age was 49 years ± 19; there were 16 959 men, 11 458 women, and 2144 patients for whom sex was unknown. The detailed characteristics of all the datasets are summarized in Table 1.
Table 1:
Clinical Characteristics of Each Dataset
Comparison of Internal Disease Classification Performance on DS1
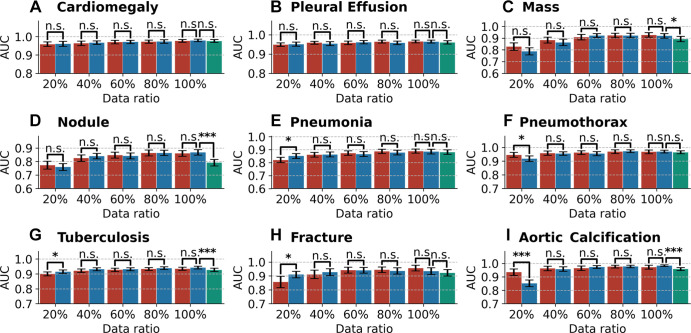
Figure 4 illustrates the AUCs with 95% CIs of the different models on the internal testing set. AUC, sensitivity, and specificity values of each model are given in Table E1 (supplement).
Figure 4:
Bar plots with error bars show disease classification performance of models on the internal testing set under different ratios of training data. Blue bars represent the areas under the receiver operating characteristic curve (AUCs) with 95% CIs for CheXNet, red bars represent AUCs with 95% CIs for CheXDet, and green bars represent AUCs with 95% CIs for CheXNet trained with additional data from CheXpert dataset. Under many scenarios, CheXDet and CheXNet achieve similar performance without evidence of a difference on the internal disease classification task. Whiskers represent the 95% CIs. n.s. = not significant. * represents P < .05, *** represents P < .001.
Given the same amount (at least 40%) of training data, there were no statistically significant differences (P > .05) between performance of CheXNet and CheXDet. To investigate whether the failure cases of CheXDet were also failures of CheXNet, we compared the false-positives and false-negatives of CheXNet100 and CheXDet100. Among the false-positives of CheXDet, for cardiomegaly, effusion, mass, nodule, pneumonia, pneumothorax, tuberculosis, fracture, and aortic calcification, there were 69.4% (154 of 222), 66.3% (134 of 202), 40.8% (142 of 348), 51.5% (234 of 454), 66.9% (368 of 550), 55.5% (106 of 191), 54.4% (160 of 294), 39.4% (117 of 297), and 38.9% (82 of 211) of samples that were also the false-positives of CheXNet, respectively. Among the false-negatives of CheXDet, for cardiomegaly, effusion, mass, nodule, pneumonia, pneumothorax, tuberculosis, fracture, and aortic calcification, there were 66.7% (eight of 12), 57.1% (32 of 56), 60.6% (20 of 33), 50.0% (46 of 92), 54.9% (39 of 71), 55.0% (11 of 20), 72.3% (68 of 94), 25.0% (three of 12), and 77.8% (seven of nine) of samples that were also the false-negatives of CheXNet, respectively.
With only 20% of the training data, CheXNet20 achieved higher performance than CheXDet20 in classifying pneumonia (AUC, 0.85 vs 0.82; P < .05), tuberculosis (AUC, 0.91 vs 0.90; P < .05), and fracture (AUC, 0.91 vs 0.86; P < .05) but lower performance than CheXDet20 in classifying pneumothorax (AUC, 0.92 vs 0.95; P < .05) and aortic calcification (AUC, 0.85 vs 0.94; P < .001).
CheXNet100+ trained with 100% of DS1 plus additional CheXpert data showed lower performance in classifying four of nine diseases than CheXNet100, including mass (P < .05), nodule (P < .001), tuberculosis (P < .001), and aortic calcification (P < .001). In classifying the other five diseases, CheXNet100+ showed no evidence of a difference compared with CheXNet100.
Comparison of DL Models with Radiologists on DS1
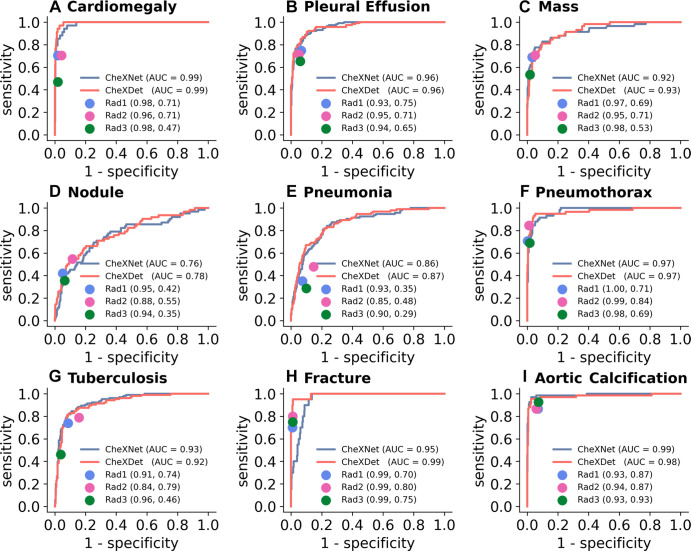
Figure 5 illustrates the performance of the three radiologists and the ROC curves of CheXNet100 and CheXDet100 on the testing subset. The radiologists showed high specificities for classifying all the diseases, with trade-offs on sensitivities. All the points representing individual experts lie on or near to the right of the ROC curves of the models, indicating thresholds where the models performed on par with or better than radiologists.
Figure 5:
Comparison of radiograph-level abnormality classification performance among models and radiologists on the testing subset. Blue curves represent receiver operating characteristic (ROC) curves of CheXNet. Red curves represent ROCs of CheXDet. The performance levels of the radiologists (Rad) are represented as single points. Radiologist performance is reported in parentheses as (specificity, sensitivity). Almost all the points representing individual radiologists lie on or under the ROC of one of the models, which means there exist thresholds where at least one model performs on par with or better than practicing radiologists. AUC = area under the ROC curve.
Comparison of External Classification Performance on NIH Google
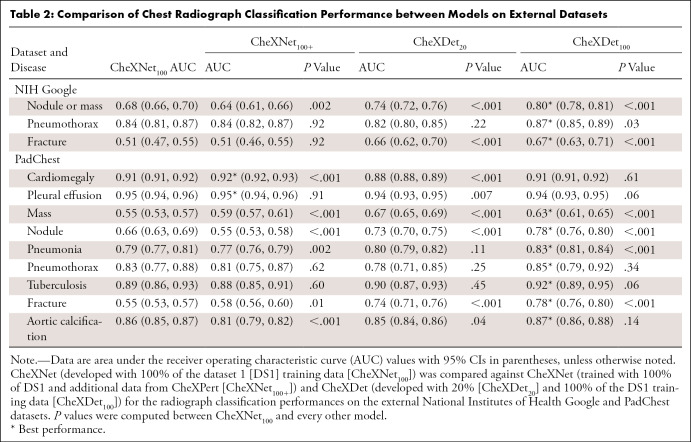
Table 2 reports the AUCs with CIs for CheXNet100, CheXNet100+, CheXDet20, and CheXDet100, as well as the P values for comparisons with CheXNet100 on NIH Google. CheXNet100+ showed considerably lower performance than CheXNet100 on classifying nodule or mass (P < .001) on this external set; in contrast, there was no evidence of a difference for pneumothorax and fracture classification between these two models. CheXDet20 and CheXDet100 achieved higher performance than CheXNet100 on classifying nodule or mass (P < .001) and fracture (P < .001), and CheXDet100 also showed higher AUC on classifying pneumothorax (P < .05) than CheXNet100.
Table 2:
Comparison of Chest Radiograph Classification Performance between Models on External Datasets
Comparison of External Classification Performance on PadChest
Table 2 also reports the AUCs with CIs for CheXNet100, CheXNet100+, CheXDet20, and CheXDet100, as well as P values for comparisons with CheXNet100 on PadChest.
CheXNet100+ showed higher performance on cardiomegaly (P < .001), mass (P < .001), and fracture classification (P < .05) but lower performance on nodule (P < .001), pneumonia (P < .01), and aortic calcification (P < .001) compared with CheXNet100. There was no evidence of differences between these two models in classifying pleural effusion, pneumothorax, and tuberculosis.
CheXDet20 achieved higher performance than CheXNet100 on mass (P < .001), nodule (P < .001), and fracture classification (P < .001) and lower performance on classification of cardiomegaly (P < .001), pleural effusion (P < .01), and aortic calcification (P < .05). There was no evidence of a difference in model performance for classifying pneumonia, pneumothorax, and tuberculosis.
With the same amount of training data, CheXDet100 achieved higher AUCs than CheXNet100 in classifying four of nine diseases, including mass (P < .001), nodule (P < .001), pneumonia (P < .001), and fracture (P < .001). CheXDet100 and CheXNet100 demonstrated no evidence of a difference in cardiomegaly, pleural effusion, pneumothorax, tuberculosis, and aortic calcification classification.
Comparison of Internal Lesion Detection Performance on DS1
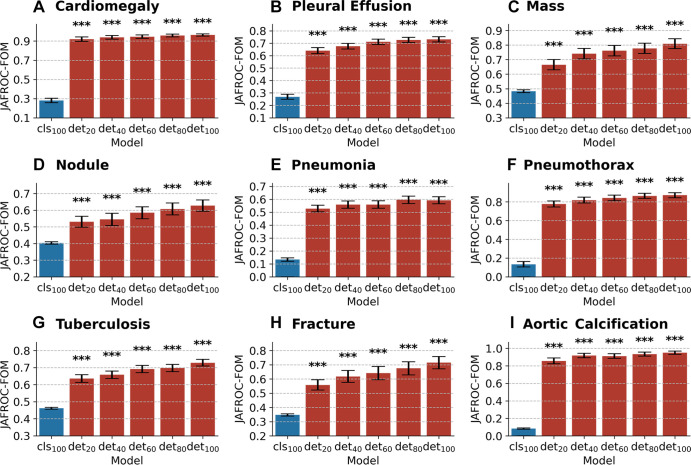
Figure 6 illustrates the JAFROC FOMs with 95% CIs for CheXNet100, CheXDet20, CheXDet40, CheXDet60, CheXDet80, and CheXDet100, as well as P values, compared against CheXNet100 on the internal testing set. Here, we compared CheXDet developed with 20%, 40%, 60%, 80%, and 100% training data against CheXNet trained with 100% data. The JAFROC FOMs of CheXDet on each disease increased progressively by about 10% when the amount of training data increased from 20% to 100%. In all scenarios and for all diseases, CheXDet achieved higher performance (P < .001) than CheXNet, even when developed with only 20% of training data. Specific statistics of JAFROC FOMs with CIs of different models can be found in Table E2 (supplement).
Figure 6:
Bar plots with error bars show comparison of lesion detection performance among models on the internal testing set. CheXNet developed with 100% data (cls100) is compared against CheXDet developed with different ratios of data (det20, det40, det60, det80, and det100; subscripts denote ratios of training data). Blue bars represent jackknife alternative free-response receiver operating characteristic (JAFROC) figures of merit (FOMs) with 95% CIs of CheXNet, and red bars represent JAFROC FOMs with 95% CIs of CheXDet. Whiskers represent the 95% CIs. CheXDet performs higher than CheXNet on the internal lesion detection task, even when trained with 20% of the data. *** represents P < .001.
Comparison of External Lesion Detection Performance on NIH ChestX-ray14
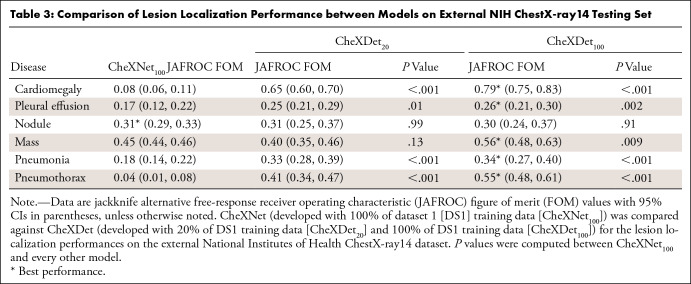
Table 3 shows the JAFROC FOMs with 95% CIs for CheXNet100, CheXDet20, and CheXDet100, as well as P values compared against CheXNet100 on NIH ChestX-ray14. CheXDet20 trained with only 20% data also showed apparently higher JAFROC FOMs than CheXNet100 on four of six diseases, including cardiomegaly (P < .001), pleural effusion (P < .05), pneumonia (P < .001), and pneumothorax (P < .001). There was no evidence of differences between CheXDet20 and CheXNet100 on localizing nodule and mass.
Table 3:
Comparison of Lesion Localization Performance between Models on External NIH ChestX-ray14 Testing Set
With increased training data, CheXDet100 achieved higher performance on five of six types of lesions, including cardiomegaly (P < .001), pleural effusion (P < .01), mass (P < .01), pneumonia (P < .001), and pneumothorax (P < .001) than CheXNet100, with no evidence of a difference between CheXDet100 and CheXNet100 on nodule detection.
Discussion
In this study, we developed CheXNet and CheXDet and focused on evaluating the models from two aspects, following the recommended shortcut learning evaluation practice (16,17): whether the models attend to the lesion regions and whether the models generalize well for external testing. Existing works have reported shortcut learning in artificial intelligence for medical image diagnosis (13,20), yet, to our knowledge, few of them have tried to quantify or tackle this challenge. We provided a possible solution to make DL models right for the right reasons, which could substantially improve external performance.
Our study showed that for internal testing, incorporating additional training data from CheXpert led to a considerable performance drop on four of nine diseases. One possible reason is that CheXpert dominated the training set and made CheXNet100+ fit on a different distribution from the original distribution of DS1, as the CheXpert dataset is labeled by natural language processing and has a much older participant pool. These observations suggest that incorporating more training data does not always benefit the classification accuracy for DL models and alternative solutions should be sought. On the other hand, CheXDet mainly showed no evidence of differences in internal disease classification compared with CheXNet when given the same amount (at least 40%) of training data from DS1.
Generalizability on external datasets is crucial for determining whether a DL system can be applied to real-world clinical use. Existing works have proposed solutions that focused on increasing the diversity of the training data (eg, with data augmentation techniques or training with multicenter data) (37). Here, we demonstrated that fine-grained annotations significantly improved the generalizability of the DL model on chest radiographs from new centers (ie, NIH Google and PadChest), without training the models with multicenter data. Specifically, CheXDet could achieve higher external performance than CheXNet100+ without loss of accuracies on the internal data. When both were developed by all training data from DS1, CheXDet100 also outperformed CheXNet100 for all three diseases on NIH Google and four of nine diseases on PadChest without degraded performance on other diseases. Moreover, for small lesions without fixed positions, such as nodules, masses, and fractures, even CheXDet20 performed higher than CheXNet100, despite being developed with only 20% of the training data. Of note, these findings suggest that DL models developed with fine-grained lesion annotations are more generalizable to external data.
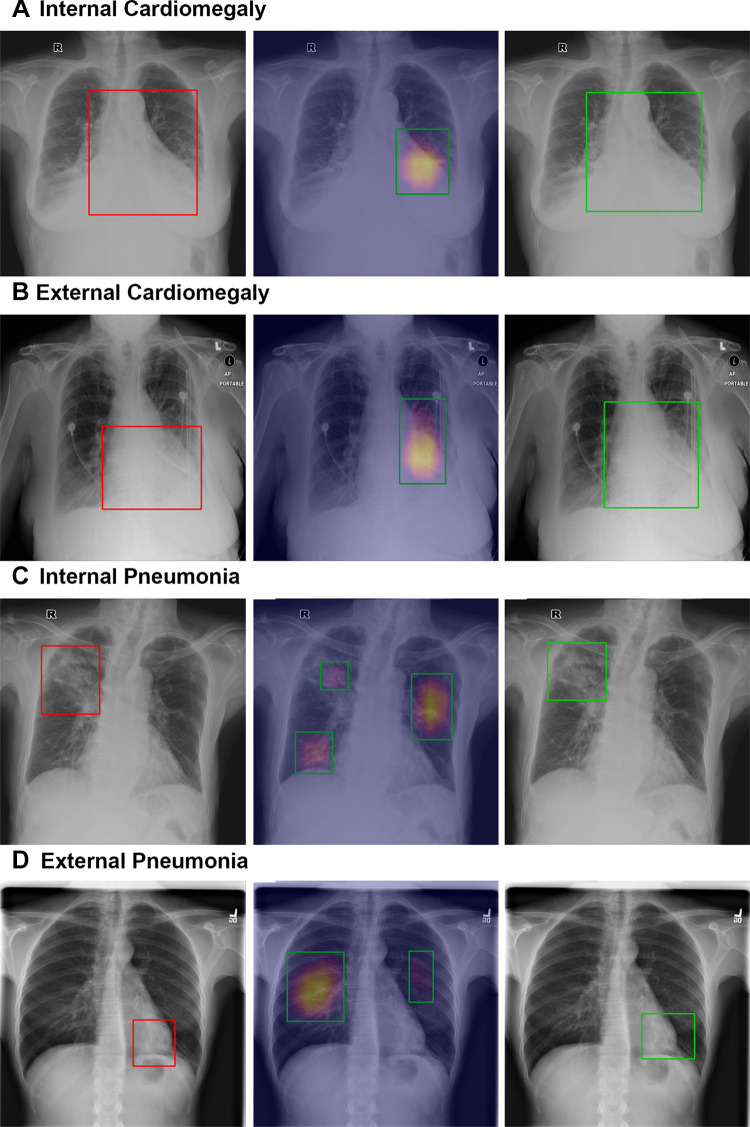
Because Grad-CAM has been widely adopted in many previous works to show that CheXNet could identify correct disease signs, we quantified the disease localization capability of CheXNet and CheXDet. Our data revealed that CheXNet relies highly on patterns other than the true pathologic signs to make decisions, as it showed low performance in finding the lesions but achieved radiologist-level internal classification results. Apart from providing quantitative comparison, we present some sample detection results of CheXNet100 and CheXDet100 in Figure 7. For internal data, it can be observed that CheXNet’s Grad-CAM might not precisely cover the intended lesions (Fig 7A) and sometimes even attend to false-positive regions (Fig 7C). Moreover, CheXNet might then use incorrect patterns to make decisions for the external data (Fig 7B, 7D). The degraded lesion detection performance and external classification performance of CheXNet, together with the visualization results, demonstrated that a DL model trained with radiograph-level annotations is prone to shortcut learning (ie, using unintended patterns for decision-making). Worse yet, such a model achieved performance similar to that of radiologists on the internal testing subset, as shown in Figure 5. On the basis of these results, the claim that DL demonstrates performance similar to that of physicians may need further investigation. On the contrary, training with fine-grained annotations enabled CheXDet to focus on the correct pathologic patterns and become more robust to external data and less prone to shortcut learning. Our findings highlight the importance of using fine-grained annotations for developing trustworthy DL-based medical image diagnoses.
Figure 7:
Sample localization results of CheXNet and CheXDet. Qualitative samples of lesion localization results for (A, B) cardiomegaly and (C, D) pneumonia on the (A, C) internal dataset (dataset 1) and (B, D) external set (National Institutes of Health ChestX-ray14). Ground truth with bounding boxes (red, left column), gradient-weighted class activation map generated by CheXNet (middle column), and localization of output of ChexDet (right column) are demonstrated. For gradient-weighted class activation maps, the color overlay indicates a higher probability of abnormality found by CheXNet, and the top 40% pixels on the heatmaps are bounded by the green boxes as the final localization results. CheXDet outputs the correct bounding box for cardiomegaly, outlining the entirety of the heart (same as ground truth labeling), while CheXNet only focuses on the left side of the heart. This was evident on both the internal and external datasets. CheXDet localizes the correct locations for pneumonia changes; CheXNet included nontargeted areas in C, likely due to fibrotic changes, and missed the targeted area entirely in D, instead identifying false-positive areas, which appear normal radiographically.
We acknowledge the limitations of the current work. First, we chose NIH Google, PadChest, and NIH ChestX-ray14 as the external testing sets, which were the few publicly available datasets hand labeled by radiologists. Because some external testing datasets did not obtain the same disease categories as our internal dataset, we could test only the diseases that overlapped with our annotations. Second, according to recent studies (38,39), developing a localization model does not completely address automatic radiograph screening. CheXDet also had failure cases, as shown in the examples from Figure E3 (supplement). Moreover, our results showed that the external performance of CheXDet was not as good as its internal performance. Because this performance drop could imply shortcut learning (16), we believe that CheXDet also experienced shortcut learning but to a lesser degree than CheXNet. Third, fine-grained annotations bring more burden on the labelers. The trade-off between the labor for fine-grained annotations and the improved generalizability thus remains to be explored and elaborated.
To summarize, we showed that a DL model trained with radiograph-level annotations was prone to shortcut learning that used unintended patterns for decision-making for disease detection on chest radiographs. We also showed that fine-grained annotations on chest radiographs improve DL model–based diagnosis, especially when applied to external data, by alleviating shortcut learning and correcting the decision-making regions for the models. We highlighted that successful application of artificial intelligence models to clinical use lies in the annotation granularity in addition to data size and model architecture, which requires further investigation.
Supported by the Key-Area Research and Development Program of Guangdong Province, China (2020B010165004, 2018B010109006), Hong Kong Innovation and Technology Fund (project no. ITS/311/18FP), HKUST Bridge Gap Fund (BGF.005.2021), National Natural Science Foundation of China with project no. U1813204, and Shenzhen-HK Collaborative Development Zone.
Data sharing: Data from NIH-Google were acquired from https://www.kaggle.com/nih-chest-xrays/data, and the annotations of NIH-Google were acquired from https://cloud.google.com/healthcare/docs/resources/public-datasets/nih-chest#additional_labels. Data and annotations of PadChest were obtained from http://bimcv.cipf.es/bimcv-projects/padchest. Data and annotations of NIH-ChestX-ray14 were obtained from https://www.kaggle.com/nih-chest-xrays/data. Retrospective data used in this study from Shenzhen People’s Hospital (DS1 in the manuscript) cannot be released for privacy and safety reasons. The source code used in this study can be available upon reasonable request from the corresponding author (H.C.).
Disclosures of conflicts of interest: L.L. Key-Area Research and Development Program of Guangdong Province, China (2020B010165004, 2018B010109006), Hong Kong Innovation and Technology Fund (project no. ITS/311/18FP), National Natural Science Foundation of China with project no. U1813204, and Shenzhen-HK Collaborative Development Zone. H.C. No relevant relationships. Y.X. No relevant relationships. Y.Z. No relevant relationships. X.W. No relevant relationships. V.V. No relevant relationships. M.W. No relevant relationships. C.H. No relevant relationships. Z.L. No relevant relationships. X.H.B.F. No relevant relationships. E.T. No relevant relationships. H.L. No relevant relationships. P.A.H. Key-Area Research and Development Program of Guangdong Province, China (2020B010165004, 2018B010109006), Hong Kong Innovation and Technology Fund (project no. ITS/311/18FP), National Natural Science Foundation of China with project no. U1813204, and Shenzhen-HK Collaborative Development Zone.
Abbreviations:
- AUC
- area under the ROC curve
- DL
- deep learning
- DS1
- dataset 1
- FOM
- figure of merit
- JAFROC
- jackknife alternative free-response ROC
- NIH
- National Institutes of Health
- ROC
- receiver operating characteristic
References
- 1. Topol EJ . High-performance medicine: the convergence of human and artificial intelligence. Nat Med 2019;25(1):44–56. [DOI] [PubMed] [Google Scholar]
- 2. Ehteshami Bejnordi B , Veta M , Johannes van Diest P , et al. Diagnostic assessment of deep learning algorithms for detection of lymph node metastases in women with breast cancer. JAMA 2017;318(22):2199–2210. [DOI] [PMC free article] [PubMed] [Google Scholar]
- 3. Liu Y , Jain A , Eng C , et al. A deep learning system for differential diagnosis of skin diseases. Nat Med 2020;26(6):900–908. [DOI] [PubMed] [Google Scholar]
- 4. Rajpurkar P , Irvin J , Ball RL , et al. Deep learning for chest radiograph diagnosis: a retrospective comparison of the CheXNeXt algorithm to practicing radiologists. PLoS Med 2018;15(11):e1002686. [DOI] [PMC free article] [PubMed] [Google Scholar]
- 5. Ran AR , Cheung CY , Wang X , et al. Detection of glaucomatous optic neuropathy with spectral-domain optical coherence tomography: a retrospective training and validation deep-learning analysis. Lancet Digit Health 2019;1(4):e172–e182. [DOI] [PubMed] [Google Scholar]
- 6. Hannun AY , Rajpurkar P , Haghpanahi M , et al. Cardiologist-level arrhythmia detection and classification in ambulatory electrocardiograms using a deep neural network. Nat Med 2019;25(1):65–69.[Published correction appears in Nat Med 2019;25(3):530.] [DOI] [PMC free article] [PubMed] [Google Scholar]
- 7. Majkowska A , Mittal S , Steiner DF , et al. Chest radiograph interpretation with deep learning models: assessment with radiologist-adjudicated reference standards and population-adjusted evaluation. Radiology 2020;294(2):421–431. [DOI] [PubMed] [Google Scholar]
- 8. Zhou J , Luo LY , Dou Q , et al. Weakly supervised 3D deep learning for breast cancer classification and localization of the lesions in MR images. J Magn Reson Imaging 2019;50(4):1144–1151. [DOI] [PubMed] [Google Scholar]
- 9. Lin H , Chen H , Wang X , Wang Q , Wang L , Heng PA . Dual-path network with synergistic grouping loss and evidence driven risk stratification for whole slide cervical image analysis. Med Image Anal 2021;69:101955. [DOI] [PubMed] [Google Scholar]
- 10. LeCun Y , Bengio Y , Hinton G . Deep learning. Nature 2015;521(7553):436–444. [DOI] [PubMed] [Google Scholar]
- 11. Badgeley MA , Zech JR , Oakden-Rayner L , et al. Deep learning predicts hip fracture using confounding patient and healthcare variables. NPJ Digit Med 2019;2(1):31. [DOI] [PMC free article] [PubMed] [Google Scholar]
- 12. Huang YJ , Liu W , Wang X , et al. Rectifying supporting regions with mixed and active supervision for rib fracture recognition. IEEE Trans Med Imaging 2020;39(12):3843–3854. [DOI] [PubMed] [Google Scholar]
- 13. Zech JR , Badgeley MA , Liu M , Costa AB , Titano JJ , Oermann EK . Variable generalization performance of a deep learning model to detect pneumonia in chest radiographs: a cross-sectional study. PLoS Med 2018;15(11):e1002683. [DOI] [PMC free article] [PubMed] [Google Scholar]
- 14. Luo L , Yu L , Chen H , et al. Deep mining external imperfect data for chest X-ray disease screening. IEEE Trans Med Imaging 2020;39(11):3583–3594. [DOI] [PubMed] [Google Scholar]
- 15. Cohen JP, Hashir M, Brooks R, Bertrand H. On the limits of cross-domain generalization in automated X-ray prediction. Medical Imaging with Deep Learning, PMLR, 2020;136–155. [Google Scholar]
- 16. Geirhos R , Jacobsen JH , Michaelis C , et al. Shortcut learning in deep neural networks. Nat Mach Intell 2020;2(11):665–673. [Google Scholar]
- 17. Torralba A, Efros AA. Unbiased look at dataset bias. In: Proceedings of the IEEE Conference on Computer Vision and Pattern Recognition,Colorado Springs, Colorado,June 21–23, 2011.Piscataway, NJ:IEEE,2011;1521–1528. [Google Scholar]
- 18. Nam J , Cha H , Ahn S , Lee J , Shin J . Learning from failure: training debiased classifier from biased classifier. arXiv 2007.02561. [preprint]https://arxiv.org/abs/2007.02561. Posted July 6, 2020. Accessed June 17, 2022. [Google Scholar]
- 19. Castro DC , Walker I , Glocker B . Causality matters in medical imaging. Nat Commun 2020;11(1):3673. [DOI] [PMC free article] [PubMed] [Google Scholar]
- 20. DeGrave AJ , Janizek JD , Lee SI . AI for radiographic COVID-19 detection selects shortcuts over signal. Nat Mach Intell 2021;3(7):610–619. [Google Scholar]
- 21. Li K , Wu Z , Peng KC , Ernst J , Fu Y . Guided attention inference network. IEEE Trans Pattern Anal Mach Intell 2020;42(12):2996–3010. [DOI] [PubMed] [Google Scholar]
- 22. Schramowski P , Stammer W , Teso S, et al. Making deep neural networks right for the right scientific reasons by interacting with their explanations. Nat Mach Intell 2020;2(8):476–486. [Google Scholar]
- 23. Wang X, Peng Y, Lu L, Lu Z, Bagheri M, Summers RM. ChestX-Ray8: Hospital-scale chest x-ray database and benchmarks on weakly-supervised classification and localization of common thorax diseases. Proceedings of the IEEE conference on computer vision and pattern recognition,Honolulu, HI,July 21–26, 2017.Piscataway, NJ:IEEE,2017;3462–3471. [Google Scholar]
- 24. Bustos A , Pertusa A , Salinas JM , de la Iglesia-Vayá M . PadChest: a large chest x-ray image dataset with multi-label annotated reports. Med Image Anal 2020;66:101797. [DOI] [PubMed] [Google Scholar]
- 25. Irvin J , Rajpurkar P , Ko M , et al. CheXpert: a large chest radiograph dataset with uncertainty labels and expert comparison. Proc AAAI Conf Artif Intell 2019;33(1):590–597. [Google Scholar]
- 26. Huang G, Liu Z, Van Der Maaten L, Weinberger KQ. Densely connected convolutional networks. In: Proceedings of the IEEE Conference on Computer Vision and Pattern Recognition,Honolulu, Hawaii,July 21-26, 2017.Piscataway, NJ:IEEE,2017;4700–4708. [Google Scholar]
- 27. Tan M , Le Q . EfficientNet: rethinking model scaling for convolutional neural networks. In: International Conference on Machine Learning,Long Beach, California,June 9–15, 2019.New York:Association for Computing Machinery,2019;6105–6114. [Google Scholar]
- 28. Tan M, Pang R, Le QV. EfficientDet: scalable and efficient object detection. In: Proceedings of the IEEE/CVF Conference on Computer Vision and Pattern Recognition,Seattle, Washington, June 13–19,2020.Piscataway, NJ:IEEE,2020;10781–10790. [Google Scholar]
- 29. Ren S, He K, Girshick R, Sun J. Faster R-CNN: towards real-time object detection with region proposal networks. In: Advances in Neural Information Processing Systems,Montreal, Quebec, Canada,December 7–12, 2015.La Jolla, California:Neural Information Processing Systems,2015;91–99. [Google Scholar]
- 30. He K, Gkioxari G, Dollár P, Girshick R. Mask R-CNN. In: Proceedings of the IEEE International Conference on Computer Vision,Venice, Italy,October 22–29, 2017.Piscataway, NJ:IEEE,2017;2961–2969. [Google Scholar]
- 31. Deng J , Dong W , Socher R , Li LJ , Li K , Li FF . Imagenet: a large-scale hierarchical image database. In: 2009 IEEE Conference on Computer Vision and Pattern Recognition,Miami, FL,June 20–25, 2009.Piscataway, NJ:IEEE,2009;248–255. [Google Scholar]
- 32. Sun X , Xu W . Fast implementation of DeLong’s algorithm for comparing the areas under correlated receiver operating characteristic curves. IEEE Signal Process Lett 2014;21(11):1389–1393. [Google Scholar]
- 33. Dorfman DD , Berbaum KS , Metz CE . Receiver operating characteristic rating analysis. Generalization to the population of readers and patients with the jackknife method. Invest Radiol 1992;27(9):723–731. [PubMed] [Google Scholar]
- 34. Selvaraju RR, Cogswell M, Das A, Vedantam R, Parikh D, Batra D. Grad-CAM: visual explanations from deep networks via gradient-based localization. In: Proceedings of the IEEE International Conference on Computer Vision,Venice, Italy,October 22–29, 2017.Piscataway, NJ:IEEE,2017;618–626. [Google Scholar]
- 35. R Core Team. R: A language and environment for statistical computing. Vienna, Austria:R Foundation for Statistical Computing,2021.https://www.R-project.org/. Accessed June 17, 2022. [Google Scholar]
- 36. Benjamini Y , Hochberg Y . Controlling the false discovery rate: a practical and powerful approach to multiple testing. J R Stat Soc Ser B Methodol 1995;57(1):289–300. [Google Scholar]
- 37. Zhou K , Liu Z , Qiao Y , Xiang T , Loy CC . Domain generalization: a survey. arXiv 2103.02503. [preprint] https://arxiv.org/abs/2103.02503. Posted March 3, 2021. Accessed June 17, 2022. [DOI] [PubMed] [Google Scholar]
- 38. Viviano JD , Simpson B , Dutil F , Bengio Y , Cohen JP . Saliency is a possible red herring when diagnosing poor generalization. In: International Conference on Learning Representations,New Orleans, Louisiana,May 6–9, 2021. OpenReview 2021. [Google Scholar]
- 39. Geirhos R , Rubisch P , Michaelis C , Bethge M , Wichmann FA , Brendel W . ImageNet-trained CNNs are biased towards texture; increasing shape bias improves accuracy and robustness. International Conference on Learning Representations,New Orleans, Louisiana,May 6-9, 2021. OpenReview 2019. [Google Scholar]
Associated Data
This section collects any data citations, data availability statements, or supplementary materials included in this article.
Data Availability Statement
The code used in this study can be acquired upon reasonable request from the corresponding author (H.C.).


