Abstract
Purpose
To train a deep natural language processing (NLP) model, using data mined structured oncology reports (SOR), for rapid tumor response category (TRC) classification from free-text oncology reports (FTOR) and to compare its performance with human readers and conventional NLP algorithms.
Materials and Methods
In this retrospective study, databases of three independent radiology departments were queried for SOR and FTOR dated from March 2018 to August 2021. An automated data mining and curation pipeline was developed to extract Response Evaluation Criteria in Solid Tumors–related TRCs for SOR for ground truth definition. The deep NLP bidirectional encoder representations from transformers (BERT) model and three feature-rich algorithms were trained on SOR to predict TRCs in FTOR. Models’ F1 scores were compared against scores of radiologists, medical students, and radiology technologist students. Lexical and semantic analyses were conducted to investigate human and model performance on FTOR.
Results
Oncologic findings and TRCs were accurately mined from 9653 of 12 833 (75.2%) queried SOR, yielding oncology reports from 10 455 patients (mean age, 60 years ± 14 [SD]; 5303 women) who met inclusion criteria. On 802 FTOR in the test set, BERT achieved better TRC classification results (F1, 0.70; 95% CI: 0.68, 0.73) than the best-performing reference linear support vector classifier (F1, 0.63; 95% CI: 0.61, 0.66) and technologist students (F1, 0.65; 95% CI: 0.63, 0.67), had similar performance to medical students (F1, 0.73; 95% CI: 0.72, 0.75), but was inferior to radiologists (F1, 0.79; 95% CI: 0.78, 0.81). Lexical complexity and semantic ambiguities in FTOR influenced human and model performance, revealing maximum F1 score drops of −0.17 and −0.19, respectively.
Conclusion
The developed deep NLP model reached the performance level of medical students but not radiologists in curating oncologic outcomes from radiology FTOR.
Keywords: Neural Networks, Computer Applications–Detection/Diagnosis, Oncology, Research Design, Staging, Tumor Response, Comparative Studies, Decision Analysis, Experimental Investigations, Observer Performance, Outcomes Analysis
Supplemental material is available for this article.
© RSNA, 2022
Keywords: Neural Networks, Computer Applications–Detection/Diagnosis, Oncology, Research Design, Staging, Tumor Response, Comparative Studies, Decision Analysis, Experimental Investigations, Observer Performance, Outcomes Analysis
Summary
Natural language processing models, trained using data mined structured oncology reports, accurately ascertained oncologic outcomes in free-text oncology reports, reaching human-level performance.
Key Points
■ In a retrospective study of 10 455 radiology reports for oncology, accurately mined tumor response categories from 9653 structured oncology reports served as ground truth for natural language processing model building.
■ Trained bidirectional encoder representations from transformers and linear support vector classifier models achieved F1 scores of 0.70 (95% CI: 0.68, 0.73) and 0.63 (95% CI: 0.61, 0.66), respectively, for predicting oncologic outcomes in 802 free-text oncology reports (FTOR), which was comparable to humans from different domains of medical knowledge (mean F1, 0.72; range, 0.65–0.79).
■ Lexical complexity and semantic ambiguities lowered human and model performance, revealing maximum F1 score drops of −0.17 and −0.19 on FTOR, respectively.
Introduction
Natural language processing (NLP) techniques have been steadily evolving over the past years and offer several opportunities for retrieving information traditionally trapped by narrative language in electronic medical records (1). Among these, radiology reports are a valuable source of oncologic data that contain detailed information on patients’ disease status and can provide a longitudinal representation of a patient’s clinical course, which aids therapeutic decision-making and outcome estimation. However, although studies emphasize the use of structured reports, which have the potential to reduce the effort required to extract useful data for further automated analyses, most radiology reports remain composed of prose text (2–4). Accordingly, the extraction of timelines and key clinical end points, such as response to therapy and disease progression, from free-text oncology reports (FTOR) has become a driving factor of NLP development in the oncology field (5–7).
Current NLP methods applied for information retrieval range from traditional rule-based systems (eg, string matching) to feature-rich learners (eg, support vector machines) and newer, high-performing deep learning techniques such as transformer-based pretrained language models (eg, bidirectional encoder representations from transformers [BERT]), which have shown superior performance to classic machine learning in free-text classification tasks (8–11). The advantage of deep learning over rule-based and feature-rich algorithms is the ability to automatically discover convenient abstractions from the raw data required for classification without the need for explicit definition of domain-specific rules prior to data extraction (12). However, the limited availability of a proper sample size of well-annotated data for training and testing of such models remains a major obstacle, usually requiring vast and expensive effort for the curation and annotation process (13). Recently, it has been shown that structured report content created in clinical routine is readily accessible for accurate extraction of radiologic findings and that mined structured report data conform favorably to parameters acquired in dedicated research interpretations by medical expert readers (4). Therefore, radiologic data primarily stored as disaggregated structured reports in the radiology information system may serve as basis for an automated and efficient labeling approach to build ground truth for artificial intelligence algorithm development (13).
This study aimed to exploit the data mining advantages of structured radiology reports (SOR) to train a deep learning NLP model for classifying tumor response categories (TRCs) in FTOR without prior domain-specific feature engineering. The model’s performance was then compared against three conventional NLP algorithms and seven human annotators with different levels of radiologic expertise.
Materials and Methods
This Health Insurance Portability and Accountability Act–compliant retrospective study was approved by our institutional review board (approval no. S-083/2018), and the requirement to obtain informed consent was waived. All anonymized reports handled in this study were created in the German language and stored locally on a dedicated computing resource.
Datasets and Patient Characteristics
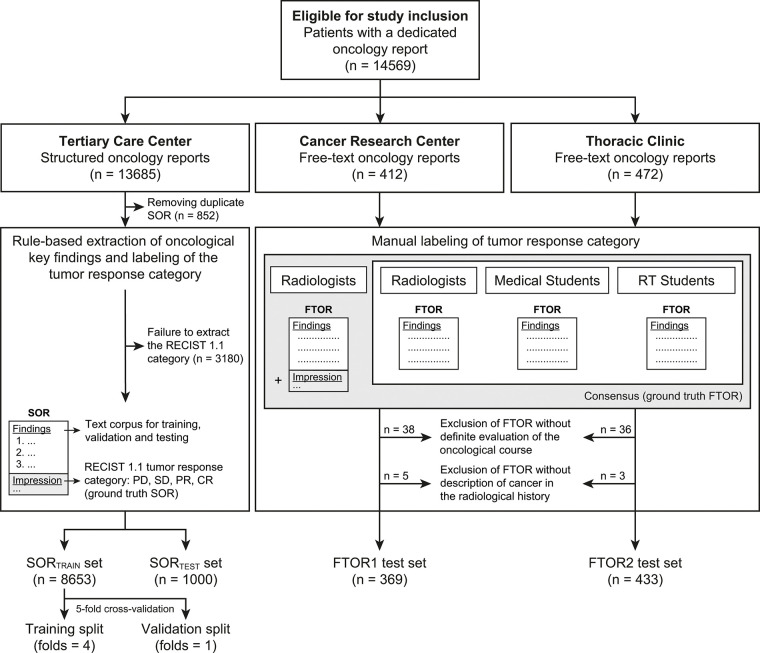
Consecutive reports for CT, MRI, and US examinations of all body regions, performed between March 2018 and August 2021, were retrieved from the radiology information system of three independent radiology departments associated with a nationwide cancer center, as follows: SOR were obtained from a tertiary care center and FTOR from a cancer research center (FTOR1) and a hospital specializing in chest diseases (FTOR2). The reports included all oncologic diagnoses occurring in routine patient care but differed in terms of reported tumor entities according to each department’s field of oncologic expertise. Duplicates and reports that lacked an assessment of tumor burden change were excluded (Fig 1). The initial database query returned 14 569 radiology reports, including 13 685 SOR and 884 FTOR. After removing 852 (6.2%) duplicate SOR database entries, we excluded 3180 (24.8%) SOR because the rule-based extraction of TRCs for ground truth label assignment failed. Following manual FTOR ground truth definition, 82 (9.3%) FTOR were excluded because there was no evidence of cancer in patients’ radiologic history or no clear assessment of tumor burden change using short- and long-term imaging (Fig 1).
Figure 1:
Flowchart of study design. CR = complete response, FTOR = free-text oncology reports, PD = progressive disease, PR = partial response, RECIST = Response Evaluation Criteria in Solid Tumors, RT = radiology technologist, SD = stable disease, SOR = structured oncology reports.
Complexity Analysis of Report Corpora
We performed a lexical complexity analysis for all text corpora as previously described (14). The calculated variables included word count, number of unique words, number of unique bigrams, type-to-token ratio, Yule I metric, and BERT split factor (14,15).
Automated Ground Truth Definition from SOR
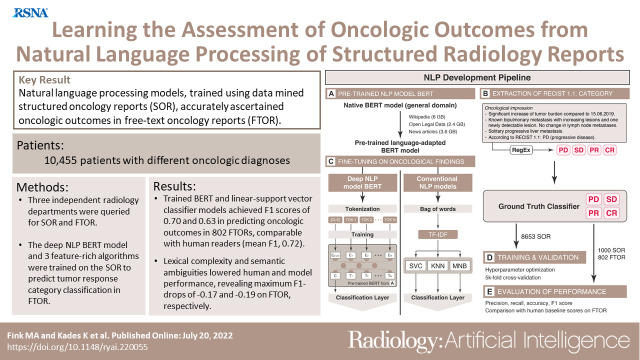
The concept of SOR used in this study has been published before (14). A pictorial overview of the structured reporting concept and its translation into the NLP development pipeline is shown in Figure 2. The conceptual design of the SOR template corresponds to a level 2 reporting structure, with reports created by means of a browser-based tool that provides drop-down menus and pick lists but also free-text forms at predefined positions (http://www.targetedreporting.com/sor/) (3,16). The oncologic assessment followed a standardized terminology related to the Response Evaluation Criteria in Solid Tumors (RECIST) version 1.1 guidelines and considered baseline and nadir imaging if applicable (17). Key oncologic findings were automatically extracted using a rule-based NLP technique called regular expressions, and the mined TRCs were mapped onto the four TRC labels of progressive disease, stable disease, partial response, and complete response, serving as the ground truth classifier for NLP model building.
Figure 2:
Structured oncologic assessment in clinical routine and natural language processing (NLP) model building. An exemplary structured oncology report (SOR) for a 32-year-old woman with a history of breast cancer (left side) was interpreted as progressive disease (PD). The oncologic data were automatically processed and then fed into the NLP development pipeline (right side, A–E). (A) The deep NLP architecture used was based on the bidirectional encoder representations from transformers (BERT) language model pretrained on unlabeled general domain data and adapted to the German vocabulary. (B) Automatic extraction of the Response Evaluation Criteria in Solid Tumors (RECIST)–related categories PD, stable disease (SD), partial response (PR), and complete response (CR) from the SOR “impression” section by using a rule-based pattern-matching command called regular expressions (RegEx). (C) Fine-tuning of BERT and three feature-rich NLP methods (linear support vector classifier [SVC], k-nearest neighbors [KNN], multinomial naive Bayes [MNB]) on the extracted SOR oncologic findings section. The output of (B) was used as ground truth classifier for (D) NLP model training and validation, followed by (E) performance evaluation on the free-text oncology reports (FTOR) test sets in comparison with human baseline scores. A live demo of the SOR template can be accessed for review at http://www.targetedreporting.com/sor/. For demonstration purposes, the presented exemplary SOR and the online template have been translated from German to English. TF-IDF = term frequency–inverse document frequency.
Manual Ground Truth Definition of FTOR
All FTOR were reviewed independently in random order by two radiologists (M.A.F. [in training] and J.K. [board certified], with 5 and 6 years of experience in oncologic imaging, respectively) using a dedicated open source text annotation tool (Doccano; https://doccano.herokuapp.com), which was hosted on the Joint Imaging Platform of the German Cancer Consortium (18,19). On the basis of the information provided in the “findings” and “impression” sections, all reports were classified into one of the four TRCs, which served as ground truth for evaluating the machine and human classification task. Furthermore, comparisons of nononcologic findings (eg, “increase in degenerative changes of the spine”) were mapped onto three nononcologic labels (worsening, constant, improving). Any disagreements between the two radiologists were resolved in a consensus review.
Human Annotations of FTOR
Using the Doccano tool, manual labeling of the TRC in all FTOR was performed independently in random order by two radiologists (A.B. [in training] and M.M. [board certified], with 4 and 6 years of experience in oncologic imaging, respectively), two medical students (M.S. and M.K., third and 12th semesters, respectively), and three radiology technologist (RT) students (all third semesters). All annotators were blinded to the FTOR impression section. In addition, confidence in TRC labeling was recorded for each report using a five-point Likert scale (1 = not confident at all; 5 = very confident).
NLP Model Development
On the basis of the mined SOR data, we trained two NLP model types. Model type 1 applied a deep NLP algorithm based on BERT pretrained on the German vocabulary, which we fine-tuned on the SOR oncologic findings section (10,20,21). Model type 2 served as the NLP reference and comprised the three feature-rich NLP methods, linear support vector classifier (Linear-SVC), k-nearest neighbors, and multinomial naive Bayes, which were built on a bag-of-words model and the term frequency–inverse document frequency, or TF-IDF, term weighting scheme (22). For both model types, the SOR dataset was further randomly divided into a training and held-out test subset (SORTEST) at approximately an 85%:15% split. To estimate generalizability of the models, we performed a fivefold (k = 5) cross-validation on the SOR training set. Once the models were fine-tuned to achieve the best performance on the SOR training and validation subsets, they were used to classify the TRC in our test sets. The chosen hyperparameter settings are described in detail in Table E1 and Figure E1 (supplement).
Statistical Analysis
Statistical analyses were performed by two authors (M.A.F. and K.K.) using the scikit-learn metrics API version 0.24.2 (Python; Python Software Foundation) and R version 2021.09.1 (R Foundation for Statistical Computing). Statistical significance was indicated at a P value less than .05. Differences in baseline characteristics, TRC, and recorded tumor families were compared with the t test for continuous variables and with the χ2 test for categorical variables. The assumption of equal variances between samples was assessed using the Levene test. The t test was used for pairwise comparisons. For more than two groups, a one-way analysis of variance with Tukey honestly significant difference post hoc analysis was performed. Agreement in TRC classification among readers was calculated using the intraclass correlation coefficients (ICCs) in a two-way random-effects model and tested for absolute agreement (23). ICCs were evaluated as follows: below 0.50 = poor, 0.51–0.75 = moderate, 0.76–0.90 = good, above 0.90 = excellent agreement (23). For each FTOR, average scores over the readers within each group were used to compare the confidence among the annotator groups. Weighted recall, precision, accuracy, and F1 scores were used to evaluate human and machine TRC classification performance. We calculated 95% CIs for all metrics using a 2000-times bootstrap resampling (24). On the basis of BERT’s recorded probabilities in TRC classification, the discriminative performance was further visualized using receiver operating characteristic analyses and area under the receiver operating characteristic curve (AUC) values, which were computed for each TRC by using a one-versus-rest approach (25).
Results
Patient Characteristics
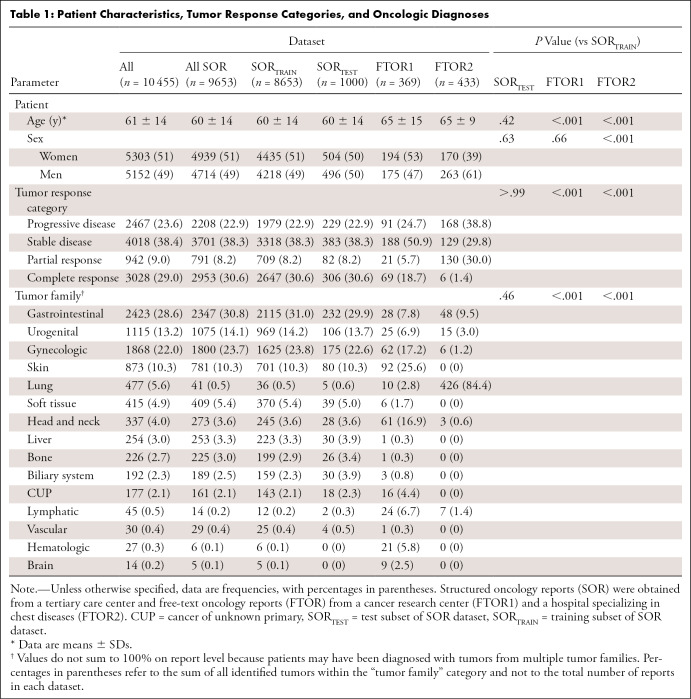
The final study sample included oncology reports from 10 455 patients (mean age, 60 years ± 14; 5303 women). Given the differences in oncologic expertise and patients treated by each radiology department, the distribution of patient characteristics, reported TRCs, and tumor families varied across the datasets (Table 1).
Table 1:
Patient Characteristics, Tumor Response Categories, and Oncologic Diagnoses
Lexical Complexity Analysis of FTOR and SOR
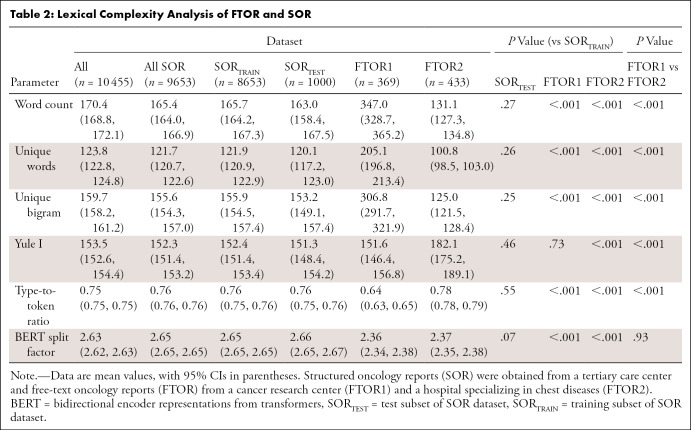
Inhomogeneity of the datasets was also reflected by their lexical structure (Table 2). FTOR1 had the highest word count, more unique words, and more unique bigrams than both FTOR2 and SORTEST (all comparisons, P < .001); these measures were also higher for SORTEST than FTOR2 (each, P < .001). In contrast, the Yule I and type-to-token ratio, both markers for lexical richness and reliable for text length independence, were highest for FTOR2 (all comparisons, P < .001).
Table 2:
Lexical Complexity Analysis of FTOR and SOR
Human Annotator Performance on FTOR
TRC ground truth definition yielded good agreement among both unblinded radiologists on FTOR1 (ICC, 0.79) and excellent agreement on FTOR2 (ICC, 0.90). Subsequent consensus review was required for 118 of 802 (14.7%) reports, among which most discrepant TRC classifications (97 of 118 [82.2%] reports) occurred for labeling stable disease and complete remission (Fig E2A [supplement]).
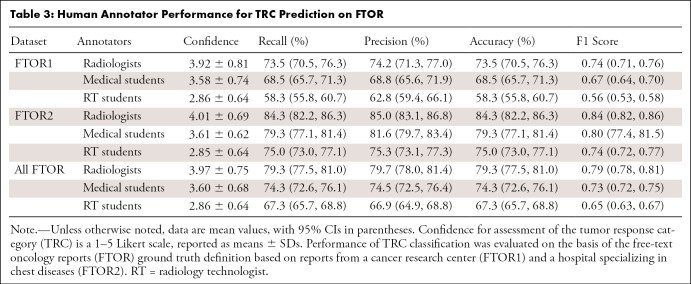
Agreement among the seven blinded readers on TRC labeling was poor on FTOR1 and moderate on FTOR2 (ICC, 0.49 vs 0.70), with group-specific agreements for both radiologists (ICC, 0.56 vs 0.74), both medical students (ICC, 0.54 vs 0.71), and all RT students (ICC, 0.42 vs 0.55) (Fig E2B [supplement]). Confidence in TRC assessment on all FTOR was highest for both radiologists (3.97 ± 0.75), lower for both medical students (3.60 ± 0.68), and lowest for all RT students (2.86 ± 0.64) (each comparison, P < .001), while we found no evidence of a difference in confidence between both FTOR datasets for each annotator group (P = .26). Table 3 outlines the human performance for TRC labeling. On all FTOR, we observed F1 scores of 0.79 (95% CI: 0.78, 0.81) for both radiologists, 0.73 (95% CI: 0.72, 0.75) for both medical students, and 0.65 (95% CI: 0.63, 0.69) for the RT students, with a lower performance on FTOR1 compared with FTOR2 for each annotator group.
Table 3:
Human Annotator Performance for TRC Prediction on FTOR
NLP Model Performance on FTOR and SOR
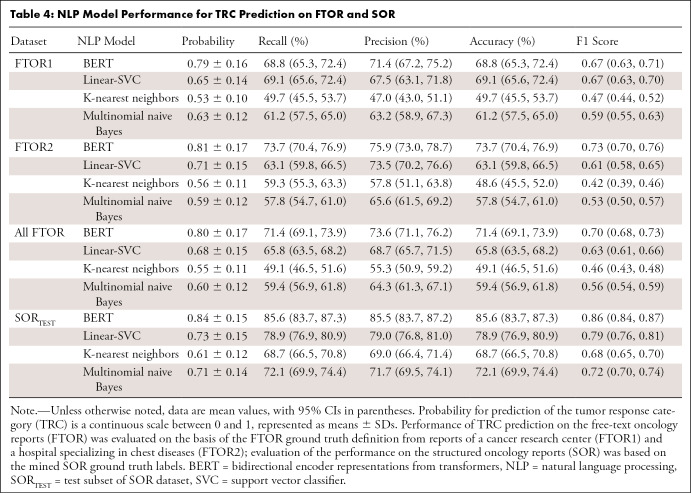
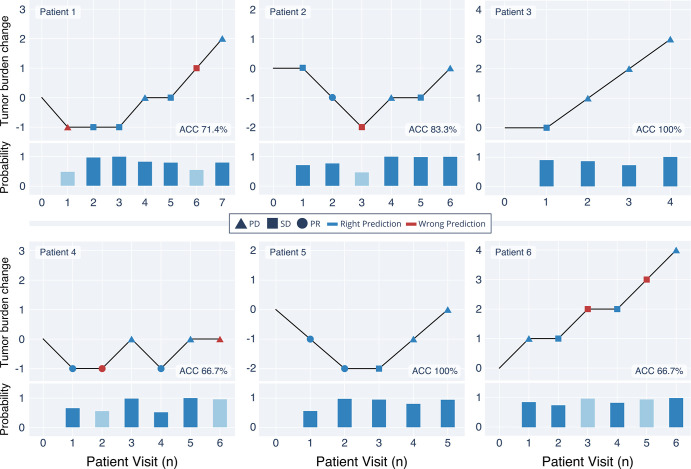
Table 4 summarizes the model performance on SORTEST and FTOR. For BERT, we observed F1 scores of 0.67 (95% CI: 0.63, 0.71) on FTOR1 and 0.73 (95% CI: 0.70, 0.76) on FTOR2. The best-performing conventional NLP model, Linear-SVC, achieved similar results to BERT (F1, 0.67 [95% CI: 0.63, 0.70]) on FTOR1 but had substantially lower performance on FTOR2 (0.61 [95% CI: 0.58, 0.65]). Evaluation on SORTEST revealed the highest performance for all NLP models, again with BERT performing better than the best-performing NLP reference Linear-SVC (F1, 0.86 vs 0.79). Overall AUCs for BERT were 0.81 (95% CI: 0.808, 0.810) on FTOR1, 0.91 (95% CI: 0.912, 0.913) on FTOR2, and 0.95 (95% CI: 0.951, 0.952) on SORTEST, with lowest AUCs for predicting the TRC stable disease in each dataset (Fig 3). On the basis of BERT’s TRC predictions on FTOR, we generated timelines to provide a longitudinal visual representation of tumor burden change on a per-patient level as an operational use case of the NLP system in tumor board assessment (Fig 4).
Table 4:
NLP Model Performance for TRC Prediction on FTOR and SOR
Figure 3:
Receiver operating characteristic curves for the deep natural language processing model bidirectional encoder representations from transformers (BERT) and symbols for each annotator group. The data show (A) the performance on free-text oncology reports (FTOR) of the cancer research center (FTOR1) and (B) the hospital specializing in chest diseases (FTOR2) in predicting the tumor response categories (TRCs) of progressive disease (PD), stable disease (SD), partial response (PR), and complete response (CR). (C) Performance of BERT on the held-out test subset of the structured oncology reports from the tertiary care center (SORTEST). AUC = area under the receiver operating characteristic curve, RT = radiology technologist.
Figure 4:
Exemplary longitudinal representations of the oncologic course of six exemplary patients on the basis of the tumor response category (TRC) predictions by the deep natural language processing model bidirectional encoder representations from transformers (BERT) on the free-text oncology reports (FTOR). BERT’s probability of choosing the TRC per patient visit is shown below each timeline; light blue bars highlight the probability on FTOR where the model predicted an incorrect TRC. ACC = accuracy, PD = progressive disease, PR = partial response, SD = stable disease.
Determinants of Human and Machine Interpretability on FTOR
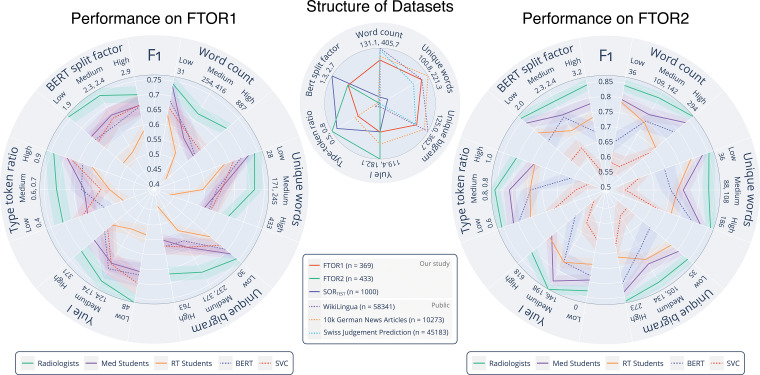
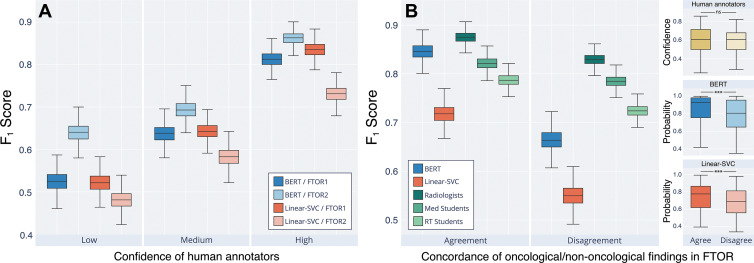
Figure 5 shows human and machine performances on FTOR in classifying TRC on the basis of the complexity parameters. On FTOR1, a higher number of unique words and bigrams led to lower human and machine performance. We observed that long FTOR1 led to poorer performance in all groups, though the effect was most noticeable for our RT students. In contrast, on FTOR2, the NLP models, radiologists, and medical students (but not the RT students) benefited when the overall concise, highly disease-specific FTOR2 (426 of 505 [84.4%] reported lung cancers among all reported cancers) had a larger word count and contained more unique words and bigrams. However, higher lexical richness (Yule I, type-to-token ratio) of FTOR2 led to a decreased performance of all annotators and a substantial F1 score drop of both NLP models. This effect was not evident in FTOR1, but both metrics were lower compared with FTOR2 (P < .001, Table 2). When grouping the model performance by human confidence in TRC labeling, we observed a stepwise increase in performance for BERT and Linear-SVC from low (F1, 0.58 vs 0.50) to medium (F1, 0.67 vs 0.61) to high (F1, 0.84 vs 0.78) human confidence (Fig 6A).
Figure 5:
Lexical complexity analysis of the oncology reports and performance of the natural language processing (NLP) models and human annotators on the free-text oncology reports (FTOR). The center radar plot shows the analyzed complexity parameters, for which minimum and maximum values are given beneath each parameter. For comparison of the lexical structure of the FTOR corpora, the structured oncology reports of the tertiary care center (SORTEST, n = 1000) as well as three publicly available datasets (WikiLingua, n = 58 341; 10k German news articles, n = 10 273; Swiss Judgement Prediction, n = 45 183) are shown. The radar plots on the left and right side outline the F1 scores (shadows indicate 95% CIs) for the deep NLP bidirectional encoder representations from transformers (BERT) model and the best-performing conventional NLP model, linear support vector classifier (Linear-SVC), as well as for the radiologists, medical students, and radiology technologist (RT) students on the FTOR of the cancer research center (left, FTOR1, n = 369) and the hospital specializing in chest diseases (right, FTOR2, n = 433) for classifying tumor response category as a function of the analyzed complexity parameters; these scores were grouped into equal-sized bins of low, medium, and high lexical complexity and denoted with the respective boundary values beneath each parameter.
Figure 6:
Machine and human interpretability of the “findings” section in free-text oncology reports (FTOR) with respect to classifying the tumor response category (TRC). (A) Performance of the deep natural language processing (NLP) bidirectional encoder representations from transformers (BERT) model and the best-performing conventional NLP method, linear support vector classifier (Linear-SVC), on FTOR of the cancer research center (FTOR1) and the hospital specializing in chest diseases (FTOR2), grouped by confidence of the human annotators in classifying the TRC. The mean confidence of all annotators on the basis of Likert scores were split into three confidence groups (low, medium, high). (B) Performance of both NLP models and the human annotators as a function of the concordance of oncologic and nononcologic findings described in the FTOR findings section. For example, the findings “increased pulmonary metastases” and “increased degenerative changes of the spine” were categorized as oncologic to nononcologic concordance (agreement) in one FTOR, whereas “decreased pulmonary metastases” and “increased degenerative changes of the spine” were categorized as nonconcordance (disagreement) in another FTOR. The right facet of (B) outlines the respective confidences of the human annotators and the probabilities of the NLP models in classifying the TRC on the basis of the underlying concordance group (agree, disagree). *** = P < .001, ns = not significant, RT = radiology technologist.
We further investigated the impact of the described nononcologic findings on TRC classification performance (Fig 6B). Agreement and disagreement of concordance between oncologic and nononcologic findings resulted in different scores for radiologists (F1, 0.87 vs 0.83), BERT (F1, 0.85 vs 0.66), medical students (F1, 0.79 vs 0.72), RT students (F1, 0.72 vs 0.55), and Linear-SVC (F1, 0.72 vs 0.55), whereas the performance loss was highest for both models and the RT students. There was no evidence of a difference in human confidence in TRC classification between both groups (P = .38, right facet of Fig 6B), but we observed lower probabilities for BERT and Linear-SVC on FTOR where descriptions of oncologic and nononcologic findings disagreed (each, P < .001).
Discussion
Our study demonstrates the feasibility of a fully automated scalable data mining and curation pipeline using SOR to build and train NLP models for ascertaining oncologic outcomes in multi-institutional FTOR. The best-performing deep NLP model BERT achieved an F1 score of 0.70 (95% CI: 0.68, 0.73) on FTOR for predicting the TRC on the basis of descriptions in the findings section. On the same task, both radiologists performed better but not excellent (F1, 0.79; 95% CI: 0.78, 0.81), whereas our medical students had similar scores as BERT (F1, 0.73; 95% CI: 0.72, 0.75), and our RT students underperformed the model (F1, 0.65; 95% CI: 0.63, 0.67). The best-performing conventional NLP model, Linear-SVC, showed the lowest performance (F1, 0.63; 95% CI: 0.61, 0.66) on all FTOR.
Because of the standardized oncologic assessment in our SOR, we were able to use regular expressions as a rule-based NLP technique to accurately extract the four RECIST-related TRCs for assigning ground truth labels. According to the SOR concept, dedicated TRCs should not be used when equivocal findings are present that could complicate standardized categorization of the disease, encouraging radiologists to use narrative text in such SOR rather than adhering to the defined terminology for articulating the ambiguities (16,17). This mainly explains the dropouts in 24.8% of all FTOR as a known drawback of our extraction method but ensures error-free information retrieval, a crucial premise at this stage of artificial intelligence development (13,25).
Predicting oncologic outcomes from FTOR with machine learning is itself a nontrivial problem in NLP development, as detecting disease progression relies on temporal and contextual reasoning rather than extracting specific information about a particular disease or condition from the radiology report (8,26). In our work, we cover the entire oncologic spectrum from three independent radiology departments whose reports differ in terms of reporting style (SOR vs FTOR), the distribution of oncologic diseases (broad [SORTEST, FTOR1] vs specific spectrum [FTOR2]), and lexical structure with different levels of complexity. The diseases, symptoms, and procedures vary widely across the three participating centers, and the radiologists interpreting these different cancer types make a variety of linguistic choices when discussing the oncologic findings. The Clinical TempEval 2017 challenge addressed the question of how well NLP models trained on one cancer domain (colon cancer) perform in predicting timelines in another cancer domain (brain cancer), with an 0.20 F1 score drop in performance across domains, achieving maximum F1 scores between 0.51 and 0.59 (27). As expected, due to the absence of any domain or distribution shift between the SOR training and test set in our study (P > .99), evaluation on SORTEST revealed an increase in performance compared with FTOR for all NLP models (F1, best-performing models: BERT, 0.86 vs 0.70; Linear-SVC, 0.79 vs 0.63).
The only moderate interannotator agreement (ICC, range, 0.56–0.74) and accuracies (range, 73.5%–84.3%) of our radiologists suggest that correct interpretation of the FTOR findings section is a challenging task even for domain experts, supporting evidence from previous surveys that many referring clinicians struggle with the clarity of reported findings in radiology reports (28). In our study, both ground truth readers, the three annotator groups, and the deep NLP model BERT had difficulties in classifying the TRC class stable disease, with smaller AUCs compared with the overall AUC for BERT on both FTOR datasets (FTOR1: AUC, 0.77 vs 0.81; FTOR2: AUC, 0.84 vs 0.91).
One reason for the difficulty in this classification could be the ambiguity of the oncologic descriptions and diverging meanings between the described findings and the interpreting radiologist’s final impression of disease progression. The RECIST category stable disease comprises a wide range of subthreshold changes in tumor burden between formal disease progression and partial response. To articulate the presence of these subthreshold changes, radiologists may use terms such as “stable disease with a trend toward increasing tumor burden,” which we found in the impression section of misclassified FTOR, whereas their findings section referred to increasing lesions throughout the text. We also made this observation for reported oncologic and nononcologic findings: Humans and NLP models performed substantially worse when oncologic and nononcologic textual information had divergent semantic tendencies (eg, progressive disease and improvement, stable disease and worsening, partial response and worsening), with the lowest values found in both NLP models (F1 score drop: BERT, −0.19; Linear-SVC, −0.17) and RT students (F1 score drop, −0.17). Interestingly, we found differences in the probability of BERT and Linear-SVC for choosing the TRC between both groups of concordant and nonconcordant findings in FTOR (each, P < .001) but not in the confidence of our human annotators (P = .38). However, these aspects of human and machine interpretability in such NLP tasks deserve further exploration in future studies and are beyond the scope of this study.
Our study had limitations. First, the mined SOR data were not reviewed for reporting quality or correct TRC assignments according to our RECIST-related SOR concept. However, it can be assumed that the extracted TRC labels represent an appropriate ground truth, because all radiologic examinations were interpreted according to the four-eyes principle and finally approved by an attending radiologist. Second, our standard of reference was based solely on information provided in the reports. Because of the expected workload, no images from the radiologic examinations were used to verify TRC assignments in FTOR. Contrary to the standardized assessment in our SOR, none of the 802 FTOR included a table containing reference measurements of target lesions. Consequently, the predictions made by our annotators and NLP models do not represent quantitative RECIST measurements and classifications. Third, our NLP models did not see any FTOR training data. In our experiment, we pitted FTOR-naive NLP models against our medical and RT students who also had never seen FTOR data before but have a basic medical understanding. This approach most likely leads to losses in performance of our NLP models but ensures good comparison to a human baseline. Key next steps will include testing transfer learning on FTOR training sets to boost our NLP models for further evaluation of their peak performance. Fourth, our models were trained on German SOR, which limits their generalizability to FTOR in other languages. However, we assume good portability of our algorithms because they are publicly available and would merely require training sets adapted to the respective language.
In conclusion, our study encourages the use of structured radiology reports as a “science-ready” data resource for machine learning purposes without any prior manual annotation effort by domain expert readers. Our results provide evidence that deep NLP models trained on mined data from structured reports can reach human performance levels in curating oncologic outcomes from free-text reports but are likewise prone to the lexical complexity and semantic diversity of the radiologic narrative. Such systems may be able to extract clinically relevant oncologic end points from large volumes of longitudinal free-text reports and offer a potential advantage as an automated clinical decision support tool for patients referred for multidisciplinary tumor board assessment. Our future efforts will include testing the NLP pipeline in other clinical contexts and applying it to evaluate associations among therapeutic exposures, tumor profiles, and oncologic outcomes.
Acknowledgments
Acknowledgments
We would like to thank our radiology technologist students Melina Fritz, Julia Jaworek, and Genoveva Wolf for their great effort in annotating the free-text radiology reports. We further thank Nicholas Schreck, PhD, (Biostatistics Division, German Cancer Research Center) for statistical advice.
M.A.F. and K.K. contributed equally to this work.
Authors declared no funding for this work.
Disclosures of conflicts of interest: M.A.F. No relevant relationships. K.K. No relevant relationships. A.B. No relevant relationships. M.M. No relevant relationships. M.S. No relevant relationships. M.K. No relevant relationships. G.K. No relevant relationships. J.S. No relevant relationships. C.P.H. No relevant relationships. H.P.S. No relevant relationships. K.M.H. No relevant relationships. T.F.W. No relevant relationships. J.K. No relevant relationships.
Abbreviations:
- AUC
- area under the receiver operating characteristic curve
- BERT
- bidirectional encoder representations from transformers
- FTOR
- free-text oncology reports
- ICC
- intraclass correlation coefficient
- NLP
- natural language processing
- RECIST
- Response Evaluation Criteria in Solid Tumors
- RT
- radiology technologist
- SOR
- structured oncology reports
- SORTEST
- test subset of SOR dataset
- SVC
- support vector classifier
- TRC
- tumor response category
References
- 1. Yim WW , Yetisgen M , Harris WP , Kwan SW . Natural language processing in oncology: a review . JAMA Oncol 2016. ; 2 ( 6 ): 797 – 804 . [DOI] [PubMed] [Google Scholar]
- 2. European Society of Radiology (ESR) . ESR paper on structured reporting in radiology . Insights Imaging 2018. ; 9 ( 1 ): 1 – 7 . [DOI] [PMC free article] [PubMed] [Google Scholar]
- 3. Nobel JM , Kok EM , Robben SGF . Redefining the structure of structured reporting in radiology . Insights Imaging 2020. ; 11 ( 1 ): 10 . [DOI] [PMC free article] [PubMed] [Google Scholar]
- 4. Fink MA , Mayer VL , Schneider T , et al . CT angiography clot burden score from data mining of structured reports for pulmonary embolism . Radiology 2022. ; 302 ( 1 ): 175 – 184 . [DOI] [PubMed] [Google Scholar]
- 5. Kehl KL , Elmarakeby H , Nishino M , et al . Assessment of deep natural language processing in ascertaining oncologic outcomes from radiology reports . JAMA Oncol 2019. ; 5 ( 10 ): 1421 – 1429 . [DOI] [PMC free article] [PubMed] [Google Scholar]
- 6. Agaronnik N , Lindvall C , El-Jawahri A , He W , Iezzoni L . Use of natural language processing to assess frequency of functional status documentation for patients newly diagnosed with colorectal cancer . JAMA Oncol 2020. ; 6 ( 10 ): 1628 – 1630 . [DOI] [PMC free article] [PubMed] [Google Scholar]
- 7. Banerjee I , Bozkurt S , Caswell-Jin JL , Kurian AW , Rubin DL . Natural language processing approaches to detect the timeline of metastatic recurrence of breast cancer . JCO Clin Cancer Inform 2019. ; 3 ( 3 ): 1 – 12 . [DOI] [PubMed] [Google Scholar]
- 8. Pons E , Braun LMM , Hunink MGM , Kors JA . Natural language processing in radiology: a systematic review . Radiology 2016. ; 279 ( 2 ): 329 – 343 . [DOI] [PubMed] [Google Scholar]
- 9. Steinkamp JM , Chambers CM , Lalevic D , Zafar HM , Cook TS . Automated organ-level classification of free-text pathology reports to support a radiology follow-up tracking engine . Radiol Artif Intell 2019. ; 1 ( 5 ): e180052 . [DOI] [PMC free article] [PubMed] [Google Scholar]
- 10.Devlin J, Chang MW, Lee K, Toutanova K. BERT: Pre-training of deep bidirectional transformers for language understanding. In: Proceedings of the 2019 Conference of the North American Chapter of the Association for Computational Linguistics: Human Language Technologies, Vol 1(Long and Short Papers).Minneapolis, Minn:Association for Computational Linguistics, 2019; 4171–4186. [Google Scholar]
- 11. Linna N , Kahn CE Jr . Applications of natural language processing in radiology: A systematic review . Int J Med Inform 2022. ; 163 : 104779 . [DOI] [PubMed] [Google Scholar]
- 12. Gehrmann S , Dernoncourt F , Li Y , et al . Comparing deep learning and concept extraction based methods for patient phenotyping from clinical narratives . PLoS One 2018. ; 13 ( 2 ): e0192360 . [DOI] [PMC free article] [PubMed] [Google Scholar]
- 13. Willemink MJ , Koszek WA , Hardell C , et al . Preparing medical imaging data for machine learning . Radiology 2020. ; 295 ( 1 ): 4 – 15 . [DOI] [PMC free article] [PubMed] [Google Scholar]
- 14. Zech J , Pain M , Titano J , et al . Natural language-based machine learning models for the annotation of clinical radiology reports . Radiology 2018. ; 287 ( 2 ): 570 – 580 . [DOI] [PubMed] [Google Scholar]
- 15. Yule GU . On sentence-length as a statistical characteristic of style in prose: With application to two cases of disputed authorship . Biometrika 1939. ; 30 ( 3/4 ): 363 – 390 . [Google Scholar]
- 16. Weber TF , Spurny M , Hasse FC , et al . Improving radiologic communication in oncology: a single-centre experience with structured reporting for cancer patients . Insights Imaging 2020. ; 11 ( 1 ): 106 . [DOI] [PMC free article] [PubMed] [Google Scholar]
- 17. Eisenhauer EA , Therasse P , Bogaerts J , et al . New response evaluation criteria in solid tumours: revised RECIST guideline (version 1.1) . Eur J Cancer 2009. ; 45 ( 2 ): 228 – 247 . [DOI] [PubMed] [Google Scholar]
- 18. Nakayama H , Kubo T , Kamura J , Taniguchi Y , Liang X . Doccano: Text annotation tool for human . https://github.com/doccano/doccano. Published 2018. Accessed February 20, 2022 .
- 19. Scherer J , Nolden M , Kleesiek J , et al . Joint Imaging Platform for Federated Clinical Data Analytics . JCO Clin Cancer Inform 2020. ; 4 ( 4 ): 1027 – 1038 . [DOI] [PMC free article] [PubMed] [Google Scholar]
- 20. Wolf T , Debut L , Sanh V , et al . Transformers: state-of-the-art natural language processing . in: proceedings of the 2020 conference on empirical methods in natural language processing: system demonstrations. online: association for computational linguistics , 2020. ; 38 – 45 . [Google Scholar]
- 21. German BERT. State of the Art Language Model for German NLP . https://www.deepset.ai/german-bert. Accessed February 20, 2022 .
- 22. Koo TK , Li MY . A Guideline of Selecting and Reporting Intraclass Correlation Coefficients for Reliability Research . J Chiropr Med 2016. ; 15 ( 2 ): 155 – 163 . [Published correction appears in J Chiropr Med 2017;16(4):346.] [DOI] [PMC free article] [PubMed] [Google Scholar]
- 23. Tibshirani RJ , Efron B . An introduction to the bootstrap . In: Monographs on statistics and applied probability . New York, NY: : Chapman & Hall; , 1993. ; 57 : 1 – 436 . [Google Scholar]
- 24. Receiver Operating Characteristic (ROC). scikit-learn . https://scikit-learn.org/stable/auto_examples/model_selection/plot_roc.html. Accessed February 20, 2022 .
- 25. Garofalakis M , Rastogi R , Shim K . Mining sequential patterns with regular expression constraints . IEEE Trans Knowl Data Eng 2002. ; 14 ( 3 ): 530 – 552 . [Google Scholar]
- 26. Savova GK , Danciu I , Alamudun F , et al . Use of natural language processing to extract clinical cancer phenotypes from electronic medical records . Cancer Res 2019. ; 79 ( 21 ): 5463 – 5470 . [DOI] [PMC free article] [PubMed] [Google Scholar]
- 27.Bethard S, Savova G, Palmer M, Pustejovsky J. SemEval-2017 Task 12: Clinical TempEval. In: Proceedings of the 11th International Workshop on Semantic Evaluation (SemEval-2017). Vancouver, Canada: Association for Computational Linguistics; 2017; 565–572. [Google Scholar]
- 28. Bosmans JML , Weyler JJ , De Schepper AM , Parizel PM . The radiology report as seen by radiologists and referring clinicians: results of the COVER and ROVER surveys . Radiology 2011. ; 259 ( 1 ): 184 – 195 . [DOI] [PubMed] [Google Scholar]


![Structured oncologic assessment in clinical routine and natural language processing (NLP) model building. An exemplary structured oncology report (SOR) for a 32-year-old woman with a history of breast cancer (left side) was interpreted as progressive disease (PD). The oncologic data were automatically processed and then fed into the NLP development pipeline (right side, A–E). (A) The deep NLP architecture used was based on the bidirectional encoder representations from transformers (BERT) language model pretrained on unlabeled general domain data and adapted to the German vocabulary. (B) Automatic extraction of the Response Evaluation Criteria in Solid Tumors (RECIST)–related categories PD, stable disease (SD), partial response (PR), and complete response (CR) from the SOR “impression” section by using a rule-based pattern-matching command called regular expressions (RegEx). (C) Fine-tuning of BERT and three feature-rich NLP methods (linear support vector classifier [SVC], k-nearest neighbors [KNN], multinomial naive Bayes [MNB]) on the extracted SOR oncologic findings section. The output of (B) was used as ground truth classifier for (D) NLP model training and validation, followed by (E) performance evaluation on the free-text oncology reports (FTOR) test sets in comparison with human baseline scores. A live demo of the SOR template can be accessed for review at http://www.targetedreporting.com/sor/. For demonstration purposes, the presented exemplary SOR and the online template have been translated from German to English. TF-IDF = term frequency–inverse document frequency.](https://cdn.ncbi.nlm.nih.gov/pmc/blobs/e688/9530771/4d6285ac27b4/ryai.220055.fig2.jpg)
