INTRODUCTION:
This is the first randomized controlled diet intervention trial to investigate both the amount and type of carbohydrate on symptomatic gastroesophageal reflux disease (GERD).
METHODS:
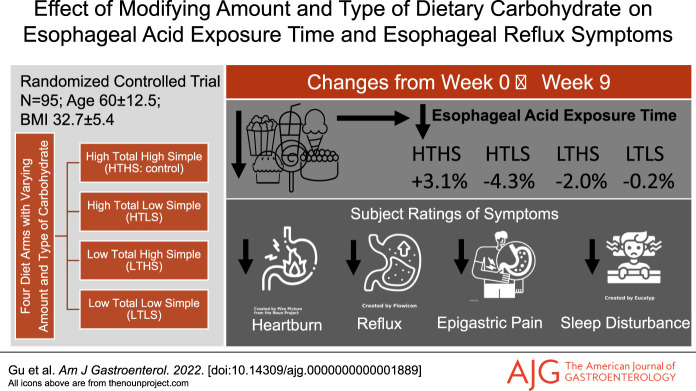
Ninety-eight veterans with symptomatic GERD were randomly assigned to high total/high simple, high total/low simple, low total/high simple, or low total/low simple carbohydrate diet for 9 weeks. The primary outcomes were esophageal acid exposure time (AET) and total number of reflux episodes derived from 24-hour ambulatory pH monitoring. Secondary outcomes were esophageal reflux symptoms rated using the Gastroesophageal Reflux Disease Questionnaire (GERDQ) and GERD Symptom Assessment Scale (GSAS).
RESULTS:
Half of the subjects were White and half African American (mean age, 60.0 ± 12.5 years; mean body mass index, 32.7 ± 5.4 kg/m2). There was a significant main effect of diet treatment on AET (P = 0.001) and on the total number of reflux episodes (P = 0.003). The change in AET in the high total/low simple group (−4.3% ± 3.8%) differed significantly from the high total/high simple control group (+3.1% ± 3.7%), (P = 0.04). The reduction in simple sugar intake averaged 62 g less per day. Subjects' ratings of symptoms improved in all carbohydrate modification groups, including significant reductions in heartburn frequency, heartburn severity, acid taste in the mouth, lump/pain in the throat or chest, and sleep disturbance.
DISCUSSION:
A modification of dietary carbohydrate intake that targeted a substantial reduction in the intakes of simple sugars improved pH monitoring outcomes and symptoms of GERD that profoundly affect daily life. These findings provide a feasible and clinically applicable contribution to the limited objective data existing for efficacious dietary recommendations in the routine treatment and management of GERD.
INTRODUCTION
Gastroesophageal reflux disease (GERD) is the most frequent and most costly gastrointestinal disorder diagnosed in US healthcare systems (1,2), now affecting ∼30% of Americans (3). The role of foods and nutrients on the pathogenesis and management of GERD remains unclear because of a paucity of objective evidence. Historically, dietary recommendations have focused on avoiding foods that are perceived to trigger symptoms of heartburn, regurgitation, acid taste in the mouth, nausea, and epigastric pain (4). Consumption of high-fat foods has long been considered a trigger, presumably either by delaying gastric transit time or reducing lower esophageal sphincter (LES) pressure, and thereby, increasing esophageal acid exposure time (AET) (5). However, studies using ambulatory pH monitoring have shown no significant difference in LES pressure or the percentage of time that esophageal pH is less than 4.0 in persons with GERD after consuming isocaloric high-fat vs low-fat meals (6–10). Furthermore, a review of the evidence showed no basis for recommending a low-fat diet (11).
In contrast to the findings from studies targeting the amount of dietary fat intake, a 6-day trial of a very low-carbohydrate diet (20 g/d) showed significantly reduced percentage of time with pH <4.0 in 8 women with GERD and obesity (12). The importance of focusing on the amount of carbohydrate consumed is best understood when considering that carbohydrates are the macronutrient that comprises the majority of calories consumed—typically 45%–60% of daily energy intake. Beyond the amount of intake, types of carbohydrates are categorized by their chemical structure: simple carbohydrates (often referred to as simple sugars) are monosaccharides such as glucose and fructose, which have only a single aldehyde or ketone unit, and complex carbohydrates are either oligosaccharides with up to 10 monosaccharide units or polysaccharides with very long chains of monosaccharides. Recently, we observed that the amount of total carbohydrate intake, intake of simple sugars, and overall glycemic load were associated with the cardinal GERD symptoms of heartburn and reflux in 144 women with obesity (13).
To the best of our knowledge, no prior randomized trials have been performed to determine the effects of both the amount and type of dietary carbohydrate on symptomatic GERD. To do so, we conducted a randomized controlled 9-week diet intervention trial in persons with obesity and symptomatic GERD. The primary outcomes were esophageal AET and total number of reflux episodes, and the secondary outcomes were esophageal reflux symptoms. The diet intervention was rigorously designed to directly compare 4 diets that differed in the amount and type of carbohydrate to be consumed. A high total/high simple carbohydrate diet served as the control condition because of its resemblance to typical habitual dietary intakes. We hypothesized that reducing both the amount of total carbohydrate and the types of carbohydrates (simple sugars) in the diet would significantly reduce the esophageal AET, total number of reflux episodes, and frequency or severity of symptoms. The findings from this study have a great potential to affect daily clinical management of GERD, especially considering the excessive intake of simple sugars in the typical Western diet (∼34 teaspoons per day (14)) and the paucity of rigorous objective dietary evidence to guide clinical management of GERD.
PATIENTS AND METHODS
Study design
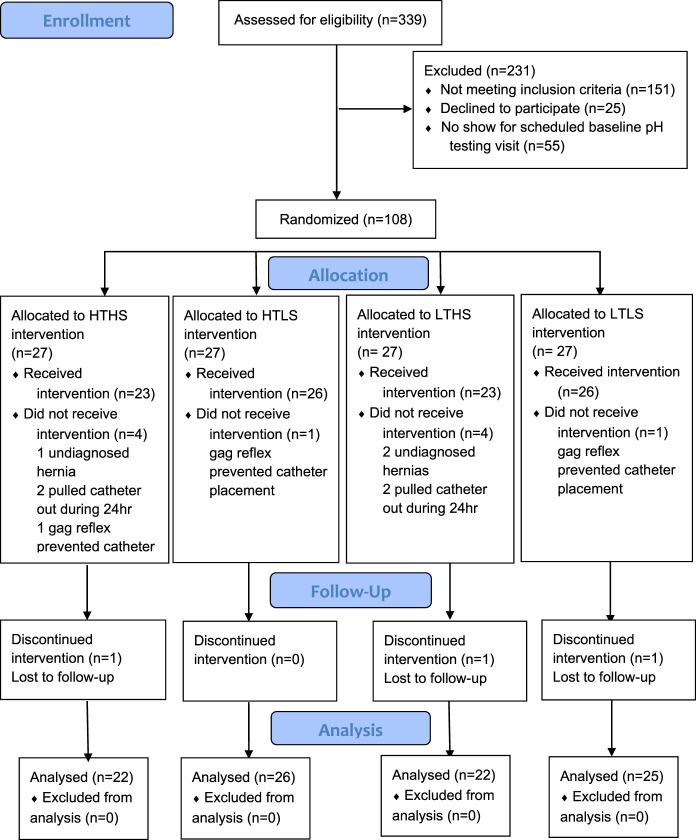
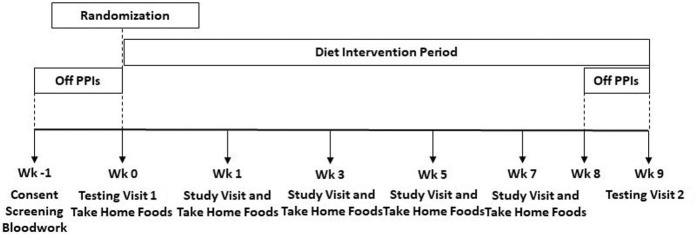
This study was a prospective, randomized, single-blind, controlled, diet intervention trial. Computer-generated randomization sequences were produced by the study biostatistician using a permuted block method to stratify by body mass index (BMI 25–34.9 and BMI 35–45 kg/m2). Sequences within each BMI group were provided in a secure spreadsheet to a research dietitian not directly involved in study protocol implementation. This research dietitian allocated subjects to study diet groups at the completion of the baseline testing visit (Figure 1). A master list linking study ID number with subject name was securely managed by the same research dietitian. Blindness of diet group assignments was maintained for study investigators. Subjects were admitted to the Vanderbilt Clinical Research Center (VCRC) for the 24-hour periods of the baseline and final testing visits (Figure 2). After admission to the VCRC, obtainment of vital signs, and collection of fasting blood samples, subjects were escorted to the Vanderbilt Gastrointestinal Motility Clinic for manometry and pH catheter placement. Subjects returned to their private VCRC room for the remainder of the 24-hour testing period with meals provided by the Vanderbilt Metabolic Kitchen. Every other week visits with a research dietitian incorporated assessment of weight and anthropometry, review of dietary intakes and daily menu checklists, problem solving for optimal diet adherence, and provision of diet intervention foods for the following 2 weeks. Unmasking of data occurred after all subjects completed the study; all data were entered into a REDCap database (15); and data cleaning was performed.
Figure 1.
Consort diagram.
Figure 2.
Study design.
Patients
Subjects were recruited from the Tennessee Valley Healthcare System (TVHS, Department of Veterans Affairs, Nashville, TN) on responding to flyers posted in the TVHS primary care outpatient clinics or a study-specific advertisement aired weekly on the internal TVHS television system. In addition, an institutional review board-approved HIPAA waiver allowed the VA Informatics and Computing Infrastructure to generate lists of patients receiving proton pump inhibitor (PPI) prescriptions (omeprazole or pantoprazole) from the TVHS outpatient pharmacy within the previous 6 months. To be included, veterans had GERD diagnosis documented in the electronic medical record on assessment of the classic GERD symptoms (heartburn and regurgitation) by their attending physician and PPI prescription from the TVHS outpatient pharmacy for ≥ 3 months before enrollment. In addition, subjects were older than 21 years and had BMI between 25.0 and 45.0 kg/m2. Exclusion criteria were as follows: diagnosed with type 1 diabetes, esophageal stricture, extraesophageal GERD, Barrett's esophagus, gastroparesis or esophageal motility disorders, esophageal adenocarcinoma or other cancer, or a history of esophageal or bariatric surgery. Potential subjects were also excluded if they had a hiatal hernia of >5 cm, had food allergies or dietary restrictions, had gastrointestinal malabsorption, had alcohol consumption averaging >2 drinks/day during the 3 months before enrollment, or were pregnant or lactating. This study was registered on ClinicalTrials.gov (NCT02384551) and approved by the TVHS (IRB#676769-14) and the Vanderbilt University Medical Center (IRB#141715) Institutional Review Boards, and all subjects signed written informed consent. All authors had access to the data and approved the final manuscript.
Diets
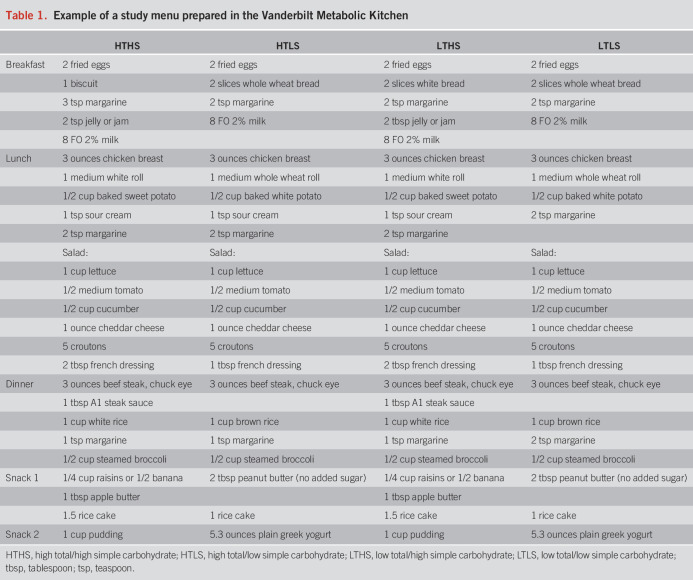
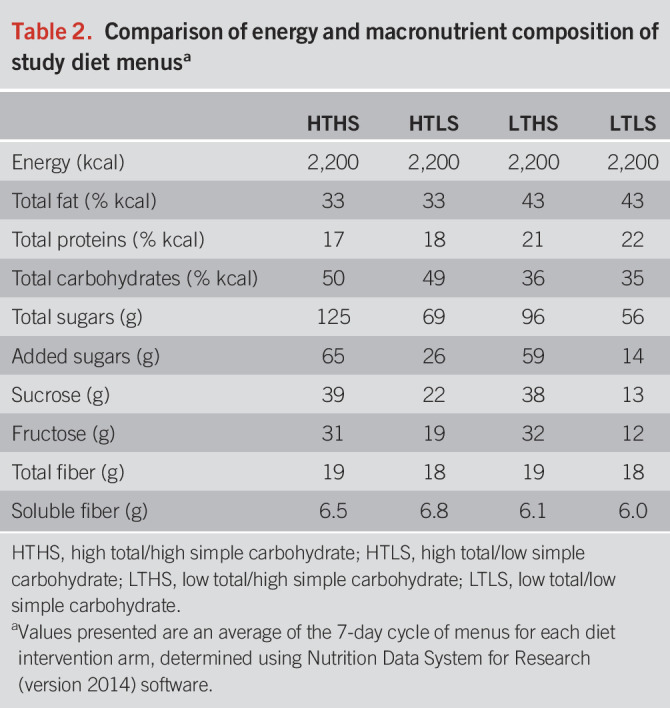
Subjects were randomly assigned to 1 of 4 diet intervention groups for a period of 9 weeks: high total/high simple carbohydrate (HTHS), high total/low simple carbohydrate (HTLS), low total/high simple carbohydrate (LTHS), or low total/low simple carbohydrate (LTLS) diet. Total carbohydrate was the sum of all monosaccharides, disaccharides, oligosaccharides, and polysaccharides. Simple carbohydrates were all sugars (monosaccharides and disaccharides) occurring naturally or added in foods and beverages. A 7-day rotation of menus (Table 1) was developed for each diet group using Nutrition Data System for Research software (NDS-R version 2014; Nutrition Coordinating Center, Minneapolis, MN) to assure that each diet treatment met the planned total carbohydrate and simple sugar composition (Table 2). To establish individual caloric goals for weight maintenance, we measured resting energy expenditure by a metabolic cart (ParvoMedics TrueOne 2400, Sandy, UT). Baseline resting energy expenditure was multiplied by an activity factor determined by a subject's total physical activity score calculated from the modified Baecke Physical Activity Questionnaire (16). Foods and ingredients were purchased in advance and prepared at the Vanderbilt Metabolic Kitchen into preportioned containers for subjects to take home. Detailed instructions, including strategies on how to reduce simple sugar intakes (see Supplementary Table 1, Supplementary Digital Content 1, http://links.lww.com/AJG/C592), were provided in-person and in notebook binders wherein subjects recorded their daily dietary intakes for the 9-week intervention period using menu-specific checklists. To further confirm diet adherence, dietary intakes were randomly assessed by 24-hour diet recall interviews (17,18).
Table 1.
Example of a study menu prepared in the Vanderbilt Metabolic Kitchen
Table 2.
Comparison of energy and macronutrient composition of study diet menusa
Ambulatory pH monitoring
Acid suppressive medications were discontinued for 7 days before pH monitoring per the current Clinical Practice Guidelines (19). Testing was performed using a MII-pH monitoring device (Sandhill Scientific, Highlands Ranch, CO), which includes a data recorder (Sleuth System; Sandhill Scientific) and a 2.1-mm diameter polyvinyl catheter embedded by 1 pH and 6 impedance sensors that were calibrated before placement. The catheter was placed intranasally with the esophageal pH sensor positioned 5 cm above the manometrically defined upper border of the LES. Intraluminal impedance was measured at 3, 5, 7, 9, 15, and 17 cm above the LES. Data sampling frequency for both impedance and pH sensors was 50 Hz. Data were analyzed using BioView Analysis software (Sandhill Scientific), with reflux episodes identified by computerized detection of proximally directed decreases in impedance. Tracings were also manually reviewed by an experienced gastroenterologist (M.F.V.) to confirm accuracy and correct errors. Upright, supine, and total reflux events were recorded. Acid reflux events were defined as those with pH ≤4.0 and non- or weakly acid reflux events at pH >4.0. The primary outcomes were total esophageal AET and the total number of reflux episodes. Subjects were instructed to keep a record of meal/snack times, position changes, and gastrointestinal symptoms during the 24-hour monitoring period.
Esophageal reflux symptoms
The GERD Symptom Assessment Scale (GSAS) (20) and the Gastroesophageal Reflux Disease Questionnaire (GERDQ) (21) were administered to assess the types, frequency, and severity of GERD symptoms over the previous week. The GSAS assesses frequency, severity, and distress of 15 GERD symptoms with an internal consistency of >0.80 for the symptom severity and symptom distress scales. The GERDQ is a 6-item questionnaire that differentiates persons with occasional vs frequent symptoms on the day of assessment: 2 items assess the impact of GERD symptoms on daily life and 4 items assess the impact of treatment. Both questionnaires were administered in the morning before pH catheter placement.
Anthropometrics and physical activity
Height (±0.1 cm), weight (±0.1 kg), and waist and hip circumferences (±0.1 cm) were measured in triplicate using standardized procedures. The Baecke Physical Activity Questionnaire, an interviewer-administered tool, was used to determine a total physical activity score that incorporated types, frequency, and intensity of household, sports, and leisure time activities. The sum of the 3 scales provided a continuous overall measure of physical activity that is validated (r = 0.78) and reliable (r = 0.89) when compared with 24-hour recall interviews and pedometers (16).
Statistical methods and data analysis
A sample size of 20 in each diet group was estimated to have 87% power with a type I probability of 0.05 to observe a significant difference of ≥5% in the primary outcome of esophageal AET between any diet treatment group and the control HTHS diet group. Summary statistics were calculated for each diet group. Analyses were performed on an intention-to-treat basis. Analysis of covariance included baseline data as a covariate to compare differences in the primary outcomes of total esophageal AET and total number of reflux episodes in the 24-hour pH monitoring period between diet treatment groups and the control HTHS diet group. ANCOVA and multivariate regression modeling also controlled for age, sex, waist circumference, BMI, and weight change for analysing primary outcomes and determining differences among groups for PPI usage and changes in symptom scores, dietary intakes, and physical activity scores. PPI usage (dose and frequency) was converted to omeprazole units for analysis. Statistical significance was defined as P value <0.05. All statistical analyses were performed using SPSS (version 27; IBM, Montauk, NY). GraphPad Prism software (version 9; GraphPad, San Diego, CA) was used to generate medians and interquartile ranges for percentage change in AET, number of reflux episodes, and other pH monitoring variables; for GERDQ scores; and to create figures.
RESULTS
Baseline characteristics
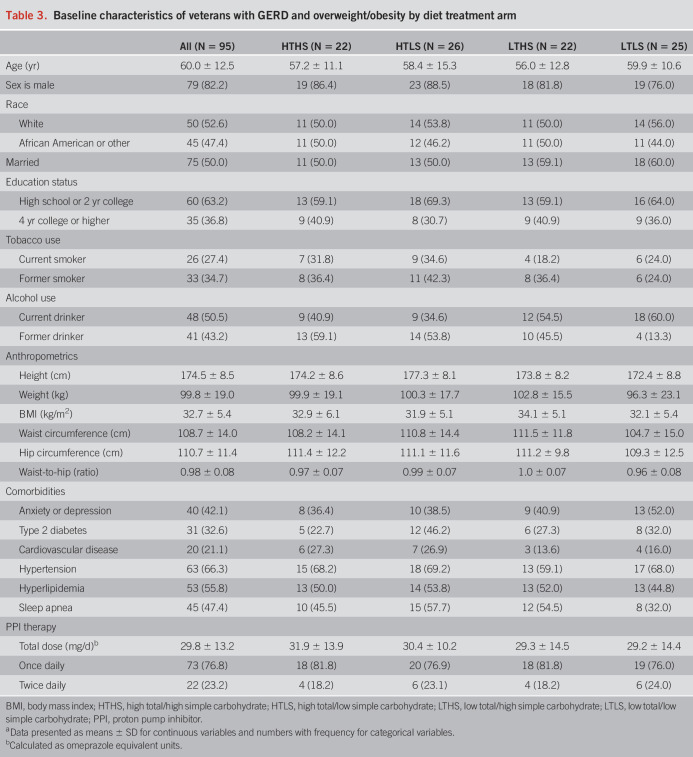
Of the 98 randomized subjects, most were male (82.2%) and approximately half self-identified as White (52.6%) and half as African American (47.4%). Subjects had a mean age of 60.0 ± 12.5 years and a mean BMI of 32.7 ± 5.4 kg/m2 with 34.7% of the subjects in the overweight BMI category and 65.3% in the obese BMI category (Table 3). Two-thirds of the subjects were current or former smokers. At baseline, no significant differences were observed among diet groups for demographic characteristics, anthropometrics, or presence of diagnosed comorbidities. PPI dosage (F = 0.57, P = 0.64), PPI use frequency (χ2 = 1.54, P = 0.67), and over-the-counter antacid medication usage (χ2 = 9.37, P = 0.40) did not differ significantly among diet groups. No subjects were taking histamine 2 receptor antagonists. Manometry showed no significant difference among diet groups for baseline LES pressure (F = 0.407, P = 0.75). Based on recent Lyon consensus criteria (19), baseline pH monitoring showed that 52% of the subjects could be categorized as “pathologic” GERD (AET >6% and ≥ 80 reflux episodes) and 48% of the subjects as “inconclusive” GERD (AET 4%–6% and <80 reflux episodes). There was no significant difference in the proportion of subjects with “pathologic” or “inconclusive” GERD among the 4 diet groups (P = 0.35).
Table 3.
Baseline characteristics of veterans with GERD and overweight/obesity by diet treatment arm
Changes in dietary intakes
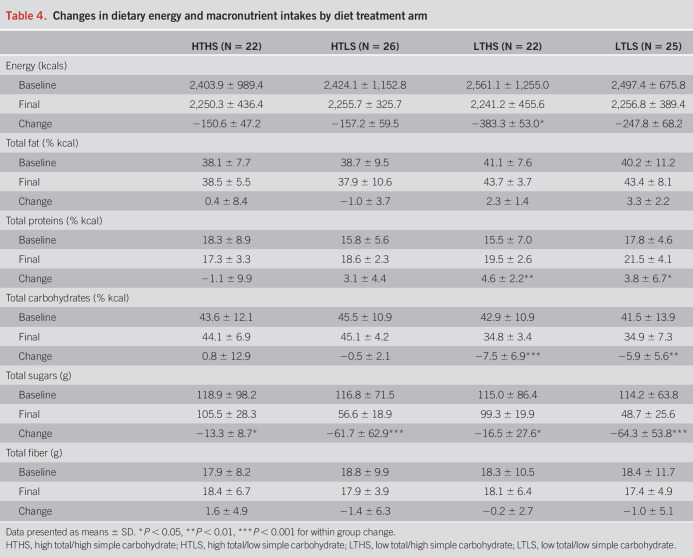
At baseline, there were no significant differences among diet groups for average habitual dietary energy (kilocalories) intakes (F = 0.65, P = 0.58) or macronutrient composition, with average dietary fat comprising 39.3 ± 9.2% of calories, average dietary protein comprising 16.8 ± 6.7% of calories, average total carbohydrate comprising 43.7 ± 11.9% of calories, and average simple sugars intakes at 116.5 ± 80.2 g/d. No significant differences were observed between baseline (habitual) energy or macronutrient composition and diet intervention menus for the HTHS control group (Table 4). Reducing total carbohydrate intake in the LTHS and LTLS groups resulted in an average decrease in total carbohydrates consumed of ∼10% of energy (kilocalories) (Ps < 0.05). Reducing simple sugar intake in the HTLS and LTLS groups resulted in an average decrease in simple sugars consumed of 50–70 g/d (Ps = 0.001).
Table 4.
Changes in dietary energy and macronutrient intakes by diet treatment arm
Changes in weight, anthropometrics, and physical activity
No significant changes were observed from baseline to the end of the diet intervention period in body weight for the HTHS control group (101.4 ± 19.1 vs 100.2 ± 20.2 kg, P = 0.11). Despite menus that incorporated individual caloric goals for weight maintenance, subjects in the 3 diet treatment groups experienced a mild weight loss of 1.5–2 kg over the 9-week diet intervention period (HTLS: 101.4 ± 17.2 vs 99.1 ± 15.8 kg, P = 0.002; LTHS: 102.6 ± 16.2 vs 100.8 ± 16.9 kg, P = 0.03; LTLS: 96.2 ± 23.6 vs 94.4 ± 22.0 kg, P = 0.001). At baseline, the average waist circumference was 108.7 ± 14.0 cm. Consistent with the small amount of weight loss, subjects experienced small reductions in waist circumference of ∼2.5 cm and the waist-to-hip ratio of 0.02 units that were not significantly different among diet groups (P = 0.57 and P = 0.28, respectively). No significant differences among diet groups were observed for household, sports, leisure time, or total physical activity scores at baseline or the end of this study.
Effect of diet intervention on objective ambulatory pH monitoring
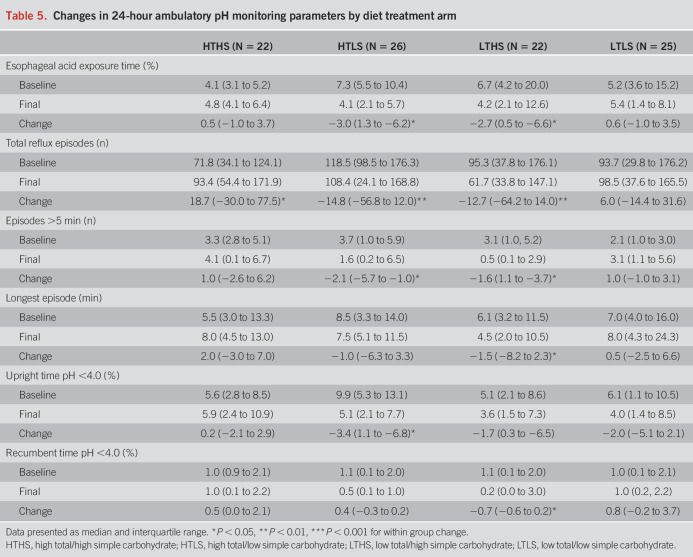
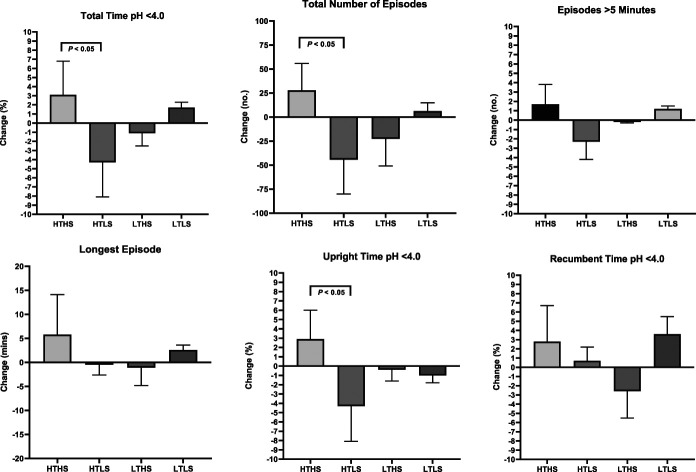
A significant main effect of diet treatment on the primary outcomes of total AET (F = 4.064, P = 0.001) and total number of reflux episodes (F = 9.899, P = 0.003) was observed. The HTLS diet group showed significant reductions in AET, total number of reflux episodes, number of episodes longer than 5 minutes, and upright percentage of time with pH <4.0 (Table 5). The LTHS diet group showed significant reductions in AET, total number of reflux episodes, episodes longer than 5 minutes, longest episode, and recumbent percentage of time with pH <4.0. The reduction in AET that occurred in the HTLS diet group was significantly greater than the change observed in the HTHS control group (HTLS: −4.3% ± 3.8%; HTHS: +3.1% ± 3.7%, P = 0.04; Figure 3). The reductions in AET and total number of reflux episodes observed in the LTHS group were not significantly different from the changes in the HTHS control group. In contrast to the reductions in total AET and total number of reflux episodes observed in the HTLS and LTHS diet groups, the LTLS diet group had a slight increase in AET, increased episodes over 5 minutes, and increased longest reflux episode. However, the changes observed in the LTLS group were not significantly different from the changes in the HTHS control group. Within each of the 4 diet groups, the changes observed in AET or total number of reflux episodes did not differ significantly between subjects categorized as “pathologic” vs “inconclusive” GERD (see Supplementary Table 2, Supplementary Digital Content 1, http://links.lww.com/AJG/C593).
Table 5.
Changes in 24-hour ambulatory pH monitoring parameters by diet treatment arm
Figure 3.
Changes in ambulatory pH monitoring parameters by diet treatment arm.
Effect of diet intervention on subjective GERD symptoms
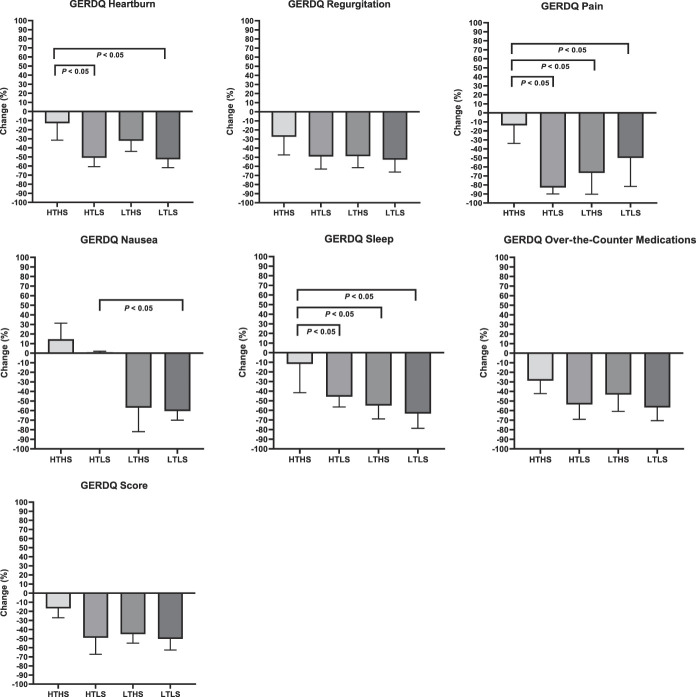
Significant improvements were observed in all diet groups for subjects' ratings for the total GERDQ score (Table 6) and total GSAS score. The improvements in symptom scores were significantly associated with the improvements in primary pH outcomes (change in GERDQ and AET: r = 0.49, P = 0.03; change in GSAS and AET: r = 0.48, P = 0.04). Average total GERDQ score ratings reduced by 19% in the HTHS group, 50% in the HTLS group, 46% in the LTHS group, and 50% in the LTLS group. Average total GSAS score ratings reduced by 42% in the HTHS group, 52% in the HTLS group, 38% in the LTHS group, and 53% in the LTLS group. The improvements in GERDQ and GSAS scores were not statistically different for subjects with “pathologic” vs “inconclusive” GERD in any of the diet groups. As displayed in Figure 4, the HTLS, LTHS, and LTLS groups had significantly greater improvements in several individual components of the GERDQ and GSAS in comparison with the HTHS control group, including the classic GERD symptoms of heartburn and regurgitation. The degree of improvement in subjects' ratings for heartburn and regurgitation were two-fold greater in the diet treatment groups when compared with the improvement in the HTHS control group, with the greatest degree of improvement observed in the HTLS and LTLS groups.
Table 6.
Changes in GERDQ factors and overall GERDQ score by diet treatment arm
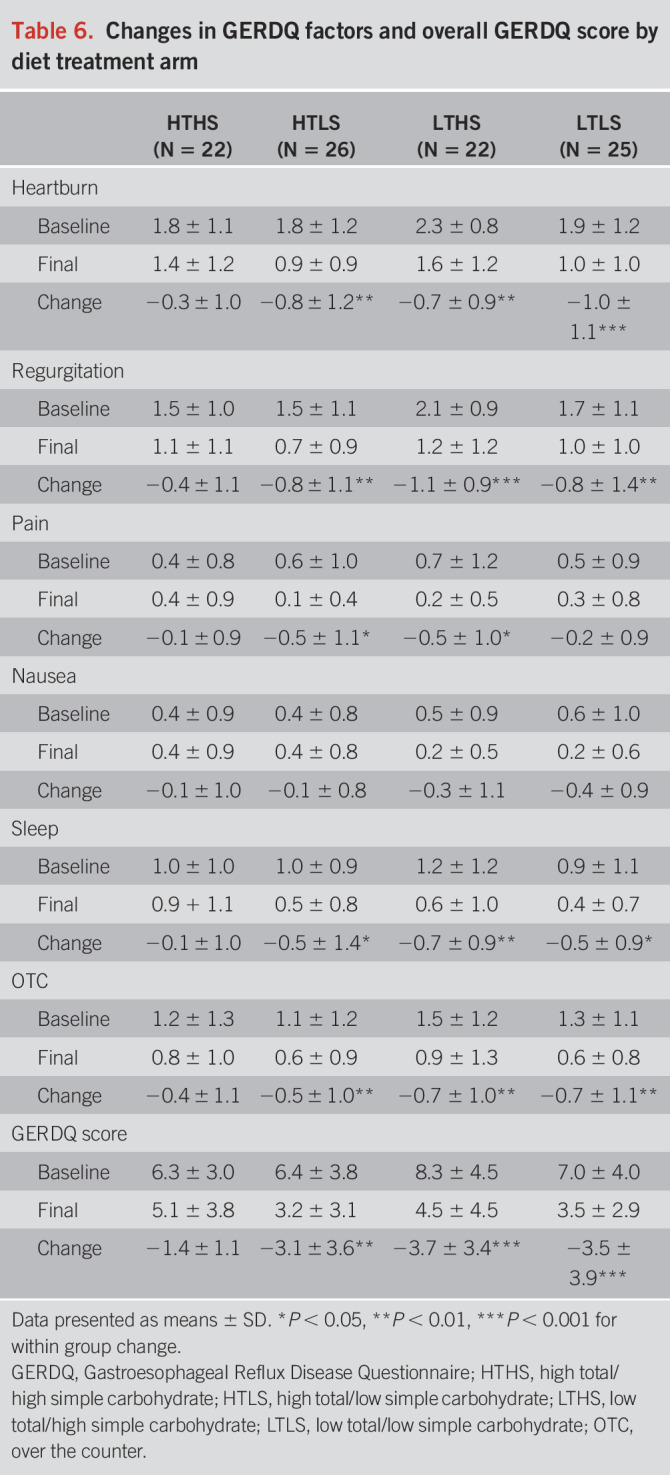
Figure 4.
Changes in GERDQ components by diet treatment arm.
DISCUSSION
In a previous study, we showed that a moderately low carbohydrate diet resolved GERD symptoms and antisecretory medication usage in a prospective cohort of 144 women with obesity after 9 weeks of diet intervention (13). However, this study did not incorporate objective pH monitoring measurements such as esophageal AET and number of reflux episodes. The present randomized, controlled, single-blind, parallel-group study was designed to investigate the effects of modifying both the amount and type of carbohydrate consumed on objective and subjective GERD status over a 9-week diet intervention period. Among the 95 participants overall, there were significant improvements observed from pH monitoring for the primary outcomes of total esophageal AET and total number of reflux episodes. There were also significant improvements observed in episodes longer than 5 minutes, upright percentage of time with pH <4.0, and recumbent percentage of time with pH <4.0 in the 24-hour testing period. Notably, the improvements in the primary outcomes did not differ between subjects categorized as “pathologic” vs “inconclusive” GERD.
The most remarkable finding was a significant difference in the improvement for total esophageal AET between the high total/low simple carbohydrate group and the high total/high simple control group. The critical modification between these 2 groups in their dietary intakes over the 9-week intervention period was a reduction in the daily intake of simple sugars (monosaccharides and disaccharides)—averaging 62 g less per day for the HTLS group. Importantly, there were no differences in the average total carbohydrate, total fat, total protein, or total fiber intake between these 2 diet groups. This finding is especially noteworthy considering the excessively high intake of simple sugars in the typical Western diet, which currently averages ∼140 g per day. It is striking that the rise in the prevalence of GERD over the past 4 decades parallels the increase in the average daily consumption of simple sugars (22,23).
The difference in the effect of the HTLS diet on pH monitoring variables may be best understood in the context of how dietary carbohydrates are sensed in the gastrointestinal track after being enzymatically degraded into monosaccharides (glucose, fructose, or galactose). Although studies with monosaccharides are lacking, a study by Piche et al. (24) demonstrated that proximal colonic infusion of lactose (a disaccharide) increased the number of transient LES relaxations and the proportion of TLESRs associated with reflux. It is plausible that the relationship between carbohydrates and LES tone is mediated by the effects of gut-derived hormones such as ghrelin, gastrin, glucagon, and glucagon-like peptide-1 that are secreted in response to macronutrient intake. Ghrelin, the orexigenic peptide secreted in the stomach, stimulates gastric motility and the secretion of gastric acid by parietal cells (25). Moreover, a synergistic action between ghrelin and gastrin on gastric acid secretion has been shown such that gastrin, produced in response to food in the gastric antrum, may directly stimulate ghrelin release (26). Furthermore, gastrin infusion decreases LES pressure and increases the number of transient LES relaxations associated with GERD (27). Although also released in response to food intake, glucagon-like peptide-1 and glucagon have been shown to inhibit GI motility, thereby delaying gastric emptying (28,29), which would affect the LES tone.
Unexpectedly, the groups with a low total amount of carbohydrate did not show significant differences in the changes over time in total esophageal AET or number of reflux episodes when compared with the HTHS control group. The reasons for this outcome are not entirely clear. We recognize that despite randomization, there was a high degree of variability in both baseline and final values for ambulatory pH monitoring variables in the LTLS group. Such variability likely interfered with detecting significant differences between the LTLS and HTHS control groups. For both the LTHS and LTLS groups, it is possible that the reduction in total carbohydrate was not low enough to observe significant effects. In comparison with our reduction of 10% of energy (kilocalories) from total carbohydrates, the study by Austin et al. (12), which showed a significant reduction in percentage of time with pH <4.0, implemented a severely low carbohydrate diet which would equate to a reduction of greater than 85% of energy (kilocalories) from total carbohydrates. One of the mechanisms driving the impact on total AET with such a severe carbohydrate restriction is a reduction in colonic fermentation of undigested carbohydrates which, if consumed, would produce short chain fatty acids that could promote gastric distension from excess gas production, and thereby, LES relaxation.
Our study was also designed to determine the effects of modifying the amount and type of dietary carbohydrate intake on subjective ratings of the frequency and severity of GERD symptoms. Although other symptom indices are often used during ambulatory pH monitoring periods, their operational utility may not be optimal for reliable assessment of subjects' experiences over the course of a diet intervention (30). Both the GERDQ and GSAS have been used in previous food intake studies (12,31,32). Overall, significant improvements were observed for the ratings of all GERDQ factors, all GSAS factors, and total subjective symptom scores in the HTLS, LTHS, and LTLS diet groups. These improvements in symptom scores in the diet treatment groups were significantly correlated with the improvements in the primary pH monitoring outcomes. By contrast, no significant improvements were reported from subjects in the HTHS control group for any GERDQ items or overall GERDQ score. Although subjects' ratings for the GSAS items of severity of acid taste in the mouth and severity of feeling a lump in the throat improved within the HTHS control group, the improvements in these ratings were significantly less than the changes reported by the LTHS group. Moreover, the HTLS group reported significantly greater improvements in heartburn, severity of pressure or pain in the chest, and sleep disturbance compared with the HTHS control group, and the LTLS group reported significantly greater improvements in heartburn and burping compared with the HTHS control group. Symptom reduction is a powerful end point in GERD treatment because these symptoms negatively affect physical and emotional well-being, quality of life, daily productivity, and healthcare resource utilization (33–35). Notably, symptom resolution robustly associates with overall patient satisfaction (36). Thus, the subjective findings of this study strongly support a role for reducing both amount and type of carbohydrates in the diets of patients with symptomatic GERD.
Although a few previous studies have shown a relationship between reduction in heartburn and reflux symptoms with weight loss (37), these effects were observed when weight loss amounted to at least 10% of baseline body weight and/or a decrease in BMI of at least 2 units (38–40). In this study, the improvements in primary and secondary outcomes were not associated with change in weight or BMI. This is likely because of the amount of weight loss being merely 1–2 kg resulting in a decrease in BMI of less than 1 unit. Given that our DXA data showed no significant change in fat or lean tissue mass, it can be inferred that the minor weight loss observed in this cohort reflects only a loss of extracellular water, which would be expected in a setting where reduced carbohydrate intake would deplete glycogen stores.
The limitations of this study include the preponderance of male subjects, which is reflective of the veteran clinical population. However, there is little published evidence of a difference in the objective or subjective features of GERD in male vs female subjects. Although effects on civilian populations remain unknown, the veteran population has a high proportion of individuals with both obesity and GERD, and thus, the findings may be well applicable to other high-risk groups. It is noteworthy that the prevalence of GERD in the veteran population is 40%–45% compared with ∼30% in the adult civilian population. Another limitation, inherent to all diet intervention trials, is that we do not have complete control over dietary intakes in real-life settings, which makes the true extent of compliance unknown. However, food items were prepared at the Vanderbilt Metabolic Kitchen and provided to subjects to take home, which would increase adherence to the study protocol. In addition, daily menu checklists were collected and reviewed by the study dietitian at in-person visits and the data from the randomly acquired 24-hour recalls showed consistency with the self-administered checklists. Finally, the study design did not include adjunctive methods to complement the outcomes of esophageal AET and total number of reflux episodes, such as mean nocturnal baseline impedance, which may be a better marker for longitudinal esophageal reflux burden (41).
There are several strengths of this study. First, valid and reliable measurements of both objective and subjective GERD status were incorporated. Second, sample size was determined a priori based on our prior data acquired from the local population. Third, subjects were randomized to diet intervention arms that included a control arm, which mimics the habitual energy, total carbohydrate, and simple sugar intakes of the general population. Fourth, menus for the diet arms were calculated using food and nutrient composition software that is based on the USDA National Nutrient Database for Standard Reference. Fifth, foods were portioned and packaged to take home from the Vanderbilt Metabolic Kitchen enabling greater dietary control and participation from the home environment. Finally, we also collected highly detailed data on key potentially confounding factors including demographics, medication use, tobacco use, anthropometrics, physical activity, and comorbidities.
In conclusion, the present randomized controlled trial indicates that key pH monitoring outcomes of esophageal AET and total number of reflux episodes along with the cardinal GERD symptoms of heartburn and reflux can be improved by a moderate modification in dietary carbohydrate intake that targets reducing intake of simple sugars. Importantly, such modification can be achieved in the typical home setting and is likely more feasible than avoidance/elimination diets. Thus, these findings provide a unique and clinically applicable contribution to the limited and somewhat conflicting data existing for efficacious dietary recommendations in the treatment and management of GERD. Moreover, because carbohydrates comprise the majority of ingested energy (kilocalories), reduced intake may also contribute to improving the current obesogenic environment affecting most patients. Future studies may be able to further clarify the underlying physiological mechanisms driving the relationship between dietary carbohydrates and symptomatic GERD and whether similar diet modification could be effective in the prevention of GERD.
CONFLICTS OF INTEREST
Guarantor of the article: Heidi J. Silver, RD, MS, PhD.
Specific author contributions: H.J.S. and K.D.N.: study concept, study design, and funding. T.O., K.L.K., and H.J.S.: protocol implementation. C.G., T.O., and K.L.K.: data acquisition and database entry. C.G. and H.J.S.: statistical analysis. C.G. and H.J.S.: manuscript development. C.G., T.O., M.F.V., K.D.N., and H.J.S.: manuscript revisions and final draft.
Financial support: This study was funded by VA Merit Award #CX001009-05.
Potential competing interests: None to report.
Trail registration: ClinicalTrials.gov NCT02384551.
Study Highlights.
WHAT IS KNOWN
✓ Gastroesophageal reflux disease (GERD) is the most frequent and most costly gastrointestinal disorder.
✓ Dietary recommendations are a component of first-line treatment.
✓ Dietary recommendations typically focus on avoiding or eliminating foods that are perceived to trigger symptoms.
✓ Objective scientific evidence on the impact of foods and nutrients remains lacking.
WHAT IS NEW HERE
✓ This is the first randomized controlled parallel-group study to determine the effects of both the amount and type of carbohydrate on symptomatic GERD.
✓ Ambulatory 24-hour pH monitoring shows that modifying the type of carbohydrate consumed, simple sugars, reduces total acid exposure time and total number of reflux episodes.
✓ Subjective ratings of GERD symptoms, including heartburn and reflux, were also significantly improved by reducing dietary carbohydrate amount and type (simple sugars).
✓ Providing guidance on reducing intake of carbohydrates is a feasible and pragmatic dietary strategy to include in the management of symptomatic GERD.
Supplementary Material
ACKNOWLEDGEMENTS
We thank the veterans for their participation in this study.
Footnotes
SUPPLEMENTARY MATERIAL accompanies this paper at http://links.lww.com/AJG/C592, http://links.lww.com/AJG/C593
Contributor Information
Cihang Gu, Email: cece.cihang.gu@vanderbilt.edu.
Timothy Olszewski, Email: timothy.olszewski@vumc.org.
Michael F. Vaezi, Email: michael.vaezi@vumc.org.
Kevin D. Niswender, Email: kevin.niswender@vumc.org.
REFERENCES
- 1.Sandler RS, Everhart JE, Donowitz M, et al. The burden of selected digestive diseases in the United States. Gastroenterology 2002;122(5):1500–11. [DOI] [PubMed] [Google Scholar]
- 2.Peery AF, Crockett SD, Murphy CC, et al. Burden and cost of gastrointestinal, liver, and pancreatic diseases in the United States: Update 2018. Gastroenterology 2019;156(1):254–72.e11. [DOI] [PMC free article] [PubMed] [Google Scholar]
- 3.Almario CV, Ballal ML, Chey WD, et al. Burden of gastrointestinal symptoms in the United States: Results of a nationally representative survey of over 71,000 Americans. Am J Gastroenterol 2018;113(11):1701–10. [DOI] [PMC free article] [PubMed] [Google Scholar]
- 4.Katz PO, Gerson LB, Vela MF. Guidelines for the diagnosis and management of gastroesophageal reflux disease. Am J Gastroenterol 2013;108(3):308–28; quiz 329. [DOI] [PubMed] [Google Scholar]
- 5.Nebel OT, Castell DO. Inhibition of the lower oesophageal sphincter by fat—A mechanism for fatty food intolerance. Gut 1973;14(4):270–4. [DOI] [PMC free article] [PubMed] [Google Scholar]
- 6.Fox M, Barr C, Nolan S, et al. The effects of dietary fat and calorie density on esophageal acid exposure and reflux symptoms. Clin Gastroenterol Hepatol 2007;5(4):439–44. [DOI] [PubMed] [Google Scholar]
- 7.Pehl C, Waizenhoefer A, Wendl B, et al. Effect of low and high fat meals on lower esophageal sphincter motility and gastroesophageal reflux in healthy subjects. Am J Gastroenterol 1999;94(5):1192–6. [DOI] [PubMed] [Google Scholar]
- 8.Becker DJ, Sinclair J, Castell DO, et al. A comparison of high and low fat meals on postprandial esophageal acid exposure. Am J Gastroenterol 1989;84(7):782–6. [PubMed] [Google Scholar]
- 9.Colombo P, Mangano M, Bianchi PA, et al. Effect of calories and fat on postprandial gastro-oesophageal reflux. Scand J Gastroenterol 2002;37(1):3–5. [DOI] [PubMed] [Google Scholar]
- 10.Penagini R, Mangano M, Bianchi PA. Effect of increasing the fat content but not the energy load of a meal on gastro-oesophageal reflux and lower oesophageal sphincter motor function. Gut 1998;42(3):330–3. [DOI] [PMC free article] [PubMed] [Google Scholar]
- 11.Penagini R. Fat and gastro-oesophageal reflux disease. Eur J Gastroenterol Hepatol 2000;12(12):1343–5. [DOI] [PubMed] [Google Scholar]
- 12.Austin GL, Thiny MT, Westman EC, et al. A very low-carbohydrate diet improves gastroesophageal reflux and its symptoms. Dig Dis Sci 2006;51(8):1307–12. [DOI] [PubMed] [Google Scholar]
- 13.Pointer SD, Rickstrew J, Slaughter JC, et al. Dietary carbohydrate intake, insulin resistance and gastro-oesophageal reflux disease: A pilot study in European- and African-American obese women. Aliment Pharmacol Ther 2016;44(9):976–88. [DOI] [PMC free article] [PubMed] [Google Scholar]
- 14.Marriott BP, Hunt KJ, Malek AM, et al. Trends in intake of energy and total sugar from sugar-sweetened beverages in the United States among children and adults, NHANES 2003–2016. Nutrients 2019;11(9):2004. [DOI] [PMC free article] [PubMed] [Google Scholar]
- 15.Harvey LA. REDCap: Web-based software for all types of data storage and collection. Spinal Cord 2018;56(7):625. [DOI] [PubMed] [Google Scholar]
- 16.Voorrips LE, Ravelli CJ, Dongelmans PCA, et al. A physical activity questionnaire for the elderly. Med Sci Sports Exerc 1991;23(8):974–79. [PubMed] [Google Scholar]
- 17.Conway JM, Ingwersen LA, Moshfegh AJ. Accuracy of dietary recall using the USDA five-step multiple-pass method in men: An observational validation study. J Am Diet Assoc 2004;104(4):595–603. [DOI] [PubMed] [Google Scholar]
- 18.Conway JM, Ingwersen LA, Vinyard BT, et al. Effectiveness of the US Department of Agriculture 5-step multiple-pass method in assessing food intake in obese and nonobese women. Am J Clin Nutr 2003;77(5):1171–8. [DOI] [PubMed] [Google Scholar]
- 19.Gyawali CP, Kahrilas PJ, Savarino E, et al. Modern diagnosis of GERD: The Lyon Consensus. Gut 2018;67(7):1351–62. [DOI] [PMC free article] [PubMed] [Google Scholar]
- 20.Damiano A, Handley K, Adler E, et al. Measuring symptom distress and health-related quality of life in clinical trials of gastroesophageal reflux disease treatment: Further validation of the Gastroesophageal Reflux Disease Symptom Assessment Scale (GSAS). Dig Dis Sci 2002;47(7):1530–7. [DOI] [PubMed] [Google Scholar]
- 21.Jones R, Junghard O, Dent J, et al. Development of the GerdQ, a tool for the diagnosis and management of gastro-oesophageal reflux disease in primary care. Aliment Pharmacol Ther 2009;30(10):1030–8. [DOI] [PubMed] [Google Scholar]
- 22.Yamasaki T, Hemond C, Eisa M, et al. The changing epidemiology of gastroesophageal reflux disease: Are patients getting younger? J Neurogastroenterol Motil 2018;24(4):559–69. [DOI] [PMC free article] [PubMed] [Google Scholar]
- 23.Powell ES, Smith-Taillie LP, Popkin BM. Added sugars intake across the distribution of US children and adult consumers: 1977–2012. J Acad Nutr Diet 2016;116(10):1543–50.e1. [DOI] [PMC free article] [PubMed] [Google Scholar]
- 24.Piche T, Zerbib F, Varannes SB, et al. Modulation by colonic fermentation of LES function in humans. Am J Physiol Gastrointest Liver Physiol 2000;278(4):G578–84. [DOI] [PubMed] [Google Scholar]
- 25.Masuda Y, Tanaka T, Inomata N, et al. Ghrelin stimulates gastric acid secretion and motility in rats. Biochem Biophys Res Commun 2000;276(3):905–8. [DOI] [PubMed] [Google Scholar]
- 26.Fukumoto K, Nakahara K, Katayama T, et al. Synergistic action of gastrin and ghrelin on gastric acid secretion in rats. Biochem Biophys Res Commun 2008;374(1):60–3. [DOI] [PubMed] [Google Scholar]
- 27.Straathof JW, Lamers CB, Masclee AA. Effect of gastrin-17 on lower esophageal sphincter characteristics in man. Dig Dis Sci 1997;42(12):2547–51. [DOI] [PubMed] [Google Scholar]
- 28.Jonderko G, Jonderko K, Golab T. Effect of glucagon on gastric emptying and on postprandial gastrin and insulin release in man. Mater Med Pol 1989;21(2):92–6. [PubMed] [Google Scholar]
- 29.Hellstrom PM, Naslund E, Edholm T, et al. GLP-1 suppresses gastrointestinal motility and inhibits the migrating motor complex in healthy subjects and patients with irritable bowel syndrome. Neurogastroenterol Motil 2008;20(6):649–59. [DOI] [PubMed] [Google Scholar]
- 30.Slaughter JC, Goutte M, Rymer JA, et al. Caution about overinterpretation of symptom indexes in reflux monitoring for refractory gastroesophageal reflux disease. Clin Gastroenterol Hepatol 2011;9(10):868–74. [DOI] [PubMed] [Google Scholar]
- 31.El-Serag HB, Satia JA, Rabeneck L. Dietary intake and the risk of gastro-oesophageal reflux disease: A cross sectional study in volunteers. Gut 2005;54(1):11–7. [DOI] [PMC free article] [PubMed] [Google Scholar]
- 32.Morozov S, Isakov V, Konovalova M. Fiber-enriched diet helps to control symptoms and improves esophageal motility in patients with non-erosive gastroesophageal reflux disease. World J Gastroenterol 2018;24(21):2291–9. [DOI] [PMC free article] [PubMed] [Google Scholar]
- 33.Shaker R, Brunton S, Elfant A, et al. Review article: Impact of night-time reflux on lifestyle—Unrecognized issues in reflux disease. Aliment Pharmacol Ther 2004;20(Suppl 9):3–13. [DOI] [PubMed] [Google Scholar]
- 34.Dean BB, Aguilar D, Johnson LF, et al. Night-time and daytime atypical manifestations of gastro-oesophageal reflux disease: Frequency, severity and impact on health-related quality of life. Aliment Pharmacol Ther 2008;27(4):327–37. [DOI] [PubMed] [Google Scholar]
- 35.Wahlqvist P, Karlsson M, Johnson D, et al. Relationship between symptom load of gastro-oesophageal reflux disease and health-related quality of life, work productivity, resource utilization and concomitant diseases: Survey of a US cohort. Aliment Pharmacol Ther 2008;27(10):960–70. [DOI] [PubMed] [Google Scholar]
- 36.van Zanten SJ, Henderson C, Hughes N. Patient satisfaction with medication for gastroesophageal reflux disease: A systematic review. Can J Gastroenterol 2012;26(4):196–204. [DOI] [PMC free article] [PubMed] [Google Scholar]
- 37.Yadlapati R, Pandolfino JE, Alexeeva O, et al. The Reflux Improvement and Monitoring (TRIM) program is associated with symptom improvement and weight reduction for patients with obesity and gastroesophageal reflux disease. Am J Gastroenterol 2018;113(1):23–30. [DOI] [PMC free article] [PubMed] [Google Scholar]
- 38.de Bortoli N, Guidi G, Martinucci I, et al. Voluntary and controlled weight loss can reduce symptoms and proton pump inhibitor use and dosage in patients with gastroesophageal reflux disease: A comparative study. Dis Esophagus 2016;29(2):197–204. [DOI] [PubMed] [Google Scholar]
- 39.Park SK, Lee T, Yang HJ, et al. Weight loss and waist reduction is associated with improvement in gastroesophageal disease reflux symptoms: A longitudinal study of 15 295 subjects undergoing health checkups. Neurogastroenterol Motil 2017;29(5):13009. [DOI] [PubMed] [Google Scholar]
- 40.Ness-Jensen E, Lindam A, Lagergren J, et al. Weight loss and reduction in gastroesophageal reflux. A prospective population-based cohort study: The HUNT study. Am J Gastroenterol 2013;108(3):376–82. [DOI] [PubMed] [Google Scholar]
- 41.Rengarajan A, Savarino E, Della Coletta M, et al. Mean nocturnal baseline impedance correlates with symptom outcome when acid exposure time is inconclusive on esophageal reflux monitoring. Clin Gastroenterol Hepatol 2020;18(3):589–95. [DOI] [PubMed] [Google Scholar]


