

Abstract
To spread from a localized tumor, metastatic cancer cells must squeeze through constrictions that cause major nuclear deformations. Since chromosome structure affects nucleus stiffness, gene regulation, and DNA repair, here, we investigate the relationship between 3D genome structure and constricted migration in cancer cells. Using melanoma (A375) cells, we identify phenotypic differences in cells that have undergone multiple rounds of constricted migration. These cells display a stably higher migration efficiency, elongated morphology, and differences in the distribution of Lamin A/C and heterochromatin. Hi‐C experiments reveal differences in chromosome spatial compartmentalization specific to cells that have passed through constrictions and related alterations in expression of genes associated with migration and metastasis. Certain features of the 3D genome structure changes, such as a loss of B compartment interaction strength, are consistently observed after constricted migration in clonal populations of A375 cells and in MDA‐MB‐231 breast cancer cells. Our observations suggest that consistent types of chromosome structure changes are induced or selected by passage through constrictions and that these may epigenetically encode stable differences in gene expression and cellular migration phenotype.
Keywords: chromosome spatial compartmentalization, constricted migration, Hi‐C, nuclear lamina, nucleus deformation
Subject Categories: Cancer; Cell Adhesion, Polarity & Cytoskeleton
Repeated migration of cancer cells through constrictions leads to a population of cells with stably altered cellular, nuclear, and migratory phenotypes. These cells have alterations in 3D chromosome organization, including reorganization of chromatin compartments.
Introduction
Despite significant improvements in the diagnosis and treatment of cancer, most patients with advanced metastatic disease face a terminal illness incurable by current therapeutic methods. The dissemination of cancer cells from the primary tumor to colonize to distant sites involves a complex multistep invasion‐metastasis cascade (Chambers et al, 2002; Fidler, 2003; Gupta & Massague, 2006; Lambert et al, 2017). To metastasize, cancer cells must squeeze through constrictions in the extracellular matrix or endothelial lining that are much smaller than their nucleus, causing major nuclear deformations. While the cell membrane and cytoplasm are quite elastic, the size and stiffness of the cell's nucleus makes constricting the nucleus the rate‐limiting step of constricted migration (Friedl et al, 2011; Fu et al, 2012; Wolf et al, 2013; Davidson et al, 2014; Denais et al, 2016; Raab et al, 2016; Irianto et al, 2017b).
Previous work has shown that U2OS cells which repeatedly passed through constrictions showed phenotypic changes and experienced DNA damage that led to changes in the linear genome sequence (Irianto et al, 2017a). However, it is not only the linear genomic sequence that may be affected by such constrictions and in turn influence cellular phenotype. Here, we consider the role of 3D genome structure changes in the process of constricted migration and downstream phenotype alterations. Improving microscopic techniques and the development of chromosome conformation capture approaches have begun to reveal the principles and importance of the 3D folding of the genome (Dekker et al, 2002; Pombo and Dillon, 2015; Rowley & Corces, 2018; Abbas et al, 2019; McCord et al, 2020; Jerkovic & Cavalli, 2021). Chromosomes are folded at different length scales into loops, topologically associating domains (TADs), active and inactive (A/B) compartments, and chromosomal territories. Chromosome regions can be tethered to the nuclear lamina at lamin‐associated domains (LADs), which can help reinforce gene repression (Manzo et al, 2022). These chromosome structures influence other biological processes such as gene regulation, DNA damage repair, and replication timing. Previous work has shown that 3D chromosome organization changes correlate with the progression of cancer (Barutcu et al, 2015; Taberlay et al, 2016; Zhou et al, 2019; Achinger‐Kawecka et al, 2020; San Martin et al, 2022), but how these layers of structure affect or are affected by physical nucleus shape changes such as the kind experienced during constricted migration remains largely unknown.
There are two ways that 3D genome structure changes may be involved in constricted migration: The initial structure of the nucleus may enable some cells to migrate better than others, and/or the constriction itself may induce changes in chromosome structure. Nuclear stiffness and deformability depend on two major components: lamin proteins (Lamin A/C and Lamin B) and chromatin state (Davidson et al, 2014; Harada et al, 2014; Stephens et al, 2017). Lamin A/C expression and its stoichiometric relation to Lamin B contribute to nuclear mechanical properties (Lammerding et al, 2006; Swift et al, 2013; Harada et al, 2014). Decreased expression of Lamin A/C facilitates constricted migration of mouse embryonic fibroblasts (MEFs) while increased Lamin A/C expression inhibits constricted migration of neutrophils (Rowat et al, 2013; Davidson et al, 2014). Similarly, low levels of Lamin A/C are correlated with increased aggressiveness in some cancers (Broers et al, 1993; Wazir et al, 2013), although this is not always the case (Venables et al, 2001; Willis et al, 2008). Chromatin state also influences nuclear physical properties: Increasing heterochromatin increases nuclear stiffness while increasing euchromatin decreases stiffness and increases nuclear deformability (Stephens et al, 2017, 2018). Such global changes in chromatin state can also influence constricted migration. For example, increasing euchromatin or decreasing heterochromatin inhibits melanoma and fibrosarcoma cell migration (Gerlitz & Bustin, 2010; Panagiotakopoulou et al, 2016; Maizels et al, 2017; Segal et al, 2018; Krause et al, 2019). Chromatin decondensation was found to increase breast cancer cell invasion into dense extracellular matrices but decrease invasion into loose matrices (Fischer et al, 2020). The loss of SETDB1 methyltransferase in lung cancer leads to reorganization of heterochromatin and associates with changes in migration (preprint: Zakharova et al, 2021).
Conversely, extracellular physical forces can also affect nuclear mechanics and chromosome structure. Mechanical cues in a cell's environment can lead to a spatial redistribution of chromatin (preprint: Heo et al, 2021). Irreversible stretching of chromatin domains has been observed in some nuclei aspirated into narrow micropipettes (Irianto et al, 2017b), and external cellular forces can even affect gene expression through direct chromatin deformations (Tajik et al, 2016). Some changes have been noted in the 3D genome structures of neutrophils that have undergone constricted migration (Jacobson et al, 2018), and there is evidence that the process of constricted migration itself could alter chromatin modifications (preprint: Hsia et al, 2021).
Despite such connections between chromatin structure, nucleus deformation, and nucleus mechanics, it is not fully understood whether the 3D organization of the genome affects or is affected by constricted migration. In this study, we seek to investigate what 3D genome structures of cancer cells are associated with constricted migration and how these structures relate to gene regulation and cancer cell phenotype.
Here, we use invasive human melanoma cells (A375) to investigate the properties of the nucleus and 3D chromosome structure that accompany constricted migration. We find that A375 cells that have migrated numerous times through tight constrictions show increased migration efficiency and are phenotypically distinct from cells that do not pass through constrictions. These repeatedly constricted cells exhibit specific and stable differences in 3D genome organization, particularly at the level of A/B compartmentalization, Lamin A/C localization, and gene expression patterns. We observe similar trends of 3D genome structure changes across multiple different clonal populations of A375 cells. Some features of these structural changes are conserved in MDA‐MB‐231 breast cancer cells that have undergone constricted migration. Our results suggest that 3D genome architecture correlates with the ability of cancer cells to undergo constricted migration. Our experimental data and modeling suggest that 3D genome and nucleus differences could arise from a combination of selection from an initially heterogeneous cell population and changes induced by constricted migration itself.
Results
Melanoma cells exhibit an increased migration efficiency and differences in cell and nuclear morphology after multiple rounds of constricted migration
Previous work has shown that passage through sequential rounds of constricted migration can lead to cellular and genomic alterations (Irianto et al, 2017a). To investigate potential nucleus and 3D genome alterations associated with constricted migration, we allowed A375 cells to undergo 10 rounds of migration through 5 μm Transwell filters (Fig 1A, Materials and Methods). The starting population of cells which have never undergone constricted migration is referred to as “Control.” The minimum diameter of A375 nuclei ranges from 8 to 16 μm (Appendix Fig S1A), so passing through these 5 μm pores requires nuclear constriction. Cells that successfully migrated through 5 μm constrictions each round were more efficient at migrating in subsequent rounds of the same Transwell assay, reaching 70% migration after 10 consecutive rounds (we refer to cells that have undergone constricted migration through 5 μm pores for 10 rounds as “Bottom‐5”; Fig 1B). In contrast, A375 cells that failed to undergo migration through 5 μm pores showed a progressive decrease in migratory efficiency with each round, approaching 0% migration after 10 consecutive rounds (cells that have not undergone constricted migration through 5 μm pores even after 10 chances to do so are called “Top‐5”; Fig 1B). These differences in migration efficiency correspond to other notable differences in cell phenotype. Phase contrast imaging showed that Bottom‐5 cells exhibit fewer cell–cell adhesions and an elongated cell body when compared with Top‐5 cells (Fig 1B, Appendix Fig S1D). Live cell imaging of Top‐5 and Bottom‐5 cells migrating on a 2D surface showed that Bottom‐5 cells display elongated shapes and frequent extension of protrusions while Top‐5 cells maintained more rounded shapes with ruffled leading edges during a 13‐h migration period (Appendix Fig S1E and Movies EV1 and EV2). The migration efficiency differences in Bottom‐5 cells were maintained even after continuous culture (five passages) or freezing and thawing, indicating that this highly migratory phenotype is stable (Appendix Fig S1F). Similar cellular phenotypes were observed in a sequential constricted migration replicate extended to 20 rounds of migration (we refer to cells that never migrated through 5 μm pores in 20 rounds as Top20‐5 and cells that always passed through as Bottom20‐5, Appendix Fig S1B–D).
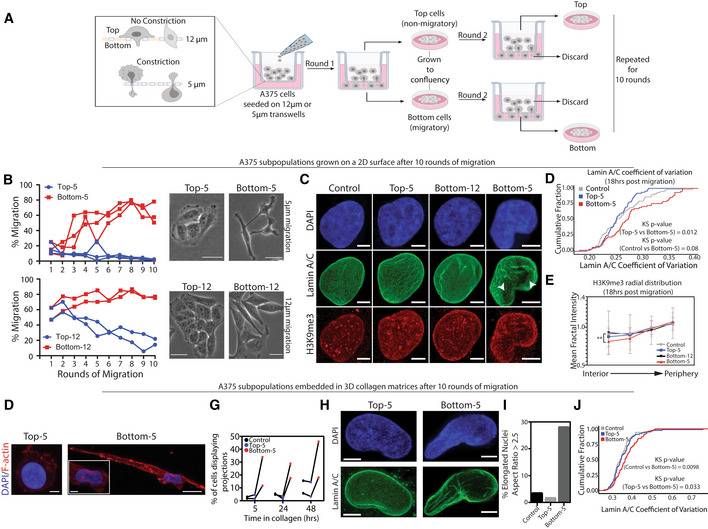
Figure 1. A375 cells exhibit morphological differences and increased migration efficiency after sequential rounds of constricted migration.
-
ALayout of sequential Transwell migration experiment with A375 cells.
-
BMigration efficiency (% of cells that migrated through filter pores in each round) of A375 cells during 5 μm constricted migration and 12 μm migration (left panels). Biological replicates shown. Phase contrast imaging of the final cell populations after the 10 rounds of migration, cells cultured on 2D plastic (right panels, Scale bar = 50 μm).
-
CA375 nuclei stained with DAPI (blue), Lamin A/C (green) and H3K9me3 (red) in the indicated migration conditions. Images shown represent a maximum projection of z‐stacks (Scale bar = 5 μm).
-
DCumulative distribution plot of Lamin A/C coefficient of variation in all indicated A375 conditions (Control (n = 59), Top‐5 (n = 64), Bottom‐5 (n = 62) nuclei). Kolmogorov–Smirnov test P‐values indicated in plot.
-
ERadial intensity distribution of H3K9me3 signal in the maximum projected nuclei of Control (n = 59), Top‐5 (n = 63), Bottom‐5 (n = 64) and Bottom‐12 (n = 80) nuclei (**P = 0.0069, two‐tailed t‐test). Error bars = mean ± SD.
-
FMaximum projection confocal images of Top‐5 and Bottom‐5 cells embedded in collagen and stained with DAPI (blue) and Phalloidin (red). (Inset) Zoom in of nucleus of Bottom‐5 cell. Top‐5 and Bottom‐5 zoomed inset scale = 5 μm; Bottom‐5 zoomed out image scale = 20 μm.
-
GFraction of Control, Top‐5 and Bottom‐5 cells displaying projections at indicated timepoints after cells were embedded in 3D collagen matrices. Each biological replicate is connected by a line.
- H
-
IPercent of cells embedded in collagen that had elongated nuclei (Aspect ratio > 2.5) for A375 Control (n = 54), Top‐5 (n = 52) and Bottom‐5 (n = 53).
-
JCumulative distribution plot of Lamin A/C coefficient of variation for Control (n = 70), Top‐5 (n = 78) and Bottom‐5 (n = 109) cells embedded in 3D collagen matrices. Kolmogorov–Smirnov test P‐values indicated in plot.
Source data are available online for this figure.
To investigate whether the differences we observed were specific to passing through a constriction, we repeated the sequential migration experiment using Transwell filters with pores larger than the majority of A375 nuclei (12 μm). As expected, A375 cells migrated at a much higher rate (~55–70%) in the first round of this large pore Transwell assay (Fig 1B). Cells that were successful at migrating through 12 μm pores for 10 rounds (Bottom‐12) displayed only a minimal increase in migratory efficiency. In contrast, the progressive decrease in migration efficiency of cells that did not pass through the 12 μm pores in each round (Top‐12) suggests that there exists a subpopulation of cells that are generally poor at migration (Fig 1B). While Bottom‐12 cells displayed some loss of cell–cell adhesion, quantification of phase contrast images revealed no statistically significant cell morphology differences between Top‐12 and Bottom‐12 cells (Fig 1B and Appendix Fig S1G–H). When challenged to migrate through 5 μm pores, Bottom‐12 cells showed a migration efficiency similar to the initial Control population (~3–20%). These results indicate that simply being able to migrate is not enough to guarantee efficient migration through constricted spaces, indicating that additional features are associated with constricted migration.
We next evaluated nucleus morphology and Lamin A/C and heterochromatin (H3K9me3) distributions 18 h after sequential constricted migration using immunofluorescence imaging (Fig 1C). We found that sequentially constricted Bottom‐5 cells showed a tendency to have more elongated nuclei compared with control cells or unconstricted Bottom‐12 cells (Fig EV1A and B). No significant differences in the overall intensity of Lamin A/C were observed in Bottom‐5 cells 18 h after constricted migration (Fig EV1C). Earlier timepoints after constricted migration suggested a transient decrease in Lamin A/C intensity (Fig EV1D), but this difference is not stable. Western blots confirmed the lack of change in Lamin A/C protein levels and detected no change in Lamin A/C phosphorylation at Ser22, a modification that can influence the lamina versus nucleoplasmic localization of Lamin A/C (Torvaldson et al, 2015; Fig EV1I and K). Similarly, we found no global change in levels of Lamin B1 or the H3K9me3 heterochromatin mark (Fig EV1J and L). These unchanged Lamin A/C levels echo recent observations reported in mechanically stretched cells (Nava et al, 2020) but are in contrast to other reports that show an association between lower levels of Lamin A/C and increased constricted migration ability (Harada et al, 2014).
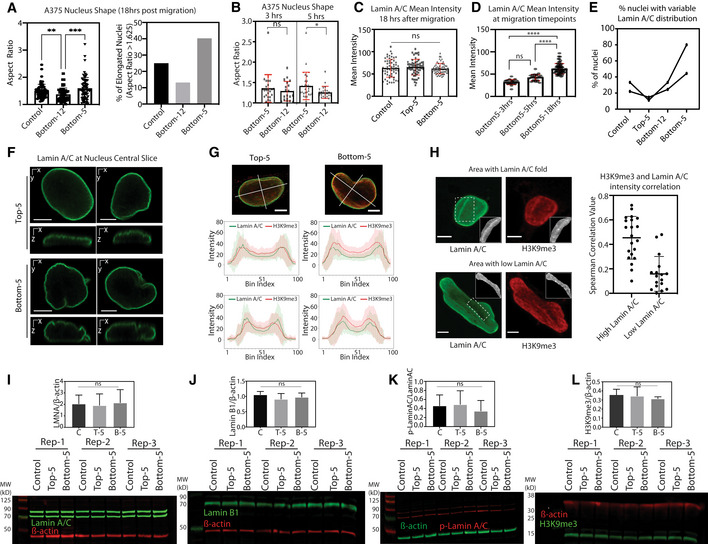
Figure EV1. Changes in nuclear morphology after constricted migration associate with lamin and heterochromatin redistribution.
-
ALeft: Aspect ratio quantification of maximum projection images of A375 nuclei exposed to Transwell migration (**P = 0.0099, ***P = 0.0004, Kruskal–Wallis multiple comparisons test; Control = 68, Bottom‐12 = 53, Bottom‐5 = 72 nuclei). Right: Fraction of A375 nuclei with Aspect ratio > 1.625 (3rd quartile of Control).
-
BNucleus aspect ratio measurements at 3 and 5 h after migrating through 5 μm Transwell pores (Bottom‐5; n = 23 nuclei for 3 h and n = 26 nuclei for 5 h) and 12 μm (Bottom‐12; n = 19 nuclei for 3 h and n = 22 nuclei for 5 h). *P = 0.0241, two‐tailed t‐test.
-
CLamin A/C mean intensity, quantified from maximum projection of immunofluorescence images, in A375 Control, Top‐5, and Bottom‐5 cells (Control = 59, Top‐5 = 64, Bottom‐5 = 62 nuclei). Intensities were compared by Kruskal–Wallis multiple comparisons test.
-
DLamin A/C mean intensity in A375 cells 3, 5 and 18 h after migrating through 5 μm Transwell pores (Bottom‐5; n = 23 nuclei for 3 h, n = 26 nuclei for 5 h, and 53 nuclei for 18 h) (****P < 0.0001, Kruskal–Wallis multiple comparisons test).
-
EFraction of A375 cells displaying irregular patterns of Lamin A/C, defined by visual inspection of confocal images, in Control (n = 59), Top‐5 (n = 63), Bottom‐12 (n = 80) and Bottom‐5 (n = 64) cells. Two biological replicates shown in the figure; lines connect A375 conditions within the same replicate.
-
FCentral orthogonal slices of Lamin A/C stained nuclei in Top‐5 and Bottom‐5 cells (scalebar = 5 μm).
-
GIntensity line scans across major and minor axes of Lamin A/C and H3K9me3 central slices in A375 Top‐5 (n = 63) and Bottom‐5 (n = 64) nuclei. Error bars = mean ± SD (scalebar = 5 μm).
-
HCorrelation of pixel intensities between Lamin A/C and H3K9me3 in Bottom‐5 cells. Left: Examples of Lamin A/C and H3K9me3 correlation with (top) or without (bottom) Lamin A/C enrichment. Areas used to calculate Spearman correlations between Lamin A/C and H3K9me3 intensity indicated with dotted outline and in grayscale inset. Right: Spearman correlation values between Lamin A/C and H3K9me3 across 20 nuclear areas with high Lamin A/C intensity (stripes) and 18 nuclear areas low in Lamin A/C (scalebar = 5 μm).
-
I–LWestern blot analysis of A375‐Control, Top‐5 and Bottom‐5 cells probing for Lamin A/C (I), Lamin B1 (J), phospho‐Lamin A/C (Ser22) (K) and H3K9me3 (L). Quantification shown above each blot. No significant differences found in pairwise comparisons by two‐tailed t‐test. Mean ± SD indicated for the three biological replicates.
Data information: (A–D, H) Data are shown as mean ± SD. Nuclei quantified are from a single biological replicate of each experiment. Source data are available online for this figure.
Nucleus morphology differences associate with redistribution of Lamin A/C and heterochromatin in sequentially constricted melanoma cells
Despite the lack of significant changes in overall Lamin A/C levels, we did observe a stable difference in the distribution of Lamin A/C within the nuclear lamina after constricted migration. A375 Control, Top‐5, and Bottom‐12 nuclei showed a fairly even distribution of Lamin A/C throughout the nuclear envelope, while Bottom‐5 nuclei displayed areas of stronger Lamin A/C enrichment or depletion, as well as nuclear envelope invaginations and wrinkling (Figs 1C and EV1E and F, Movies EV3 and EV4). The extent to which a nucleus exhibits a variable Lamin A/C intensity can be quantified using the coefficient of variation (CV; standard deviation/mean) of the Lamin A/C intensity values across each nucleus. Bottom‐5 nuclei exhibited a higher Lamin A/C CV than Top‐5 (Fig 1D). Line scans across central slices of nuclei also suggested that Bottom‐5 cells have reduced Lamin A/C along their minor axis (narrower dimension) than Top‐5 cells (Fig EV1G). These alterations in lamin distribution are reminiscent of previously described redistribution of lamins as a consequence of nuclear deformation (Pfeifer et al, 2018).
The distribution of heterochromatin is also altered in A375 cells that have undergone constricted migration. Heterochromatic foci, as measured by H3K9me3 immunofluorescence, were distributed throughout the nucleus in Control, Top‐5, and Bottom‐12 cells while a larger proportion of H3K9me3 signal was localized to the nuclear periphery in Bottom‐5 cells (Figs 1C and E, and EV1G). This H3K9me3 at the periphery was correlated with the high‐intensity Lamin A/C stripes described above (Fig EV1H), likely reflecting heterochromatin tethering to the nuclear lamina through Lamin A/C (Solovei et al, 2013; Manzo et al, 2022).
When embedded in 3D collagen matrices, Bottom‐5 cells displayed more projections (Fig 1F and G) accompanied by more nuclear deformations than Control or Top‐5 cells (Fig 1H and I, Movies EV7 and EV8). Live cell imaging in collagen showed that Bottom‐5 cells were more likely to invade through the collagen while Top‐5 cells remained more stationary (Movies EV5 and EV6). In this 3D collagen context, Bottom‐5 cells also showed a more variable Lamin A/C distribution (Fig 1J).
Migration efficiency and nucleus morphology differences after sequential migration in aggressive breast cancer cells (MDA‐MB‐231)
To evaluate the impact of cancer cell type on our constricted migration observations, we repeated the sequential migration and imaging experiments in MDA‐MB‐231 breast cancer cells (Fig EV2). These cells exhibited a higher initial ability to migrate through 5 μm constrictions (~35%) than A375 cells, so the increase in migration efficiency over sequential rounds of migration was visible, but not as dramatic (Fig EV2A, left panel). When challenged to migrate through large 12 μm pores, MDA‐MB‐231 Top‐12 and Bottom‐12 cells showed no significant separation in their migratory efficiency (Fig EV2A, right panel), in contrast to A375 cells. This indicates that there is less initial heterogeneity among the MDA‐MB‐231 cells in their ability to migrate.
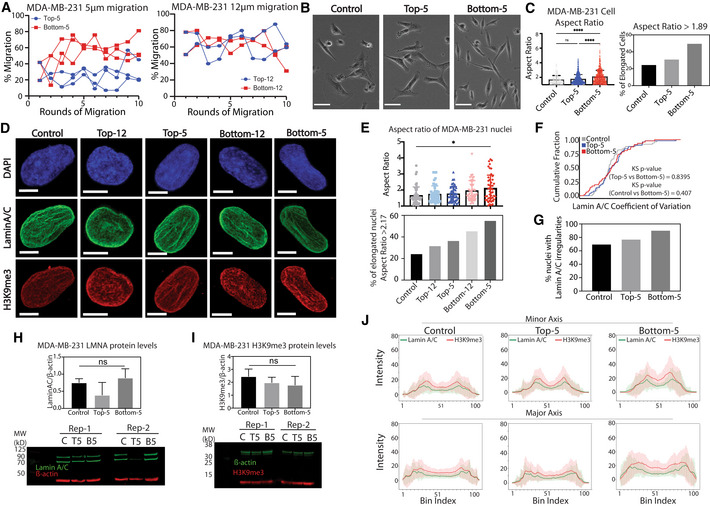
Figure EV2. Sequential rounds of constricted migration in MDA‐MB‐231 cells.
-
ATranswell migration efficiency of MDA‐MB‐231 cells through 5 and 12 μm pore sizes for 10 Transwell migration rounds. Biological replicates shown.
-
BPhase contrast images of MDA‐MB‐231 cell subpopulations. Scale bars = 50 μm.
-
CLeft: Aspect ratio of MDA‐MB‐231 cells for Control (n = 142 nuclei), Top‐5 (n = 393 nuclei) and Bottom‐5 (n = 621 nuclei) (****P < 0.0001; Kruskal–Wallis multiple comparisons test). Right: Fraction of MDA‐MB‐231 cell subpopulations with an aspect ratio > 1.89 (3rd quartile of Control).
-
DMaximum projected images of MDA‐MB‐231 nuclei immunostained with DAPI (blue), Lamin A/C (green) and H3K9me3 (red). Scale bars = 5 μm.
-
ETop: Aspect ratio of MDA‐MB‐231 nuclei in Control (n = 49), Top‐12 (n = 47), Top‐5 (n = 49), Bottom‐12 (n = 46) and Bottom‐5 (n = 47) (*P = 0.015; Kruskal–Wallis multiple comparisons test). Bottom: Fraction of MDA‐MB‐231 nuclei that have an aspect ratio > 2.17 (3rd quartile of Control).
-
FCumulative distribution plot of Lamin A/C coefficient of variation in Control, Top‐5 and Bottom‐5 MDA‐MB‐231 cells. Number of nuclei quantified remains the same as in (E). KS‐test shows no significant difference between conditions.
-
GFraction of MDA‐MB‐231 nuclei displaying irregularities in Lamin A/C distribution by visual inspection of confocal images.
-
H, IWestern blot analysis and quantification of MDA‐MB‐231 Control, Top‐5 and Bottom‐5 cells probing for Lamin A/C and H3K9me3. Error bars = mean ± SD of two biological replicates. No significant differences found in pairwise comparisons by two‐tailed t‐test.
-
JLine scan intensity for H3K9me3 (red) and Lamin A/C (green) across major and minor axis of central slice images of MDA‐MB‐231 cells. Number of nuclei quantified remains the same as in (E). Error bars = mean ± SD.
Data information: Nuclei quantified are from a single biological replicate of each experiment. Source data are available online for this figure.
Indeed, whether or not they have undergone constricted migration, MDA‐MB‐231 cells exhibited elongated cell bodies, low cell–cell adhesions, and elongated nuclei (Fig EV2B). However, like A375 cells, a higher fraction of MDA‐MB‐231 cells that underwent constricted migration for 10 rounds (Bottom‐5) showed elongated cell bodies and further elongation of their nuclei compared with Control or Bottom‐12 (Fig EV2C–E). These observations coincide with previous reports that elongated cell and nuclear shape correlated with higher migration propensity in MDA‐MB‐231 cells (Baskaran et al, 2020). As in A375 cells, the increased migratory efficiency of MDA‐MB‐231 Bottom‐5 cells was not related to a change in overall Lamin A/C or H3K9me3 protein levels (Fig EV2H–I). Differences in Lamin A/C distribution in MDA‐MB‐231 cells were more subtle than in A375 cells. No significant differences were observed in Lamin A/C intensity variation (Fig EV2F), but a higher fraction (90%) of Bottom‐5 cells displayed visibly wrinkled nuclei compared with Control and Top‐5 (75–80%, Fig EV2G). Like A375 cells, MDA‐MB‐231 Bottom‐5 cells have a higher H3K9me3 intensity at the nuclear periphery across the major and minor axis when compared with Control and Top‐5 cells (Fig EV2J).
In both of these cancer cell types, constricted sequential migration can result in a more highly migratory subpopulation that exhibits some nucleus morphology changes and differs in the distribution, but not the levels of Lamin A/C and H3K9me3. Given the role of lamins and heterochromatin in organizing the 3D genome structure, we next asked whether differences are found in the 3D organization of chromosomes in sequentially constricted cells.
Chromosome spatial compartment changes after rounds of constricted migration
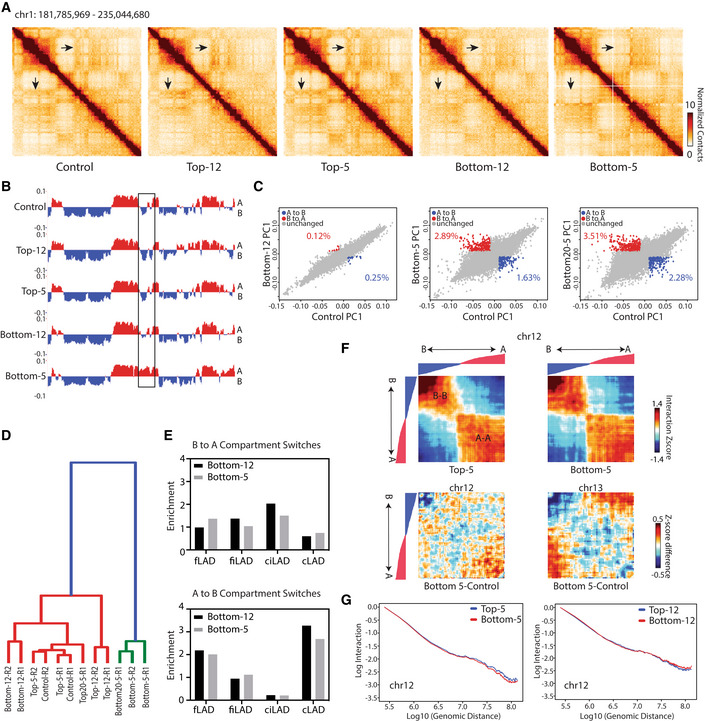
To measure changes in chromosomal contacts in A375 cells, we performed genome‐wide chromosome conformation capture (Hi‐C) on all subpopulations of sequential constricted and unconstricted migration conditions (Materials and Methods, Appendix Table S1). Strikingly, using 250 kb binned matrices, we observed regions of the genome that had a different pattern of interactions in Bottom‐5 cells compared with all other conditions (Fig 2A, example indicated by black arrows). Since these changes primarily affected the plaid pattern that indicates spatial compartmentalization, we performed principal component analysis (PCA) to classify regions according to their A/B compartment identity. We identified regions of the genome that have a consistent compartment identity among all unconstricted conditions (Control, Top‐12, Top‐5, Bottom‐12) but have a different compartment identity in Bottom‐5 cells (Fig 2B, boxed region, for example). At a stringent threshold (see Materials and Methods), we observed that 2.89% of 250 kb regions across the genome switched from the B (typically more heterochromatic) to A (typically more euchromatic) compartment, and 1.63% of the bins switched from the A to B compartment in sequentially constricted Bottom‐5 cells compared with Control (Fig 2C, middle panel). Cells that migrated through large pores (Bottom‐12) show a minor shift in the compartment eigenvector in some of these regions (Fig 2B and Appendix Fig S2C), but overall have 10‐fold fewer compartment switches than constricted cells (Fig 2C, left panel). These compartment switches are reproduced in two biological replicates of the 10 rounds of migration and also in an independent experiment in which we extended migration through 5 μm pores to 20 rounds (Bottom20‐5) (Appendix Fig S2B and C). Some regions (0.5% of bins) had a different compartment identity in cells that were unable to migrate even through large pores (Top‐12) indicating that there may be a distinct epigenetic structure of nonmigratory cells as well (Appendix Fig S2A). Overall, genome‐wide hierarchical clustering analysis of the compartment eigenvectors segregates conditions according to whether they have undergone constricted migration (Fig 2D).
Figure 2. Compartment identity switches after constricted migration.
-
A250 kb binned Hi‐C interaction heatmaps of chr1 (chr1:181,785,969–235,044,680) across A375 conditions. Arrows: locations of visible difference in Bottom‐5 contact maps.
-
BPC1 track of compartment identity (250 kb bins) in the same region of chr1. Boxed region highlights the same compartment switch highlighted by arrows in (A).
-
CCompartment PC1 value comparisons for each bin genome wide in Bottom‐12 (left), Bottom‐5 (middle) and Bottom20‐5 (right) versus Control. Percentage of bins that met criteria for “compartment switch” from B to A (red; PC1 < −0.01 to > 0.01) or A to B (blue; PC1 > 0.01 to < −0.01) indicated on each panel.
-
DClustering of all A375 conditions by genome‐wide compartment PC1. R1 and R2 indicate biological replicates.
-
EEnrichment of different LAD types in regions that switch their compartments from B to A and A to B in Bottom‐5 and Bottom‐12 cells.
-
FAbove: chr12 saddle plots for Top‐5 and Bottom‐5 conditions show interaction Z‐score (normalized by generic distance decay) between all bin pairs that do not switch compartments, sorted by Control compartment PC1 value from strongest B‐B to strongest A‐A. Below: change in interaction Z‐score from Control to Bottom‐5 conditions for chr12 (left) and chr13 (right). Track above heatmaps = ordered PC1 values of A375 Control cells.
-
GWhole genome contact scaling plots over distance for chr12 at 250 kb bin size for both 5 μm and 12 μm Transwell migration. Unless indicated otherwise, all Hi‐C data are presented from the pooling of two biological replicates.
Since compartmentalization involves the spatial segregation of heterochromatin and euchromatin, these changes may relate to our microscopic observations of increased H3K9me3 peripheral localization after constricted migration (Fig 1). To investigate this link further, we quantified whether genomic regions that change compartment identity in Bottom‐5 cells correspond to certain lamin‐associated domain (LAD) types, as described in a previously established LAD atlas across a cohort of nine different cell types (Kind et al, 2015; Carolyn de Graaf et al, 2019). We observed that while B to A switches were fairly evenly distributed across LAD types, A to B switches tended to occur in facultative LADs (fLADs and fiLADs; regions that vary in their lamin association across cell types) and constitutive LADs (cLADs; regions found at the lamina in most cell types; Fig 2E). This suggests a possible further spatial consolidation of heterochromatin regions corresponding to the observed coalescence of H3K9me3 at the nuclear periphery.
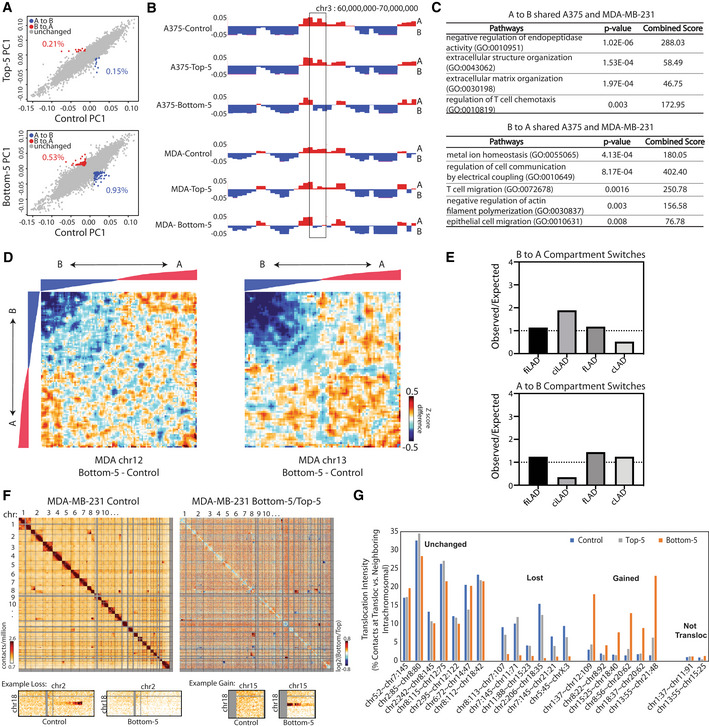
Just as the cellular morphology changes in MDA‐MB‐231 cells after constricted migration are less dramatic than in A375 cells, this cell type also shows fewer compartment switches with sequentially constriction than the A375 cells did (Fig EV3A). The initial genome structures of these different cancer cell lines are quite different, so we would not expect compartment changes to occur in the exact same locations. However, we do observe 79 bins that switch from A to B and 36 bins that switch from B to A in both A375 and MDA‐MB‐231 constricted migration (Fig EV3B and E). Interestingly, some of these commonly switched regions contain genes relevant to migration‐related phenomena, including extracellular matrix organization, actin filament polymerization, and chemotaxis (Fig EV3C).
Figure EV3. Constricted migration is associated with genome structure differences in MDA‐MB‐231 cells.
-
AScatterplots of PC1 compartment eigenvector values show compartment changes (red = B to A and blue = A to B) between Control MDA‐MB‐231 cells and either Top or Bottom cells from 10 rounds of 5 μm Transwell migration.
-
BPC1 compartment track (250 kb bins) in A375 and MDA‐MB‐231 cells. Box highlights example region that switches from A to B compartment in both A375 and MDA‐MB‐231 cells in 5 μm constricted migration.
-
CPathway analysis of genes found within the compartment switch regions shared between A375 and MDA‐MB‐231.
-
DCompartmentalization saddle plots of chr12 (left) and chr13 (right) display interaction Z score differences between Bottom‐5 versus Control MDA‐MB‐231 cells. 250 kb bins, excluding those that show compartment changes, are sorted by MDA‐MB‐231 Control PC1 values.
-
EEnrichment of different LAD types in regions that switch compartments in Bottom‐5 MDA‐MB‐231 cells compared to Control. Dotted line indicates value at which observed fraction of compartment switches matches expected.
-
FWhole genome 2.5 Mb Hi‐C interaction frequency maps for MDA‐MB‐231 Control (left) and log2 ratio of MDA‐MB‐231 Bottom‐5/Top‐5. Lower panel heatmaps display zoom‐in of regions with altered translocation signals.
-
GTranslocation intensities for translocations maintained, lost after constricted migration, or gained after constricted migration. “Not transloc” shows the calculated intensity for a control nontranslocated interchromosomal region. See Materials and Methods for calculation details.
Weaker B compartment interactions and increased intercompartmental interactions are a conserved feature of constricted cells
While the switching of compartment identity after constricted migration is a striking phenomenon, and clearly apparent by visual inspection of the contact maps, only ~4.5% of the genomic bins were affected by a complete compartment switch in A375 cells according to our thresholds. To evaluate how constricted migration may impact the rest of 3D genome, we evaluated contacts between regions not involved in compartment identity switches using “saddle plots,” ordering regions from strongest B to strongest A bins based on PC1 values (Imakaev et al, 2012). We observed an evident contact separation between the B and A compartment both with and without constricted migration (Fig 2F). However, the relative strength of inter‐ and intracompartment contacts changed in migrated cells. Bottom‐5 cells exhibited a loss in the strongest B‐B interactions and an overall increased mixing of the strongest B and strongest A compartments (Fig 2F, bottom panels). In unconstricted migration, we see apparent overall loss of compartment strength (Appendix Fig S2D), although this effect on both compartments could also be explained by the overall higher background noise in this condition.
In contrast to these changes in interaction strength within and between compartments, we overall observed negligible changes in the chromosome contact scaling with distance after migration (Fig 2G). This interaction scaling reflects local chromatin compaction and average loop size and density. Furthermore, we observed no clear differences between TAD boundary strength in any of the conditions (Appendix Fig S2E). These observations suggest that the major differences with constricted migration occur in larger scale rather than smaller‐scale chromosome structures and are in line with previous reports that compartment‐scale interactions can change independently from TAD‐scale contacts (Nuebler et al, 2018).
Interestingly, we saw a similar compartment strength effect in MDA‐MB‐231 cells that have undergone sequential migration through constriction. MDA‐MB‐231 Bottom‐5 cells lose strong B compartment interactions while gaining interactions between the A and B compartment (Fig EV3D). This loss of interactions in the B compartment was also previously reported in neutrophils after passage through small pores, suggesting it may be a general feature of constricted migration chromosome structural changes (Jacobson et al, 2018).
Gene expression changes after constricted migration reflect migratory potential
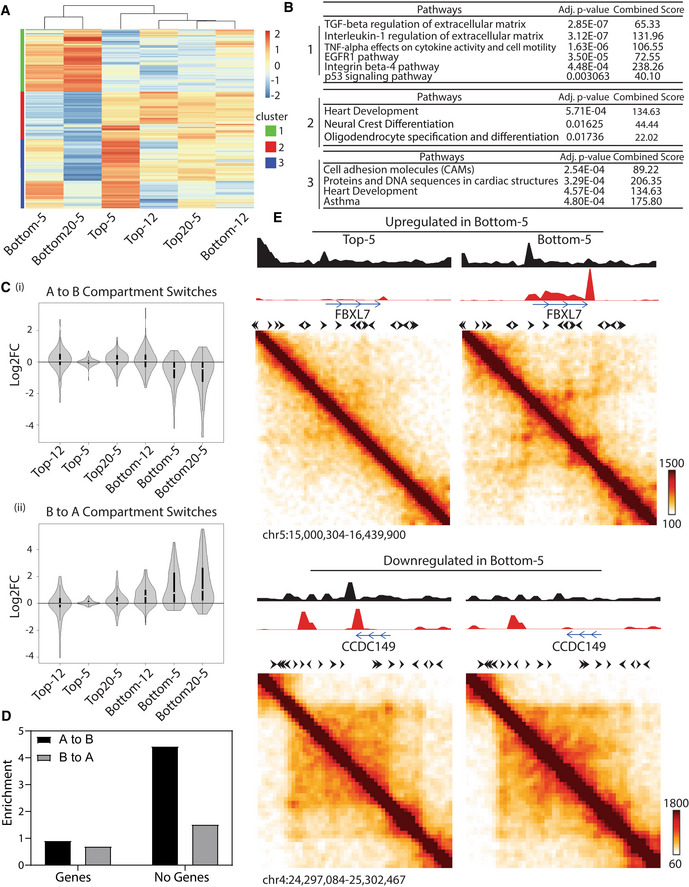
Since spatial compartmentalization generally correlates with gene expression, we next investigated potential differences in gene expression in cells that have undergone constricted migration. We performed RNA‐Seq on all A375 subpopulations. We identified 977 and 1,473 genes that were differentially expressed in Bottom‐5 and Bottom20‐5 relative to Control, respectively (Appendix Table S2). Hierarchical clustering of all conditions, starting with the subset of genes differentially expressed in Bottom‐5 or Bottom20‐5, segregated cells that undergo constricted migration from all other conditions (Fig 3A and Appendix Fig S3A). The 482 genes that were upregulated in Bottom‐5 and Bottom20‐5 and downregulated in other conditions are enriched in pathways related to metastasis, such as TGF‐beta, TNF‐alpha, EGFR, and integrin β‐4 signaling pathways (Fig 3B). On the contrary, the 368 genes downregulated in Bottom‐5 and Bottom20‐5 but upregulated in other conditions are enriched in developmental pathways. Since melanoma cells originate from the neural crest, this cluster may relate to downregulation of melanocyte‐specific gene expression in constricted migrating cells (Fig 3B). We also observe downregulation of a group of genes important for cell–cell/matrix adhesion (CADM3, CADM1, and ITGA9). A third cluster of genes, downregulated in Bottom20‐5 and upregulated in Top‐5, are involved in cell adhesion, which correlates with the differences we observed in cell–cell contacts between these subsets (Fig 1C).
Figure 3. Changes in gene expression correlate with metastatic ability and chromosome structure changes.
-
AHierarchical clustering of RNA‐Seq datasets based on differentially expressed genes of Bottom‐20 cells relative to Control (Log2 fold change > 1, determined by the analysis of two biological replicates). Color scale indicates log2 (Condition/Control) expression for each gene.
-
BPathway enrichment analysis of identified gene clusters from (A) using BioPlanet 2019 package from Enrichr.
-
CLog2FC of expression in the indicated condition versus Control for genes located in regions that switch compartments from A to B (top panel; 301 genes) and B to A (bottom panel; 230 genes) in Bottom‐5 cells. White circles indicate median, black box indicates 25th to 75th percentile and lines indicate data range. Violin shape represents data distribution.
-
DBins involved in compartment switches were classified as either containing or not containing annotated transcripts and then the Observed fraction in each category was compared to the Expected representation in a randomly selected set.
-
EContact maps of regions around genes upregulated (FBXL7) and downregulated (CCDC149) in Bottom‐5 cells. Tracks over the matrices represent ATAC‐Seq (black) and RNA‐Seq (red). The tracks have been smoothed with a 40 kb sliding window, 20 kb step. Black arrows indicate known CTCF motif directionality.
When we specifically compared constricted versus unconstricted migration (Bottom‐5 vs. Bottom‐12), we found genes more highly expressed in constricted cells are related to focal adhesion pathways and regulation of the actin cytoskeleton (Appendix Fig S3B). These gene changes may relate to the increase in protrusions and elongated cell shape observed for Bottom‐5 cells in Fig 1 and Appendix Fig S1. We also observed a differential gene expression signature for Top12 cells, which did not migrate even through large pores, relative to the rest of the A375 population. The majority of genes downregulated in Top‐12 cells were related to TGF‐beta, EGFR, integrin, and p‐53 signaling, all pathways related to cancer cell migration and metastasis (Appendix Fig S3B).
These gene expression changes correlate with compartment changes observed upon constricted migration. Genes found in regions that switched their compartment identity from A to B in Bottom‐5 cells displayed an overall decrease in expression while genes in regions that switched from B to A tended to show increased expression when compared with other conditions (Fig 3C). Even in regions that did not switch compartments, we found that changes in interaction strength within compartments also correlated with changes in gene expression in Bottom‐5 cells (Appendix Fig S3D). Genes in regions that exhibited B‐B interaction loss in Bottom‐5 cells showed an overall increase in expression in these cells. These observations suggest that some of the compartment changes associated with constricted migration relate to changes in gene regulation.
Gene expression changes do not account for all compartment changes, however. Notably, we found that among the genomic bins that switched compartments, a larger than expected fraction contain no genes (fourfold and twofold enrichment over random expectation for A to B and B to A, respectively; Fig 3D). This observation suggests that some structural changes after migration are not directly related to gene regulation changes.
We next examined whether observed gene expression changes relate to local genome structure changes. At highly upregulated genes such as the FBXL7 gene (~ 8‐fold upregulated in Bottom‐5 and Bottom20‐5), we observed the emergence of a domain‐like structure in Bottom‐5 cells and an increase in chromatin accessibility (Fig 3E, top panel). Conversely, genes that were downregulated after constricted migration often showed a loss of loop structures and chromatin accessibility (SOD3 and CCDC149 3–15 fold downregulated; Fig 3E, bottom panel). However, we also encountered cases in which the genes were differentially expressed such as PLEKHA6 (log2FC > 2 in Bottom‐5 and Bottom20‐5) and PKDCC (log2FC = −2.5 in Bottom‐5 and Bottom‐20), but their local genomic structures remained similar with modest changes in chromatin accessibility (Appendix Fig S3C). The loss or formation of loops or domains associated with changes in transcription occurred in regions that had few or no other strong architectural loops, such as the kind mediated by CTCF. Genes that changed expression without notable 3D looping changes, in contrast, were located in regions with many other loops and TAD boundaries. These observations support the idea that transcription‐driven domains can arise separately from CTCF‐based domains (Rowley et al, 2017; Zhang et al, 2020). Furthermore, the transcription‐associated CCDC149 loop occurs between an existing TAD boundary and a promoter, and could be explained by a collision between opposing direction loop extrusion and RNA polymerase activity, as suggested in other systems (Brandao et al, 2019).
Previous work has observed gene expression changes induced by mechanical stress, such as stretching (Le et al, 2016; Nava et al, 2020). We observed little correlation between differentially expressed genes in cells that have undergone constricted migration and cells that have been mechanically stretched (Appendix Fig S3E). This points to differences between a cell being passively deformed and one that is actively coordinating its own migration through a tight constriction.
Altered translocations and copy number variation after constricted migration
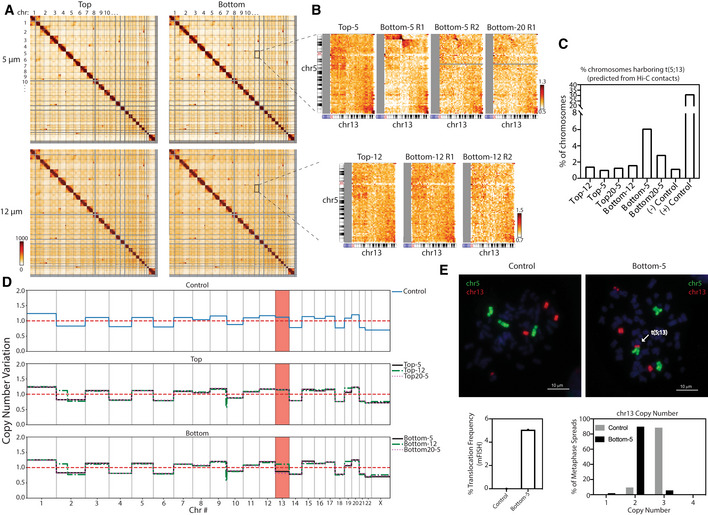
Constricted migration has previously been shown to result in DNA damage and genome instability (Irianto et al, 2017a). Since Hi‐C can detect structural aberrations such as translocations, we examined interchromosomal interactions in 2.5 Mb binned matrices to search for potential genomic aberrations after constricted migration (Fig 4).
Figure 4. Global genomic rearrangements after constricted migration.
-
AWhole genome 2.5 Mb Hi‐C interaction frequency maps for cells that have undergone 5 and 12 μm Transwell migration.
-
BZoom‐in of interchromosomal interactions between chr5 and chr13 for cells that have undergone 5 and 12 μm Transwell migration. All biological replicates performed are shown for Bottom‐5 and Bottom‐12.
-
CEstimation of the % of chromosomes bearing the t(5;13) based on the frequency of the proposed translocation interaction divided by the average neighboring bin cis interactions.
-
DCopy number variation among all A375 subtypes inferred from total raw Hi‐C counts. Red dashed line represents the mean copy number level while the other lines represent the copy number of A375 cell subpopulations. The region highlighted in red shows that chr13 exhibits copy number loss after 10 rounds of constricted migration.
-
EMetaphase spread labeled with chromosome specific FISH probes for chr5 (green) and chr13 (red). Bottom graphs represent frequency of t(5,13) quantified by FISH (left) and copy number quantification for chr5 and chr13 (right). n = 1,328 Control and 2,370 metaphases analyzed for Bottom‐5 (Scale = 10 μm).
Translocations inherent to A375 are present in all subpopulations of cells (Fig 4A). However, a new translocation between chr5 and chr13 (t(5;13)) was evident in each replicate of cells that had undergone constricted migration (Bottom‐5 and Bottom20‐5) but not unconstricted migration (Fig 4B). The specific breakpoint region of this translocation, as detected by a dramatic change in Hi‐C contacts between chr5 and chr13 (Appendix Fig S4A), falls in a gene poor region of both chromosomes. Using Hi‐C contact frequency (see Materials and Methods), we estimated that this translocation is present in 6.13% of chromosomes in Bottom‐5 and 2.89% in Bottom‐20 (Fig 4C). This translocation was undetected in cells that did not undergo constricted migration (Control, Top‐12, Top‐5, Top20‐5 and Bottom‐12): interactions at this region were indistinguishable from background interchromosomal levels in these cells (Fig 4C). Using chromosome‐specific FISH probes, we confirmed the presence of the t(5;13) translocation in Bottom‐5 cells and found that it occurred in about 5% of cells (Fig 4E). In contrast, we never observed this translocation in the initial Control A375 population, even though our sample size in the FISH experiment should allow us to detect a translocation as rare as 0.25% with 95% confidence.
In addition to translocations, changes in chromosome copy number have been previously reported after constricted migration (Irianto et al, 2017a). Using Hi‐C read counts to infer copy number variations (Servant et al, 2018), we found that cells that had undergone constricted migration (Bottom‐5 and Bottom20‐5) showed notable copy number loss of chr13 (Fig 4D). This chr13 copy number loss (three copies to two copies) was also confirmed by FISH (Fig 4E).
In the MDA‐MB‐231 breast cancer cells, we observed an even more dynamic picture of translocation changes with constricted migration (Fig EV3F and G). While many of the translocations observed in the initial population are maintained, six translocations were lost while six others were gained in the cells that passed through constrictions (Fig EV3G). This suggests an overall higher level of genomic instability in this cell line as compared with A375 cells. In both cell lines, these translocation changes may in part result from selection from a heterogeneous initial population or may reflect genomic instability induced by the constricted migration itself.
Beyond revealing translocations, interchromosomal contact data can reveal changes in patterns of whole chromosome territory interactions between conditions. In A375 cells, we observe a decrease in interchromosomal interactions of chr13 (Appendix Fig S4B, top panel) in cells that had passed through constrictions. This is not likely to be explained purely by copy number loss at chr13, as this would decrease both inter‐ and intrachromosomal contacts rather than changing the ratio between the two. Additionally, smaller chromosomes (chr14‐chr22) display an increase in interactions with other chromosomes in Bottom‐5 but not Bottom‐12 cells (Appendix Fig S4B). This measurement could indicate a constricted migration‐associated change in the relative compactness and intermixing of the smaller gene‐dense chromosomes.
Agent‐based modeling reveals that heterogeneity and constricted migration induced changes could both contribute to sequential migration effects
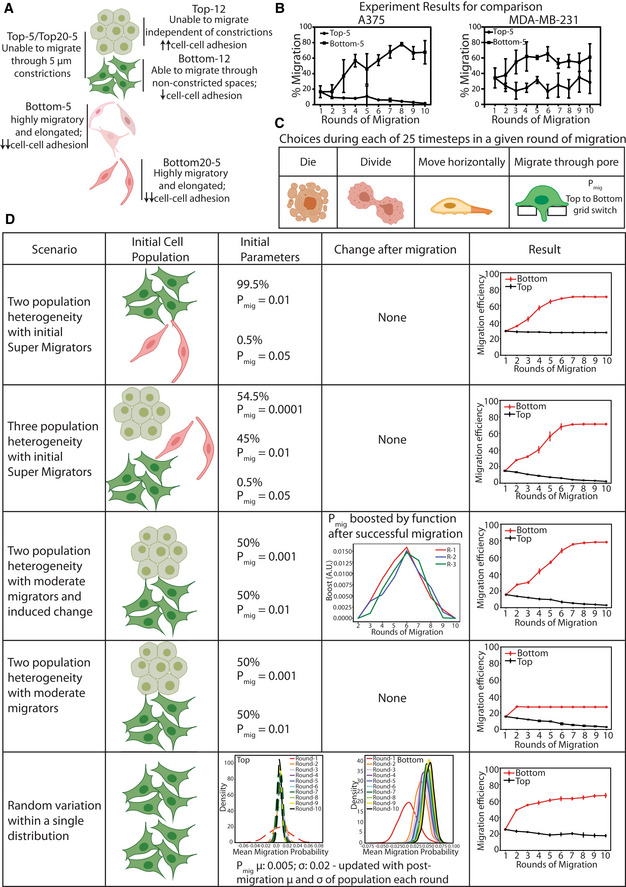
The presence of the subpopulation of A375 cells that does not migrate at all (Top‐12) suggests an initial heterogeneity in migratory ability within the population, as previously reported in this cell line (Kozlowski et al, 1984). However, it is not clear whether the increase in migratory efficiency and associated 3D genome and nucleus morphology alterations in Bottom‐5 cells are induced by repeated constricted migration or represent a preexisting population selected by the constriction (Fig EV4A). As a first step to evaluate which of these options could explain our observed migration results, we used agent‐based modeling (ABM) to simulate a variety of initial population compositions and changes with migration (Fig EV4B; see Materials and Methods for more detail). This model reports what fraction of cells would pass through a Transwell filter at each round of migration based on probabilistic choices of migration and division (Fig EV4C). If the initial population contains a mixture of moderate and supermigrators, the migration efficiency of Top cells does not decline over the rounds of migration, which does not replicate the results of A375 cells, but does in some ways mimic the behavior of MDA‐MB‐231 cells (Fig EV4B and D, first panel). The A375 experimental data can be recapitulated if the initial starting population is composed of three heterogeneous subpopulations (nonmigrators, moderate migrators, and super migrators) with highly migratory cells representing 0.5% of the population (Fig EV4D, second panel). If this scenario is true, then our Bottom‐5‐specific 3D genome and nucleus structures may be preexisting in a small fraction of the initial population that are primed for constricted migration.
Figure EV4. Agent‐based modeling of cell populations undergoing constricted migration.
-
AA375 cell subpopulations observed after sequential constricted migration.
- B
-
CChoices a cell can make at each timestep during each simulated migration round.
-
DParameters used in each agent‐based model (left columns) and results of each model (rightmost column). Error bars = SD of three independent runs of the model.
However, we are also able to recapitulate our experimental data with a scenario in which there are only nonmigrators and moderate migrators in the initial population but then cells that squeeze through constrictions experience an induced change that alters their phenotype (boosting function shown in Fig EV4D, third panel). In contrast, this same mixed population of nonmigrators and moderate migrators without induced changes cannot recapitulate the increase in migration efficiency we observe (Fig EV4D, fourth panel). Overall, our modeling results suggest that A375 cells must have an initial nonmigratory subpopulation, but that the increase in migratory efficiency with constriction could either be a selection or induction process or a combination of both.
Clonal populations of A375 cells exhibit similar trends of 3D genome structure change with constricted migration
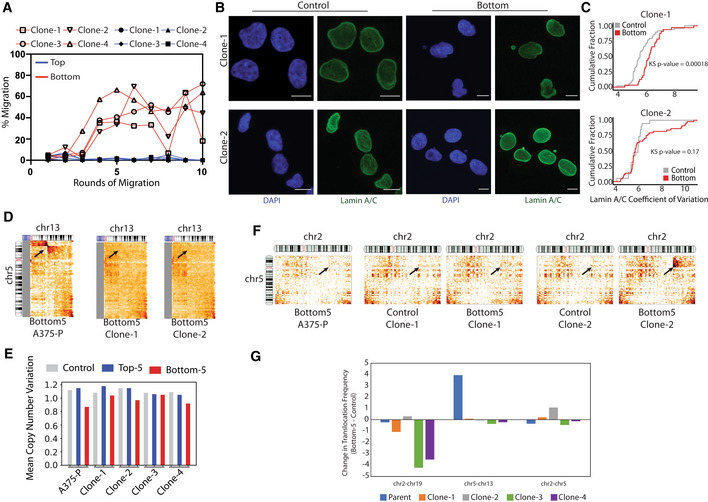
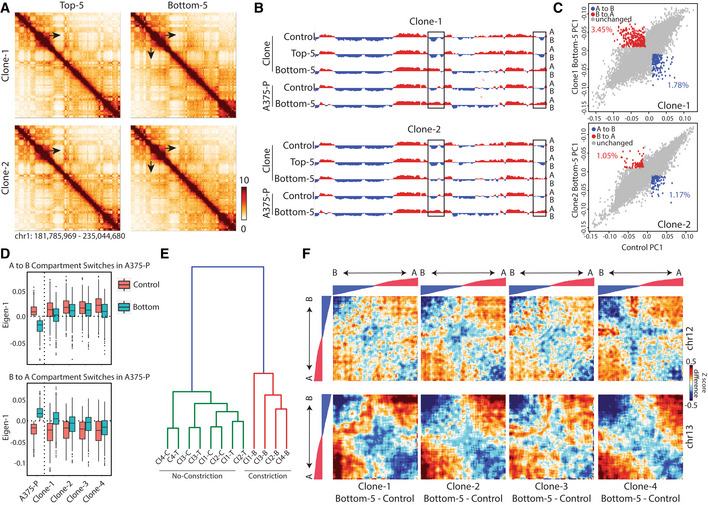
To clarify the relative contribution of initial population heterogeneity to the differences we observe after constricted migration, we isolated single cells from the parent A375 population (here called A375‐P) and grew them into four different clonal populations. If the initial A375 population were composed of a mixture of subpopulations with stably different migratory capacities, we would expect that each of these clonal populations would migrate at their own stable rate throughout a sequential migration experiment, either inherently poor, moderate, or proficient migrators. Instead, we found that all four clonal populations initially showed very low constricted migration rates, but over the sequential rounds of migration through 5 μm pores, all generated a Bottom‐5 population that was more highly migratory (Fig EV5A). Thus, even when a clonal population is isolated that is initially poorly migratory, a highly migratory population can be isolated by sequential rounds of constriction. We next asked whether the nucleus and 3D genome features of sequentially constricted cells were shared across these separate clones. Like the parental population, Bottom‐5 cells from the clones showed a wrinkled, more variable Lamin A/C distribution after constriction (Fig EV5B and C). We also observed some of the same compartment switches after constricted migration in the clones (Fig 5A and B). Different clones varied in the amount of 3D genome structure change they exhibited after constriction (Fig 5C), but all clones showed compartment shifts in the same direction for regions that switched compartments in A375‐P (Fig 5D). Indeed, while the final chromosome conformations after constriction for the different clones were not all the same, we found that all the Bottom‐5 compartment profiles clustered together, away from the initial and unconstricted Top‐5 conditions for each clone (Fig 5E). Thus, after sequential constricted migration, cells shared more of their chromosome compartment structure features with constricted cells of other clones than they shared with the clonal population from which they were derived. Additionally, each clonal population experienced a weakening of B compartment interactions and often a gain of A compartment interactions after constriction, as observed in A375‐P and MDA‐MB‐231 cells (Fig 5F). The t(5,13) translocation observed after constricted migration in A375‐P did not occur in these clonal populations (Fig EV5D and G), but we saw the emergence of a different translocation (t(2,5)) in clone 2 and the loss of a t(2,19) translocation in clones 3 and 4 after sequential constriction (Fig EV5F and G). Two of the clones also exhibited copy number loss of chromosome 13 after constriction, as was observed in the parental A375 cells (Fig EV5E).
Figure EV5. Sequential migration of A375 clones.
-
AIncrease in migration efficiency is seen after sequential rounds of migration through 5 μm Transwell pores in all A375 clones. Cells that passed through pores each round = Bottom; red. Cells that did not migrate through pores = Top; blue.
-
BSample images of Clone1 and Clone 2 A375 nuclei before (Control) or after (Bottom) 10 rounds of constricted migration. Nuclei stained with DAPI (blue) or Lamin A/C (green). Images represent a maximum projection of z‐stacks (Scale bar = 5 μm).
-
CCumulative distribution plot of Lamin A/C coefficient of variation. Kolmogorov–Smirnov test P‐values for Bottom versus Control Clone 1 (P = 0.00018, n = 48 nuclei for Control and 32 nuclei for Bottom‐5) and Clone 2 (P = 0.17, n = 19 nuclei for Control and 44 nuclei for Bottom‐5).
-
DInterchromosomal interactions between chr5 and chr13 (2.5 Mb bins) for parental population and clone cells that have undergone 5 μm Transwell migration. Arrow indicates site of translocation observed in parental population.
-
ECopy number variation of chr13 inferred from Hi‐C data. The mean copy number across all samples is set at 1. Relative copy number loss is seen after constricted migration (Bottom‐5 cells) for parental population as well as Clone 2 and 4.
-
FInterchromosomal interactions between chr5 and chr2 (2.5 Mb bins) for parental population and pre‐ and post‐ migration Clone1 and 2 cells. Arrow indicates site of translocation observed only in Bottom‐5 Clone 2 cells.
-
GTranslocation intensity for 3 different translocations (t(2;19), t(5;13), and t(2;5)) was quantified as contacts at the translocation site divided by average diagonal contacts for each Clone in Bottom‐5 and Control. The change in this translocation intensity after constricted migration is plotted. Negative values indicate loss of the translocation after sequential constricted migration while positive values indicate translocation gain between the indicated chromosomes.
Source data are available online for this figure.
Figure 5. Compartment changes observed after constricted migration of A375 clonal populations.
-
A250 kb binned Hi‐C interaction heatmaps of chr1 (chr1:181,785,969–235,044,680) in Clone‐1 and Clone‐2. Zoom‐in region remains the same as in Fig 2A. Arrows: locations of visible difference in Bottom‐5 contact maps for Clone‐1.
-
BPC1 track of compartment identity (250 kb bins) in the same region of chr1 across A375 clones and parental population (A375‐P). Boxed region highlights the same compartment switch highlighted by arrows in (A).
-
CCompartment PC1 value comparisons for each bin genome wide in Clone‐1 and Clone‐2 Bottom‐5 versus Control. Percentage of bins that met the criteria for “compartment switch” from B to A (red; PC1 < −0.01 to > 0.01) or A to B (blue; PC1 > 0.01 to < −0.01) indicated on each panel.
-
D“Eigen‐1” = PC1 compartment values of each clone condition across regions that switch compartment identity in parental population from A to B (top graph; 169 bins) or B to A (bottom graph; 300 bins). Central line indicates median, boxes indicate 25th to 75th percentile and whiskers indicate Q1 − 1.5IQR and Q3 + 1.5IQR.
-
EClustering of all A375 clonal populations by their genome‐wide compartment PC1.
-
FCompartmentalization saddle plots of chr12 (top panels) and chr13 (bottom panels) display Z‐score difference between all bin pairs of clonal Bottom‐5 and clonal Control. Heatmaps are reordered by PC1 values from strongest B‐B (left corner) to strongest A‐A (right corner) as displayed by the overlaid tracks.
Discussion
Our results identify different 3D genome structures specific to cells that have passed through numerous constrictions smaller than their nucleus. We find that such changes primarily occur at the A/B spatial compartmentalization level. A set of genomic regions show a switch in compartmentalization in both sequentially constricted A375 melanoma cells and MDA‐MB‐231 breast cancer cells. Beyond compartment switches, we observe a weakening of interactions in the typically heterochromatic B compartment that is consistent between both melanoma and breast cancer cell lines. These 3D genome structure differences in A375 cells are stable and associated with notable differences in cell and nucleus phenotypes both when the cells are migrating on a 2D surface and when they are squeezing through a 3D collagen matrix. Cells proficient at constricted migration more often deform their nuclei, elongate their cell body, and have fewer cell–cell attachments. In addition to previously observed linear genome changes that occur after sequential migration (Irianto et al, 2017a), our observations raise the interesting possibility that the increased migratory efficiency of sequentially constricted cells can be epigenetically encoded and stabilized by chromosome compartmentalization.
A key question raised by our results is whether the differences in 3D genome structure we see after constricted migration result from a selection process on an initially heterogeneous population or a “training process” where constricted migration itself leads to chromosome structure changes. Modeling results indicate that either selection, training, or a combination could explain the differences observed in sequentially constricted cells. The ability to isolate A375 cells that do not migrate in 10 chances through a wide pore (Top‐12 cells) shows that the initial A375 population contains some cells with a preexisting migration phenotype that can be selected for by the sequential migration experiment. Thus, some of the gene expression changes and chromosome compartmentalization changes we observe in our Bottom‐5 cells could have been selected from a preexisting population. However, our clonal experiments indicate that the A375 parental population is not simply composed of multiple subpopulations with stably different migratory potential. Each of the isolated clones start with low migration through constrictions, but a highly migratory population can be generated after rounds of sequential constricted migration. While these sequentially constricted clones do not all change their 3D genome in exactly the same way, they share common shifts in chromosome compartmentalization and a loss of the strongest B compartment interactions. These results indicate that the 3D genome structures characteristic of proficient constricted migrators are either selected and stabilized from a set of spontaneously arising fluctuations in chromosome structure or induced by the constricted migration. Similarly, some structures and phenotypes of Bottom‐5 cells, such as the chromosome 5;13 translocation and extremely elongated cell shapes in A375 cells, and several gained translocations in MDA‐MB‐231 cells, are not detectable in the original control population and are thus likely the result of induced phenotype changes or random events that are further reinforced by a selection process. Overall, we conclude that our results cannot be explained by simple selection from a mixture of static preexisting subpopulations, and that both selection and induced changes could contribute to the final phenotype. This combination of selection and induction likely occurs in metastasis as well. Within melanoma lesions, it has been observed that a select group of cells can gain the ability to metastasize, and then further diversification and phenotype change can occur as a result of metastasis (Damsky et al, 2010).
How could constricted migration induce chromosome conformation changes? One possible contributor could be physical deformation‐induced pulling apart or pushing together of chromosomal regions. Mixing of chromosome regions during constriction might lead to new spatial associations due to coalescence of compartments in a phase separation‐related process (Laghmach et al, 2021; Lee et al, 2021). Highly specific and reproducible local compartment switches, in contrast, are unlikely to have been pushed or pulled in the same way in every individual cell. Such specific changes could arise either by selection of preexisting differences in the population, selection of a change that is induced by deformation in some cells during migration, or induction of a programmed cell response to constricted migration. It is known that mechanical signaling can induce cellular reprogramming and that cellular reprogramming, such as an epithelial to mesenchymal cell transition (Shivashankar, 2019), can involve genome structure changes. Constriction may also influence spatial compartments by altering chromatin modifications. Previous work has shown in other cell types that constricted migration can lead to an increase in heterochromatin (preprint: Hsia et al, 2021). We do not observe stable, long‐term increases in heterochromatin marks in our sequentially constricted cells, but it is possible that more transient constriction‐induced heterochromatin alterations could contribute to some of the stable compartment changes that we do observe.
We consistently observe loss of B‐B interaction strength with constricted migration. Notably, this phenomenon was also previously observed with constricted migration in neutrophils (Jacobson et al, 2018). Furthermore, we observe this loss of B‐B interaction strength in the purely physical perturbation of low‐salt expansion in isolated nuclei (preprint: Liu & Dekker, 2021; Sanders et al, 2022). Conversely, in lung cancer cells, the loss of SETDB1 methyltransferase was shown to lead to an increase in B‐B compartment interactions and increased segregation of compartments overall, while also stiffening the nucleus and decreasing cell migration (preprint: Zakharova et al, 2021). This result is consistent with our findings in that we observe increased cell migration associated with the opposite changes in compartment interactions (loss of B‐B compartment interactions and increased mixing of B‐A). These coherent results across systems suggest a consistent relationship between chromosome compartment organization and nucleus mechanics and deformation.
Our results suggest that the constricted migration‐specific 3D genome structure relates to several biological processes. Some constriction‐specific spatial compartmentalization changes may reinforce altered expression of migration‐specific genes. While local gene regulation without 3D structure change can be sufficient to explain temporary changes in cellular behaviors in response to a stress or stimulus (Jin et al, 2013), 3D genome rearrangement is less reversible and more typical of differentiation or stable cell state transitions. Constricted migration has previously been shown to influence stem cell differentiation (Smith et al, 2019). Our results suggest that differentiation‐like stable phenotype changes after constriction may be mediated by chromosome compartmentalization changes. Such stable differences in 3D genome structure after multiple constricted migration events could underlie the distinct phenotype and increased in vitro invasiveness of cancer cells derived from metastatic sites compared with those from primary tumors or normal tissue (Oppenheimer, 2006).
Some genomic regions with altered compartmentalization in sequentially constricted cells do not show a connection to gene regulation. In fact, we report an enrichment A to B compartment switches in regions with no genes. These changes could play an indirect role in gene regulation by repositioning regulatory regions, could be related to alterations in another process such as replication timing, or could modulate the physical properties of the cancer cell nucleus. Previous research has shown that nucleus stiffness can be altered by increasing or decreasing the overall expression of Lamin A/C or by changing overall levels of heterochromatin (Lammerding et al, 2006; Davidson et al, 2014; Stephens et al, 2017, 2018). However, our sequentially constricted cells showed no changes in overall Lamin A/C content or H3K9me3 heterochromatin levels even though their nuclei showed more deformations when embedded in a collagen matrix. Instead, we observed a redistribution of Lamin A/C and H3K9me3 localization in the nucleus. It is interesting to consider that altered distributions of these proteins and chromosome regions might contribute to the ability of the nucleus to undergo physical deformations. Future work will be required to determine whether the 3D genome changes we observe translate into quantitative differences in nucleus physical properties.
Our data also provide insights into basic 3D genome organization principles. We show that compartments, compartment strength, and whole chromosome interactions change while TADs remain unaltered, reinforcing the idea that these are separate and largely independent layers of genome organization (Schwarzer et al, 2017; Mirny et al, 2019). These changes also suggest that the compartment and whole chromosome level of genome structure may be more important to nuclear mechanics than the TAD and loop level of organization. Meanwhile, our observation that local punctate interactions change around sites where gene expression changes echo previous evidence that collisions between loop extrusion and transcription can influence local contact patterns (Brandao et al, 2019).
Could the 3D genome changes we observe in our constricted cell population be indicative of metastatic potential? Previous reports have sometimes detected gene expression signatures in primary tumors that may be predictive of metastasis (Ramaswamy et al, 2003). Nuclear morphology abnormalities (“nuclear atypia”) are also already used clinically as a marker of cancer aggressiveness (Kadota et al, 2012). Recent reports have taken advantage of microfluidic engineering to predict metastatic potential of breast cancer cells based on their morphological features (Yankaskas et al, 2019). But, beyond being a marker, the biological significance of such abnormalities and what chromosome structure changes accompany them have not been defined. It is possible that chromosome structure changes could link metastatic gene expression signatures with the abnormal nuclear appearance of aggressive cancer. Our results reveal chromosome spatial compartmentalization differences in genomic regions related to metastatic potential in sequentially constricted A375 cells. Future work will be needed to investigate whether related changes are also observed in cells from metastatic cancer in patients.
Materials and Methods
Reagents and Tools table
| Reagent or resource | Source | Identifier |
|---|---|---|
| Antibodies (IF) | ||
| Lamin A/C | Santa Cruz | sc‐376248 |
| Lamin B1 | Abcam | ab133741 |
| H3K9me3 | Abcam | ab176916 |
| Alexa Fluor 594 | Invitrogen | R37117 |
| Alexa Fluor 488 | Invitrogen | R37120 |
| Antibodies (Western blot) | ||
| Beta Actin – Rabbit Polyclonal | Thermo Fisher | PA1‐16889 |
| Beta Actin – Mouse Monoclonal | Thermo Fisher | MA1‐140 |
| phospho LaminA Ser22 | Abcam | ab138450 |
| Goat anti‐rabbit secondary | Licor | 92568071 |
| Goat anti‐mouse secondary | Licor | 95‐32210 |
| Chemicals | ||
| DMEM | Corning | 10‐013‐CV |
| FBS | Corning | 35‐010‐CV |
| Pen‐Strep | Gibco | 14140‐122 |
| L‐Glutamine | Gibco | 25030‐081 |
| Medium 199 | Lonza | 12‐119F |
| Hygromycin B | Corning | 30‐240‐CR |
| Trypsin | Corning | 25053CI |
| RIPA buffer | Thermo Scientific | I89900 |
| Collagen | Corning | 354236 |
| Protease inhibitors/EDTA | GenDepot | 50‐101‐5485 |
| Phosphatase inhibitors | GenDepot | 50‐101‐5488 |
| Micrococcal nuclease | Thermo Scientific | FEREN0181 |
| BCA Protein Assay Kit | Thermo | 234225 |
| 4–12% Bis‐Tris Plus gels | Invitrogen | NW04120BOX |
| PVDF membranes | Invitrogen | B1000 |
| Chr5 Green Paint | Metasystems | D‐0305‐050‐FI |
| Chr13 Orange Paint | Metasystems | D‐0313‐050‐OR |
| Critical commercial assays | ||
| RNA easy Kit | Qiagen | 74134 |
| rRNA Depletion Kit | New England Biolabs | E63105 |
| Ultra II RNA library prep kit | New England Biolabs | E7770G |
| Multiplex Oligos for Illumina | New England Biolabs | E7335G |
| Deposited data | ||
| Hi‐C, RNA‐Seq and ATAC‐Seq from A375 and MDA‐MB‐231 cell lines | This study | GEO:GSE143678 |
| Experimental models: cell lines | ||
| A375 | ATCC | CRL‐1619 |
| MDA‐MB‐231 | ATCC | CRM‐HTB‐26 |
| Transwell migration experiments | ||
| Fibronectin | Corning | 354008 |
| Transwell Filters (12 μm) | VWR | 10769‐224 |
| Transwell Filters (5 μm) | VWR | 10769‐236 |
| Software and algorithms | ||
| Bowtie2 | Langmead and Salzberg (2012) | http://bowtie‐bio.sourceforge.net/bowtie2/index.shtml |
| C‐World | https://github.com/dekkerlab/cworld‐dekker | |
| STAR | Dobin et al (2012) | https://github.com/alexdobin/STAR |
| MACS2 | Zhang et al (2008) | https://github.com/taoliu/MACS |
| HTSeq | Anders et al (2014) | https://htseq.readthedocs.io/ |
| DESeq2 | Love et al (2014) | https://bioconductor.org/packages/release/bioc/html/DESEQ2.html |
| Bedtools | Quinlan and Hall (2010) | http://bedtools.readthedocs.io/en/latest/ |
| Samtools | Li et al (2009) | http://samtools.sourceforge.net/ |
| BBTools | https://github.com/kbaseapps/BBTools | |
| CNV estimation | Servant et al (2018) | https://github.com/nservant/cancer‐hic‐norm |
| Agent based modeling | Modified from https://github.com/zcolburn/cell‐sheet‐abm | https://github.com/rpmccordlab/Constricted‐Migration‐Agent‐Based‐Modeling/ |
Methods and Protocols
Cell lines and cell culture
A375 and MDA‐MB‐231 cells were obtained from ATCC (CRL‐1619 and HTB‐26, respectively). Cells were verified to be negative for mycoplasma and were grown using complete DMEM medium (Corning—10‐013‐CV; 10% FBS, 1% Pen‐Strep, 1% L‐Glutamine) at 37°C supplied with 5% CO2.
Sequential Transwell migration
For the sequential migration, we used Transwell filters with 12 μm (VWR‐10769‐224) and 5 μm pore sizes (VWR‐10769‐236). Briefly, the bottom of the filters were coated with 40 μl of 10 μg/ml fibronectin for ~45 min. 24‐well plates were prepared for Transwell migration assay adding 500 μl of 1× DMEM (Corning) with full supplements per well. A375 cells were detached from culture dishes at 80–90% confluency and aliquoted to 100,000 cells per 100 μl of 1×DMEM. Each Transwell was placed into its corresponding well of the 24‐well plates, and 100 μl of the cell suspension was added to the top of each filter. Cells were incubated at 37°C, 5% CO2 and allowed to migrate for 24 h. After the 24‐h incubation, migration efficiency was quantified as follows. First, freely floating cells were removed from the top of the filter (unmigrated; “Top” cells) and from the well beneath the filter (migrated “Bottom” cells) and placed in two separate tubes. Then, 400 μl of trypsin was added into the bottom chamber of the 24‐well plates, and 200 μl of trypsin was added into the top chamber to detach any remaining attached cells. Recovered cells after trypsinization were added to the unmigrated or migrated tubes, accordingly. Cells were spun down (1,000 rpm, 5 min) and counted (using trypan blue) to calculate % migration such as: #bottom/(#top+#bottom). Additionally, a small aliquot of cells was saved for immunofluorescence (IF). The rest of the cells were seeded into wells of a 24‐well plate to expand. When cells reached 80–90% confluency, another Transwell migration was performed (R2). A375 Top and Bottom cells were detached and counted. Two Transwell filters were prepared as previously described (one for Top and one for Bottom). Then, 100,000 cells suspended in 100 μl of 1×DMEM without supplements were seeded into the Transwell filters. After 24‐h incubation at 37°C and 5% CO2, cells were trypsinized as previously described to quantify migration efficiency. Only the cells that were always on top (Top of Top) and the cells that were always on the bottom (Bottom of Bottom) were saved and grown for further sequential rounds of migration. This process was repeated for 10 and 20 rounds of migration, which lead to the generation of A375‐Top5, Bottom‐5, Top20‐5, Bottom20‐5, Top‐12 and Bottom‐12, A375‐12‐M10, A375‐5‐NM20, and A375‐5‐M20.
Live cell imaging
To track single cell movement in 2D, A375‐Control, Top‐5, and Bottom‐5 cells were seeded on wells of a 6‐well plates at a 30,000 cells/well density. After cells were attached, live cell imaging was performed using the EVOS FL Auto microscope at 40× magnification. Images were acquired every 10 min for a 24‐h time period.
To image nuclei in cells migrating through collagen, A375 cells were transfected with Dendra2‐histone H4. The creation of this plasmid was described previously (Sanders et al, 2022) and is available upon request.
Cell morphology analysis
Parameters that describe cell morphology such as solidity and aspect ratio were quantified using the Shape Descriptors plugin in ImageJ.
Immunofluorescence staining
Approximately 50,000–100,000 cells for each subpopulation of A375 were seeded into either poly‐D‐lysine‐treated coverslips or 35‐mm coverslip bottom dishes. Cells were allowed to attach overnight and then cross‐linked with 4% formaldehyde for 10 min followed by three, 5‐min washes with PBS. After washing, cells were permeabilized with permeabilization buffer (10% goat serum, 0.5% Triton in PBS) for 1 h at room temperature. After the incubation, primary antibodies (Lamin A—sc‐376248, Lamin B1—ab133741, and H3K9me3—ab176916), diluted in antibody dilution buffer (5% Goat serum, 0.25% Triton in PBS), were added and incubated overnight at 4°C. After primary antibody incubation, cells were washed three times with PBS for 5 min for each wash. Cells were then incubated with secondary antibodies (Alexa Fluor 594 and Alexa Fluor 488) per manufacturer's directions (two drops of secondary antibody/1 ml of PBS – R37117 and R37120) for 30 min at room temperature. After secondary antibody incubation, cells were washed three times with PBS and sealed using mounting media with DAPI. Slides were treated in the mounting media for 24 h before imaging.
Cells were imaged using a Leica Sp8 Confocal microscope was equipped with a 63× oil immersion objective.
Nuclear morphology analysis
To analyze the diameter (minor axis), aspect ratio, and standard deviation of maximum projected nuclei, Image J Shape Descriptor plugin was used. For morphological analysis of 3D reconstructed nuclei, Image J Nucleus J plugin was used with default parameters. Lamin A/C coefficient of variation was quantified as the ratio of Lamin A/C standard deviation to Lamin A/C mean intensity.
Radial distribution of Lamin A/C and H3K9me3
Lamin A/C and H3K9me3 radial distribution was quantified using Measure Object Intensity Distribution module in CellProfiler. The maximum projected nuclei were separated into four equidistant bins. Mean fractional intensities for each bin (four total bins; starting from innermost (bin1) to outermost (bin4) radial position) was plotted.
Line scan analysis
To quantify the distribution of Lamin A/C and H3K9me3 in the nucleus, we also employed line scan analysis of nuclear central slices in Control, Top‐5, and Bottom‐5 cells. Line scans of same length were drawn across major and minor axis of nuclei using Leica SP8 Image Analysis software, and intensity distribution was recorded for each nucleus. We then created bins of equal size ranging from 0 to 1 and normalized the distance for all nuclei. The line scan data from all the nuclei were aggregated by taking the mean of intensity values for each bin window. The Python code used to create plots from linescan values (LineScanPlot.py) is included with the Source Data for this figure.
For image analyses in which manual counts and judgments were required, images were counted in a manner blinded to condition wherever possible.
Statistical calculations on imaging analyses were performed using R or GraphPad Prism.
Metaphase spread and chromosome staining (mFISH)
A375 Control and Bottom‐5 cells were grown to 80% confluency in a T‐25 flask. Mitotic cells were enriched for by adding 100 ng/ml colcemid (KaryoMAX) directly to culture media for 6 h. Cells were then lifted with Trypsin and centrifuged at 200 × g. Supernatant was removed and pellet dislodged by flicking. Cells were swelled by adding prewarmed (37°C) 0.075 M KCl dropwise while slowly vortexing and then placed in 37°C water bath for 6 min. One milliliter of Carnoy fixative (3:1 of methanol to acetic acid) was added to cell pellets and gently inverted to mix. Cells were then spun down at 200 × g, and the supernatant discarded. Cells were then resuspended in 5 ml of cold (4°C) Carnoy fixative and again spun at 200 × g followed by supernatant removal. Cells then were resuspended in 250 μl of cold (4°C) Carnoy fixative. A 12 μl sample was dropped from 12 inches onto a cover slip to induce nucleus rupture and spread metaphase chromosomes. Chromosomes were then stained by adding 2.25 μl of chr13 and chr5 FISH probes (Metasystems) to each slide. Slides were then placed in a 75°C oven for 2 min to denature samples. Coverslips were mounted and sealed with rubber cement, and slides were incubated at 37°C overnight in a humified chamber. Coverslips were then gently removed, and slides washed in 0.4× SSC prewarmed to 72°C for 2 min. Slides were drained followed by a wash in 2×SSC/0.05 Tween‐20 at RT for 30 s. Slides were then rinsed with ddH2O and allowed to air‐dry for 1 min. Two drops of mounting media containing a DAPI stain were placed on each slide and sealed with a coverslip before being imaged on a Metasystems Metafer platform with a Zeiss epifluorescence microscope at 63×.
We chose the number of metaphase images to analyze using sample size analysis. By analyzing n = 1,328 Control and 2,370 Bottom‐5 metaphases, we calculated that we would be able to detect a translocation as rare as 0.25% with at least 95% confidence. Translocation and copy number scoring were performed in a blinded fashion.
Western blot
A375 cells were trypsinized as previously described, and approximately 5 million cells were collected by centrifugation (1,000 rcf, 5 min, room temperature). The cell pellets were resuspended in 300 ml of RIPA buffer (Thermo Scientific, I89900), supplemented with protease inhibitors/EDTA (GenDepot 50‐101‐5485), and phosphatase inhibitors (GenDepot 50‐101‐5488). Cells were then incubated on ice for 10 min. DNA was degraded by adding 6 μl of micrococcal nuclease (0.5 U/ml stock, Thermo Scientific, FEREN0181) and 12 μl of calcium chloride (100 mM stock) to each lysate, followed by incubation at 37°C for 15 min. Nuclease activity was inhibited by subsequent incubations at 68°C for 15 min, and ice for 10 min. Protein samples were stored at −80°C until use. Protein concentration was measured using the BCA Protein Assay Kit. Thermo (234225), according to the manufacturer's instructions.
Denatured protein samples were resolved using a mini gel tank (Invitrogen, A25977) for 35 min at 200 V, using 4–12% Bis‐Tris Plus gels (Invitrogen, NW04120BOX) for all targets. Protein was transferred to low fluorescence PVDF membranes using the mini Bolt Blotting System (Invitrogen, B1000), along with system‐specific reagents. Blotting was performed using the Odyssey TBS blocking system (Licor, 927‐400000), according to the manufacturer's protocol. Briefly, membranes were activated with methanol after transfer (1 min, RT), washed twice with milliQ water (5 min), twice with TBS (2 min), and blocked with Odyssey TBS blocking solution for 1 h at RT. Primary antibodies were diluted in blocking buffer (containing 0.2% Tween), and incubated over night at 4°C as follows: H3K9me3 (1:1,000, ab176916), LaminA/C (1:1,000, sc‐376248) and LaminB1 (1:1,000, ab133741). Beta actin was used as a loading control, using the appropriate antibody (1:10,000; rabbit polyclonal PA1‐16889, Thermo Fisher or 1:10,000; mouse monoclonal MA1‐140, Thermo Fisher) alongside with the targets of interest. Detection was carried out using the following secondary antibodies: goat anti‐rabbit (1:10,000; IRDye 680RD [92568071]; Licor) and goat anti‐mouse (1:10,000, IRDye 800CW [95‐32210]; Licor). Secondary antibodies were diluted in Odyssey TBS blocking buffer containing 0.2% Tween and 0.01% SDS. Membranes were incubated in secondary antibody for 1 h at RT, followed by three washes (TBST, 5 min each).
Images of near infrared fluorescent signal were acquired using an Odyssey scanner (Licor) in both the red and green channels. Signal was quantified using the Image Studio software (Licor).
Hi‐C library preparation
Hi‐C libraries were prepared for each cell subpopulation as previously described (Golloshi et al, 2018) including two biological duplicates for each condition. Briefly, 10 million cells were grown in T‐75 cell culture flasks to 80–90% confluency and cross‐linked with 1% formaldehyde for 10 min. Cross‐linked cells were then suspended in lysis buffer to permeabilize the cell membrane and were Dounce homogenized. Chromatin was then digested in‐nucleus overnight using DpnII restriction enzyme. Digested ends were filled in with biotin‐dATP, and the blunt ends of interacting fragments were ligated together. DNA was then purified by phenol‐chloroform extraction. For library preparation, the NEBNext Ultra II DNA Library prep kit (NEB) was used for libraries with size ranges from 200 to 400 bp. End Prep, Adaptor Ligation, and PCR amplification reactions were carried out on bead bound DNA libraries.
For the clone migration experiments, Hi‐C was performed using the Arima‐HiC+ Kit from Arima Genomics following the protocol for Mammalian Cell Lines (A160134 v01) and preparing the libraries using Arima recommendations for the NEBNext Ultra II DNA library prep kit (protocol version A16041v01).
Sequencing was performed at the Oklahoma Medical Research Foundation Clinical Genomics facility or Azenta Genomics using the Illumina HiSeq 3000 platform with 75 bp paired end reads or a NovaSeq 6000 with 50 or 150 bp paired end reads. Sequencing reads were mapped to the human genome (hg19), filtered, and iteratively corrected as previously described (Imakaev et al, 2012; https://github.com/dekkerlab/cMapping) or (for the clone Hi‐C) with the same procedure but implemented by HiCPro (https://github.com/nservant/HiC‐Pro). All Hi‐C contact matrices were scaled to a sum of 1 million interactions to allow comparisons between conditions in downstream analysis. For library quality and mapping statistics, see Appendix Table S1.
Compartment analysis
Compartment analysis was performed by running principal component analysis using matrix2compartment.pl script in the cworld‐dekker pipeline available on GitHub (https://github.com/dekkerlab/cworld‐dekker). The PC1 value was then used to determine compartment identity for 100 and 250 kb binned matrices. We considered PC1 values greater than 0.01 to be A compartment and less than −0.01 to be B compartment for this analysis and determination of compartment switches.
To classify compartment switch bins according to whether they contained genes or not, the bins detected as switching compartments were overlapped with the UCSC Genes “knownGene” track in genome version hg19, which contains both protein coding genes and noncoding RNA transcripts.
Saddle plots
Saddle plots were constructed to investigate changes in interaction frequency between or within compartments in highly migratory and nonmigratory melanoma cells. Briefly, PCA was performed on 100 kb binned matrices to assign compartment identity for each bin. For the analysis, interaction zScores, normalizing for interaction decay for genomic distance, were calculated according to the matrix2compartment.pl script in cworld‐dekker. Zscore matrices were reordered based on compartment strength (from strongest B to strongest A using eigenvector values). Finally, matrices were smoothed at 500 kb bin size.
Interchromosomal fraction (ICF)
Ratio of interchromosomal interactions relative to the total number of interactions for a given chromosome as previously described (Heinz et al, 2018).
Copy number variation estimation
CNV estimation was performed using the approach available from https://github.com/nservant/cancer‐hic‐norm (Servant et al, 2018).
Translocation detection and frequency calculation
For the novel translocation visibly evident in 2.5 Mb binned contact maps for Bottom‐5 constricted migrated cells, we further pinpointed the specific break site on each chromosome (chr5 and chr13) using raw valid pair counts within the region. First, we filtered all valid pair interactions between chr5 and chr13 to include only regions of chr13 between 38.3 and 57.5 Mb (a range of coordinates upstream of the translocation site, which all interact more than expected with chr5). Then, we plotted a histogram of interaction frequencies between each locus along chr5 and this set of chr13 coordinates. We noted a sharp interaction drop within the region chr5:12.24–12.25 Mb, which represents the translocation breakpoint. We then reversed this process to determine the breakpoint along chr13.
To calculate the percent of chromosomes containing this chr5‐13 translocation in each subpopulation, we first found the 2.5 Mb bin with the maximum raw Hi‐C counts near the translocation site in Bottom‐5 cells. We then calculated an average value for raw Hi‐C counts between neighboring bins (one bin off diagonal) in cis on chr7. We then calculated the percent of chromosomes bearing the translocation in any given cell type as the ratio of raw interaction counts at the translocation bin over average interaction counts between neighbors in cis. Given the median triploid karyotype of A375 cells, we then multiplied this % of chromosomes by 3 to estimate a % of cells carrying the translocation.
We followed a similar process as above for other detected translocations in A375 and MDA‐MB‐231 cells. Briefly, we identified all apparent translocations in the Hi‐C map by searching for stronger than expected interchromosomal interactions with sharp boundaries on one edge signifying a chromosome break. We then identified the 2.5 Mb bin in this region that had a local maximum contact frequency and used this value as the contact strength of the translocation. We then calculated the expected contacts between adjacent regions of the chromosome as the average diagonal contacts on both chromosomes involved in the translocation. The translocation bin contacts divided by the average diagonal contacts were reported as the translocation intensity, a value proportional to the number of cells that carry this translocation in the cell population.
Distance decay scaling plots
Using 40 and 20 kb binned iteratively corrected and scaled contact matrices, we extracted contact frequencies between bins at each genomic distance, excluding the diagonal bin (zero distance). A loess fit was then used to find a smooth curve describing interaction decay versus distance (using the matrix2loess.pl script in cworld‐dekker). The interaction frequencies were then normalized to set the maximum value (loess fit interaction value for the minimum distance) for each dataset to 1 and then plotted on a log scale versus log genomic distance.
RNA‐Seq library preparation
For Control, Top‐5 and, Bottom‐5 A375 cells, RNA was extracted, and the library was prepared in our laboratory. Briefly, RNA was extracted using Qiagen RNAeasy plus mini kit (Cat. No. 74134). Cells were lysed and homogenized, spun down in gDNA eliminator columns to remove any genomic DNA. All samples were washed with ethanol, and the total RNA was eluted. The quality and quantity of the RNA were quantified using Agilent Bioanalyzer Nano RNA kit. All the libraries used were characterized by a RIN value between 9 and 10. rRNA was depleted using NEBNext rRNA Depletion Kit (Cat. No. E6310S). Total RNA was hybridized to the probe followed by RNaseH and DNase I digestion. RNA was then purified using AmpureXP beads from Beckman Coulter (Ref. A63881) at a 2.2× concentration of beads. RNA libraries were prepared using NebNext Ultra II RNA library prep Kit (Cat. No. E7770G). After rRNA depletion, RNA was fragmented (~200 nt) and primed following first‐ and second‐strand cDNA synthesis. The double‐stranded cDNA was then purified using AmpureXP beads at a 1.8× concentration. After purification, cDNA libraries were end prepped, ligated adapter, and PCR amplified for seven cycles to enrichment for adaptor ligated DNA using NebNext Multiplex Oligos for illumine (Cat. No. E7335G). cDNA libraries were then purified using AmpureXP beads at a 0.9× concentration, and their quality was checked using Agilent Bioanalyzer high‐sensitivity DNA kit. cDNA samples were then sent to Oklahoma Medical Research Facility (OMRF) for high‐throughput sequencing.
For the rest of A375 libraries, Top20‐5, Bottom20‐5, Top‐12, and Bottom‐12, RNA was extracted using the Qiagen RNAeasy plus mini kit as described above. Total RNA was then sent for library preparation and sequencing at GeneWiz. For library quality and mapping statistics, see Appendix Table S2.
RNA‐Seq data analysis
Quality of reads was checked using Fastqc and adapter sequences were trimmed using BBTools (https://github.com/kbaseapps/BBTools). Additionally, quality trimming of the reads was performed and any reads with a lower than 28 quality score were discarded. Reads were then aligned using STAR alignment (https://github.com/alexdobin/STAR) with an average alignment rate of 89%. The aligned reads were then sorted by genomic position and feature counts was performed using htseq 0.11.1 (https://github.com/simon‐anders/htseq). Differential expression of genes was determined by using DESeq through Galaxy.
ATAC‐Seq library preparation
ATAC‐Seq libraries for Top‐5 and Bottom‐5 cells were prepared as previously described (Buenrostro et al, 2015). Libraries were generated using Ad1_noMX and Ad2.1‐2.3 barcoded primers from Buenrostro et al (2015) and were amplified for a total of 12–13 cycles. The quality and quantity of the libraries were measured using Agilent Bioanalyzer High‐Sensitivity DNA kit. Sequencing was performed at Oklahoma Medical Research Facility using HiSeq3000 with 75 bp paired end reads. For library quality and mapping statistics, see Appendix Table S3.
ATAC‐Seq data analysis
Adapters and reads with a quality score less than 20 were trimmed from the final libraries using Skewer/0.2.2 (https://github.com/relipmoc/skewer). Trimmed reads were aligned to the hg19 genome using bowtie2 with default parameters (https://github.com/BenLangmead/bowtie2). Aligned reads were sorted, indexed and chrM reads were removed using samtools. Duplicated reads were removed using Picard (https://github.com/broadinstitute/picard/blob/master/src/main/java/picard/sam/markduplicates/MarkDuplicates.java). Finally, peaks were called using MACS2 (https://github.com/taoliu/MACS) with the following parameters: ‐‐nomodel ‐‐extsize 300 ‐g hs ‐‐keep‐dup all.
3D collagen matrix
Experiments investigating the morphology and migration of A375 subpopulation of cells in 3D environment were performed using single cell suspension in 3D collagen matrices (A375‐Control, A375‐Top5 A375‐Bottom10 generated from passage of A375 through 5 and 12 μm sized pores) as previously described (Denais et al, 2016). Briefly, 75,000 cells/condition were added into collagen matrices (Rat Tail, Corning 354236) with a density of 2.32 mg/ml. The pH of the collagen gels was normalized to a neutral pH and gels were incubated at 37°C for 30 min to gel. After the incubation, media with full supplements was supplied to the collagen gels. Cell were allowed to migrate through the collagen for 5 days before the cells were stained and imaged.
In timelapse images of cells embedded in collagen matrices, we found that about 5% of cells underwent apoptosis during the timecourse. We ensured that cells undergoing apoptosis were excluded from any analyses.
Immunofluorescence for 3D collagen matrices
Cells embedded on collagen were stained as previously described (Denais et al, 2016). Briefly, collagen matrices were fixed in 4% formaldehyde for 30 min at 37°C. Collagen matrices were then washed with 1×PBS for 10 min for three times. Each collagen matrix was then incubated with blocking buffer (0.5% Triton, 10% Goat Serum in 1×PBS) overnight at 4°C. After blocking, samples were then incubated with primary antibody (LaminA – sc376248) at a 1:500 dilution in 1×Blocking Buffer:1×PBS at 4°C overnight. After incubation, aspirate primary antibody solution and wash three times with 1×PBS for 10 min each. Samples were then incubated in secondary antibody (2 drops/ml of PBS) for 1 h and room temperature. After secondary antibody incubation, samples were then washed with 1×PBS three times for 10 min each. Samples were incubated with DAPI (1 μg/ml) for 30 min at RT. Collagen matrices were then washed three times with 1×PBS for 10 min each. Z‐stacks of collagen matrices were taken with Leica SP8 confocal microscope at 40× water objective.
Image analysis for cells embedded in 3D collagen matrices
Aspect ratio and Lamin A/C standard deviation of maximum projected nuclei were quantified using ImageJ plugin Shape Descriptors. Tracking of cells migrating in 3D collagen matrices was performed using ImageJ Manual Tracking plugin. The resulting data were then used in Chemotaxis and Migration tool (Ibidi) to generate accumulated distance and velocity measurements.
Agent‐based modeling of constricted migration
We modeled constricted cell migration using an on‐lattice two‐dimensional (2D) agent‐based model (ABM) system. In this model, cells are represented by agents. The basic building block of this agent‐based system was obtained from the collective cell migration ABM (collectiveABM), available on GitHub (https://github.com/zcolburn/cell‐sheet‐abm), and necessary changes were made to model cell transmigration. Most of the parameter values and the model working procedures of collectiveABM were kept untouched unless otherwise mentioned. Since the collectiveABM models a wound healing assay, we excluded the wound scratch section of the code from our model. We used two squared 2D grid spaces of size 20 × 20 to the agent‐based system in place of a single 2D grid space: one to represent the top of the Transwell, where the cells are seeded at the beginning of each round of sequential migration, and another to represent the bottom of the Transwell, where the cells transmigrate from the top compartment. The beginning of each round of sequential migration model starts with 2,000 cells seeded on the top compartment. The population of the cells is either considered to be homogenous or heterogeneous depending on the transmigration probability (Pmig). A total of 25 timepoint iterations were implemented to mimic the ~24‐h duration of experimental migration rounds. At each timestep, each cell can choose to either transmigrate to the bottom, divide, die, or move horizontally. After each round of sequential migrations, the proportion of cells in the bottom and top compartment is measured, and the cells from the bottom or top are propagated to the next simulated round of migration. The directionality of the transmigration is only from top to bottom compartment, and once the cells reach the bottom compartment, they stay there. The constricted migration of a cell was modeled by comparing its assigned Pmig with a uniform random number drawn from the range [0,1). If the random number is less than Pmig, then that cell will transmigrate to the bottom compartment from the top. In addition to having models with fixed Pmig values, we also designed agent‐based model systems having variable Pmig: (i) the Pmig value of bottom cells are boosted by a function after each round and (ii) each cell has different Pmig, drawn from a normal distribution and after each round, the mean and standard deviation of top or bottom compartment cells depending on the sequential Transwell migration experiment type will be used in next round's normal distribution. The efficiency of migration was calculated at the end of each round by dividing the number of cells in the bottom compartment by total cells in the top and bottom compartments combined. For all the different test cases, three independent runs were performed by using different random number seeds. The full ABM code is available at: https://github.com/rpmccordlab/Constricted‐Migration‐Agent‐Based‐Modeling/.
Author contributions
Rosela Golloshi: Conceptualization; data curation; software; formal analysis; investigation; visualization; methodology; writing – original draft; writing – review and editing. Christopher Playter: Data curation; software; formal analysis; investigation; visualization; writing – review and editing. Trevor F Freeman: Formal analysis; investigation. Priyojit Das: Software; formal analysis; visualization; methodology; writing – review and editing. Thomas Isaac Raines: Formal analysis; investigation; methodology. Joshua H Garretson: Formal analysis. Delaney Thurston: Formal analysis; investigation. Rachel Patton McCord: Conceptualization; data curation; formal analysis; supervision; funding acquisition; visualization; writing – original draft; project administration; writing – review and editing.
Disclosure and competing interests statement
The authors declare that they have no conflict of interest.
Supporting information
Appendix
Expanded View Figures PDF
Movie EV1
Movie EV2
Movie EV3
Movie EV4
Movie EV5
Movie EV6
Movie EV7
Movie EV8
Source Data for Expanded View and Appendix
PDF+
Source Data for Figure 1
Acknowledgements
We thank Rebeca San Martin, Mariano Labrador, Jacob Sanders, Yang Xu, and Jan Lammerding for insightful discussion and advice about the project and methods. We thank Bas van Steensel for providing the LAD type annotations. Confocal images were obtained at the University of Tennessee Advanced Microscopy Imaging Core. This research was supported in part by a Ralph E. Powe Junior Faculty Enhancement Award from Oak Ridge Associated Universities to RPM and by National Institute of General Medical Science grant R35GM133557 to RPM. RG was supported in part by a Yates Dissertation Fellowship from The University of Tennessee Knoxville (UTK). DT was supported in part by a UTK Summer Undergraduate Research Internship award.
EMBO reports (2022) 23: e52149
Data availability
Hi‐C, RNA‐Seq, and ATAC‐Seq sequence data and processed data for A375 and MDA‐MB‐231 cell line experiments are deposited at GEO: GSE143678 (https://www.ncbi.nlm.nih.gov/geo/query/acc.cgi?acc=GSE143678). Agent based modeling code developed for this study is available at: https://github.com/rpmccordlab/Constricted‐Migration‐Agent‐Based‐Modeling/.
References
- Abbas A, He X, Niu J, Zhou B, Zhu G, Ma T, Song J, Gao J, Zhang MQ, Zeng J (2019) Integrating hi‐C and FISH data for modeling of the 3D organization of chromosomes. Nat Commun 10: 2049 [DOI] [PMC free article] [PubMed] [Google Scholar]
- Achinger‐Kawecka J, Valdes‐Mora F, Luu P‐L, Giles KA, Caldon CE, Qu W, Nair S, Soto S, Locke WJ, Yeo‐Teh NS et al (2020) Epigenetic reprogramming at estrogen‐receptor binding sites alters 3D chromatin landscape in endocrine‐resistant breast cancer. Nat Commun 11: 320 [DOI] [PMC free article] [PubMed] [Google Scholar]
- Anders S, Pyl PT, Huber W (2014) HTSeq—a Python framework to work with high‐throughput sequencing data. Bioinformatics 31: 166–169 [DOI] [PMC free article] [PubMed] [Google Scholar]
- Barutcu AR, Lajoie BR, McCord RP, Tye CE, Hong D, Messier TL, Browne G, van Wijnen AJ, Lian JB, Stein JL et al (2015) Chromatin interaction analysis reveals changes in small chromosome and telomere clustering between epithelial and breast cancer cells. Genome Biol 16: 214 [DOI] [PMC free article] [PubMed] [Google Scholar]
- Baskaran JP, Weldy A, Guarin J, Munoz G, Shpilker PH, Kotlik M, Subbiah N, Wishart A, Peng Y, Miller MA et al (2020) Cell shape, and not 2D migration, predicts extracellular matrix‐driven 3D cell invasion in breast cancer. APL Bioeng 4: 026105 [DOI] [PMC free article] [PubMed] [Google Scholar]
- Brandao HB, Paul P, van den Berg AA, Rudner DZ, Wang X, Mirny LA (2019) RNA polymerases as moving barriers to condensin loop extrusion. Proc Natl Acad Sci USA 116: 20489–20499 [DOI] [PMC free article] [PubMed] [Google Scholar]
- Broers JL, Raymond Y, Rot MK, Kuijpers H, Wagenaar SS, Ramaekers FC (1993) Nuclear A‐type lamins are differentially expressed in human lung cancer subtypes. Am J Pathol 143: 211–220 [PMC free article] [PubMed] [Google Scholar]
- Buenrostro JD, Wu B, Chang HY, Greenleaf WJ (2015) ATAC‐seq: a method for assaying chromatin accessibility genome‐wide. Curr Protoc Mol Biol 109: 21–29 [DOI] [PMC free article] [PubMed] [Google Scholar]
- Carolyn de Graaf JK, Pagie L, Peric Hupkes D, van Steensel B (2019) LAD atlas. LAD Atlas
- Chambers AF, Groom AC, MacDonald IC (2002) Dissemination and growth of cancer cells in metastatic sites. Nat Rev Cancer 2: 563–572 [DOI] [PubMed] [Google Scholar]
- Damsky WE, Rosenbaum LE, Bosenberg M (2010) Decoding melanoma metastasis. Cancers (Basel) 3: 126–163 [DOI] [PMC free article] [PubMed] [Google Scholar]
- Davidson PM, Denais C, Bakshi MC, Lammerding J (2014) Nuclear deformability constitutes a rate‐limiting step during cell migration in 3‐D environments. Cell Mol Bioeng 7: 293–306 [DOI] [PMC free article] [PubMed] [Google Scholar]
- Dekker J, Rippe K, Dekker M, Kleckner N (2002) Capturing chromosome conformation. Science 295: 1306–1311 [DOI] [PubMed] [Google Scholar]
- Denais CM, Gilbert RM, Isermann P, McGregor AL, te Lindert M, Weigelin B, Davidson PM, Friedl P, Wolf K, Lammerding J (2016) Nuclear envelope rupture and repair during cancer cell migration. Science 352: 353–358 [DOI] [PMC free article] [PubMed] [Google Scholar]
- Dobin A, Davis CA, Schlesinger F, Drenkow J, Zaleski C, Jha S, Batut P, Chaisson M, Gingeras TR (2012) STAR: ultrafast universal RNA‐seq aligner. Bioinformatics 29: 15–21 [DOI] [PMC free article] [PubMed] [Google Scholar]
- Fidler IJ (2003) The pathogenesis of cancer metastasis: the ‘seed and soil’ hypothesis revisited. Nat Rev Cancer 3: 453–458 [DOI] [PubMed] [Google Scholar]
- Fischer T, Hayn A, Mierke CT (2020) Effect of nuclear stiffness on cell mechanics and migration of human breast cancer cells. Front Cell Dev Biol 8: 393 [DOI] [PMC free article] [PubMed] [Google Scholar]
- Friedl P, Wolf K, Lammerding J (2011) Nuclear mechanics during cell migration. Curr Opin Cell Biol 23: 55–64 [DOI] [PMC free article] [PubMed] [Google Scholar]
- Fu Y, Chin LK, Bourouina T, Liu AQ, VanDongen AM (2012) Nuclear deformation during breast cancer cell transmigration. Lab Chip 12: 3774–3778 [DOI] [PubMed] [Google Scholar]
- Gerlitz G, Bustin M (2010) Efficient cell migration requires global chromatin condensation. J Cell Sci 123: 2207–2217 [DOI] [PMC free article] [PubMed] [Google Scholar]
- Golloshi R, Sanders JT, McCord RP (2018) Iteratively improving hi‐C experiments one step at a time. Methods 142: 47–58 [DOI] [PubMed] [Google Scholar]
- Gupta GP, Massague J (2006) Cancer metastasis: building a framework. Cell 127: 679–695 [DOI] [PubMed] [Google Scholar]
- Harada T, Swift J, Irianto J, Shin JW, Spinler KR, Athirasala A, Diegmiller R, Dingal PC, Ivanovska IL, Discher DE (2014) Nuclear Lamin stiffness is a barrier to 3D migration, but softness can limit survival. J Cell Biol 204: 669–682 [DOI] [PMC free article] [PubMed] [Google Scholar]
- Heinz S, Texari L, Hayes MGB, Urbanowski M, Chang MW, Givarkes N, Rialdi A, White KM, Albrecht RA, Pache L et al (2018) Transcription elongation can affect genome 3D structure. Cell 174: 1522–1536 [DOI] [PMC free article] [PubMed] [Google Scholar]
- Heo S‐J, Thakur S, Chen X, Loebel C, Xia B, McBeath R, Burdick JA, Shenoy VB, Mauck RL, Lakadamyali M (2021) Chemo‐mechanical cues modulate Nano‐scale chromatin organization in healthy and diseased connective tissue cells. bioRxiv 10.1101/2021.04.27.441596 [PREPRINT] [DOI]
- Hsia C‐R, McAllister J, Hasan O, Judd J, Lee S, Agrawal R, Chang C‐Y, Soloway P, Lammerding J (2021) Confined migration induces heterochromatin formation and alters chromatin accessibility. bioRxiv 10.1101/2021.09.22.461293 [PREPRINT] [DOI] [PMC free article] [PubMed]
- Imakaev M, Fudenberg G, McCord RP, Naumova N, Goloborodko A, Lajoie BR, Dekker J, Mirny LA (2012) Iterative correction of hi‐C data reveals hallmarks of chromosome organization. Nat Methods 9: 999–1003 [DOI] [PMC free article] [PubMed] [Google Scholar]
- Irianto J, Xia Y, Pfeifer CR, Athirasala A, Ji J, Alvey C, Tewari M, Bennett RR, Harding SM, Liu AJ et al (2017a) DNA damage follows repair factor depletion and portends genome variation in cancer cells after pore migration. Curr Biol 27: 210–223 [DOI] [PMC free article] [PubMed] [Google Scholar]
- Irianto J, Xia Y, Pfeifer CR, Greenberg RA, Discher DE (2017b) As a nucleus enters a small pore, chromatin stretches and maintains integrity, even with DNA breaks. Biophys J 112: 446–449 [DOI] [PMC free article] [PubMed] [Google Scholar]
- Jacobson EC, Perry JK, Long DS, Olins AL, Olins DE, Wright BE, Vickers MH, O'Sullivan JM (2018) Migration through a small pore disrupts inactive chromatin organization in neutrophil‐like cells. BMC Biol 16: 142 [DOI] [PMC free article] [PubMed] [Google Scholar]
- Jerkovic I, Cavalli G (2021) Understanding 3D genome organization by multidisciplinary methods. Nat Rev Mol Cell Biol 22: 511–528 [DOI] [PubMed] [Google Scholar]
- Jin F, Li Y, Dixon JR, Selvaraj S, Ye Z, Lee AY, Yen CA, Schmitt AD, Espinoza CA, Ren B (2013) A high‐resolution map of the three‐dimensional chromatin interactome in human cells. Nature 503: 290–294 [DOI] [PMC free article] [PubMed] [Google Scholar]
- Kadota K, Suzuki K, Colovos C, Sima CS, Rusch VW, Travis WD, Adusumilli PS (2012) A nuclear grading system is a strong predictor of survival in epitheloid diffuse malignant pleural mesothelioma. Mod Pathol 25: 260–271 [DOI] [PMC free article] [PubMed] [Google Scholar]
- Kind J, Pagie L, de Vries SS, Nahidiazar L, Dey SS, Bienko M, Zhan Y, Lajoie B, de Graaf CA, Amendola M et al (2015) Genome‐wide maps of nuclear lamina interactions in single human cells. Cell 163: 134–147 [DOI] [PMC free article] [PubMed] [Google Scholar]
- Kozlowski JM, Hart IR, Fidler IJ, Hanna N (1984) A human melanoma line heterogeneous with respect to metastatic capacity in athymic nude mice. J Natl Cancer Inst 72: 913–917 [PubMed] [Google Scholar]
- Krause M, Yang FW, Te Lindert M, Isermann P, Schepens J, Maas RJA, Venkataraman C, Lammerding J, Madzvamuse A, Hendriks W et al (2019) Cell migration through three‐dimensional confining pores: speed accelerations by deformation and recoil of the nucleus. Philos Trans R Soc Lond B Biol Sci 374: 20180225 [DOI] [PMC free article] [PubMed] [Google Scholar]
- Laghmach R, Di Pierro M, Potoyan DA (2021) The interplay of chromatin phase separation and lamina interactions in nuclear organization. Biophys J 120: 5005–5017 [DOI] [PMC free article] [PubMed] [Google Scholar]
- Lambert AW, Pattabiraman DR, Weinberg RA (2017) Emerging biological principles of metastasis. Cell 168: 670–691 [DOI] [PMC free article] [PubMed] [Google Scholar]
- Lammerding J, Fong LG, Ji JY, Reue K, Stewart CL, Young SG, Lee RT (2006) Lamins a and C but not Lamin B1 regulate nuclear mechanics. J Biol Chem 281: 25768–25780 [DOI] [PubMed] [Google Scholar]
- Langmead B, Salzberg SL (2012) Fast gapped‐read alignment with Bowtie 2. Nat Methods 9: 357–359 [DOI] [PMC free article] [PubMed] [Google Scholar]
- Le HQ, Ghatak S, Yeung CY, Tellkamp F, Gunschmann C, Dieterich C, Yeroslaviz A, Habermann B, Pombo A, Niessen CM et al (2016) Mechanical regulation of transcription controls Polycomb‐mediated gene silencing during lineage commitment. Nat Cell Biol 18: 864–875 [DOI] [PubMed] [Google Scholar]
- Lee DSW, Wingreen NS, Brangwynne CP (2021) Chromatin mechanics dictates subdiffusion and coarsening dynamics of embedded condensates. Nat Phys 17: 531–538 [Google Scholar]
- Li H, Handsaker B, Wysoker A, Fennell T, Ruan J, Homer N, Marth G, Abecasis G, Durbin R (2009) The sequence alignment/map format and SAMtools. Bioinformatics 25: 2078–2079 [DOI] [PMC free article] [PubMed] [Google Scholar]
- Liu Y, Dekker J (2021) Biochemically distinct cohesin complexes mediate positioned loops between CTCF sites and dynamic loops within chromatin domains. bioRxiv 10.1101/2021.08.24.457555 [PREPRINT] [DOI]
- Love MI, Huber W, Anders S (2014) Moderated estimation of fold change and dispersion for RNA‐seq data with DESeq2. Genome Biol 15 10.1186/s13059-014-0550-8 [DOI] [PMC free article] [PubMed] [Google Scholar]
- Maizels Y, Elbaz A, Hernandez‐Vicens R, Sandrusy O, Rosenberg A, Gerlitz G (2017) Increased chromatin plasticity supports enhanced metastatic potential of mouse melanoma cells. Exp Cell Res 357: 282–290 [DOI] [PubMed] [Google Scholar]
- Manzo SG, Dauban L, van Steensel B (2022) Lamina‐associated domains: tethers and looseners. Curr Opin Cell Biol 74: 80–87 [DOI] [PubMed] [Google Scholar]
- McCord RP, Kaplan N, Giorgetti L (2020) Chromosome conformation capture and beyond: toward an integrative view of chromosome structure and function. Mol Cell 77: 688–708 [DOI] [PMC free article] [PubMed] [Google Scholar]
- Mirny LA, Imakaev M, Abdennur N (2019) Two major mechanisms of chromosome organization. Curr Opin Cell Biol 58: 142–152 [DOI] [PMC free article] [PubMed] [Google Scholar]
- Nava MM, Miroshnikova YA, Biggs LC, Whitefield DB, Metge F, Boucas J, Vihinen H, Jokitalo E, Li X, Garcia Arcos JM et al (2020) Heterochromatin‐driven nuclear softening protects the genome against mechanical stress‐induced damage. Cell 181: 800–817 [DOI] [PMC free article] [PubMed] [Google Scholar]
- Nuebler J, Fudenberg G, Imakaev M, Abdennur N, Mirny LA (2018) Chromatin organization by an interplay of loop extrusion and compartmental segregation. Proc Natl Acad Sci USA 115: E6697–E6706 [DOI] [PMC free article] [PubMed] [Google Scholar]
- Oppenheimer SB (2006) Cellular basis of cancer metastasis: a review of fundamentals and new advances. Acta Histochem 108: 327–334 [DOI] [PubMed] [Google Scholar]
- Panagiotakopoulou M, Bergert M, Taubenberger A, Guck J, Poulikakos D, Ferrari A (2016) A Nanoprinted model of interstitial cancer migration reveals a link between cell deformability and proliferation. ACS Nano 10: 6437–6448 [DOI] [PubMed] [Google Scholar]
- Pfeifer CR, Xia Y, Zhu K, Liu D, Irianto J, García VMM, Millán LMS, Niese B, Harding S, Deviri D et al (2018) Constricted migration increases DNA damage and independently represses cell cycle. Mol Biol Cell 29: 1948–1962 [DOI] [PMC free article] [PubMed] [Google Scholar]
- Pombo A, Dillon N (2015) Three‐dimensional genome architecture: players and mechanisms. Nat Rev Mol Cell Biol 16: 245–257 [DOI] [PubMed] [Google Scholar]
- Quinlan AR, Hall IM (2010) BEDTools: a flexible suite of utilities for comparing genomic features. Bioinformatics 26: 841–842 [DOI] [PMC free article] [PubMed] [Google Scholar]
- Raab M, Gentili M, de Belly H, Thiam HR, Vargas P, Jimenez AJ, Lautenschlaeger F, Voituriez R, Lennon‐Dumenil AM, Manel N et al (2016) ESCRT III repairs nuclear envelope ruptures during cell migration to limit DNA damage and cell death. Science 352: 359–362 [DOI] [PubMed] [Google Scholar]
- Ramaswamy S, Ross KN, Lander ES, Golub TR (2003) A molecular signature of metastasis in primary solid tumors. Nat Genet 33: 49–54 [DOI] [PubMed] [Google Scholar]
- Rowat AC, Jaalouk DE, Zwerger M, Ung WL, Eydelnant IA, Olins DE, Olins AL, Herrmann H, Weitz DA, Lammerding J (2013) Nuclear envelope composition determines the ability of neutrophil‐type cells to passage through micron‐scale constrictions. J Biol Chem 288: 8610–8618 [DOI] [PMC free article] [PubMed] [Google Scholar]
- Rowley MJ, Corces VG (2018) Organizational principles of 3D genome architecture. Nat Rev Genet 19: 789–800 [DOI] [PMC free article] [PubMed] [Google Scholar]
- Rowley MJ, Nichols MH, Lyu X, Ando‐Kuri M, Rivera ISM, Hermetz K, Wang P, Ruan Y, Corces VG (2017) Evolutionarily conserved principles predict 3D chromatin organization. Mol Cell 67: 837–852 [DOI] [PMC free article] [PubMed] [Google Scholar]
- San Martin R, Das P, Dos Reis MR, Xu Y, Roberts JM, Sanders JT, Golloshi R, McCord RP (2022) Chromosome compartmentalization alterations in prostate cancer cell lines model disease progression. J Cell Biol 221: e202104108 [DOI] [PMC free article] [PubMed] [Google Scholar]
- Sanders JT, Golloshi R, Das P, Xu Y, Terry PH, Nash DG, Dekker J, McCord RP (2022) Loops, topologically associating domains, compartments, and territories are elastic and robust to dramatic nuclear volume swelling. Sci Rep 12: 4721 [DOI] [PMC free article] [PubMed] [Google Scholar]
- Schwarzer W, Abdennur N, Goloborodko A, Pekowska A, Fudenberg G, Loe‐Mie Y, Fonseca NA, Huber W, Haering CH, Mirny L et al (2017) Two independent modes of chromatin organization revealed by cohesin removal. Nature 551: 51–56 [DOI] [PMC free article] [PubMed] [Google Scholar]
- Segal T, Salmon‐Divon M, Gerlitz G (2018) The heterochromatin landscape in migrating cells and the importance of H3K27me3 for associated transcriptome alterations. Cell 7: 205 [DOI] [PMC free article] [PubMed] [Google Scholar]
- Servant N, Varoquaux N, Heard E, Barillot E, Vert JP (2018) Effective normalization for copy number variation in hi‐C data. BMC Bioinformatics 19: 313 [DOI] [PMC free article] [PubMed] [Google Scholar]
- Shivashankar GV (2019) Mechanical regulation of genome architecture and cell‐fate decisions. Curr Opin Cell Biol 56: 115–121 [DOI] [PubMed] [Google Scholar]
- Smith LR, Irianto J, Xia Y, Pfeifer CR, Discher DE (2019) Constricted migration modulates stem cell differentiation. Mol Biol Cell 30: 1985–1999 [DOI] [PMC free article] [PubMed] [Google Scholar]
- Solovei I, Wang Audrey S, Thanisch K, Schmidt Christine S, Krebs S, Zwerger M, Cohen Tatiana V, Devys D, Foisner R, Peichl L et al (2013) LBR and Lamin A/C sequentially tether peripheral heterochromatin and inversely regulate differentiation. Cell 152: 584–598 [DOI] [PubMed] [Google Scholar]
- Stephens AD, Banigan EJ, Adam SA, Goldman RD, Marko JF (2017) Chromatin and Lamin a determine two different mechanical response regimes of the cell nucleus. Mol Biol Cell 28: 1984–1996 [DOI] [PMC free article] [PubMed] [Google Scholar]
- Stephens AD, Liu PZ, Banigan EJ, Almassalha LM, Backman V, Adam SA, Goldman RD, Marko JF (2018) Chromatin histone modifications and rigidity affect nuclear morphology independent of lamins. Mol Biol Cell 29: 220–233 [DOI] [PMC free article] [PubMed] [Google Scholar]
- Swift J, Ivanovska IL, Buxboim A, Harada T, Dingal PC, Pinter J, Pajerowski JD, Spinler KR, Shin JW, Tewari M et al (2013) Nuclear Lamin‐a scales with tissue stiffness and enhances matrix‐directed differentiation. Science 341: 1240104 [DOI] [PMC free article] [PubMed] [Google Scholar]
- Taberlay PC, Achinger‐Kawecka J, Lun AT, Buske FA, Sabir K, Gould CM, Zotenko E, Bert SA, Giles KA, Bauer DC et al (2016) Three‐dimensional disorganization of the cancer genome occurs coincident with long‐range genetic and epigenetic alterations. Genome Res 26: 719–731 [DOI] [PMC free article] [PubMed] [Google Scholar]
- Tajik A, Zhang Y, Wei F, Sun J, Jia Q, Zhou W, Singh R, Khanna N, Belmont AS, Wang N (2016) Transcription upregulation via force‐induced direct stretching of chromatin. Nat Mater 15: 1287–1296 [DOI] [PMC free article] [PubMed] [Google Scholar]
- Torvaldson E, Kochin V, Eriksson JE (2015) Phosphorylation of lamins determine their structural properties and signaling functions. Nucleus 6: 166–171 [DOI] [PMC free article] [PubMed] [Google Scholar]
- Venables RS, McLean S, Luny D, Moteleb E, Morley S, Quinlan RA, Lane EB, Hutchison CJ (2001) Expression of individual lamins in basal cell carcinomas of the skin. Br J Cancer 84: 512–519 [DOI] [PMC free article] [PubMed] [Google Scholar]
- Wazir U, Ahmed MH, Bridger JM, Harvey A, Jiang WG, Sharma AK, Mokbel K (2013) The clinicopathological significance of Lamin A/C, Lamin B1 and Lamin B receptor mRNA expression in human breast cancer. Cell Mol Biol Lett 18: 595–611 [DOI] [PMC free article] [PubMed] [Google Scholar]
- Willis ND, Cox TR, Rahman‐Casans SF, Smits K, Przyborski SA, van den Brandt P, van Engeland M, Weijenberg M, Wilson RG, de Bruine A et al (2008) Lamin A/C is a risk biomarker in colorectal cancer. PLoS One 3: e2988 [DOI] [PMC free article] [PubMed] [Google Scholar]
- Wolf K, Te Lindert M, Krause M, Alexander S, Te Riet J, Willis AL, Hoffman RM, Figdor CG, Weiss SJ, Friedl P (2013) Physical limits of cell migration: control by ECM space and nuclear deformation and tuning by proteolysis and traction force. J Cell Biol 201: 1069–1084 [DOI] [PMC free article] [PubMed] [Google Scholar]
- Yankaskas CL, Thompson KN, Paul CD, Vitolo MI, Mistriotis P, Mahendra A, Bajpai VK, Shea DJ, Manto KM, Chai AC et al (2019) A microfluidic assay for the quantification of the metastatic propensity of breast cancer specimens. Nat Biomed Eng 3: 452–465 [DOI] [PMC free article] [PubMed] [Google Scholar]
- Zakharova VV, Magnitov MD, Del‐Maestro L, Ulianov SV, Glentis A, Ulyanik B, Williart A, Karpukhina A, Demidov O, Joliot V et al (2021) SETDB1 fuels the lung cancer phenotype by modulating epigenome, 3D genome organization and chromatin mechanical properties. bioRxiv 10.1101/2021.09.06.459062 [PREPRINT] [DOI] [PMC free article] [PubMed]
- Zhang D, Huang P, Sharma M, Keller CA, Giardine B, Zhang H, Gilgenast TG, Phillips‐Cremins JE, Hardison RC, Blobel GA (2020) Alteration of genome folding via contact domain boundary insertion. Nat Genet 52: 1076–1087 [DOI] [PMC free article] [PubMed] [Google Scholar]
- Zhang Y, Liu T, Meyer CA, Eeckhoute J, Johnson DS, Bernstein BE, Nusbaum C, Myers RM, Brown M, Li W et al (2008) Model‐based Analysis of ChIP‐Seq (MACS). Genome Biol 9 10.1186/gb-2008-9-9-r137 [DOI] [PMC free article] [PubMed] [Google Scholar]
- Zhou Y, Gerrard DL, Wang J, Li T, Yang Y, Fritz AJ, Rajendran M, Fu X, Schiff R, Lin S et al (2019) Temporal dynamic reorganization of 3D chromatin architecture in hormone‐induced breast cancer and endocrine resistance. Nat Commun 10: 1522 [DOI] [PMC free article] [PubMed] [Google Scholar]