Abstract
Lung cancer is one of the leading causes of cancer-related deaths worldwide, and non-small cell lung cancer (NSCLC) accounts for a large proportion of lung cancer cases, with few diagnostic and therapeutic targets currently available for NSCLC. This study aimed to identify specific biomarkers for NSCLC. We obtained three gene-expression profiles from the Gene Expression Omnibus database (GSE18842, GSE21933, and GSE32863) and screened for differentially expressed genes (DEGs) between NSCLC and normal lung tissue. Enrichment analyses were performed using Gene Ontology, Disease Ontology, and the Kyoto Encyclopedia of Genes and Genomes. Machine learning methods were used to identify the optimal diagnostic biomarkers for NSCLC using least absolute shrinkage and selection operator logistic regression, and support vector machine recursive feature elimination. CIBERSORT was used to assess immune cell infiltration in NSCLC and the correlation between biomarkers and immune cells. Finally, using western blot, small interfering RNA, Cholecystokinin-8, and transwell assays, the biological functions of biomarkers with high predictive value were validated. A total of 371 DEGs (165 up-regulated genes and 206 down-regulated genes) were identified, and enrichment analysis revealed that these DEGs might be linked to the development and progression of NSCLC. ABCA8, ADAMTS8, ASPA, CEP55, FHL1, PYCR1, RAMP3, and TPX2 genes were identified as novel diagnostic biomarkers for NSCLC. Monocytes were the most visible activated immune cells in NSCLC. The knockdown of the TPX2 gene, a biomarker with a high predictive value, inhibited A549 cell proliferation and migration. This study identified eight potential diagnostic biomarkers for NSCLC. Further, the TPX2 gene may be a therapeutic target for NSCLC.
Subject terms: Bioinformatics, Biomarkers, Oncology
Introduction
Non-small cell lung cancer (NSCLC), a subtype of lung cancer, is one of the most prevalent malignancies worldwide. According to studies, the prognosis for NSCLC is highly dependent on the stage of disease progression, and the earlier the disease is detected, the better the chances of survival within 5 years1. Patients with early-stage lung cancer often have no obvious symptoms and thus miss the best time for treatment. Moreover, metastasis is the most devastating feature of the tumor, ultimately leading to a high mortality rate2. Although some advances in lung cancer treatment and pharmaceutical research have been made, serious complications such as anemia and neutropenia persist, and recurrence rates and mortality in NSCLC patients are still not effectively controlled3. Therefore, there is an urgent need to identify reliable biomarkers in the diagnosis and prognosis of NSCLC.
With the significant advancement of microarray and sequencing technology in recent years, gene characterization based on messenger RNA expression levels has shown great promise in diagnosing cancer. For instance, the breast cancer susceptibility protein-1 (BRCA1) gene has been considered a predictor in breast cancer risk models. It is used as a clinical genetic test standard, while the tumor germination (Bd) gene is also considered a prognostic biomarker and has an independent prognostic value for disease-free survival (DFS) and overall survival (OS) in colon cancer4.
It has previously been reported that bioinformatics methods are used to analyze comprehensive gene expression data to obtain cancer-related biomarkers for effective prevention, diagnosis, and treatment of cancer. Machine learning (ML) methods are a branch of bioinformatics applied to various aspects of cancer research and are a hot topic in lung cancer research. For example, ML methods successfully developed and validated a predictive model for cancer-related deep vein thrombosis5. Lai et al. used ML methods to create gene signatures that accurately predicted prostate cancer prognosis6. Zheng et al. developed an integrated radiomic model using the ML method to predict the prognosis of prostate cancer patients7. ML methods have also been used to screen for potential biomarkers of prostate cancer and osteosarcoma8,9. Support vector machines (SVM), a linear classifier with maximum intervals defined in the feature space, have gradually been applied to machine learning of cancer using its efficient two-class model to classify cancer with high accuracy from a large number of genomes and efficiently extract key genes to achieve high-accuracy, low-error sample classification. In recent years, many researchers have used SVM methods to study cancer and have made significant advances. For example, Luo et al. used SVM methods to construct predictive models for synchronous lung metastases (SLM) in osteosarcoma10. Su et al. identified eight genes associated with colon cancer prognosis using the SVM method11. Cai et al. used SVM methods to construct radiomics-based models for diagnosing lung adenocarcinoma (LUAD)12. SVM methods also differentiated between epithelial ovarian cancer (EOC) and surrounding tissues, aiding EOC diagnosis13. In addition, the SVM methods successfully screened colorectal biomarkers for personalized treatment of patients with post-operative liver metastases14. However, there have been few studies on potential NSCLC biomarkers.
In this study, we obtained differentially expressed genes (DEGs) for NSCLC from the Gene Expression Omnibus (GEO) database. We used functional enrichment analysis to identify NSCLC-related biomarkers using an ML approach, followed by infiltrative immune cell analysis and in vitro validation of the biomarkers’ functions. Our findings may be useful in the early diagnosis of NSCLC and the mechanistic study of NSCLC.
Materials and methods
Data processing and DEGs screening
We obtained three microarray datasets (GSE18842, GSE32863, and GSE21933) from the Gene Expression Omnibus (GEO) public databases, and the organism parameter was set to “Homo sapiens”. The raw data from these datasets were processed using R language statistical software (version 4.1.2)15. Using the R ‘Limma’ package16, we identified DEGs between normal lung and NSCLC tissues, with an adjusted P-value < 0.05 and |logFC|≥ 2 as statistical significance. Heatmaps and volcano plots were plotted to show the differential expression of DEGs.
Functional and pathways enrichment analysis
Gene Ontology (GO), Kyoto Encyclopedia of Genes and Genomes (KEGG)17–19, and Disease Ontology (DO) enrichment analyses of DEGs were performed using the R ‘clusterProfiler’ package20 and visualized using the R ‘ggplot2’ package21 with GO functional annotation, including biological process, cellular component, and molecular function terms. The R ‘clusterProfiler’ and R ‘org.Hs.eg.db’ packages22 were used to enrich DEGs using gene set enrichment analysis (GSEA). A result with an adjusted P-value < 0.05 and a false discovery rate < 0.05 was considered statistically different.
ML methods to identify NSCLC biomarkers
For biomarker screening, two ML methods were used: least absolute shrinkage and selection operator (LASSO) logistic regression23 and support vector machine-recursive feature elimination (SVM-RFE)24. The algorithm LASSO used the R ‘glmnet’ package25, while the SVM-RFE algorithm used the R ‘e1071’ package26. The following are the model settings: LASSOcvfit = cv.glmnet (x,y,family = ‘binomial,” alpha = 1, type.measure = ‘deviance,’ nfolds = 10). SVM = rfeControl (functions = caretFuncs, method = “cv,” methods = “svmRadial”). The point with the lowest cross-validation in the vertical axis corresponds to the biomarker genes to be found; a difference of P < 0.05 was considered statistically significant.
Validation of biomarkers
The R ‘ggpubr’ package27 was used to examine the biomarker expression in GSE32864. In addition, the biomarkers’ diagnostic efficiency was validated using receiver operating characteristic (ROC) curves generated with the R ‘pROC’ package28; P < 0.05 was considered statistically significant.
Assessment and correlation analysis of infiltrating immune cells
The CIBERSORT algorithm29 was used to analyze the relationship between infiltrating immune cells and biomarkers; a correlation heatmap was produced using the R ‘corrplot’ package30 to detect the association of each immune cell with the other cells in the LUAD sample; the violin map using the R “ggplot2” package showed differences in the expression of 22 immune cells. A Spearman correlation analysis was performed between diagnostic biomarkers and infiltrating immune cells using the R “ggstatsplot” package.
Survival analysis
The GEIPA online website (http://gepia.cancer-pku.cn/) is a dataset based on The Cancer Genome Atlas and Genotype-Tissue Expression that provides a fast and customizable web-based tool. A summary of the process is as follows: click on “survival plots” and enter the gene name, then select “LUAD,” “OS,” and “RFS,” and finally observe the P-value and output the graph; P < 0.05 was considered statistically significant.
Cell culture and cell transfection
A549 cells were purchased from the ATCC (Shanghai, China). A549 cells were cultured in Dulbecco’s modified Eagle medium (Thermo Fisher Scientific, USA) containing 10% serum (Thermo Fisher Scientific, Wilmington, DE, USA). For si-RNA transfection, A549 cells were transfected with si-TPX2 using the Lipofectamine 2000 transfection reagent (Invitrogen, Waltham, MA, USA) according to the manufacturer’s instructions. To target TPX2, the following si-RNA sequences were used: AGCCTCAGAAGATCTCTTAG (si-TPX2).
Western blotting
The total protein concentration extracted with lysis buffer containing protease inhibitors was measured using the bicinchoninic acid (BCA) protein assay kit (Beyotime Biotechnology Inc., Shanghai, China), and proteins were separated using a polyvinylidene fluoride membrane (Millipore, Billerica, MA, USA). Proteins were separated on 10% skim sodium dodecyl sulfate–polyacrylamide gel electrophoresis, blocked with 20% skim milk and incubated with primary antibody overnight at 4 °C. Western blotting was performed using an enhanced chemiluminescence detection reagent (Beyotime Biotechnology Inc., Shanghai, China.) and according to the manufacturer’s protocol. P < 0.05 was considered statistically significant.
Statistical analysis
All statistical analyses were performed using the SPSS version 21.0 software package (SPSS, Chicago, Il, USA). The data are expressed as mean ± standard deviation. Categorical variables were analyzed using the χ2 or Fisher’s exact test. For paired samples, continuous variables were analyzed using the student’s t-test, and differences between groups were analyzed using an analysis of variance calculation. When the basic assumptions of the student’s t-test were not satisfied, the Wilcoxon–Mann–Whitney test was used. P-value < 0.05 was considered to indicate a statistically significant difference.
Results
Identification of DEGs
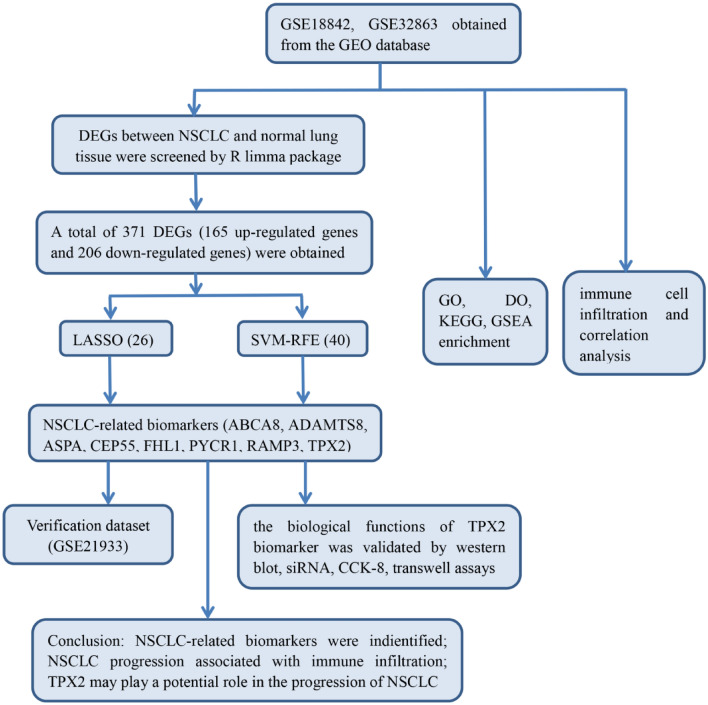
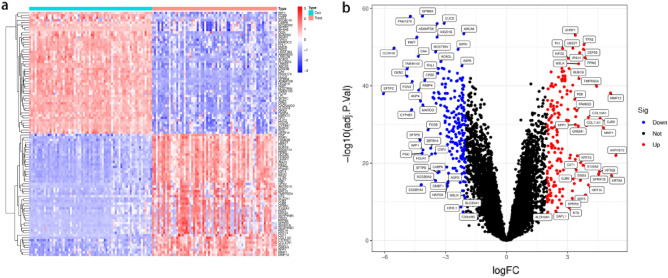
To analyze the diagnostic genes of NSCLC, we designed a flowchart (Fig. 1). Using the ‘Limma’ package in the R language, 371 DEGs, including 165 up-regulated genes and 206 down-regulated genes, were screened in NSCLC and normal lung tissue samples of GSE18842, GSE32864, and GSE21933 according to the criteria (adjusted P-value < 0.05 and |logFC|≥ 1). The results were expressed in the heatmap (Fig. 2a) and a volcano plot (Fig. 2b).
Figure 1.
a flowchart of the entire analysis process to the manuscript.
Figure 2.
Identification of DEGs. (a) Heatmap of DEGs. (b) Volcano diagram of DEGs, red indicates up-regulated, blue indicates down-regulated.
Functional enrichment analyses of the DEGs
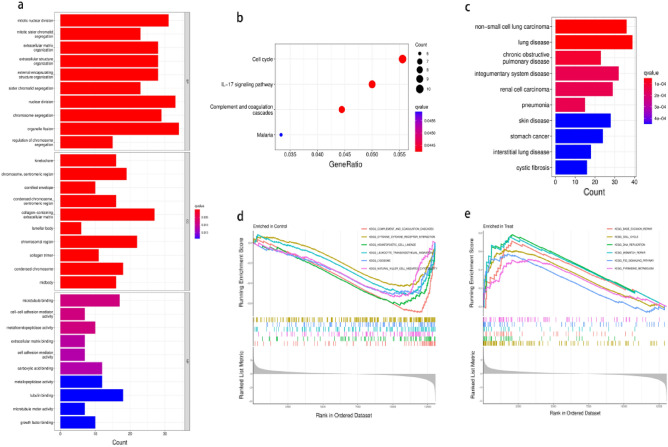
We investigated the possible biological functions of these 371 DEGs using the GO, KEGG, DO, and GSEA functional enrichment analyses. The GO analysis revealed that DEGs were primarily enriched in nuclear division and extracellular matrix organization, implying a link between tumor cell division and distant tumor metastasis (Fig. 3a). According to KEGG pathway analysis, the IL-17 signaling pathway, cell cycle, complement and coagulation cascades, and malaria were four significantly enriched pathways (Fig. 3b). The DO analysis revealed that these DEGs were remarkably enriched in lung disease, NSCLC, and integumentary system disease (Fig. 3c). Finally, the GSEA analysis revealed that in lung cancer tissue, complement and coagulation cascades, cytokine-cytokine receptor interactions, hematopoietic cell lineage, leukocyte transendothelial migration, lysosome, and natural killer cell-mediated cytotoxicity were highly active (Fig. 3d), whereas base excision repair, cell cycle, DNA replication, mismatch repair, p53 signaling pathway, and pyrimidine metabolism were highly active in normal nasopharyngeal tissue (Fig. 3e). All these findings indicate that these DEGs may be critical in NSCLC.
Figure 3.
Functional enrichment analysis of DEGs. The P value represents the colour depth of the node. The size of the node implies the number of DEGs. (a) GO functional enrichment analysis results for DEGs, including Biological process(BP), molecular function(MF) and cellular component(CC). (b) KEEG enrichment analysis reveals signalling pathways highly relevant to NSCLC. (c) DO functional enrichment analysis results of DEGs. (d) GSEA shows the top six signalling pathways most associated with normal lung tissue. (e) GSEA shows the top six signalling pathways most associated with NSCLC.
Screening for NSCLC biomarkers and validation
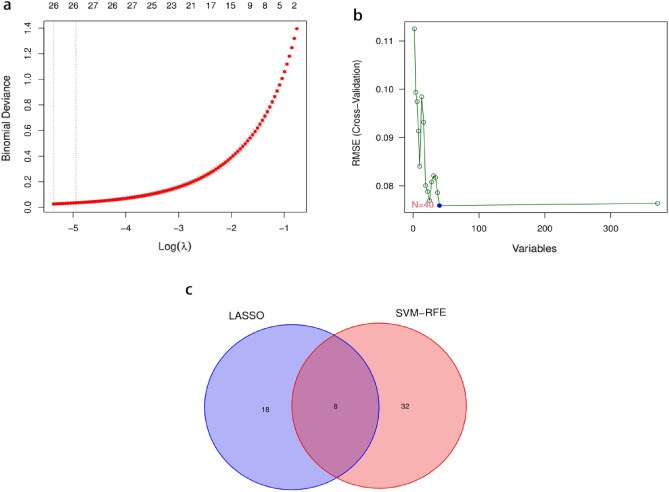
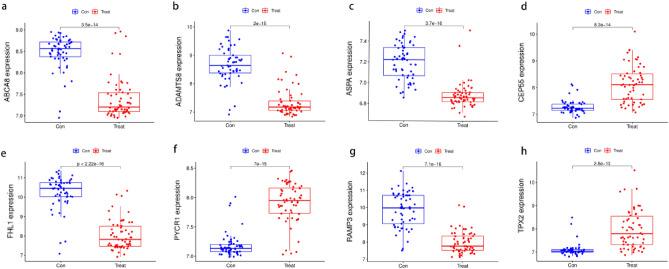
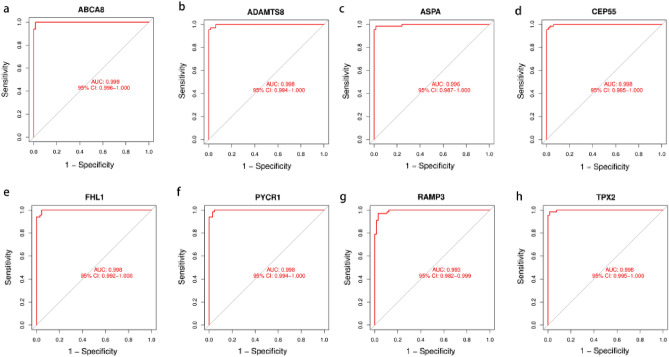
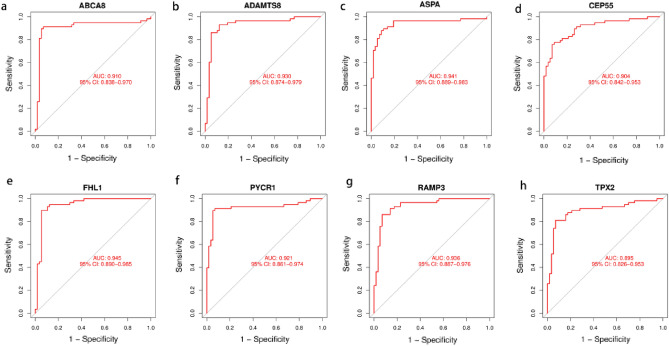
The LASSO logistic algorithm was used in this study to identify, 26 characteristic genes (Fig. 4a), while the SVM-RFE method was used to identify 40 characteristic genes (Fig. 4b). Eight biomarker genes were obtained as a result of the intersection, ABCA8, ADAMTS8, ASPA, CEP55, FHL1, PYCR1, RAMP3, and TPX2 genes (Fig. 4c). To further validate their potential as diagnostic biomarkers for NSCLC, we examined their expression in the GSE32863 dataset (Fig. 5), which revealed that ABCA8, ADAMTS8, ASPA, FHL1, and RAMP3 genes were down-regulated in NSCLC while CEP55, PYCR1, and TPX2 genes were up-regulated. The accuracy of these eight biomarkers in distinguishing NSCLC from normal individuals was evaluated using a receiver operating characteristic (ROC) analysis, and all eight biomarkers demonstrated high sensitivity and specificity. (The areas under the ROC curves (AUCs) = 0.999 in GSE18842 and GSE 21993 and 0.910 in GSE32863 for the ABCA8 gene; AUCs = 0.998 in GSE18842 and GSE21993 and 0.930 in GSE32863 for the ADAMTS8 gene, AUCs = 0.996 in GSE18842 and GSE 21993 and 0.941 in GSE32863 for the ASPA gene, AUCs = 0.998 in GSE18842 and GSE21993 and 0.904 in GSE32863 for the CEP55 gene, AUCs = 0.998 in GSE18842 and GSE21993 and 0.945 in GSE32863 for the FHL1 gene, AUCs = 0.998 in GSE18842 and GSE21993 and 0.921 in GSE32863 for the PYCR1 gene, AUCs = 0.993 in GSE18842 and GSE21993 and 0.936 in GSE32863 for the RAMP3 gene, AUCs = 0.998 in GSE18842 and GSE21993 and 0.895 in GSE32863 for the TPX2 gene. All P < 0.05) (Figs. 6 and 7).
Figure 4.
Machine learning approach to screen for NSCLC-related biomarkers. The point corresponding to the smallest vertical coordinate is the characteristic genes. (a) Results of screening biomarkers based on LASSO algorithm. (b) Screening results for biomarkers based on the SVM-RFE algorithm. (c) The Venn diagram shows the results of the intersection of the LASSO algorithm and the SVM-RFE algorithm, with the intersection resulting in eight biomarkers.
Figure 5.
Expression of eight biomarkers in the validation group (GSE32863). (a) ABCA8. (b) ADAMTS8. (c) ASPA. (d) CEP55. (e) FHL1. (f) PYCR1. (g) RAMP3. (h) TPX2. P < 0.05 means difference is statistically significant.
Figure 6.
ROC curves for eight biomarkers in the training dataset(GSE18842 and GSE21933). (a) ABCA8. (b) ADAMTS8. (c) ASPA. (d) CEP55. (e) FHL1. (f) PYCR1. (g) RAMP3. (h) TPX2.
Figure 7.
ROC curves for eight biomarkers in the validation dataset (GSE32863). (a) ABCA8. (b) ADAMTS8. (c) ASPA. (d) CEP55. (e) FHL1. (f) PYCR1. (g) RAMP3. (h) TPX2.
Assessment of immune cell infiltration
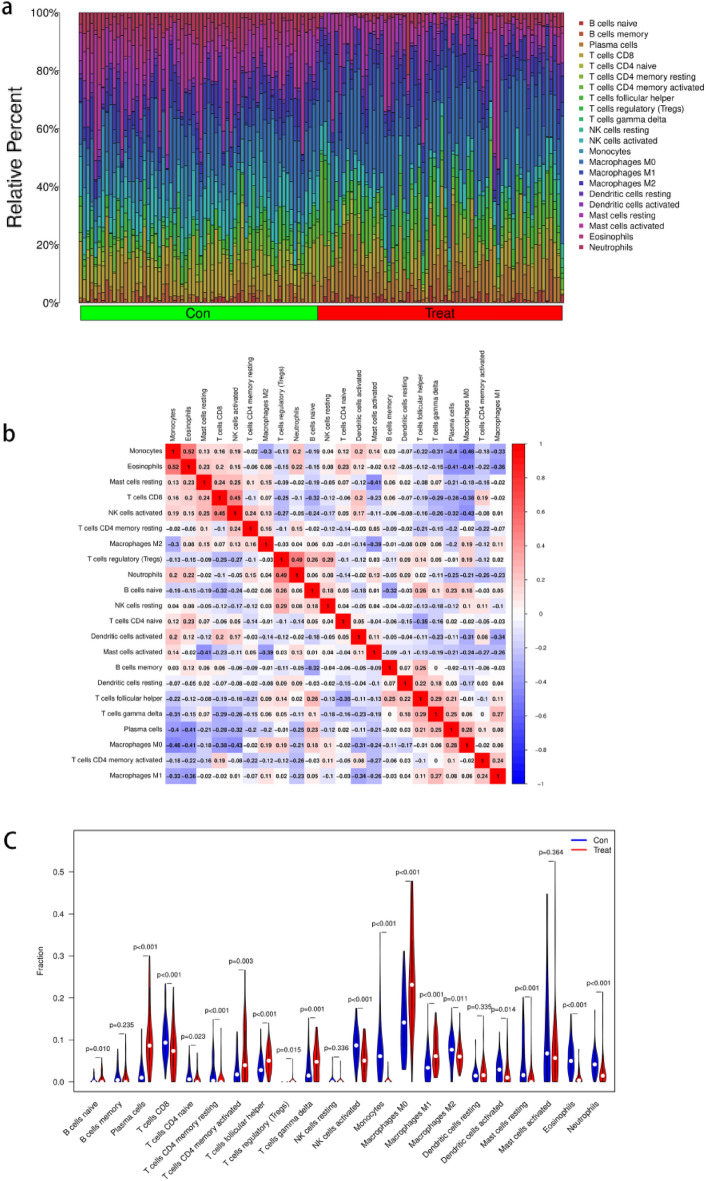
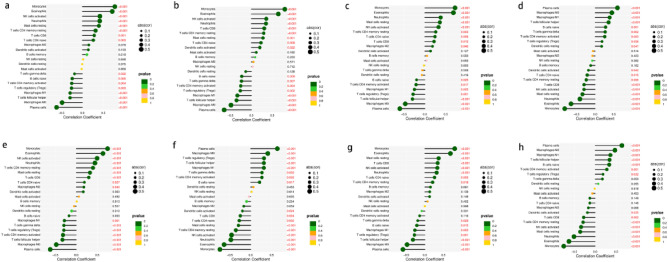
A comprehensive and dynamic understanding of the immune microenvironment is essential to develop effective therapeutic strategies. Therefore, in this study, we investigated immune cell infiltration in NSCLC and the relationship between biomarkers and infiltrating immune cells. First, we found significant differences in the composition of the 22 infiltrating immune cell types in each tissue sample (Fig. 8a). The correlation matrix showed the strongest positive correlation between eosinophils and monocytes and the strongest negative correlation between macrophage M0 cells and monocytes (Fig. 8b). Monocytes and eosinophils were the most down-regulated cells in NSCLC, while plasma cells and macrophage M0 were the most up-regulated, and activation of neutrophils, macrophage M1, and NK cells was low (Fig. 8c). Figure 8 depicts the relationship between the expression of eight biomarkers and the infiltration of immune cells. Monocytes, eosinophils, NK cells activated, neutrophils, mast cells resting, and T cells CD4 memory resting were positively correlated with with the ABCA8 gene expression, whereas plasma cells, macrophages M0, Follicular helper T (Tfh) cells, and macrophages M1 were negatively correlated (Fig. 9). The ADAMTS8 expression levels were negatively correlated with macrophages M1 T cells follicular helper, macrophages M0, and plasma cells, and positively correlated with monocytes, eosinophils, NK cells activated, neutrophils, T cells CD8, and T cells CD4 memory resting. The with the APSA gene expression levels expression levels were negatively correlated with T cells follicular helper, macrophages M0, and plasma cells and positively correlated with monocytes, eosinophils, neutrophils, mast cells resting, and NK cells activated. With The CEP55 gene expression levels expression levels were positively correlated with plasma cells, macrophages M0, macrophages M1, and T cells follicular helper and negatively correlated with T cells CD8, NK cells activated, mast cells resting, neutrophils, eosinophils, and monocytes. With The FHL1 gene expression levels expression levels were positively correlated with monocytes, eosinophils, NK cells activated, neutrophils, T cells CD4 memory resting, mast cells resting, and T cells CD8 and negatively correlated with T cells gamma delta, T cells regulatory, T cells CD4 memory activated, T cells follicular helper, macrophages M0, and plasma cells. With the PYCR1 gene expression levels were positively correlated with plasma cells, macrophages M0, T cells regulatory, T cells follicular helper, and macrophages M1 and negatively correlated with mast cells resting, T cells CD4 memory resting, NK cells activated, neutrophils, eosinophils, and monocytes. With The RAMP3 gene expression levels were positively correlated with monocytes, eosinophils, mast cells resting, T cells CD8, NK cells activated, and neutrophils, and negatively correlated with T cells follicular helper, macrophages M0, and plasma cells. The TPX2 expression levels were positively correlated with plasma cells, macrophages M0, macrophages M1, T cells follicular helper, and B cells naive and negatively correlated with T cells CD4 memory resting, NK cells activated, mast cells resting, neutrophils, eosinophils, and monocytes (P < 0.01).
Figure 8.
Correlation analysis among immune cells and Differential analysis of immune cells. (a) The 22 immune cell populations in normal lung tissue and NSCLC. ‘con’ represents normal lung tissue, ‘treat’ represents NSCLC. The vertical coordinate represents the amount of immune cells. (b) Correlation heatmap Indicates the correlation analysis of immune cells. The redder of the point, the stronger the positive correlation, the reddest point represents the two immune cells with the most significant positive correlation. The bluer the colour of the point, the stronger the negative correlation, the two immune cells with the most significant negative correlation correspond to the bluest points. (c) The vioplot showed the difference in 22 immune cells between normal lung tissue and NSCLC. ‘con’ represents normal lung tissue, ‘treat’ represents NSCLC. P < 0.05 means difference is statistically significant.
Figure 9.
Correlation analysis between eight biomarkers and immune cells. Colours represent P-values, P < 0.05 means significant correlation and is indicated in red, the size of the circle represents the absolute value of the correlation coefficient. (a) ABCA8. (b) ADAMTS8. (c) ASPA. (d) CEP55. (e) FHL1. (f) PYCR1. (g) RAMP3. (h) TPX2.
Survival analysis
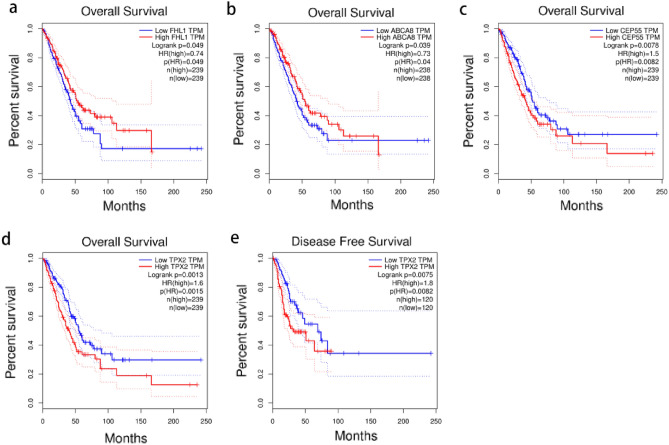
To determine the potential prognostic value of these eight biomarkers, we investigated the relationship between each biomarker’s expression and OS and DFS in NSCLC. The findings revealed that ABCA8 and FHL1 genes were associated with longer OS in lung cancer patients (P < 0.05), whereas TPX2 and CEP55 genes were associated with shorter OS (P < 0.05) (Figs. 10a–d), and other biomarkers were not significantly associated with OS (P > 0.05). Notably, only the TPX2 gene was associated with poor DFS (Fig. 10e), suggesting that the TPX2 gene may have a potential prognostic value in NSCLC, which we investigated further.
Figure 10.
Survival analysis of eight biomarkers in GEPIA website. (a–d) Overall survival analysis of FLHI, ABCA8, CEP55, TPX2. (e) Disease Free survival analysis of TPX2. P < 0.05 means difference is statistically significant.
Knockdown of the TPX2 gene inhibited the proliferation and migration of A549 cells
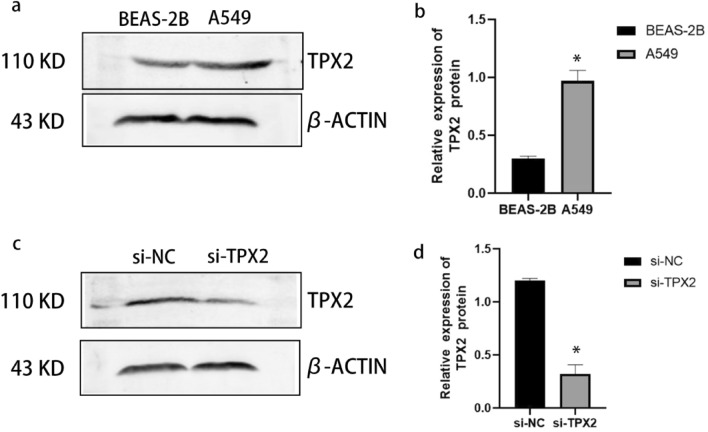
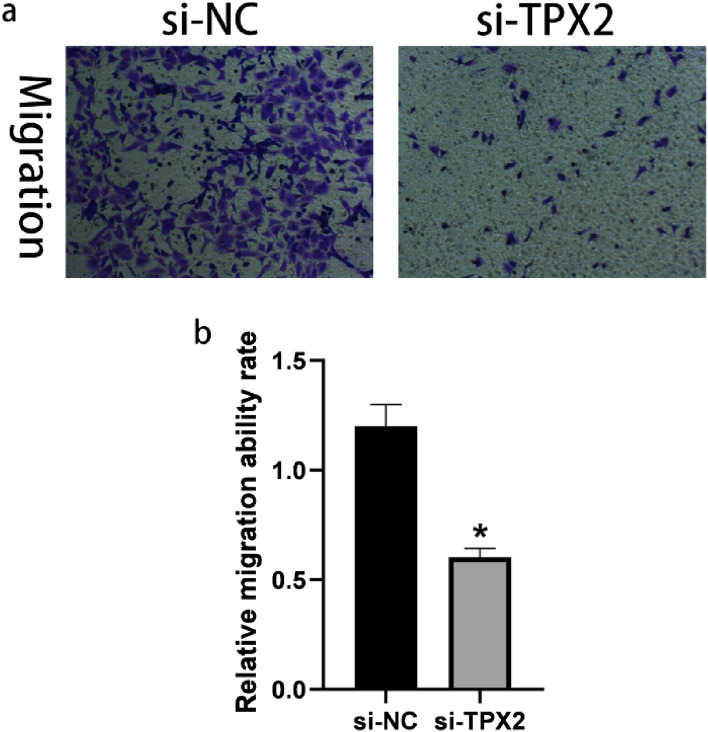
To investigate the potential role of the TPX2 gene in NSCLC, we used a western blot to compare the expression of TPX2 in A549 cells and BEAS-2B cells. We found that A549 cells had higher levels of TPX2 protein expression than BEAS-2B cells (P < 0.05) (Fig. 11a, b). Furthermore, we inhibited TPX2 expression by transfecting si-RNA-targeted TPX2 into A549 cells. The results of western blot analysis revealed that the levels of TPX2 proteins were significantly lower in A549 cells after transfection with si-TPX2 compared to si-control (P < 0.05) (Fig. 11c, d), indicating that the transfection was complete and ready for the next step of the experiment. The CCK8 proliferation assays confirmed that the TPX2 gene knockdown significantly inhibited A549 cell proliferation (P < 0.05) (Fig. 12). Moreover, the results of the transwell migration assay revealed that the relative number ratios of migrating cells were significantly lower in the TPX2 gene knockdown cells compared to si-control cells (P < 0.05) (Fig. 13), indicating that the TPX2 gene knockdown resulted in A549 cell migration ability. Therefore, we speculated that the TPX2 gene might act as an oncogene, promoting NSCLC progression. However, this conclusion needs to be verified via in vivo experiments.
Figure 11.
(a, b) Western blot method to detect TPX2 protein expression in normal alveolar epithelial cells BEAS-2B and non-small cell lung cancer cells A549. (c, d) Western blot method to detect si-TPX2 transfection efficiency. ‘*’represents P < 0.05.
Figure 12.
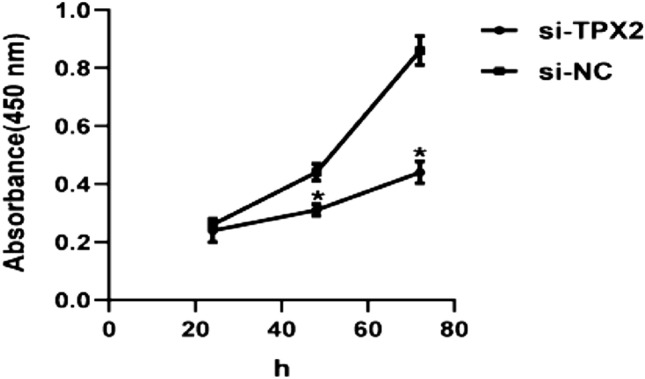
CCK8 method to detect the proliferative ability of the si-NC and si-TPX2 groups. Silencing of TPX2 inhibited the proliferative capacity of A549 cells. ‘*’ represents P < 0.05.
Figure 13.
Transwell method to detect migration ability of si-NC group and si-TPX2 group. Silencing of TPX2 suppressed migration ability in A549 cells. ‘*’ represents P < 0.05.
Discussion
NSCLC is well known for being asymptomatic and can only be detected at an early stage through physical examination1. As the tumor grows, develops, and spreads, serious symptoms emerge, including chest pain, breathing difficulties, liver metastases, and a slew of seriously life-threatening symptoms. Given the lack of obvious symptoms in the early stages of NSCLC, which makes diagnosis difficult, “early diagnosis and early treatment” has become the treatment consensus for NSCLC31. With the advancement of bioinformatics, effective analysis and exploration of cancer genes to find tumor biomarkers have become a hot topic for early cancer diagnosis expression profiles and treatment, For example, chen et al. have used new computational models in the field of miRNA to make great contributions to the pathogenesis of diseases and new drug development. For example, through the construction of Neighborhood Constraint Matrix Completion for MiRNA-Disease Association prediction (NCMCMDA), deep-belief network for miRNA-disease association prediction (DBNMDA), Ensemble of Decision Tree based MiRNA-Disease Association prediction (EDTMDA) models to accurately predict the potential relationship between miRNA-disease and in breast neoplasms, lung neoplasms, esophageal neoplasms have been validated32–34. The study of chen et al. has greatly improved the experimental efficiency and provided a new theoretical basis for the prevention, diagnosis and treatment of complex human diseases by screening disease-associated miRNAs through computational models, but such methods have not been adequately studied and described for biomarkers of NSCLC progression. Therefore, it is critical to identify a sensitive, safe, and feasible NSCLC biomarker for diagnostic and therapeutic purposes and to improve patient survival35.
The bioinformatics analysis of the microarray dataset from the GEO database identified 165 up-regulated and 206 down-regulated genes between NSCLC and normal lung tissue samples. Moreover, functional analyses revealed that these DEGs were linked to lung cancer tumorigenesis and metastasis. The most significantly enriched pathway, the cell cycle signaling pathway, has been shown to have mutations that can affect the genomic and microenvironmental characteristics of LUAD patients36 and can also be used as an assessment criterion for post-operative adjunctive therapy in LUAD patients37. Furthermore, GSEA analysis revealed that these DEGs might affect base excision repair, the cell cycle, DNA replication, mismatch repair, and the p53 signaling pathway. The most activated p53 signaling pathway, which has been linked to oncogenic effects38, promotes tumor growth in NSCLC and pancreatic ductal adenocarcinoma (PDAC)39,40. However, these DEGs’ specific functions and molecular mechanisms need to be investigated further.
Because of its flexibility and power, ML is increasingly being used to screen novel biomarkers. We used two recently popular ML approaches, LASSO logistic regressions, and SVM-RFM, to identify the best diagnostic biomarkers for NSCLC. After combining the two methods and ROC analysis, eight NSCLC-related biomarkers with accurate predictive properties were identified (the AUCs of all these eight genes were greater than 0.89), including ADAMTS8, ABCA8, TPX2, CEP55, ASPA, FHL1, RAMP3, and PYCR1 genes. A disintegrin and metallopeptidase with thrombospondin motif type 8 (ADAMTS8) is a member of the zinc metalloproteinase family and is considered a tumor suppressor41. Wu et al. found that ADAMTS8 has been associated with clinical staging and lymph node metastasis in esophageal cancer patients42. ADAMTS8 can also inhibit lung cancer by targeting Vascular endothelial growth factor (VEGFA)43. ATP-binding cassette subfamily A 8 (ABCA8) has been linked to tumors. Studies have shown that ABCA8 can inhibit the proliferation of breast cancer cells by regulating the AMPK/mTOR signaling pathway44, and ABCA8 can also be used as a prognostic marker for hepatocellular carcinoma45 and gastric adenocarcinoma46. Centrosomal protein, 55 kD (CEP55) has been reported to be a potential biomarker and therapeutic target for PDAC and lung cancer47. Several studies have shown that CEP55 is carcinogenic in the colon and esophageal cancers48,49. Targeting protein for xenopus kinesin-like protein 2 (TPX2) is a cell cycle-associated gene that plays a pro-oncogenic role in hepatocellular carcinoma cells and acts synergistically with anti-cancer drugs50. TPX2 can also be a therapeutic target for breast cancer and is associated with patient prognosis51. Current studies have shown that recombinant Helicobacter Pylori aspartate ammonia-lyase (ASPA) is an effective predictor of prognosis in colorectal cancer patients52. Four-and-a-half LIM domains protein (FHL1) has a diagnostic value in microscopic papillary thyroid carcinoma53, and it has been reported that FHL1 acts as an inhibitor in colorectal cancer cells54–56. Receptor activity-modifying protein 3 (RAMP3) is an accessory molecule that forms complexes with and regulates the function of specific G protein-coupled receptors (GPCRs). To date, studies have shown that RAMP3 is overexpressed in hepatocellular carcinoma patients and that RAMP3 is an independent prognostic factor for overall survival and RFS57. Pyrroline-5-Carboxylate Reductase 1 (PYCR1) is a mitochondrial enzyme that is the final step in the proline biosynthetic pathway. Currently, PYCR1 has been reported to regulate tumour cell proliferation in hepatocellular carcinoma and cloud be an effective therapeutic target for multiple myeloma58,59, as well as inhibit the development of clear cell renal cell carcinoma by causing mitochondrial dysfunction and interfering with oxidative stress pathways60. Thus, according to the available studies, the eight biomarkers mentioned above play an important role in tumorigenesis and progression, but their exact mechanisms in NSCLC remain unknown.
Given the importance of the immune microenvironment in the development of lung cancer, we also performed immunological analyses. We found that monocytes differed most between normal and NSCLC tissue samples and correlated closely with all eight previously obtained biomarkers, implying that monocytes may be the most active immune cells in NSCLC. Monocytes have been shown to play a role in tumor progression61. For example, up-regulation of monocytes promotes CT26 tumor progression62,63. It has also been linked to the immune checkpoint matrix metalloproteinases in hepatocellular carcinoma64. The findings of this study suggest that monocytes may contribute to clinical immunotherapy and warrant further investigation.
Another significant finding in our study was that TPX2 expression was linked to poor prognosis, and TPX2 was up-regulated in both bioinformatics and western blot validation. We also found that TPX2 promoted the proliferation and migration of lung cancer A549 cells in vitro, suggesting that TPX2 was involved in developing NSCLC and could be a therapeutic target for NSCLC. However, the exact mechanism remains unknown, and we will investigate the role of TPX2 in vivo experiments.
ML methods have been successfully applied in cancer research in recent years, for example, for cancer classification65, for analyzing gene chip data to screen for cancer-related biomarkers to assist doctors in making better diagnoses and decisions66, and for cancer prediction to significantly improve prediction accuracy65. Notably, the ML method has been demonstrated to be effective in determining a non-invasive, accurate, and reliable diagnosis of NSCLC. Li et al. used specific carbonyl volatile organic compounds in exhaled breath as a biomarker for detecting lung cancer to distinguish lung cancer patients from healthy controls and patients with benign lung nodules66. Zhang et al. suggest that 5-hydroxymethylcytosine in circulating cell-free DNA can be used to diagnose and treat NSCLC67. Zhang et al. concluded that five circulating micro RNAs have important prognostic capabilities in lung cancer68. Wang et al. identified eight differentially expressed long non-coding RNAs in LUAD that could be used as potential diagnostic biomarkers69.
This study combines machine learning methods (LASSO algorithm and SVM-RFE algorithm) with medical experiments to identify non-small cell lung cancer (NSCLC)-related biomarkers through the GEO public database, and finds that the progression of NSCLC is associated with immune cell infiltration, which greatly improves the efficiency of basic experiments for clinicians, and the screened NSCLC-related biomarkers is important for the prevention, diagnosis and treatment of NSCLC. Subsequently, we used in vitro functional assays to silence the prognostic TPX2 biomarker gene in NSCLC A549 cells and found that the proliferation and migration ability of A549 cells were significantly reduced, which further confirmed that the NSCLC-related biomarkers screened by the machine learning approach are novel and reliable. Our study provides a new idea for the pathogenesis and targeted therapy of NSCLC.
Conclusion
In conclusion, we used machine learning methods to identify eight diagnostic biomarkers for NSCLC, including ADAMTS8, ABCA8, TPX2, CEP55, ASPA, FHL1, RAMP3, and PYCR1 genes, followed by functional enrichment analysis and immune correlation analysis, and we validated the potential role of the TPX2 gene in vitro. Our findings identify new potential biomarkers for diagnosing and treating NSCLC and reveal new approaches that may have therapeutic potential for NSCLC.
Supplementary Information
Acknowledgements
We are grateful to the GEO database for providing the platform and to the contributors for uploading their meaningful datasets. We thank Bullet Edits Limited for the linguistic editing and proofreading of the manuscript. This work was done at the First Affiliated Hospital of Guangxi Medical University.
Author contributions
W.F.W. and C.Q. L. designed the implementation of the research, drafted preliminary papers, and participated in investigations. W.F.W., Q.S.S. and C.Q.L. participated in research design and implementation, manuscript revision, manuscript submission, and fund acquisition. All authors read and approved the final manuscript.
Funding
This research was supported by Guangxi Natural Science Foundation under Grant NO. 2020GXNSFDA238003.
Data availability
The datasets generated during the current study are available in the Gene Expression Omnibus (GEO) repository, (https://www.ncbi.nlm.nih.gov/geo/), (https://www.ncbi.nlm.nih.gov/geo/query/acc.cgi?acc=GSE18842), (https://www.ncbi.nlm.nih.gov/geo/query/acc.cgi?acc=GSE21933), (https://www.ncbi.nlm.nih.gov/geo/query/acc.cgi?acc=GSE32863).
Competing interests
The authors declare no competing interests.
Footnotes
Publisher's note
Springer Nature remains neutral with regard to jurisdictional claims in published maps and institutional affiliations.
Supplementary Information
The online version contains supplementary material available at 10.1038/s41598-022-21050-5.
References
- 1.Meador CB, Lovly CM. A tale of two histologies: Dissecting the biology of lineage transformation in lung cancer. Cancer Discov. 2021;11:2962–2964. doi: 10.1158/2159-8290.CD-21-1222. [DOI] [PMC free article] [PubMed] [Google Scholar]
- 2.Esfahani MS, et al. Inferring gene expression from cell-free DNA fragmentation profiles. Nat. Biotechnol. 2022 doi: 10.1038/s41587-022-01222-4. [DOI] [PMC free article] [PubMed] [Google Scholar]
- 3.Dai J, et al. Sleeve resection after neoadjuvant chemoimmunotherapy in the treatment of locally advanced non-small cell lung cancer. Transl. Lung Cancer Res. 2022;11:188–200. doi: 10.21037/tlcr-22-56. [DOI] [PMC free article] [PubMed] [Google Scholar]
- 4.Basile D, et al. Tumor budding is an independent prognostic factor in stage III colon cancer patients: A post-hoc analysis of the IDEA-France phase III trial (PRODIGE-GERCOR) Ann. Oncol. 2022 doi: 10.1016/j.annonc.2022.03.002. [DOI] [PubMed] [Google Scholar]
- 5.Jin S, et al. Machine learning predicts cancer-associated deep vein thrombosis using clinically available variables. Int. J. Med. Inform. 2022;161:104733. doi: 10.1016/j.ijmedinf.2022.104733. [DOI] [PubMed] [Google Scholar]
- 6.Lai Y-L, et al. Identification of a steroid hormone-associated gene signature predicting the prognosis of prostate cancer through an integrative bioinformatics analysis. Cancers. 2022;14:1565. doi: 10.3390/cancers14061565. [DOI] [PMC free article] [PubMed] [Google Scholar]
- 7.Zheng H, et al. Multiparametric MRI-based radiomics model to predict pelvic lymph node invasion for patients with prostate cancer. Eur. Radiol. 2022 doi: 10.1007/s00330-022-08625-6. [DOI] [PMC free article] [PubMed] [Google Scholar]
- 8.Ayyad SM, et al. A new framework for precise identification of prostatic adenocarcinoma. Sensors. 2022;22:1848. doi: 10.3390/s22051848. [DOI] [PMC free article] [PubMed] [Google Scholar]
- 9.Ding F-P, Tian J-Y, Wu J, Han D-F, Zhao D. Identification of key genes as predictive biomarkers for osteosarcoma metastasis using translational bioinformatics. Cancer Cell. Int. 2021;21:640. doi: 10.1186/s12935-021-02308-w. [DOI] [PMC free article] [PubMed] [Google Scholar]
- 10.Luo Z, et al. Radiomics analysis of multiparametric MRI for prediction of synchronous lung metastases in osteosarcoma. Front. Oncol. 2022;12:802234. doi: 10.3389/fonc.2022.802234. [DOI] [PMC free article] [PubMed] [Google Scholar]
- 11.Su Y, et al. Colon cancer diagnosis and staging classification based on machine learning and bioinformatics analysis. Comput. Biol. Med. 2022;145:105409. doi: 10.1016/j.compbiomed.2022.105409. [DOI] [PubMed] [Google Scholar]
- 12.Cai J, et al. A radiomics study to predict invasive pulmonary adenocarcinoma appearing as pure ground-glass nodules. Clin. Radiol. 2021;76:143–151. doi: 10.1016/j.crad.2020.10.005. [DOI] [PubMed] [Google Scholar]
- 13.van Vliet-Pérez SM, et al. Hyperspectral imaging for tissue classification after advanced stage ovarian cancer surgery-a pilot study. Cancers. 2022;14:1422. doi: 10.3390/cancers14061422. [DOI] [PMC free article] [PubMed] [Google Scholar]
- 14.Granata V, et al. EOB-MR based radiomics analysis to assess clinical outcomes following liver resection in colorectal liver metastases. Cancers. 2022;14:1239. doi: 10.3390/cancers14051239. [DOI] [PMC free article] [PubMed] [Google Scholar]
- 15.R Core Team. R: A Language and Environment for Statistical Computing. R Foundation for Statistical Computing, (Vienna, Austria, 2017). https://www.R-project.org.
- 16.Ritchie ME, et al. limma powers differential expression analyses for RNA-sequencing and microarray studies. Nucleic Acids Res. 2015;43:e47. doi: 10.1093/nar/gkv007. [DOI] [PMC free article] [PubMed] [Google Scholar]
- 17.Kanehisa M, Goto S. KEGG: Kyoto encyclopedia of genes and genomes. Nucleic Acids Res. 2000;28:27–30. doi: 10.1093/nar/28.1.27. [DOI] [PMC free article] [PubMed] [Google Scholar]
- 18.Kanehisa M. Toward understanding the origin and evolution of cellular organisms. Protein Sci. 2019;28:1947–1951. doi: 10.1002/pro.3715. [DOI] [PMC free article] [PubMed] [Google Scholar]
- 19.Kanehisa M, Furumichi M, Sato Y, Ishiguro-Watanabe M, Tanabe M. KEGG: Integrating viruses and cellular organisms. Nucleic Acids Res. 2021;49:D545–D551. doi: 10.1093/nar/gkaa970. [DOI] [PMC free article] [PubMed] [Google Scholar]
- 20.Yu G, Wang L-G, Han Y, He Q-Y. clusterProfiler: An R package for comparing biological themes among gene clusters. OMICS. 2012;16:284–287. doi: 10.1089/omi.2011.0118. [DOI] [PMC free article] [PubMed] [Google Scholar]
- 21.Perez-Iratxeta C, Bork P, Andrade-Navarro MA. Update of the G2D tool for prioritization of gene candidates to inherited diseases. Nucleic Acids Res. 2007;35:W212–216. doi: 10.1093/nar/gkm223. [DOI] [PMC free article] [PubMed] [Google Scholar]
- 22.Subramanian A, et al. Gene set enrichment analysis: A knowledge-based approach for interpreting genome-wide expression profiles. Proc. Natl. Acad. Sci. USA. 2005;102:15545–15550. doi: 10.1073/pnas.0506580102. [DOI] [PMC free article] [PubMed] [Google Scholar]
- 23.Tibshirani R. The lasso method for variable selection in the Cox model. Stat. Med. 1997;16:385–395. doi: 10.1002/(SICI)1097-0258(19970228)16:4<385::AID-SIM380>3.0.CO;2-3. [DOI] [PubMed] [Google Scholar]
- 24.Lin X, et al. A support vector machine-recursive feature elimination feature selection method based on artificial contrast variables and mutual information. J. Chromatogr. B Analyt. Technol. Biomed. Life Sci. 2012;910:149–155. doi: 10.1016/j.jchromb.2012.05.020. [DOI] [PubMed] [Google Scholar]
- 25.Friedman J, Hastie T, Tibshirani R. Regularization paths for generalized linear models via coordinate descent. J. Stat. Softw. 2010;33:1–22. doi: 10.18637/jss.v033.i01. [DOI] [PMC free article] [PubMed] [Google Scholar]
- 26.Huang M-L, Hung Y-H, Lee WM, Li RK, Jiang B-R. SVM-RFE based feature selection and Taguchi parameters optimization for multiclass SVM classifier. Sci. World J. 2014;2014:795624. doi: 10.1155/2014/795624. [DOI] [PMC free article] [PubMed] [Google Scholar]
- 27.Pathan M, et al. FunRich: An open access standalone functional enrichment and interaction network analysis tool. Proteomics. 2015;15:2597–2601. doi: 10.1002/pmic.201400515. [DOI] [PubMed] [Google Scholar]
- 28.Tang X, Zhang S, Wang Z, Liu J, Ying Z. ProcData: An R package for process data analysis. Psychometrika. 2021;86:1058–1083. doi: 10.1007/s11336-021-09798-7. [DOI] [PubMed] [Google Scholar]
- 29.Xue G, Hua L, Zhou N, Li J. Characteristics of immune cell infiltration and associated diagnostic biomarkers in ulcerative colitis: Results from bioinformatics analysis. Bioengineered. 2021;12:252–265. doi: 10.1080/21655979.2020.1863016. [DOI] [PMC free article] [PubMed] [Google Scholar]
- 30.Serang S, Jacobucci R, Brimhall KC, Grimm KJ. Exploratory mediation analysis via regularization. Struct. Equ. Modeling. 2017;24:733–744. doi: 10.1080/10705511.2017.1311775. [DOI] [PMC free article] [PubMed] [Google Scholar]
- 31.Oudkerk M, Liu S, Heuvelmans MA, Walter JE, Field JK. Lung cancer LDCT screening and mortality reduction–evidence, pitfalls and future perspectives. Nat. Rev. Clin. Oncol. 2021;18:135–151. doi: 10.1038/s41571-020-00432-6. [DOI] [PubMed] [Google Scholar]
- 32.Chen X, Sun L-G, Zhao Y. NCMCMDA: miRNA-disease association prediction through neighborhood constraint matrix completion. Brief. Bioinform. 2021;22:485–496. doi: 10.1093/bib/bbz159. [DOI] [PubMed] [Google Scholar]
- 33.Chen X, Li T-H, Zhao Y, Wang C-C, Zhu C-C. Deep-belief network for predicting potential miRNA-disease associations. Brief. Bioinform. 2021;22:bbaa186. doi: 10.1093/bib/bbaa186. [DOI] [PubMed] [Google Scholar]
- 34.Chen X, Zhu C-C, Yin J. Ensemble of decision tree reveals potential miRNA-disease associations. PLoS Comput. Biol. 2019;15:e1007209. doi: 10.1371/journal.pcbi.1007209. [DOI] [PMC free article] [PubMed] [Google Scholar]
- 35.Li N, et al. One-off low-dose CT for lung cancer screening in China: A multicentre, population-based, prospective cohort study. Lancet. Respir. Med. 2022;10:378–391. doi: 10.1016/S2213-2600(21)00560-9. [DOI] [PubMed] [Google Scholar]
- 36.Shan G, et al. Genomic and tumor microenvironment differences between cell cycle progression pathway altered/non-altered patients with lung adenocarcinoma. Front. Oncol. 2022;12:843528. doi: 10.3389/fonc.2022.843528. [DOI] [PMC free article] [PubMed] [Google Scholar]
- 37.Li J, et al. Identifying 18F-FDG PET-metabolic radiomic signature for lung adenocarcinoma prognosis via the leveraging of prognostic transcriptomic module. Quant. Imaging Med. Surg. 2022;12:1893–1908. doi: 10.21037/qims-21-706. [DOI] [PMC free article] [PubMed] [Google Scholar]
- 38.Su R, et al. A pan-cancer analysis of the oncogenic role of Holliday junction recognition protein in human tumors. Open Med. (Wars) 2022;17:317–328. doi: 10.1515/med-2022-0423. [DOI] [PMC free article] [PubMed] [Google Scholar]
- 39.Xiao X, et al. Green tea-derived theabrownin suppresses human non-small cell lung carcinoma in xenograft model through activation of not only p53 signaling but also MAPK/JNK signaling pathway. J. Ethnopharmacol. 2022;291:115167. doi: 10.1016/j.jep.2022.115167. [DOI] [PubMed] [Google Scholar]
- 40.Ma Z, et al. ZMAT1 acts as a tumor suppressor in pancreatic ductal adenocarcinoma by inducing SIRT3/p53 signaling pathway. J. Exp. Clin. Cancer Res. 2022;41:130. doi: 10.1186/s13046-022-02310-8. [DOI] [PMC free article] [PubMed] [Google Scholar]
- 41.Zhang K, et al. ADAMTS8 inhibits cell proliferation and invasion, and induces apoptosis in breast cancer. Onco. Targets Ther. 2020;13:8373–8382. doi: 10.2147/OTT.S248085. [DOI] [PMC free article] [PubMed] [Google Scholar]
- 42.Wu Z, et al. ADAMTS8 inhibits progression of esophageal squamous cell carcinoma. DNA Cell. Biol. 2020 doi: 10.1089/dna.2020.6053. [DOI] [PubMed] [Google Scholar]
- 43.Zhang Y, Hu K, Qu Z, Xie Z, Tian F. ADAMTS8 inhibited lung cancer progression through suppressing VEGFA. Biochem. Biophys. Res. Commun. 2022;598:1–8. doi: 10.1016/j.bbrc.2022.01.110. [DOI] [PubMed] [Google Scholar]
- 44.Lv C, Yang H, Yu J, Dai X. ABCA8 inhibits breast cancer cell proliferation by regulating the AMP activated protein kinase/mammalian target of rapamycin signaling pathway. Environ. Toxicol. 2022 doi: 10.1002/tox.23495. [DOI] [PubMed] [Google Scholar]
- 45.Zhang J, Zhang X, Li J, Song Z. Systematic analysis of the ABC transporter family in hepatocellular carcinoma reveals the importance of ABCB6 in regulating ferroptosis. Life Sci. 2020;257:118131. doi: 10.1016/j.lfs.2020.118131. [DOI] [PubMed] [Google Scholar]
- 46.Guo Y, Wang ZW, Su WH, Chen J, Wang YL. Prognostic value and immune infiltrates of ABCA8 and FABP4 in stomach adenocarcinoma. Biomed. Res. Int. 2020;2020:4145164. doi: 10.1155/2020/4145164. [DOI] [PMC free article] [PubMed] [Google Scholar]
- 47.Wang C, et al. Identification of hub genes in pancreatic ductal adenocarcinoma using bioinformatics analysis. Iran J. Public Health. 2021;50:2238–2245. doi: 10.18502/ijph.v50i11.7578. [DOI] [PMC free article] [PubMed] [Google Scholar]
- 48.Lin Y, Chen Y, Shen R, Chen D, Lin Y. MicroRNA-148a-3p suppresses cell proliferation and migration of esophageal carcinoma by targeting CEP55. Cell. Mol. Biol. Lett. 2021;26:54. doi: 10.1186/s11658-021-00298-1. [DOI] [PMC free article] [PubMed] [Google Scholar]
- 49.Bozic D, et al. Predicting sulforaphane-induced adverse effects in colon cancer patients via in silico investigation. Biomed. Pharmacother. 2022;146:112598. doi: 10.1016/j.biopha.2021.112598. [DOI] [PubMed] [Google Scholar]
- 50.Wang X, Wang J, Shen H, Luo Z, Lu X. Downregulation of TPX2 impairs the antitumor activity of CD8+ T cells in hepatocellular carcinoma. Cell. Death Dis. 2022;13:223. doi: 10.1038/s41419-022-04645-8. [DOI] [PMC free article] [PubMed] [Google Scholar]
- 51.Kahl I, et al. The cell cycle-related genes RHAMM, AURKA, TPX2, PLK1, and PLK4 are associated with the poor prognosis of breast cancer patients. J. Cell. Biochem. 2022;123:581–600. doi: 10.1002/jcb.30205. [DOI] [PubMed] [Google Scholar]
- 52.Zhao F, et al. Identification of sixteen metabolic genes as potential biomarkers for colon adenocarcinoma. J. BUON. 2021;26:1252–1259. [PubMed] [Google Scholar]
- 53.Yang F, et al. Identification of key genes associated with papillary thyroid microcarcinoma characteristics by integrating transcriptome sequencing and weighted gene co-expression network analysis. Gene. 2022;811:146086. doi: 10.1016/j.gene.2021.146086. [DOI] [PubMed] [Google Scholar]
- 54.Liu Y, et al. FHL1 Inhibits the progression of colorectal cancer by regulating the Wnt/β-catenin signaling pathway. J. Cancer. 2021;12:5345–5354. doi: 10.7150/jca.60543. [DOI] [PMC free article] [PubMed] [Google Scholar]
- 55.Eshibona N, et al. Upregulation of FHL1, SPNS3, and MPZL2 predicts poor prognosis in pediatric acute myeloid leukemia patients with FLT3-ITD mutation. Leuk. Lymphoma. 2022 doi: 10.1080/10428194.2022.2045594. [DOI] [PubMed] [Google Scholar]
- 56.Niu C, et al. Downregulation and growth inhibitory role of FHL1 in lung cancer. Int. J. Cancer. 2012;130:2549–2556. doi: 10.1002/ijc.26259. [DOI] [PubMed] [Google Scholar]
- 57.Fang A, et al. RAMP3 is a prognostic indicator of liver cancer and might reduce the adverse effect of TP53 mutation on survival. Future Oncol. 2018;14:2615–2625. doi: 10.2217/fon-2018-0296. [DOI] [PubMed] [Google Scholar]
- 58.Zhang J, Shang L, Jiang W, Wu W. Shikonin induces apoptosis and autophagy via downregulation of pyrroline-5-carboxylate reductase1 in hepatocellular carcinoma cells. Bioengineered. 2022;13:7904–7918. doi: 10.1080/21655979.2022.2052673. [DOI] [PMC free article] [PubMed] [Google Scholar]
- 59.Oudaert I, et al. Pyrroline-5-carboxylate reductase 1: A novel target for sensitizing multiple myeloma cells to bortezomib by inhibition of PRAS40-mediated protein synthesis. J. Exp. Clin. Cancer Res. 2022;41:45. doi: 10.1186/s13046-022-02250-3. [DOI] [PMC free article] [PubMed] [Google Scholar]
- 60.Wu Y, et al. A mitochondrial dysfunction and oxidative stress pathway-based prognostic signature for clear cell renal cell carcinoma. Oxid. Med. Cell Longev. 2021;2021:9939331. doi: 10.1155/2021/9939331. [DOI] [PMC free article] [PubMed] [Google Scholar]
- 61.Albakri MM, Huang SC-C, Tashkandi HN, Sieg SF. Fatty acids secreted from head and neck cancer induce M2-like macrophages. J. Leukoc. Biol. 2022 doi: 10.1002/JLB.1A0521-251R. [DOI] [PubMed] [Google Scholar]
- 62.Simon Davis DA, et al. Machine learning predicts cancer subtypes and progression from blood immune signatures. PLoS ONE. 2022;17:e0264631. doi: 10.1371/journal.pone.0264631. [DOI] [PMC free article] [PubMed] [Google Scholar]
- 63.Hecking T, et al. Programmed cell death ligand-1 (PDL-1) correlates with tumor infiltration by immune cells and represents a promising target for immunotherapy in endometrial cancer. Anticancer Res. 2022;42:1367–1376. doi: 10.21873/anticanres.15606. [DOI] [PubMed] [Google Scholar]
- 64.Zhang L, et al. Comprehensive analysis of the MIR4435-2HG/miR-1-3p/MMP9/miR-29-3p/DUXAP8 ceRNA network axis in hepatocellular carcinoma. Discov. Oncol. 2021;12:38. doi: 10.1007/s12672-021-00436-3. [DOI] [PMC free article] [PubMed] [Google Scholar]
- 65.Cruz JA, Wishart DS. Applications of machine learning in cancer prediction and prognosis. Cancer Inform. 2007;2:59–77. [PMC free article] [PubMed] [Google Scholar]
- 66.Li M, et al. Breath carbonyl compounds as biomarkers of lung cancer. Lung Cancer. 2015;90:92–97. doi: 10.1016/j.lungcan.2015.07.005. [DOI] [PubMed] [Google Scholar]
- 67.Zhang J, et al. 5-Hydroxymethylome in circulating cell-free DNA as a potential biomarker for non-small-cell lung cancer. Genom. Proteom. Bioinformat. 2018;16:187–199. doi: 10.1016/j.gpb.2018.06.002. [DOI] [PMC free article] [PubMed] [Google Scholar]
- 68.Zhang Y-H, Jin M, Li J, Kong X. Identifying circulating miRNA biomarkers for early diagnosis and monitoring of lung cancer. Biochim. Biophys. Acta Mol. Basis Dis. 2020;1866:165847. doi: 10.1016/j.bbadis.2020.165847. [DOI] [PubMed] [Google Scholar]
- 69.Wang Y, et al. Screening key lncRNAs for human lung adenocarcinoma based on machine learning and weighted gene co-expression network analysis. Cancer Biomark. 2019;25:313–324. doi: 10.3233/CBM-190225. [DOI] [PubMed] [Google Scholar]
Associated Data
This section collects any data citations, data availability statements, or supplementary materials included in this article.
Supplementary Materials
Data Availability Statement
The datasets generated during the current study are available in the Gene Expression Omnibus (GEO) repository, (https://www.ncbi.nlm.nih.gov/geo/), (https://www.ncbi.nlm.nih.gov/geo/query/acc.cgi?acc=GSE18842), (https://www.ncbi.nlm.nih.gov/geo/query/acc.cgi?acc=GSE21933), (https://www.ncbi.nlm.nih.gov/geo/query/acc.cgi?acc=GSE32863).


