

Abstract
Objective
To estimate systematic and anatomic site–specific age‐standardized prevalence rates (ASRs) and analyze the secular trends of osteoarthritis (OA) at global, regional, and national levels.
Methods
Data were derived from the Global Burden of Disease Study 2019. ASRs and their estimated annual percentage changes (EAPCs) were used to describe the secular trends of OA according to age group, sex, region, country, and territory, as well as the joints involved.
Results
Globally, prevalent cases of OA increased by 113.25%, from 247.51 million in 1990 to 527.81 million in 2019. ASRs were 6,173.38 per 100,000 in 1990 and 6,348.25 per 100,000 in 2019, with an average annual increase of 0.12% (95% confidence interval [95% CI] 0.11%, 0.14%). The ASR of OA increased for the knee, hip, and other joints, but decreased for the hand, with EAPCs of 0.32 (95% CI 0.29, 0.34), 0.28 (95% CI 0.26, 0.31), 0.18 (95% CI 0.18, 0.19), and −0.36 (95% CI −0.38, −0.33), respectively. OA prevalence increased with age and revealed female preponderance, geographic diversity, and disparity with regard to anatomic site. OA of the knee contributed the most to the overall burden, while OA of the hip had the highest EAPC in most regions.
Conclusion
OA has remained a major public health concern worldwide over the past decades. The prevalence of OA has increased and diversified by geographic location and affected joint. Prevention and early treatment are pivotal to mitigating the growing burden of OA.
INTRODUCTION
Osteoarthritis (OA) is a worldwide highly prevalent chronic joint disease that causes pain, disability, and loss of function (1, 2). Global trends showed a 114.5% increase in years lived with disability due to OA from 1990 to 2019 (3, 4). However, there is no nonsurgical intervention that can prevent, halt, or even delay OA progression. Moreover, available medications, such as nonsteroidal antiinflammatory drugs, have been associated with a clinically relevant 50–100% increase in the risk of myocardial infarction or death from cardiovascular causes (5). Therefore, the public, health care providers, and policymakers should be aware of the heavy burden of OA.
OA prevalence varies with the joints involved. The knee is the most frequently affected joint, followed by the hand and the hip (1, 6). Knee, hip, and hand OA each have a distinct effect on overall health. For instance, knee and hip OA, but not hand OA, are associated with an increased risk of cardiovascular and all‐cause premature mortality (7). In addition, OA has been shown to have different pathologic mechanisms in different joints. OA of the hand has been associated with systemic inflammation, while OA of the knee and OA of the hip have been correlated with excessive joint load and injury (1, 8). Taken together, these findings indicate a need for documentation regarding the burden of site‐specific OA, which remains scarce in the literature.
Although various studies have demonstrated the burden of OA in specific regions or territories, several new insights have been made. Findings on the prevalence of OA have differed between studies due to the definition used, age categories included, and sex distribution of the study population (1, 9, 10). For instance, Cross et al reported the age‐standardized prevalence rate (ASR) of OA at the hip and knee joints but examined Global Burden of Disease (GBD) Study geographic regions only (11). Safiri et al systematically analyzed the burden of OA at the global, regional, and national levels using data derived from the GBD Study 2017; however, only the hip and knee joints were included as sites of OA (12). Therefore, we aimed to provide a systematic, comparable, and up‐to‐date prevalence as well as secular trend analysis of OA at 4 anatomic sites at the global, regional, and national levels, taking advantage of the new data sources, higher standardization, and improved methodology, as well as 2 new anatomic sites of OA (i.e., OA of the hand and OA of other joints except the spine), included in the GBD Study 2019 (3). In addition, we analyzed trends in countries and territories grouped according to the Socio‐demographic Index (SDI).
PATIENTS AND METHODS
Overview
The GBD Study aimed to provide reliable and up‐to‐date global, regional, and national results on the burden of diseases, injures, and risk factors. The study integrated all available data, including published data, grey literature data, survey data, and hospital and clinical data (13). A detailed description of the methodology for collecting and processing these data, and informing the results in the GBD Study 2019, as well as the main developments compared with earlier series, has been published elsewhere (3, 14, 15). Briefly, after data collection, the risk of bias was assessed for each data source and corrected for standardized estimation using a Bayesian meta‐regression tool (DisMod‐MR 2.1). As a result, the GBD Study 2019 provides comprehensive and systematic assessments of age and sex‐specific incidence, prevalence, mortality, years of life lost, years lived with disability, and disability‐adjusted life years for 369 diseases and injuries in 204 countries and territories from 1990 to 2019. The reference definition of OA in the GBD Study 2019 was symptomatic OA that was radiologically confirmed as Kellgren/Lawrence grade 2–4 and painful for at least 1 month of the past 12 months (3, 16). The details of input data and a methodologic summary for OA (including input data, age and sex splitting, data adjustment, modeling strategy, and corresponding severity and disability) are available in Supplementary Appendix 1 of the GBD Study 2019 (3).
Data source
Data on prevalent cases and ASRs of OA from 1990 to 2019, according to age group, sex, region, and country or territory, and the 4 anatomic sites (knee, hip, hand, and other joints except for the spine), were collected using the Global Health Data Exchange (GHDx) query tool (http://ghdx.healthdata.org/gbd-results-tool) (4). A total of 204 countries and territories were categorized into 5 groups (i.e., low, low‐middle, middle, high‐middle, and high) according to the SDI, a compound indicator based on fertility, income, and educational attainment; and into 21 regions (e.g., East Asia) according to geographic location. Supplementary Tables 1–4, available on the Arthritis & Rheumatology website at http://onlinelibrary.wiley.com/doi/10.1002/art.42089, show results for knee OA, hip OA, hand OA, and OA at other sites, respectively, according to sex, SDI, and geographic region. Table 1 and Supplementary Table 5 (available on the Arthritis & Rheumatology website at http://onlinelibrary.wiley.com/doi/10.1002/art.42089) contain summary data for the 5 SDI categories, the 21 geographic regions, and 204 countries and territories. Information on SDI at the national level was obtained from GHDx (http://ghdx.healthdata.org/record/ihme‐data/gbd‐2019‐socio‐demographic‐index‐sdi‐1950‐2019).
Table 1.
Number of prevalent cases and ASR of OA in 1990 and 2019*
| 1990 | 2019 | Change from 1990 to 2019 | ||||
|---|---|---|---|---|---|---|
| Prevalent cases, no. × 106 (95% UI) | ASR, no. × 103 per 100,000 (95% UI) | Prevalent cases, no. × 106 (95% UI) | ASR, no. × 103 per 100,000 (95% UI) | % change† | EAPC (95% CI) | |
| Overall | 247.51 (224.05, 275.50) | 6.17 (5.61, 6.85) | 527.81 (478.67, 584.79) | 6.35 (5.78, 7.02) | 113.25 | 0.12 (0.11, 0.14) |
| Sex | ||||||
| Male | 96.98 (87.37, 108.26) | 5.14 (4.66, 5.71) | 210.37 (190.20, 233.66) | 5.32 (4.83, 5.89) | 116.91 | 0.07 (0.05, 0.09) |
| Female | 150.53 (136.51, 166.90) | 7.08 (6.42, 7.85) | 317.44 (288.48, 350.27) | 7.28 (6.61, 8.04) | 110.88 | 0.17 (0.14, 0.20) |
| SDI | ||||||
| Low | 12.56 (11.28, 14.13) | 5.10 (4.61, 5.69) | 29.05 (26.10, 32.63) | 5.33 (4.82, 5.93) | 131.27 | 0.16 (0.16, 0.17) |
| Low‐middle | 31.65 (28.31, 35.33) | 5.07 (4.57, 5.62) | 77.44 (69.56, 86.09) | 5.49 (4.95, 6.08) | 144.68 | 0.32 (0.30, 0.33) |
| Middle | 57.29 (51.17, 63.95) | 5.35 (4.81, 5.94) | 149.93 (134.32, 166.72) | 5.75 (5.18, 6.37) | 161.69 | 0.30 (0.26, 0.34) |
| High‐middle | 67.38 (60.83, 74.92) | 6.25 (5.66, 6.94) | 130.18 (117.54, 143.95) | 6.37 (5.75, 7.05) | 93.19 | 0.01 (−0.01, 0.04) |
| High | 78.51 (71.21, 87.00) | 7.77 (7.03, 8.65) | 140.97 (128.37, 155.67) | 7.77 (7.03, 8.65) | 79.54 | 0.22 (0.18, 0.26) |
| Site of OA | ||||||
| Knee | 163.91 (141.00, 187.92) | 4.07 (3.52, 4.66) | 364.58 (315.25, 417.40) | 4.38 (3.79, 5.00) | 122.42 | 0.32 (0.29, 0.34) |
| Hip | 14.50 (11.17, 18.24) | 0.37 (0.29, 0.46) | 32.99 (25.69, 41.12) | 0.40 (0.31, 0.50) | 127.51 | 0.28 (0.26, 0.31) |
| Hand | 74.27 (56.30, 97.42) | 1.89 (1.43, 2.47) | 142.48 (108.63, 186.79) | 1.73 (1.32, 2.25) | 91.84 | −0.36 (−0.38, −0.33) |
| Other | 27.60 (20.94, 34.93) | 0.71 (0.54, 0.89) | 61.42 (46.68, 77.73) | 0.75 (0.57, 0.94) | 122.56 | 0.18 (0.18, 0.19) |
| Region | ||||||
| High‐income Asia Pacific | 16.23 (14.72, 17.99) | 7.90 (7.17, 8.74) | 32.22 (29.36, 35.37) | 8.37 (7.63, 9.26) | 98.55 | 0.48 (0.38, 0.57) |
| Central Asia | 2.51 (2.25, 2.83) | 5.34 (4.80, 6.02) | 4.29 (3.83, 4.85) | 5.52 (4.96, 6.18) | 70.87 | 0.10 (0.09, 0.11) |
| East Asia | 53.71 (47.68, 60.47) | 5.88 (5.24, 6.57) | 137.28 (122.01, 154.09) | 6.32 (5.65, 7.08) | 155.61 | 0.35 (0.28, 0.42) |
| South Asia | 28.61 (25.55, 32.12) | 4.79 (4.31, 5.33) | 75.63 (68.06, 84.45) | 5.22 (4.71, 5.79) | 164.39 | 0.32 (0.31, 0.33) |
| Southeast Asia | 9.96 (8.79, 11.19) | 3.74 (3.31, 4.17) | 26.68 (23.56, 29.92) | 4.13 (3.68, 4.60) | 167.81 | 0.37 (0.35, 0.38) |
| Australasia | 1.76 (1.59, 1.97) | 7.68 (6.92, 8.60) | 3.80 (3.44, 4.23) | 8.34 (7.54, 9.26) | 115.73 | 0.18 (0.14, 0.23) |
| Caribbean | 1.41 (1.27, 1.57) | 5.41 (4.88, 6.01) | 3.02 (2.73, 3.36) | 5.81 (5.24, 6.44) | 114.11 | 0.27 (0.26, 0.29) |
| Central Europe | 7.19 (6.47, 7.97) | 4.88 (4.40, 5.41) | 10.44 (9.43, 11.55) | 5.17 (4.66, 5.72) | 45.21 | 0.19 (0.18, 0.19) |
| Eastern Europe | 21.95 (19.36, 25.06) | 7.87 (6.94, 8.97) | 26.72 (23.73, 30.30) | 7.95 (7.06, 9.03) | 21.70 | −0.25 (−0.36, −0.14) |
| Western Europe | 36.93 (33.44, 40.95) | 6.70 (6.06, 7.45) | 57.03 (51.91, 62.91) | 7.06 (6.39, 7.80) | 54.45 | 0.21 (0.19, 0.23) |
| Andean Latin America | 1.16 (1.05, 1.30) | 5.54 (5.01, 6.14) | 3.49 (3.17, 3.83) | 6.13 (5.57, 6.73) | 199.56 | 0.37 (0.35, 0.39) |
| Central Latin America | 5.19 (4.67, 5.79) | 6.03 (5.43, 6.69) | 15.76 (14.24, 17.53) | 6.54 (5.91, 7.24) | 203.56 | 0.30 (0.28, 0.33) |
| Southern Latin America | 3.45 (3.09, 3.87) | 7.45 (6.69, 8.36) | 6.52 (5.90, 7.28) | 7.45 (6.69, 8.36) | 89.24 | 0.24 (0.21, 0.27) |
| Tropical Latin America | 5.08 (4.56, 5.65) | 5.41 (4.87, 5.99) | 14.51 (13.04, 16.10) | 5.87 (5.28, 6.50) | 185.43 | 0.30 (0.29, 0.31) |
| North Africa and Middle East | 8.68 (7.79, 9.68) | 4.89 (4.40, 5.42) | 24.60 (22.08, 27.33) | 5.34 (4.82, 5.91) | 183.39 | 0.27 (0.26, 0.29) |
| High‐income North America | 31.15 (27.93, 34.89) | 9.40 (8.38, 10.56) | 56.67 (50.98, 63.39) | 9.70 (8.75, 10.86) | 81.93 | 0.06 (−0.07, 0.19) |
| Oceania | 0.15 (0.13, 0.16) | 4.61 (4.13, 5.13) | 0.38 (0.34, 0.43) | 4.91 (4.39, 5.47) | 158.92 | 0.18 (0.14, 0.22) |
| Central Sub‐Saharan Africa | 1.30 (1.16, 1.47) | 5.42 (4.88, 6.07) | 3.20 (2.86, 3.61) | 5.58 (5.02, 6.25) | 146.28 | 0.07 (0.05, 0.08) |
| Eastern Sub‐Saharan Africa | 4.18 (3.75, 4.69) | 5.37 (4.84, 6.01) | 9.73 (8.72, 10.86) | 5.61 (5.06, 6.26) | 132.48 | 0.16 (0.15, 0.16) |
| Southern Sub‐Saharan Africa | 1.76 (1.59, 1.98) | 6.25 (5.64, 6.97) | 3.85 (3.46, 4.30) | 6.54 (5.90, 7.28) | 118.19 | 0.16 (0.16, 0.16) |
| Western Sub‐Saharan Africa | 5.15 (4.63, 5.76) | 5.66 (5.11, 6.31) | 12.00 (10.74, 13.43) | 5.92 (5.35, 6.60) | 132.98 | 0.14 (0.11, 0.18) |
ASR = age‐standardized prevalence rate; OA = osteoarthritis; 95% UI = 95% uncertainty interval; EAPC = estimated annual percentage change; 95% CI = 95% confidence interval; SDI = Socio‐demographic Index.
Percentage change in absolute number.
Statistical analysis
We used ASRs and the corresponding estimated annual percentage changes (EAPCs) to calculate secular trends of OA (17). An age‐standardized method was used when comparing OA prevalence among different populations. The ASR was generated by summing each product of the age‐specific rate (β i , where i represents the ith age group) and the corresponding number of cases (or weight; ω i ) in the same age subgroup i of the selected reference standard population (the GBD world population age standard, which is available in Supplementary Appendix 1 of the GBD Study 2019 [3]), and then dividing by the sum of the standard population weights, i.e.,
Trends in ASR can show the shifting patterns of OA, while EAPC is a commonly used and quantitative means of evaluating the secular trend of ASR over a specified period. Specifically, to calculate EAPCs and obtain 95% confidence intervals (95% CIs), the regression line was fitted to the natural logarithm of the ASR, i.e., y = α + βx + ε, where y = ln(ASR) and x = calendar year, and EAPC = 100 × (eβ – 1) (17, 18). EAPC values >0 indicate an increase over time, and EAPC values <0 indicate a decrease over time. An EAPC value with a 95% CI that includes 0 indicates stability, or no change during the indicated time period.
Pearson's or Spearman's correlation coefficients were used to assess correlations between the ASR and the SDI in the corresponding years (1990 and 2019) at the national level for OA overall and for OA at each of the 4 anatomic sites to identify potentially related factors. Hierarchical cluster analysis was conducted to categorize all 204 countries and territories according to their EAPCs and 95% CIs. All data were analyzed using R software version 4.0.2 (R core team). P values less than 0.05 were considered significant.
RESULTS
Prevalent cases of OA
Globally, prevalent cases of OA increased by 113.25%, from 247.51 million in 1990 to 527.81 million in 2019 (Table 1). The highest numbers of prevalent cases in 2019 were observed in China (132.81 million), followed by India (62.36 million) and the US (51.87 million), with corresponding percentage changes from 1990 of 156.58%, 165.75%, and 79.63%, respectively. Prevalent cases increased in all 5 SDI categories from 1990 to 2019, with the largest increase detected in the middle SDI category (161.69%) (Table 1 and Figure 1A). For GBD geographic regions, the most significant increase in prevalent cases was in Central Latin America (203.56%), followed by Andean Latin America (199.56%) and Tropical Latin America (185.43%) (Table 1 and Figure 1B). At the national level, the greatest increase in OA cases was in the United Arab Emirates (1,069.81%), and the only decrease was in Georgia (–5.90%) (Supplementary Table 5 and Figure 2B). Prevalent cases of OA increased particularly in the those ages ≥95 years, with the absolute number increasing almost 3.8 fold (Supplementary Table 6, available on the Arthritis & Rheumatology website at http://onlinelibrary.wiley.com/doi/10.1002/art.42089), and the peak remained stable at 60–64 years in both 1990 and 2019 (Figure 3A). There were more OA cases in women (317.44 million in 2019) than in men (210.37 million in 2019) (Table 1 and Figure 3B).
Figure 1.
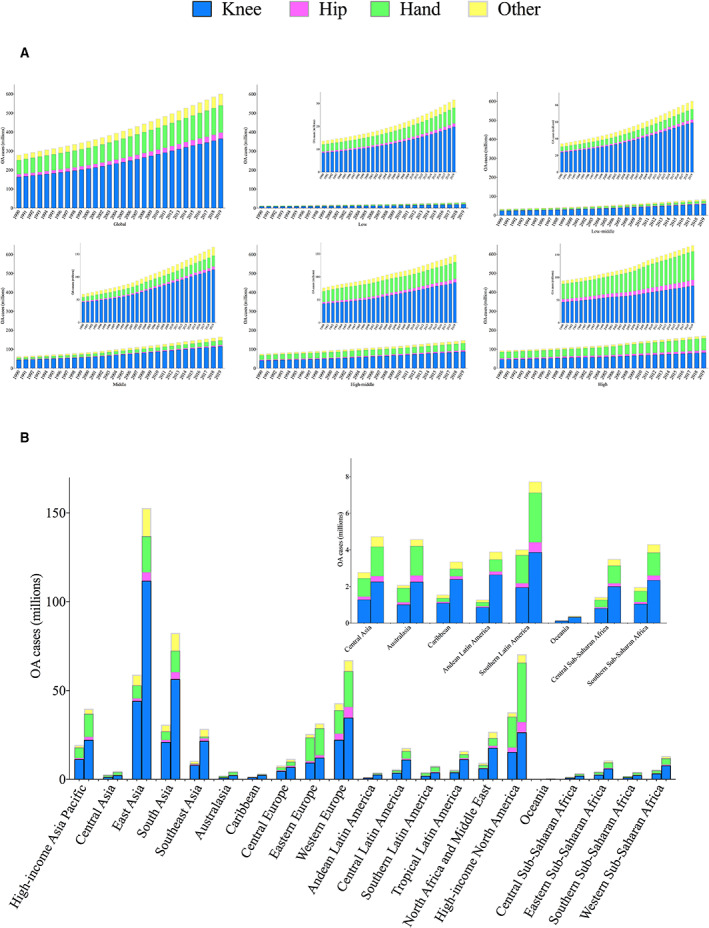
Total number of prevalent osteoarthritis (OA) cases and number of prevalent OA cases according to the affected joint, globally, by Socio‐demographic Index (SDI) category (low, low‐middle, middle, high‐middle, and high) and by geographic region, for both sexes combined. A, Number of prevalent OA cases for each year from 1990 to 2019, globally and by SDI category. Insets show the same data at a magnified scale. B, Number of prevalent OA cases in 1990 and 2019 in the 21 indicated geographic regions. For each region, the left column shows data for 1990 and the right column shows data for 2019. Inset shows data for some regions at a magnified scale. Color figure can be viewed in the online issue, which is available at http://onlinelibrary.wiley.com/doi/10.1002/art.42089/abstract.
Figure 2.
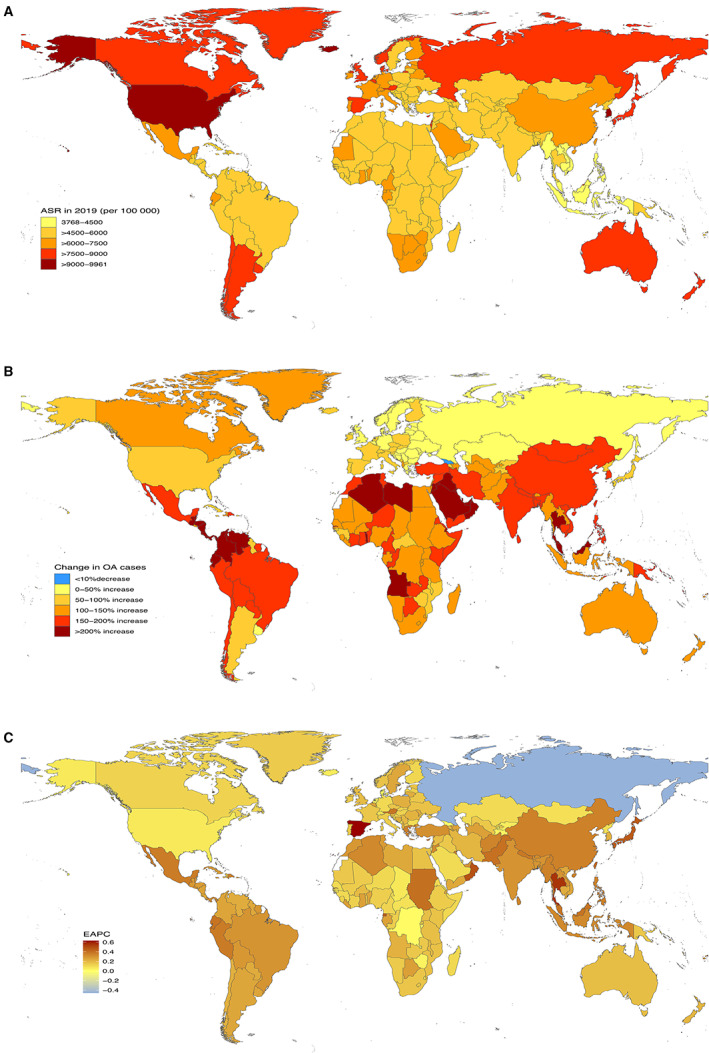
Prevalence of osteoarthritis (OA) for both sexes combined in 204 countries and territories. A, Age‐standardized prevalence rate (ASR) of OA in 2019. B, Percentage change in prevalent cases of OA between 1990 and 2019. C, Estimated annual percentage change (EAPC) of OA from 1990 to 2019.
Figure 3.
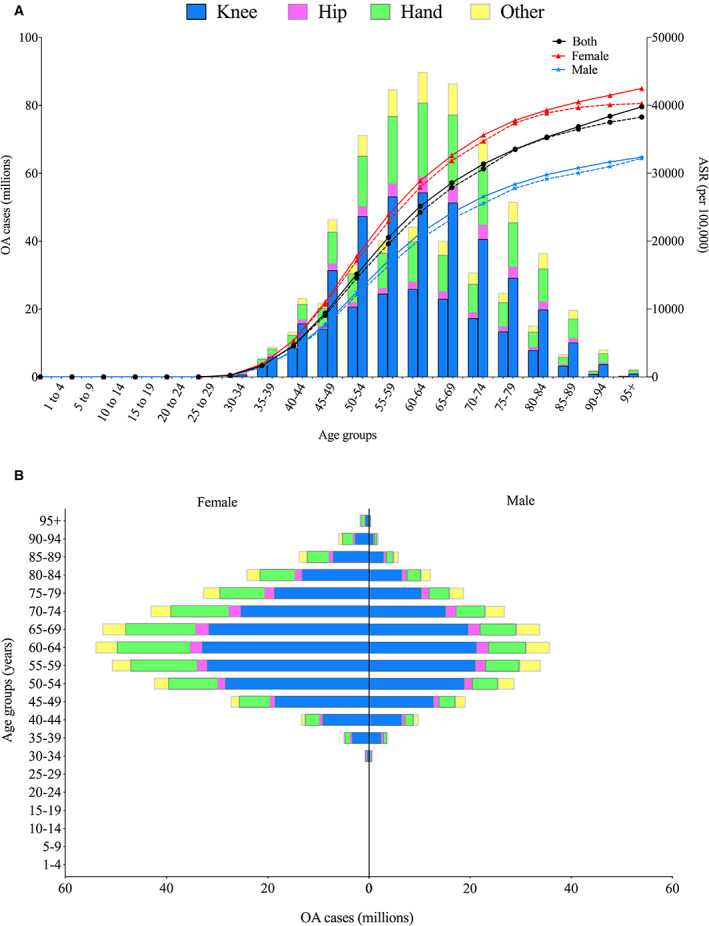
Global total number of prevalent osteoarthritis (OA) cases and number of prevalent OA cases according to the affected joint, by sex and age group. A, Global number of prevalent OA cases and age‐standardized prevalence rate (ASR) by sex and age group. For each age group, the left column shows data for prevalent cases in 1990 and the right column shows data for prevalent cases in 2019. Broken lines indicate the global ASR of OA in 1990, and solid lines indicate the global ASR of OA in 2019. B, Sex differences in global prevalent OA cases by age group in 2019. Color figure can be viewed in the online issue, which is available at http://onlinelibrary.wiley.com/doi/10.1002/art.42089/abstract.
ASR of OA
The ASR of OA also varied significantly worldwide. The global ASR of OA was 6,173.38 per 100,000 in 1990, while it was 6,348.25 per 100,000 in 2019, with an average annual increase of 0.12% (95% CI 0.11%, 0.14%) (Table 1). The ASR of OA varied more than 2.64‐fold across countries, with the highest level observed in the US (9,960.88 per 100,000 in 2019) and the lowest in Timor‐Leste (3,768.44 per 100,000 in 2019) (Supplementary Table 5 and Figure 2A). Except for a stable trend in the high‐middle SDI category (EAPC 0.01 [95% CI −0.01, 0.04]), SDI categories had increases in ASR, with the highest level observed in the low‐middle category (EAPC 0.32 [95% CI 0.30, 0.33]) (Table 1 and Figure 4A).
Figure 4.
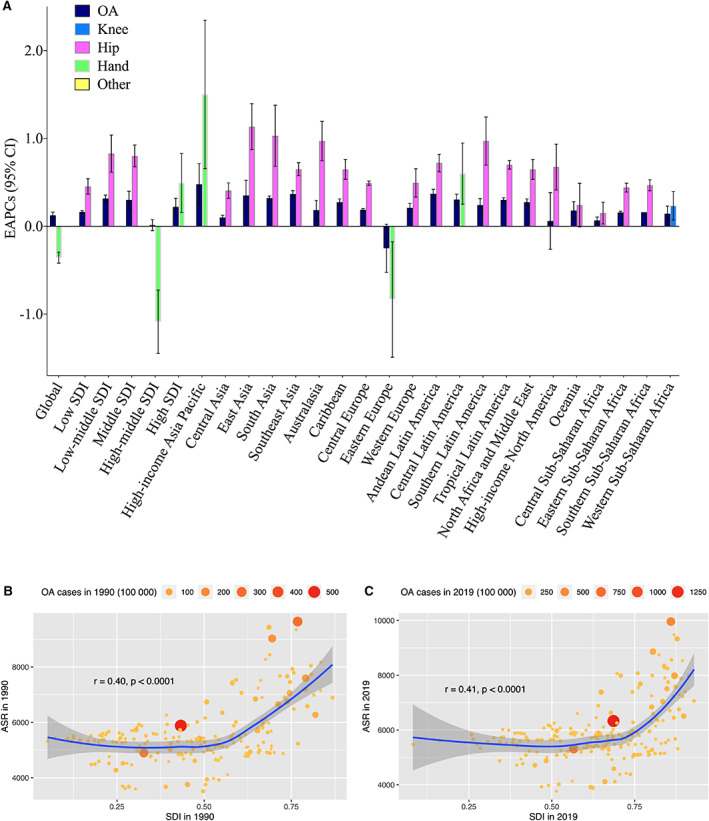
A, Estimated annual percentage change (EAPC) in total osteoarthritis (OA) and according to the affected joint from 1990 to 2019, globally, by Socio‐demographic Index (SDI) category and by geographic region, for both sexes combined. Data for OA overall and for the affected sites with absolute maximum of EAPC are presented for each category. B and C, Correlation between age‐standardized prevalence rate (ASR) of OA and SDI in 1990 (B) and 2019 (C). Circles represent the number of prevalent OA cases in individual countries or territories. 95% CI = 95% confidence interval. Color figure can be viewed in the online issue, which is available at http://onlinelibrary.wiley.com/doi/10.1002/art.42089/abstract.
With regard to GBD geographic regions, Eastern Europe had a decrease in ASR (EAPC −0.25 [95% CI −0.36, −0.14]), while the ASR in high‐income North America remained stable (EAPC 0.06 [95% CI −0.07, 0.19]). The remaining regions had increases in ASR, which were highest in high‐income Asia Pacific (EAPC 0.48 [95% CI 0.38, 0.57]) (Table 1 and Figure 4A). At the national level, the largest increase in ASR was observed in Spain (EAPC 0.63 [95% CI 0.53, 0.73]), followed by the Maldives and Thailand. Only Russia reported a decrease in the ASR of OA from 1990 to 2019 (EAPC −0.46 [95% CI −0.61, −0.30]) (Supplementary Table 5 and Figure 2C).
The global ASR of OA was higher in women and increased with age, peaking in those ages ≥95 years for both women and men in 1990 and 2019 (Table 1 and Figure 3A). EAPCs for men and women were 0.07 (95% CI 0.05, 0.09) and 0.17 (95% CI 0.14, 0.20), respectively (Table 1). Hierarchical cluster analysis of EAPCs and their 95% CIs divided the 204 countries and territories into 5 categories, namely “high decrease,” “stable or minor increase,” “low increase,” “middle increase,” and “high increase.” Detailed results are shown in Supplementary Figure 1, available on the Arthritis & Rheumatology website at http://onlinelibrary.wiley.com/doi/10.1002/art.42089.
Prevalence of OA at different anatomic sites
Results for ASRs, change in absolute number, and EAPCs for knee, hip, and hand OA and OA at other sites are shown in Supplementary Figures 2–13, available on the Arthritis & Rheumatology website at http://onlinelibrary.wiley.com/doi/10.1002/art.42089. Figure 5 depicts the proportions of site‐specific OA at the global and regional levels in 1990 and 2019. Globally, the knee was the leading OA site, followed by the hand, other sites, and the hip, accounting for ~60.6%, 23.7%, 10.2%, and 5.5%, respectively, of the total prevalent cases in 2019. For most SDI categories and GBD geographic regions, the knee also ranked first among the 4 OA anatomic sites, while the hand superseded it in Eastern Europe and high‐income North America in both 1990 and 2019. In most regions, the proportions of knee OA and hip OA increased, while the proportions of hand OA and OA at other sites decreased, between 1990 and 2019.
Figure 5.
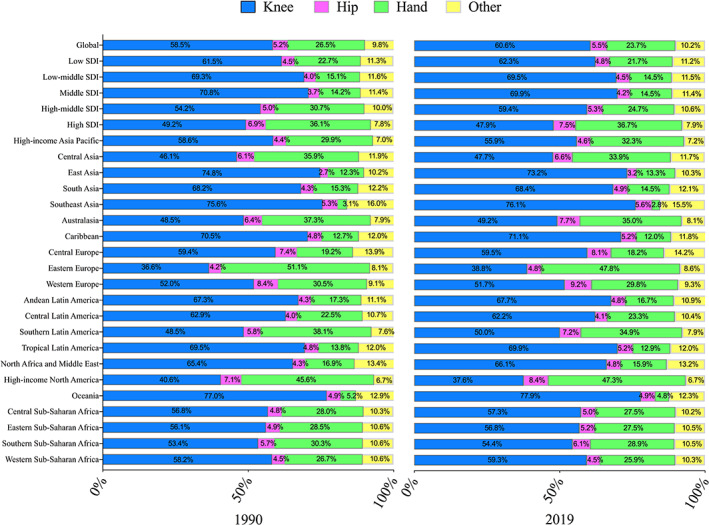
Percentage of total prevalent osteoarthritis (OA) cases accounted for by OA at each site (knee, hip, hand, or other) in 1990 and 2019, globally, by Socio‐demographic Index (SDI) category and by geographic region, for both sexes combined. Color figure can be viewed in the online issue, which is available at http://onlinelibrary.wiley.com/doi/10.1002/art.42089/abstract.
From 1990 to 2019, global prevalent cases of OA at all 4 anatomic sites increased, by between 91.84% for hand OA and 127.51% for hip OA (Table 1). Prevalent cases of OA at the 4 sites increased in all 5 SDI categories and 21 GBD geographic regions (Table 1 and Figure 1). At the national level, most countries and territories experienced an increase in cases, while a decrease was observed in only a few countries: in Georgia for knee OA (−3.99%), hip OA (−1.32%), hand OA (−7.59%), and OA at other sites (−1.96%); and in Niue (−2.32%) and Tokelau (−2.70%), both for hand OA (Supplementary Table 5 and Supplementary Figures 3, 6, 9, and 12). The highest ASR for knee OA was observed in the Republic of Korea (6,211.13 per 100,000 in 2019); the other 3 countries with the highest ASRs were the US for hip OA (1,031.12 per 100,000 in 2019), the US for hand OA (5,721.76 per 100,000 in 2019), and Qatar for OA at other sites (946.17 per 100,000 in 2019) (Supplementary Table 5 and Supplementary Figures 2, 5, 8, and 11).
Global ASRs for the 4 anatomic sites showed different trends, with EAPCs for knee OA, hip OA, hand OA, and OA at other sites of 0.32 (95% CI 0.29, 0.34), 0.28 (95% CI 0.26, 0.31), −0.36 (95% CI −0.38, −0.33) and 0.18 (95% CI 0.18, 0.19), respectively (Table 1). The anatomic site with the highest EAPC differed by geographic region and SDI category, with knee OA having the highest EAPC in Western Sub‐Saharan Africa; hip OA having the highest EAPC in the low, low‐middle, and middle SDI categories, and in 17 GBD geographic regions; and hand OA having the highest EAPC at the global level, in the high‐middle and high SDI categories, and in 3 GBD geographic regions (Figure 4A and Supplementary Figure 14, available on the Arthritis & Rheumatology website at http://onlinelibrary.wiley.com/doi/10.1002/art.42089).
Factors related to OA prevalence
As illustrated in Figures 4B and C, significant positive correlations between the ASR and the SDI were observed for OA in 1990 (r = 0.40, P < 0.0001) and 2019 (r = 0.41, P < 0.0001). Site‐specific correlations between the ASR and the SDI in 1990 and 2019 are depicted in Supplementary Figures 15–18, available on the Arthritis & Rheumatology website at http://onlinelibrary.wiley.com/doi/10.1002/art.42089.
DISCUSSION
Using data derived from the GBD Study 2019, we provided updated results for the prevalence of site‐specific OA in 204 countries and territories from 1990 to 2019, and analyzed the secular trends of prevalence for the first time. Prevalent cases and the ASR of OA increased over time globally and in most regions and countries. Prevalence increased with age and revealed female preponderance, geographic diversity, and anatomic site disparity. The knee was the joint most commonly affected by OA, followed by the hand. There were positive associations between the ASR and the SDI for OA overall and at each anatomic site in both 1990 and 2019.
The ASR and years lived with disability associated with hip and knee OA for GBD geographic regions were previously reported using data from the GBD Study 2010 (11). After the release of the GBD Study 2017, Safiri et al first reported the incidence, ASR, and years lived with disability due to OA at the national level (12). They also demonstrated age and sex patterns of OA and assessed the association between years lived with disability and the SDI. Due to updated data sources and the improvement of methodologies used in the GBD Study series, our study has advantages over the 2 previous studies. In addition, Safiri et al reported only the combined burden of OA and the trends in percentage change of OA in absolute number.
We found that prevalent cases and the ASR of OA increased from 1990 to 2019, consistent with the findings of previous studies (11, 12). Globally, of the 369 diseases and injuries in the GBD Study 2019, OA ranked 17th highest in terms of prevalent cases and 19th in terms of ASR in 2019 (3, 19), indicating a substantial disease burden. It was estimated that ~1–2.5% of national gross domestic product was attributed to the medical costs of OA, while the indirect costs, including work loss and premature retirement, were not taken into consideration (1, 20).
Consistent with the findings of previous studies (11, 12), our study showed that prevalence of OA increased with age and was more common in women than in men. As indicated in Supplementary Table 6, there were varying degrees of change in the numbers of OA cases in different age groups between 1990 and 2019. One possible explanation for such a result may be ascribed to the different data sources of the GBD Study. For instance, Tang et al reported that the prevalence of symptomatic knee OA peaked at ages 60–69 years and then leveled off (21); Dillon et al reported that the prevalence of symptomatic knee OA peaked at ages 70–79 years in men and then leveled off but increased monotonically with age in women (22). OA predominantly affects women, and women tend to have more severe disease (i.e., structural lesions and clinical symptoms) than men. Estrogen has been postulated to play a role in OA development; however, results from both observational studies and clinical trials have been inconclusive (23, 24, 25). Women had nearly 3‐fold higher risk of developing lateral tibiofemoral radiographic OA than men; nevertheless, no such sex difference was observed for medial tibiofemoral radiographic OA (26, 27). In general, women have a wider pelvis, larger Q angle, and greater knee valgus than men, which places more load on the lateral knee compartment, resulting in a higher risk of lateral disease (26).
Since higher body mass index (e.g., overweight/obesity) is a substantial risk factor for OA, geographic diversity in OA prevalence may be related to the distribution of adult obesity (1, 28, 29, 30). Moreover, epidemiologic and genetic investigations have established that OA is a disease with multifactorial components based on both ecology and genetics (31, 32, 33), contributing to the geographic diversity.
Secular trends of OA prevalence differed by anatomic site. Except for a 0.36% annual decrease in hand OA, the other 3 anatomic sites all experienced increasing trends, with an annual change of 0.32% for the knee, 0.28% for the hip, and 0.18% for the other joints. OA in large joints, such as the knee and the hip, causes the most severe disability, and end‐stage disease may require joint replacement if available, thus indicating that OA in large joints should comprise a significant proportion of the disease burden. However, globally as well as in most regions and countries, the joints that accounted for the main disease burden were the knee, followed by the hand and other joints except the spine, while hip OA contributed the least. Relatively low prevalence and conversely more serious severity distribution and sequelae of the hip compared to other larger joints may result in such findings (1, 34).
As demonstrated here and in a previous study (12), a positive association was observed between OA prevalence and the development level of GBD regions and countries. A high prevalence of OA was observed in countries with a high SDI, such as the Republic of Korea and the US, and an increasing life expectancy is a non‐negligible explanation for this result. As a complex indicator based on fertility, income, and educational attainment, the SDI represents the development level of GBD regions and countries, and indicates the quality and availability of health care. Changes in numerous risk factors for OA (20, 35), including social and occupational risk factors, and epidemiologic and demographic transition, may also have contributed to the correlation.
Population expansion, aging, and the obesity epidemic have increased the number of prevalent cases and ASR of OA, thus aggravating the disease burden (1, 9, 30, 36). According to the United Nations Department of Economic and Social Affairs, the total global population increased by 45%, from 5.32 billion in 1990 to 7.71 billion in 2019, and the proportion of people ages ≥60 years increased from 9.2% in 1990 to ~13.5% in 2019 (37). With regard to obesity, the prevalence has nearly tripled since 1975, while >1.9 billion adults and >340 million children and adolescents were overweight or obese in 2016 (28, 30). Joint injuries involving ligaments, which could be responsible for joint degeneration, and better awareness and diagnosis of OA, might also have contributed to the increase in prevalence (1, 33).
Considering the formidable and increasing disease burden of OA, primary and secondary prevention and early treatment might be more effective in alleviating the burden (38, 39). Along with these previously emphasized aspects aimed at modifiable risk factors, such as preventing being overweight or obese, preventing knee injury, and avoiding heavy repeated joint‐loading activities, we appeal for education programs on disease progression, sequelae, early treatment methods, and rehabilitation of OA. For instance, exercise therapy effectively delays functional loss and has been recommended as core treatment for knee OA in many guidelines (2, 38). In most countries and territories in the low, low‐middle, and middle SDI categories, although the main causes of death are heart diseases, stroke, and chronic lung diseases (40), the burden of OA on society is likely to increase, and governments and policymakers should recognize the societal impact of OA.
Our study has several strengths. First, results from the GBD model fill a gap where actual relevant data for a given disease burden are scarce or unavailable, thus allowing comparisons across regions and over time periods. Second, we examined the site‐specific secular trends of OA and the correlation between ASR and the SDI, providing policymakers data to inform disease prevention and treatment.
Several limitations of our study should be noted, including those previously acknowledged regarding the methodology of the GBD studies (3, 14, 15). In particular, data from individual studies included in the GBD modeling were adjusted with covariates in terms of reference definitions, implying that the quality and quantity of data included were responsible for the accuracy and validity of the results. Moreover, the definition of OA in the GBD Study 2019 excluded symptoms and disabilities associated with the spine, which were captured in the categories “low back pain” or “neck pain”, thus underestimating the burden of OA. Additionally, we considered the SDI to be an indicator of the quality and availability of health care in investigating ASR‐related factors, while the effect of health systems was not assessed. This could weaken the robustness even for countries with the same SDI, as there are consequential variations in the returns of health systems (3, 41).
OA is prevalent worldwide and remains a major public health concern. Although prevalent cases and the ASR of OA are increasing in most countries, especially among older people and women, trends are diverse with regard to geographic location and anatomic site. The secular trends are expected to continually increase, mainly due to population aging and the obesity epidemic. Public awareness of the modifiable risk factors, and education programs addressing disease prevention, are essential to alleviate the enormous burden of OA.
AUTHOR CONTRIBUTIONS
All authors were involved in drafting the article or revising it critically for important intellectual content, and all authors approved the final version to be published. Dr. Guo and Dr. Lin had full access to all of the data in the study and take responsibility for the integrity of the data and the accuracy of the data analysis.
Study conception and design
Long, Yin, Zhang, Lin, Guo.
Acquisition of data
Long, Yin.
Analysis and interpretation of data
Long, Liu, Yin, Wang, Diao, Zhang, Lin, Guo.
Supporting information
Disclosureform
Appendix S1 Supplementary Information
ACKNOWLEDGMENTS
We thank the staff of the Institute for Health Metrics and Evaluation and its collaborators who prepared the publicly available data.
The interpretation of the data contained herein is solely that of the authors.
Supported by the Beijing Postdoctoral Research Foundation (grant 2021‐ZZ‐010) and the National Natural Science Foundation of China (grant 81902247).
Author disclosures are available at https://onlinelibrary.wiley.com/action/downloadSupplement?doi=10.1002%2Fart.42089&file=art42089‐sup‐0001‐Disclosureform.pdf.
Contributor Information
Jianhao Lin, Email: linjianhao@pkuph.edu.cn.
Ai Guo, Email: guoaij@139.com.
REFERENCES
- 1. Hunter DJ, Bierma‐Zeinstra S. Osteoarthritis. Lancet 2019;393:1745–59. [DOI] [PubMed] [Google Scholar]
- 2. Kolasinski SL, Neogi T, Hochberg MC, Oatis C, Guyatt G, Block J, et al. 2019 American College of Rheumatology/Arthritis Foundation guideline for the management of osteoarthritis of the hand, hip, and knee. Arthritis Rheumatol 2020;72:220–33. [DOI] [PMC free article] [PubMed] [Google Scholar]
- 3. GBD 2019 Diseases and Injuries Collaborators . Global burden of 369 diseases and injuries in 204 countries and territories, 1990‐2019: a systematic analysis for the Global Burden of Disease Study 2019. Lancet 2020;396:1204–22. [DOI] [PMC free article] [PubMed] [Google Scholar]
- 4. Global Burden of Disease Collaborative Network . Global Burden of Disease Study 2019 (GBD 2019) Results. Seattle, United States: Institute for Health Metrics and Evaluation (IHME), 2020. URL: http://ghdx.healthdata.org/gbd-results-tool.
- 5. Osteoarthritis Research Society International . Osteoarthritis Research Society International white paper: OA as a serious disease. 2016. URL: https://oarsi.org/education/oarsi-resources/oarsi-white-paper-oa-serious-disease.
- 6. Andrianakos AA, Kontelis LK, Karamitsos DG, Aslanidis SI, Georgountzos AI, Kaziolas GO, et al. Prevalence of symptomatic knee, hand, and hip osteoarthritis in Greece. The ESORDIG study. J Rheumatol 2006;33:2507–13. [PubMed] [Google Scholar]
- 7. Haugen IK, Ramachandran VS, Misra D, Neogi T, Niu J, Yang T, et al. Hand osteoarthritis in relation to mortality and incidence of cardiovascular disease: data from the Framingham heart study. Ann Rheum Dis 2015;74:74–81. [DOI] [PMC free article] [PubMed] [Google Scholar]
- 8. Kortekaas MC, Kwok WY, Reijnierse M, Kloppenburg M. Inflammatory ultrasound features show independent associations with progression of structural damage after over 2 years of follow‐up in patients with hand osteoarthritis. Ann Rheum Dis 2015;74:1720–4. [DOI] [PubMed] [Google Scholar]
- 9. O'Neill TW, McCabe PS, McBeth J. Update on the epidemiology, risk factors and disease outcomes of osteoarthritis. Best Pract Res Clin Rheum 2018;32:312–26. [DOI] [PubMed] [Google Scholar]
- 10. Vina ER, Kwoh CK. Epidemiology of osteoarthritis: literature update. Curr Opin Rheumatol 2018;30:160–7. [DOI] [PMC free article] [PubMed] [Google Scholar]
- 11. Cross M, Smith E, Hoy D, Nolte S, Ackerman I, Fransen M, et al. The global burden of hip and knee osteoarthritis: estimates from the global burden of disease 2010 study. Ann Rheum Dis 2014;73:1323–30. [DOI] [PubMed] [Google Scholar]
- 12. Safiri S, Kolahi AA, Smith E, Hill C, Bettampadi D, Mansournia MA, et al. Global, regional and national burden of osteoarthritis 1990‐2017: a systematic analysis of the Global Burden of Disease Study 2017. Ann Rheum Dis 2020;79:819–28. [DOI] [PubMed] [Google Scholar]
- 13. Murray CJ, Lopez AD. Measuring the global burden of disease. N Engl J Med 2013;369:448–57. [DOI] [PubMed] [Google Scholar]
- 14. GBD 2019 Demographics Collaborators . Global age‐sex‐specific fertility, mortality, healthy life expectancy (HALE), and population estimates in 204 countries and territories, 1950‐2019: a comprehensive demographic analysis for the Global Burden of Disease Study 2019. Lancet 2020;396:1160–203. [DOI] [PMC free article] [PubMed] [Google Scholar]
- 15. GBD 2019 Risk Factors Collaborators . Global burden of 87 risk factors in 204 countries and territories, 1990‐2019: a systematic analysis for the Global Burden of Disease Study 2019. Lancet 2020;396:1223–49. [DOI] [PMC free article] [PubMed] [Google Scholar]
- 16. Kellgren JH, Lawrence JS. Radiological assessment of osteo‐arthrosis. Ann Rheum Dis 1957;16:494–502. [DOI] [PMC free article] [PubMed] [Google Scholar]
- 17. Hankey BF, Ries LA, Kosary CL, Feuer EJ, Merrill RM, Clegg LX, et al. Partitioning linear trends in age‐adjusted rates. Cancer Causes Control 2000;11:31–5. [DOI] [PubMed] [Google Scholar]
- 18. Liu Z, Jiang Y, Yuan H, Fang Q, Cai N, Suo C, et al. The trends in incidence of primary liver cancer caused by specific etiologies: results from the Global Burden of Disease Study 2016 and implications for liver cancer prevention. J Hepatol 2019;70:674–83. [DOI] [PubMed] [Google Scholar]
- 19. Global Burden of Disease Collaborative Network . GBD Compare tool: Global Burden of Disease Study 2019 (GBD 2019) Results. Seattle, United States: Institute for Health Metrics and Evaluation (IHME), 2020. URL: https://vizhub.healthdata.org/gbd-compare/.
- 20. Hunter DJ, Schofield D, Callander E. The individual and socioeconomic impact of osteoarthritis. Nat Rev Rheumatol 2014;10:437–41. [DOI] [PubMed] [Google Scholar]
- 21. Tang X, Wang S, Zhan S, Niu J, Tao K, Zhang Y, et al. The prevalence of symptomatic knee osteoarthritis in China: results from the China Health and Retirement Longitudinal Study. Arthritis Rheumatol 2016;68:648–53. [DOI] [PubMed] [Google Scholar]
- 22. Dillon CF, Rasch EK, Gu Q, Hirsch R. Prevalence of knee osteoarthritis in the United States: arthritis data from the Third National Health and Nutrition Examination Survey 1991‐94. J Rheumatol 2006;33:2271–9. [PubMed] [Google Scholar]
- 23. Hanna FS, Wluka AE, Bell RJ, Davis SR, Cicuttini FM. Osteoarthritis and the postmenopausal woman: Epidemiological, magnetic resonance imaging, and radiological findings. Semin Arthritis Rheum 2004;34:631–6. [DOI] [PubMed] [Google Scholar]
- 24. Nevitt MC, Felson DT, Williams EN, Grady D, on behalf of the Heart and Estrogen/Progestin Replacement Staudy Research Group. The effect of estrogen plus progestin on knee symptoms and related disability in postmenopausal women: the Heart and Estrogen/Progestin Replacement Study, a randomized, double‐blind, placebo‐controlled trial. Arthritis Rheum 2001;44:811–8. [DOI] [PubMed] [Google Scholar]
- 25. Cirillo DJ, Wallace RB, Wu L, Yood RA. Effect of hormone therapy on risk of hip and knee joint replacement in the Women's Health Initiative. Arthritis Rheum 2006;54:3194–204. [DOI] [PubMed] [Google Scholar]
- 26. Wei J, Gross D, Lane NE, Lu N, Wang M, Zeng C, et al. Risk factor heterogeneity for medial and lateral compartment knee osteoarthritis: analysis of two prospective cohorts. Osteoarthritis Cartilage 2019;27:603–10. [DOI] [PubMed] [Google Scholar]
- 27. Wise BL, Niu J, Yang M, Lane NE, Harvey W, Felson DT, et al, on behalf of the Multicenter Osteoarthritis (MOST) Group. Patterns of compartment involvement in tibiofemoral osteoarthritis in men and women and in whites and African Americans. Arthritis Care Res (Hoboken) 2012;64:847–52. [DOI] [PMC free article] [PubMed] [Google Scholar]
- 28. NCD Risk Factor Collaboration (NCD‐RisC) . Worldwide trends in body‐mass index, underweight, overweight, and obesity from 1975 to 2016: a pooled analysis of 2416 population‐based measurement studies in 128.9 million children, adolescents, and adults. Lancet 2017;390:2627–42. [DOI] [PMC free article] [PubMed] [Google Scholar]
- 29. Blüher M. Obesity: global epidemiology and pathogenesis [review]. Nat Rev Endocrinol 2019;15:288–98. [DOI] [PubMed] [Google Scholar]
- 30. World Health Organization . Obesity and overweight. 2020. URL: https://www.who.int/en/news‐room/fact‐sheets/detail/obesity‐and‐overweight.
- 31. Ratneswaran A, Kapoor M. Osteoarthritis year in review: genetics, genomics, epigenetics. Osteoarthritis Cartilage 2021;29:151–60. [DOI] [PubMed] [Google Scholar]
- 32. Madry H, Luyten FP, Facchini A. Biological aspects of early osteoarthritis. Knee Surg Sports Traumatol Arthrosc 2012;20:407–22. [DOI] [PubMed] [Google Scholar]
- 33. Madry H, Kon E, Condello V, Peretti GM, Steinwachs M, Seil R, et al. Early osteoarthritis of the knee. Knee Surg Sports Traumatol Arthrosc 2016;24:1753–62. [DOI] [PubMed] [Google Scholar]
- 34. Prieto‐Alhambra D, Judge A, Javaid MK, Cooper C, Diez‐Perez A, Arden NK. Incidence and risk factors for clinically diagnosed knee, hip and hand osteoarthritis: influences of age, gender and osteoarthritis affecting other joints. Ann Rheum Dis 2014;73:1659–64. [DOI] [PMC free article] [PubMed] [Google Scholar]
- 35. Woo J, Lau E, Lau CS, Lee P, Zhang J, Kwok T, et al. Socioeconomic impact of osteoarthritis in Hong Kong: utilization of health and social services, and direct and indirect costs. Arthritis Rheum 2003;49:526–34. [DOI] [PubMed] [Google Scholar]
- 36. Obesity: a growing threat to health in China [editorial]. Lancet 2014;384:716. [DOI] [PubMed] [Google Scholar]
- 37. United Nations Department of Economic and Social Affairs, Population Division . World population prospects 2019. URL: https://population.un.org/wpp/.
- 38. Bannuru RR, Osani MC, Vaysbrot EE, Arden NK, Bennell K, Bierma‐Zeinstra SM, et al. OARSI guidelines for the non‐surgical management of knee, hip, and polyarticular osteoarthritis. Osteoarthritis Cartilage 2019;27:1578–89. [DOI] [PubMed] [Google Scholar]
- 39. Runhaar J, Zhang Y. Can we prevent OA? Epidemiology and public health insights and implications. Rheumatology (Oxford) 2018;57 Suppl:iv3–9. [DOI] [PMC free article] [PubMed] [Google Scholar]
- 40. World Health Organization . 10 facts on ageing and health. 2017. URL: https://www.who.int/news‐room/fact‐sheets/detail/10‐facts‐on‐ageing‐and‐health.
- 41. Frenk J. The global health system: strengthening national health systems as the next step for global progress. PLoS Med 2010;7:e1000089. [DOI] [PMC free article] [PubMed] [Google Scholar]
Associated Data
This section collects any data citations, data availability statements, or supplementary materials included in this article.
Supplementary Materials
Disclosureform
Appendix S1 Supplementary Information