Abstract
Objective
To evaluate the accuracy of a new electronic nose to recognize prostate cancer in urine samples.
Methods
A blind, prospective study on consecutive patients was designed. Overall, 174 subjects were included in the study: 88 (50.6%) in prostate cancer group, and 86 (49.4%) in control group. Electronic nose performance for prostate cancer was assessed using sensitivity and specificity. The diagnostic accuracy of electronic nose was reported as area under the receiver operating characteristic curve.
Results
The electronic nose in the study population reached a sensitivity 85.2% (95% confidence interval 76.1–91.9; 13 false negatives out of 88), a specificity 79.1% (95% confidence interval 69.0–87.1; 18 false positives out of 86). The accuracy of the electronic nose represented as area under the receiver operating characteristic curve 0.821 (95% confidence interval 0.764–0.879).
Conclusions
The diagnostic accuracy of electronic nose for recognizing prostate cancer in urine samples is high, promising and susceptible to supplemental improvement. Additionally, further studies will be necessary to design a clinical trial to validate electronic nose application in diagnostic prostate cancer nomograms.
Keywords: cancer, diagnosis, eNose, prostate, urine, volatile organic compounds
Abbreviations & Acronyms
- BPH
benign prostatic hyperplasia
- CI
confidence interval
- DRE
digital rectal examination
- eNose
electronic nose
- FDA
Food and Drug Administration
- MOS
metal oxide semiconductor
- MRI
magnetic resonance imaging
- NA
not applicable
- PCa
prostate cancer
- PSA
prostate‐specific antigen
- RF
random forest
- RH
relative humidity
- ROC
receiver operating characteristic
- SD
standard deviation
- SE
sensitivity
- SNV
standard normal variate
- SP
specificity
- TURP
transurethral resection of the prostate
- VOC
volatile organic compound
Introduction
Prostate biopsy is the gold standard for PCa diagnosis. Despite the advent of multiparametric MRI, the detection rate of systematic and MRI‐targeted biopsy ranges from 21.0% to 48.5% for any PCa and 7.0%–37.0% for clinically significant PCa (Grade Group ≥2). 1 , 2 Therefore, urologists still perform a high number of unnecessary biopsies, nevertheless missing many PCa. 3 Of note, prostate biopsy, besides healthcare costs and patient discomfort, may be associated with several complications. 4 New biomarkers such as PHI, 4Kscore, ExosomeDx, or SelectMdx have been validated and proposed, without significant improvements in the diagnostic accuracy. 5 Recent advances proved that cell modifications lead to peroxidation of membrane components and consequent release of specific VOCs in biological fluids. 6 , 7 , 8 These metabolic end‐products have been proposed as promising noninvasive biomarkers in various diseases. 6 , 7 , 8 In 2015, Taverna et al. have shown that high‐trained dogs recognized PCa‐specific VOCs with a high accuracy. 9 Their findings have been recently confirmed by Guest et al. 10 Unfortunately, today, the routine implementation of dogs in clinical practice presents several limitations, including (i) the need of highly qualified centers, (ii) extensive training for individual dogs and handlers, (iii) the aging profile of dogs and (iv) difficulty to introduce dogs in clinical protocols. In addition, US FDA defines with the term “device” “an instrument, apparatus, implement, machine, contrivance, implant, in vitro reagent, or other similar or related article, including any component, part, or accessory, which is (i) recognized in the official National Formulary, or the United States Pharmacopeia, or any supplement to them, (ii) intended for use in the diagnosis of disease or other conditions, or in the cure, mitigation, treatment, or prevention of disease, in man or other animals, or (iii) intended to affect the structure or any function of the body of man or other animals, and which does not achieve its primary intended purposes through chemical action within or on the body of man or other animals and which is not dependent upon being metabolized for the achievement of its primary intended purposes.” (https://www.fda.gov/industry/regulated‐products/medical‐device‐overview).
Therefore, to exploit the potential of VOCs it is fundamental to develop a technological device (i.e., mimicking the dog olfactory system) that is easily reproducible, accessible, eventually FDA‐approved and usable in clinical practice. The eNose is an instrument capable of reproducing mammalian olfaction by means of an array of nonspecific gas sensors and pattern recognition unit. 11 , 12 Nowadays, eNoses are applied in different fields, including industry, food, cosmetics, environmental monitoring, military, pharmaceuticals, 6 , 13 , 14 , 15 and microbiology analyses. 6 , 16 Taking advantage from the knowledge acquired with highly trained dogs, the present study was aimed at evaluating the ability of a new eNose to recognize PCa in urine samples.
Methods
Study design
A blind prospective cohort study on 174 consecutive patients (Fig. 1) between March 2020 and March 2021 was designed thanks to the collaboration of the Urology Departments of Humanitas Mater Domini (Castellanza, Varese, Italy) and IRCCS Humanitas Research Hospital (Rozzano, Milan, Italy) and the Department of Chemistry, Materials and Chemical Engineering “Giulio Natta”, Politecnico di Milano. Each participant provided informed consent as participants' urine was collected for VOC testing. The study was approved by the ethical committee at Humanitas Clinical and Research Center (Approval no. CE‐ICH260/11).
Fig. 1.
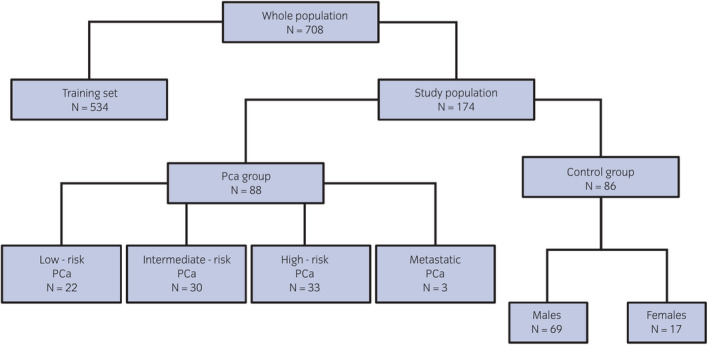
Flow‐diagram of the population enrolled for the study. [Colour figure can be viewed at wileyonlinelibrary.com]
Study participants
Patients were divided in two groups: (i) PCa group; (ii) Control group. The inclusion criteria for PCa group were patients who had undergone prostate biopsy, radical prostatectomy, or TURP with a histology proven PCa. 17 Control group included: young, with non‐neoplastic or neoplastic disease female volunteers; healthy young males (age 18–25 years) with negative family history of PCa and PSA <1 ng/mL (PSA median 0.2 ng/mL, range 0.1–0.4 ng/mL); adult men (age >45 years) with negative family history of PCa, negative DRE and PSA <2.5 ng/mL (PSA median 1.1 ng/mL, range 0.2–2.2 ng/mL), stable over time. No exclusion criteria were assumed regarding subject's medical history, alcohol consumption, drugs, food, tobacco, and other habits. Low‐, intermediate‐ and high‐risk PCa categorization has been applied according to D'Amico criteria. 18 For each subject, a spontaneous 30 cc urine sample was collected in two different sterile urine containers and stored at −20°C upon hospital admission or before surgery. Samples were then transported at a controlled temperature and stored at −20°C until the time of analysis.
eNose: characteristics and experimental protocol
The eNose is a lab‐scale prototype developed and produced at Politecnico di Milano, equipped with six n‐type doped MOS sensors by inkjet printing (Fig. 2). Inkjet sensors differed for active layers, TiO2, ZnO, and SnO2 based sensors, were used for urine analysis. The sensor array works at the temperature of 400°C and sensor signals (i.e., electrical resistance) is acquired with a frequency of 1 Hz. The interaction of MOS sensors with urinary VOCs by adsorption results in a variation of the sensors' electrical resistance, which is recorded for data processing.
Fig. 2.

Schema showing the eNose components for PCa diagnosis from urine analysis: sensor chamber and vacuum pumps, electronic circuits, DAQ (digital acquisition system) and computer for signal processing. [Colour figure can be viewed at wileyonlinelibrary.com]
The eNose training was performed with the exact same steps as the dog training according to the prince of progressive complication, as previously described. 19 The standardized experimental protocol for the preparation and analysis of samples via eNose, developed within the project and patented, consists of four steps:
-
1
Thawing: urine samples, stored at −20°C, are thawed in a water bath at about 40°C.
-
2
Urine headspace creation: 10 mL of liquid urine are put in a Nalophan™ bag filled of odorless air and conditioned at 60°C and 20% RH for 1 h to favor the enrichment of the gaseous phase with urine volatiles.
-
3
Urine headspace conditioning: the gaseous phase is separated from the liquid and conditioned at 60°C and 20% RH for 1.5 h to reduce the moisture content and avoid water condensation in tubes during eNose analysis.
-
4
eNose analysis: the urine headspace is analyzed at a fixed concentration, recording the variations of resistance related to adsorption, and desorption, of VOCs on the sensors surface (Fig. 3). The analysis lasts 80 min. The data processing procedure, as shown in Figure 4, elaborates the eNose signals recorded during the analysis of urine headspaces, to build the pattern recognition model for discriminating urine samples from PCa patients and those of control participants.
The SNV technique was used to remove baseline shift among analyses carried out over different days. Then, the eNose signals were converted into n‐dimensional vectors, whose components were represented by features, i.e., numerical parameters extracted from resistance curves that will be used for further processing. Detailed information about the mathematical equations and parameters used for feature extraction have been provided by Bax et al. 20
Fig. 3.
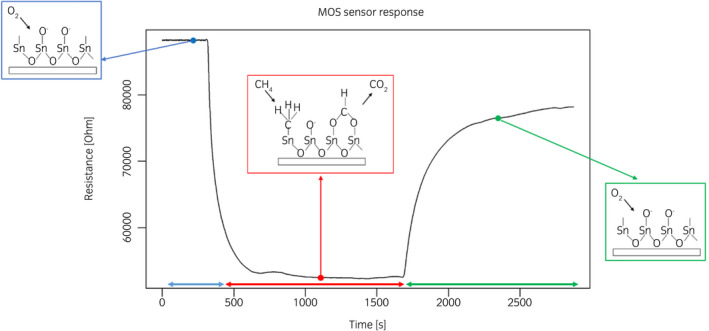
Typical response of MOS sensor of the eNose array recorded during the analysis of urine headspaces, comprising three phases: before (i.e., sensors are exposed to odorless air), during (i.e., sensors are exposed to urine headspace) and after (i.e., sensors are exposed again to odorless air). [Colour figure can be viewed at wileyonlinelibrary.com]
Fig. 4.
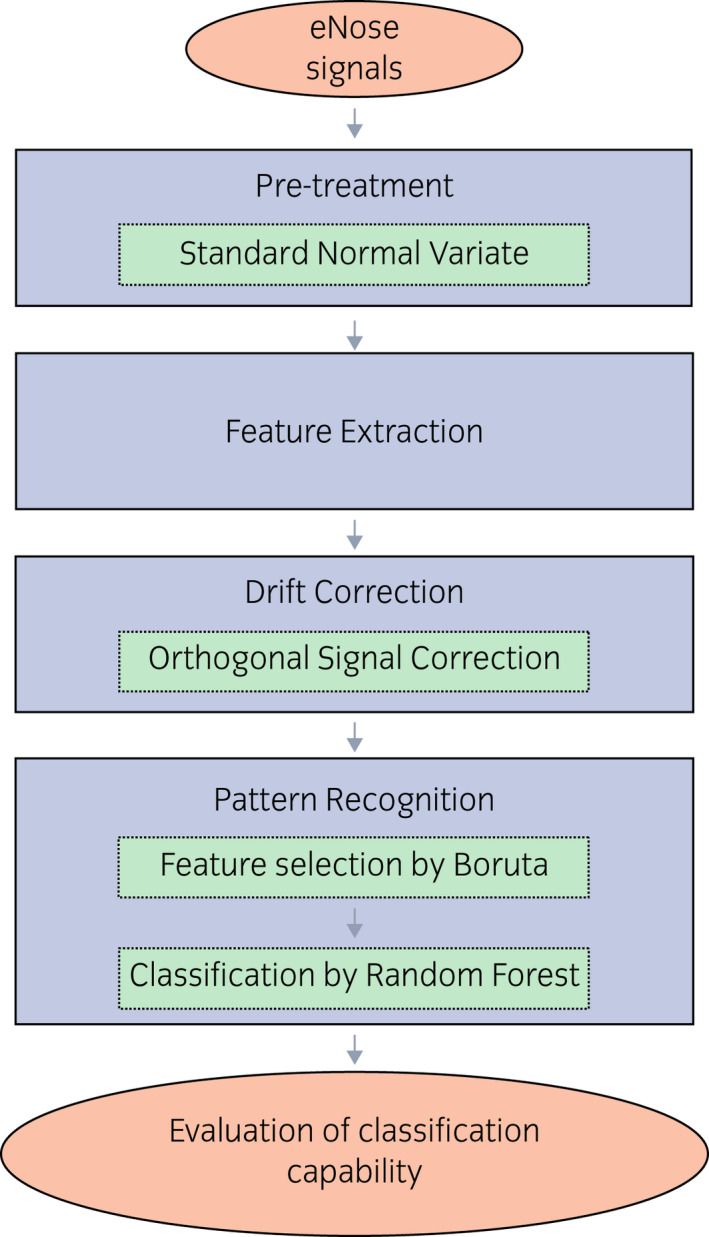
eNose data processing procedure. [Colour figure can be viewed at wileyonlinelibrary.com]
Feature vectors were organized in a “training dataset”, which also include clinical information, i.e., the PSA serum level value and Gleason Score. After autoscaling, the training dataset was processed by a feature selection model based on Boruta algorithm 21 to identify, among the feature extracted, the ones providing information about the clinical condition of subjects. Then, selected features were used as input for the pattern recognition model based on RF 22 algorithm, which has been deeply described. 20
As a result, the eNose operates a classification, giving as output the category to which the analyzed sample belongs, i.e., PCa or control group. The diagnostic model developed in the training phase was subsequently validated by means of double‐blinded tests, whose results are presented in this study. All details regarding the eNose stability and reproducibility have been previously described. 19
Statistical analysis
Baseline demographic and clinical characteristics were described using mean and SD or medians for normally distributed or skewed continuous variables, respectively; frequencies were used for categorical variables. eNose diagnostic performance for PCa (any grade) were assessed using SE and SP. The diagnostic accuracy of eNose was reported as area under the ROC curve. All statistical tests were two‐sided and statistical significance was set at P < 0.05. Statistical analyses were performed with STATA16.1 (StataCorp LLC, College Station, TX, USA).
Results
Population characteristics
One hundred and seventy‐four subjects were included in the study: 88 (50.6%) belonging to PCa group and 86 (49.4%) belonging to the Control group (Fig. 1). Baseline demographic characteristics and clinical features are reported in Table 1.
Table 1.
Study participant's demographics and clinical characteristics
| PCa group | Control group | ||||
|---|---|---|---|---|---|
| PSA mean (range) ng/mL | DRE positive (%) | Clinical T stage | |||
| N (%) | 88 (50.6) | 86 (49.4) | |||
| Age (median, years) | 67 | 50.5 | |||
| Sex, n (%) | |||||
| Female | 0 (0) | 17 (19.8) | |||
| Male | 88 (100) | 69 (80.2) | |||
| Low‐risk PCa | 22 (25) | 5.8 (2.5–9.1) | 0 (0) | 22 T1c | NA |
| Intermediate‐risk PCa | 30 (34.1) | 6.7 (3.6–15) | 2 (6.6) | 28 T1c | NA |
| 1 T2a | NA | ||||
| 1 T2b | NA | ||||
| High‐risk PCa | 33 (37.5) | 8.6 (3–29) | 11 (33.3) | 22 T1c | NA |
| 2 T2a | NA | ||||
| 1 T2c | NA | ||||
| 2 T3a | NA | ||||
| 3 T23b | NA | ||||
| 3 T4 | NA | ||||
| Metastatic PCa | 3 (3.4) | 32 (19–44) | 3 (100) | 2 T4 | NA |
| 1 T3a | NA | ||||
| Pathologies, n (%) | |||||
| Healthy | NA | 28 (32.6) | |||
| Bladder cancer | NA | 17 (19.8) | |||
| BPH | NA | 11 (12.8) | |||
| Urolithiasis | NA | 10 (11.6) | |||
| Kidney cancer | NA | 7 (8.14) | |||
| Colon cancer | NA | 4 (4.7) | |||
| Breast cancer | NA | 3 (3.5) | |||
| Testicular cancer | NA | 3 (3.5) | |||
| Varicocele | NA | 3 (3.5) | |||
eNose performance
Figure 5 illustrates the typical responses of one sensor of the eNose array recorded during the analysis of urine headspaces, which were processed as previously described to implement the PCa diagnosis model.
Fig. 5.
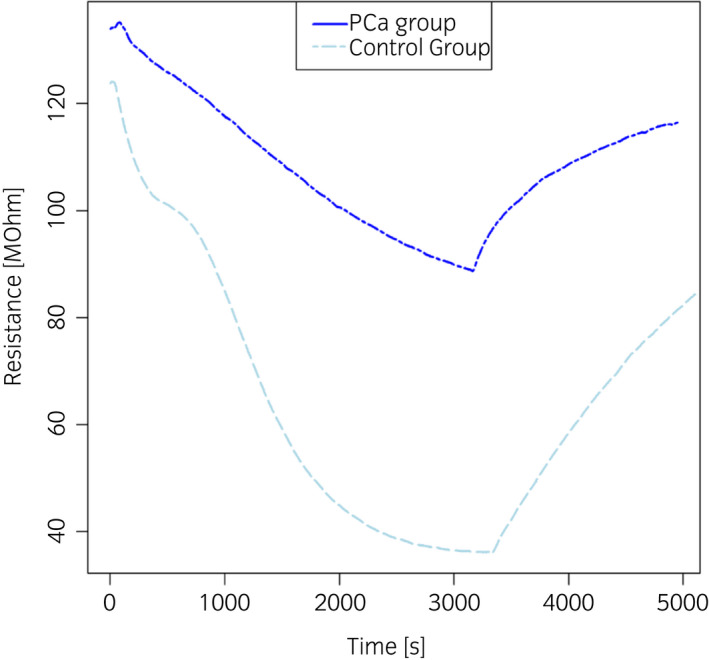
Typical response of one sensor of the eNose array recorded during the analysis of urine headspaces from control subjects (light blue line) and PCa patients (blue line). [Colour figure can be viewed at wileyonlinelibrary.com]
Figure 6 reports a visual representation of eNose capability to distinguish PCa patients from control participants. Although some outliers are present, its highlights that samples from PCa patients and control participants clustered in different areas of the plot. Most of the samples from the Control group distributed in the left part of the plot (blue circles); while most of the samples from the PCa group placed in the right portion of the plot (red squares).
Fig. 6.
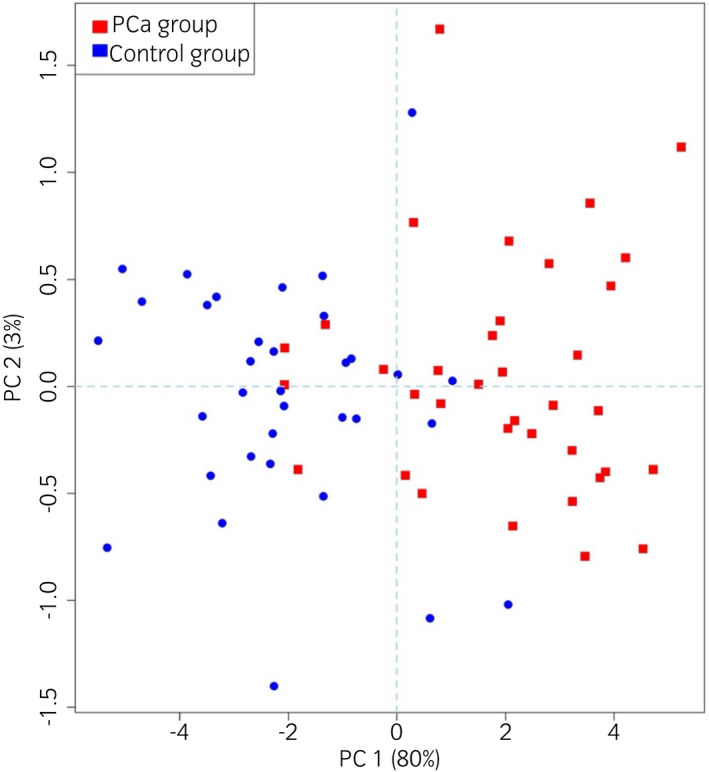
Score plot, obtained by means of Principal Component Analysis, illustrating the eNose capability to distinguish PCa patients (red points) from control participants (blue points). [Colour figure can be viewed at wileyonlinelibrary.com]
The eNose in the study population reached 85.2% SE (95% CI 76.1–91.9; 13 false negatives out of 88), 79.1% SP (95% CI 69.0–87.1; 18 false positives out of 86). By excluding female in the control subgroups, we found that eNose achieved 85.2% SE (95% CI 76.1–91.9; 13 false negatives out of 88), 75.4% SP (95% CI 63.5–84.9; 17 false positives out of 69). Lastly, when considering only adult men, we find out that eNose had 85.2% SE (95% CI 76.1–91.9; 13 false negatives out of 88), 72.7% SP (95% CI 57.2–85.0; 12 false positives out of 44) (Table 2). eNose misdiagnoses are reported in Table 3. The diagnostic accuracy of eNose is reported as the area under the ROC 0.821 (95% CI 0.764–0.879) (Fig. 7).
Table 2.
eNose diagnostic performance
| Study population (n = 174) | Excluding female (n = 157) | ≥45‐year‐old men (n = 132) | ||||
|---|---|---|---|---|---|---|
| SE% (95% CI) | SP% (95% CI) | SE% (95% CI) | SP% (95% CI) | SE% (95% CI) | SP% (95% CI) | |
| eNose | 85.2 (76.1–91.9) | 79.1 (69.0–87.1) | 85.2 (76.1–91.9) | 75.4 (63.5–84.9) | 85.2 (76.1–91.9) | 72.7 (57.2–85.0) |
Table 3.
eNose misdiagnoses
| eNose | P‐value | ||
|---|---|---|---|
| PCa | Healthy | ||
| N = 18 | N = 13 | ||
| Sex | |||
| Female | 1 (6) | 0 (0) | 1.00 |
| Male | 17 (94) | 13 (100) | |
| Pathologies, n (%) | |||
| Low‐risk PCa | 0 (0) | 4 (31) | <0.001 |
| Intermediate‐risk PCa | 0 (0) | 6 (46) | |
| High‐risk PCa | 0 (0) | 3 (23) | |
| BPH | 1 (6) | 0 (0) | |
| Bladder cancer | 6 (33) | 0 (0) | |
| Testicular cancer | 1 (6) | 0 (0) | |
| Varicocele | 1 (6) | 0 (0) | |
| Breast cancer | 1 (6) | 0 (0) | |
| Healthy | 3 (17) | 0 (0) | |
| Kidney cancer | 1 (6) | 0 (0) | |
| Urolithiasis | 2 (11) | 0 (0) | |
| Colon cancer | 2 (11) | 0 (0) | |
Fig. 7.
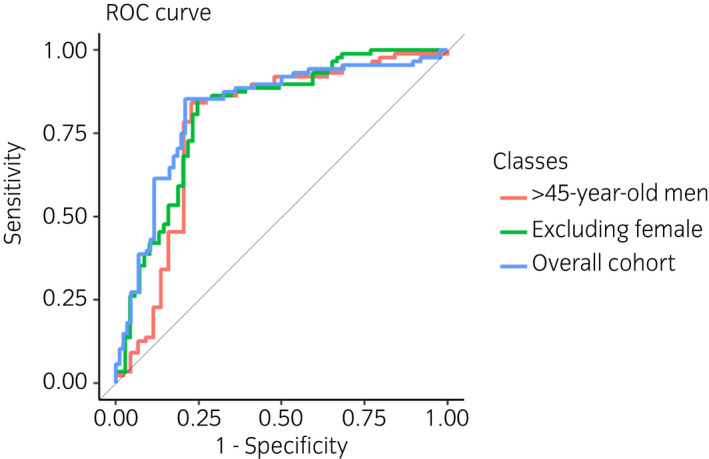
ROC curve, illustrating different scenarios considered: overall cohort, excluding females and ≥45‐year‐old men. The diagnostic accuracy of eNose considering the overall cohort is reported as the area under the ROC 0.821 (95% CI 0.764–0.879). [Colour figure can be viewed at wileyonlinelibrary.com]
Discussion
In the PSA era, the identification of new and accurate diagnostic tools capable of selecting patients who need a prostate biopsy remains an open and essential topic in urology. In 2015, we demonstrated that PCa produces specific urinary VOCs that dogs are capable of recognizing with 98% accuracy. 9 , 23 We found that: (i) PCa VOCs are cancer specific; (ii) the detection of VOCs is independent by clinical and pathological characteristics or PSA levels. Dogs were able to detect PCa in patients with undetectable PSA undergoing androgen‐deprivation therapy, and (iii) patient habits such as drugs, alcohol, and food do not influence the metabolism of PCa's VOCs. Unfortunately, as FDA stated dogs are not a “device” and therefore cannot be approved in the clinical practice. For this reason, we emphasized the need for an instrument capable of replacing the canine olfactory ability. In collaboration with Politecnico di Milano, we have developed an innovative eNose that may be easily reproducible and accessible. 19 The eNose can continuously acquire new knowledge and be trained in the same way of dogs, i.e., progressive complication. Only few preliminary studies on eNoses for early PCa diagnosis from urinary VOCs have been published until now. Asimakopoulos et al. analyzed urine samples of 41 men undergoing prostate biopsy and found 71.4% SE and 92.6% SP. 24 However, the authors chose patients with one first negative biopsy as control, which cannot define a patient as definitely PCa‐free. 24 Roine et al. tested an eNose in 50 patients by assessing its discrimination between PCa and BPH with 78% SE and 67% SP. 25 Besides the small sample size, as acknowledged by the authors and mentioned by Kattan, 26 the control group were considered PCa free solely based on negative histology after TURP. Aggio et al. 27 proposed a combination of gas chromatography with MOS sensor to analyze static urine headspace with high accuracy for urological malignancies detection, involving 58 men with PCa, 24 with bladder cancer and 73 with hematuria and/or poor stream, without cancer. The authors analyzed different urological tumors without specific selection, thus reducing the reliability of the control group. In addition, the results are not concordant with the concept of VOCs SP. For eNose training our previous experience with dogs has led us to use progressive complication tests; optimize and standardize temperature analysis; 19 stabilization of the eNose classification capability over time through the implementation of specific models for compensating drift. 19 , 20 The endpoint of the present study was to evaluate the eNose accuracy. We enrolled PCa patients of different grade and stage, and a control group consisting of subjects of different sex, disease and age. The choice of female participants in the control group was dictated by the need to be certain that no specific prostate VOCs could confuse the work of the eNose, in other words female participants represent the best negative control. This blind study showed that eNose had 85.2% SE and 79.1% SP with accuracy of 82.1%. Considering only men aged ≥45 years (real target of PCa screening), the SE reached 85.2% and the SP 72.7%. Regarding false negatives, eNose misdiagnosed four (18.8%) patients with low‐risk, six (20%) intermediate, and three (9.1%) high‐risk PCa. Regarding false positives, eNose misdiagnosed six bladder cancer, three healthy men, two urolithiasis, two colon cancer, one kidney cancer, one varicocele, one testicular cancer, one prostatic benign hyperplasia and one woman with breast cancer. These results prove the potential of the eNose in detecting alterations in urine volatilome associated to PCa. Actually, we know that PCa is characterized by specific VOCs, 9 but we do not know what dog smells and whether it is one or more molecules. The eNose recognition is based on a complex interpretation of a multivariate non selective response to VOCs. The present study has some limitations. When considering a control group of adult males, even if family history and DRE are negative and PSA is less than 2.5 ng/mL, we should bear in mind that a small fraction may have PCa. Today, this limit cannot be eliminated. Therefore, we cannot totally exclude incidental PCa in certain control subgroups. In conclusion, the diagnostic accuracy of the eNose for specific PCa VOCs in urine samples is high, promising and susceptible to supplemental improvement. The eNose has the potential to become a feasible, reproducible, low‐cost, highly accurate device to be applied in clinical practice for the diagnosis of PCa. Further studies will be necessary to investigate the potential of our eNose in a large‐scale setting in order to design a clinical trial to validate its application in diagnostic PCa nomograms.
Author contributions
Gianluigi Taverna: Conceptualization; supervision; writing – original draft; writing – review and editing. Fabio Grizzi: Conceptualization; writing – original draft; writing – review and editing. Lorenzo Tidu: Writing – original draft; writing – review and editing. Carmen Bax: Data curation; formal analysis; methodology; validation; writing – original draft; writing – review and editing. Matteo Zanoni: Writing – original draft; writing – review and editing. Paolo Vota: Writing – original draft; writing – review and editing. Beatrice Julia Lotesoriere: Data curation; investigation; methodology; writing – original draft; writing – review and editing. Stefano Prudenza: Data curation; formal analysis; methodology; writing – original draft; writing – review and editing. Luca Magagnin: Methodology; writing – original draft; writing – review and editing. Giacomo Langfelder: Methodology; writing – original draft; writing – review and editing. Nicolò Buffi: Writing – original draft; writing – review and editing. Paolo Casale: Writing – original draft; writing – review and editing. Laura Capelli: Conceptualization; methodology; supervision; writing – original draft; writing – review and editing.
Conflict of interest
None declared.
Approval of the research protocol by an Institutional Reviewer Board
The study was approved by the ethical committee at Humanitas Clinical and Research Center (Approval no. CE‐ICH260/11).
Informed consent
All involved subjects gave their informed consent prior to study inclusion.
Registry and the Registration No. of the study/trial
Not applicable.
Animal studies
Not applicable.
References
- 1. Ortegren J, Holmberg JT, Lekas E et al. A randomised trial comparing two protocols for transrectal prostate repeat biopsy: six lateral posterior plus six anterior cores versus a standard posterior 12‐core biopsy. Scand. J. Urol. 2019; 53: 217–21. [DOI] [PubMed] [Google Scholar]
- 2. Chu CE, Cowan JE, Lonergan PE et al. Diagnostic accuracy and prognostic value of serial prostate multiparametric magnetic resonance imaging in men on active surveillance for prostate cancer. Eur. Urol. Oncol. 2021; 10.1016/j.euo.2020.11.007. [DOI] [PubMed] [Google Scholar]
- 3. Hugosson J, Roobol MJ, Mansson M et al. A 16‐yr follow‐up of the european randomized study of screening for prostate cancer. Eur. Urol. 2019; 76: 43–51. [DOI] [PMC free article] [PubMed] [Google Scholar]
- 4. Roberts MJ, Bennett HY, Harris PN et al. Prostate biopsy‐related infection: a systematic review of risk factors, prevention strategies, and management approaches. Urology 2017; 104: 11–21. [DOI] [PubMed] [Google Scholar]
- 5. de la Calle CM, Fasulo V, Cowan JE et al. Clinical utility of 4Kscore, ExosomeDx and magnetic resonance imaging for the early detection of high grade prostate cancer. J. Urol. 2021; 205: 452–60. [DOI] [PubMed] [Google Scholar]
- 6. Bax C, Lotesoriere BJ, Sironi S, Capelli L. Review and comparison of cancer biomarker trends in urine as a basis for new diagnostic pathways. Cancers (Basel) 2019; 11: 1244. [DOI] [PMC free article] [PubMed] [Google Scholar]
- 7. Bosland MC, Ozten N, Eskra JN, Mahmoud AM. A perspective on prostate carcinogenesis and chemoprevention. Curr. Pharmacol. Rep. 2015; 1: 258–65. [DOI] [PMC free article] [PubMed] [Google Scholar]
- 8. Capelli L, Taverna G, Bellini A et al. Application and uses of electronic noses for clinical diagnosis on urine samples. A review. Sensors (Basel) 2016; 16: 1708. [DOI] [PMC free article] [PubMed] [Google Scholar]
- 9. Taverna G, Tidu L, Grizzi F et al. Olfactory system of highly trained dogs detects prostate cancer in urine samples. J. Urol. 2015; 193: 1382–7. [DOI] [PubMed] [Google Scholar]
- 10. Guest C, Harris R, Sfanos KS et al. Feasibility of integrating canine olfaction with chemical and microbial profiling of urine to detect lethal prostate cancer. PLoS One 2021; 16: e0245530. [DOI] [PMC free article] [PubMed] [Google Scholar]
- 11. Pearce TC. Computational parallels between the biological olfactory pathway and its analogue ‘the electronic nose’: part II. Sensor‐based machine olfaction. Biosystems 1997; 41: 69–90. [DOI] [PubMed] [Google Scholar]
- 12. Baldini C, Billeci L, Sansone F, Conte R, Domenici C, Tonacci A. Electronic nose as a novel method for diagnosing cancer: a systematic review. Biosensors (Basel) 2020; 10: 84. [DOI] [PMC free article] [PubMed] [Google Scholar]
- 13. Baldwin EA, Bai J, Plotto A, Dea S. Electronic noses and tongues: applications for the food and pharmaceutical industries. Sensors (Basel) 2011; 11: 4744–66. [DOI] [PMC free article] [PubMed] [Google Scholar]
- 14. Wasilewski T, Migon D, Gebicki J, Kamysz W. Critical review of electronic nose and tongue instruments prospects in pharmaceutical analysis. Anal. Chim. Acta 2019; 1077: 14–29. [DOI] [PubMed] [Google Scholar]
- 15. Cipriano D, Capelli L. Evolution of electronic noses from research objects to engineered environmental odour monitoring systems. A review of standardization approaches. Biosensors (Basel) 2019; 9: 75. [DOI] [PMC free article] [PubMed] [Google Scholar]
- 16. Farraia MV, Cavaleiro Rufo J, Paciencia I, Mendes F, Delgado L, Moreira A. The electronic nose technology in clinical diagnosis: a systematic review. Porto Biomed. J. 2019; 4: e42. [DOI] [PMC free article] [PubMed] [Google Scholar]
- 17. Mottet N, Bellmunt J, Bolla M et al. EAU‐ESTRO‐SIOG guidelines on prostate cancer. Part 1: screening, diagnosis, and local treatment with curative intent. Eur. Urol. 2017; 71: 618–29. [DOI] [PubMed] [Google Scholar]
- 18. D'Amico AV. Risk‐based management of prostate cancer. N. Engl. J. Med. 2011; 365: 169–71. [DOI] [PubMed] [Google Scholar]
- 19. Capelli L, Bax C, Grizzi F, Taverna G. Optimization of training and measurement protocol for eNose analysis of urine headspace aimed at prostate cancer diagnosis. Sci. Rep. 2021; 11: 20898. [DOI] [PMC free article] [PubMed] [Google Scholar]
- 20. Bax C, Prudenza S, Gaspari G, Capelli L, Grizzi F, Taverna G. Drift compensation on electronic nose data for non‐invasive diagnosis of prostate cancer by urine analysis. iScience 2022; 25: 103622. [DOI] [PMC free article] [PubMed] [Google Scholar]
- 21. Kursa MB, Jankowski A, Rudnicki WR. Boruta ‐ a system for feature selection. Fund. Inform. 2010; 101: 271–86. [Google Scholar]
- 22. Pal M. Random forest classifier for remote sensing classification. Int. J. Remote Sens. 2005; 26: 217–22. [Google Scholar]
- 23. Taverna G, Tidu L, Grizzi F et al. Highly‐trained dogs' olfactory system for detecting biochemical recurrence following radical prostatectomy. Clin. Chem. Lab. Med. 2016; 54: e67–70. [DOI] [PubMed] [Google Scholar]
- 24. Asimakopoulos AD, Del Fabbro D, Miano R et al. Prostate cancer diagnosis through electronic nose in the urine headspace setting: a pilot study. Prostate Cancer Prostatic Dis. 2014; 17: 206–11. [DOI] [PubMed] [Google Scholar]
- 25. Roine A, Veskimae E, Tuokko A et al. Detection of prostate cancer by an electronic nose: a proof of principle study. J. Urol. 2014; 192: 230–4. [DOI] [PubMed] [Google Scholar]
- 26. Kattan MW. Editorial comment. J. Urol. 2014; 192: 234–5. [DOI] [PubMed] [Google Scholar]
- 27. Aggio RB, de Lacy CB, White P et al. The use of a gas chromatography‐sensor system combined with advanced statistical methods, towards the diagnosis of urological malignancies. J. Breath Res. 2016; 10: 017106. [DOI] [PMC free article] [PubMed] [Google Scholar]


