Abstract
A new H‐bonded crystal [RuIII(Him)3(Im)3] with three imidazole (Him) and three imidazolate (Im−) groups was prepared to obtain a higher‐temperature proton conductor than a Nafion membrane with water driving. The crystal is constructed by complementary N−H⋅⋅⋅N H‐bonds between the RuIII complexes and has a rare Icy‐c* cubic network topology with a twofold interpenetration without crystal anisotropy. The crystals show a proton conductivity of 3.08×10⁻⁵ S cm−1 at 450 K and a faster conductivity than those formed by only HIms. The high proton conductivity is attributed to not only molecular rotations and hopping motions of HIm frameworks that are activated at ∼113 K, but also isotropic whole‐molecule rotation of [RuIII(Him)3(Im)3] at temperatures greater than 420 K. The latter rotation was confirmed by solid‐state 2H NMR spectroscopy; probable proton conduction routes were predicted and theoretically considered.
Keywords: cubic structures, hydrogen bonds, imidazole complexes, Pourbaix diagram, proton transport
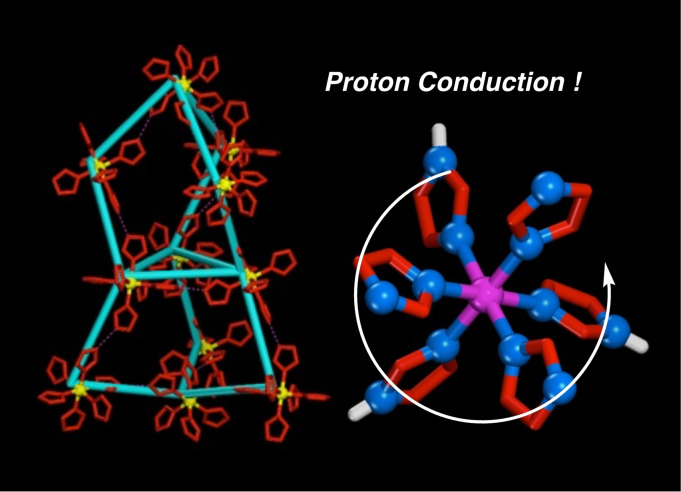
A new H‐bonded crystal of [RuIII(Him)3(Im)3](1) with six HIm (imidazole) was prepared so as to obtain a high‐temperature proton conductor. The crystal is constructed through N−H⋅⋅⋅N−H‐bonds between the inter‐RuIII complexes and has a rare Icy‐c* cubic net without crystal anisotropy. The proton conductivity is due not only to rotations and hopping motions of HIm, but also induced by isotropic whole‐molecule rotation of 1.
Introduction
Imidazole (HIm) groups in biological molecules are found mainly as the histidine residue of amino acids that are involved in the transfer of H‐bonded protons – for example, in the M2 channel of the influenza virus, [1] in proton‐coupled electron transfer (PCET) in oxygen evolution centres, [2] and in catalytic reactions as catalytic triads in activation centres. [3] Furthermore, H‐bonded crystals of HIm derivatives have also attracted attention as organic functional materials with ferroelectric to paraelectric phase transitions that occur owing to the proton transfer between the intermolecular H‐bonds of HIm derivatives. [4] Additionally, HIm is expected to act as a proton conductor in the absence of H2O and may be a replacement for the Nafion membrane (σ=∼10−2 S cm−1) with its H‐bonding H2O clusters in a fuel cell. In particular, the proton transfer between HIms might enable the development of alternative proton conductor materials that can operate at higher temperatures than those accessible when using the Nafion membrane. [5]
Pure HIms confined to metal‐organic frameworks (MOFs) without H2O exhibit a proton conductivity (σ) of ∼10−5 S cm−1 at 373 K, [6] which is three orders of magnitude higher than that in a bulk HIm crystal (σ=∼10−8 S cm−1). [7] However, the proton conductivity of HIm included in a MOF is lower than that of the Nafion membrane used in current applications. For a thorough understanding of the proton conducting mechanism of HIms, it is important to know how higher proton conductivity is related to the molecular motions of HIm derivatives. Therefore, it is necessary to understand the proton conduction mechanism and pathway that results in high proton conductivity through H‐bonded HIm networks. To date, the most rapid proton conductor using only a HIm system is Fe‐MOF‐coordinated Him that has a high proton conductivity of 1.21×10⁻² S cm−1 at 333 K. However, its proton transport mechanism has not been elucidated thus far. [8]
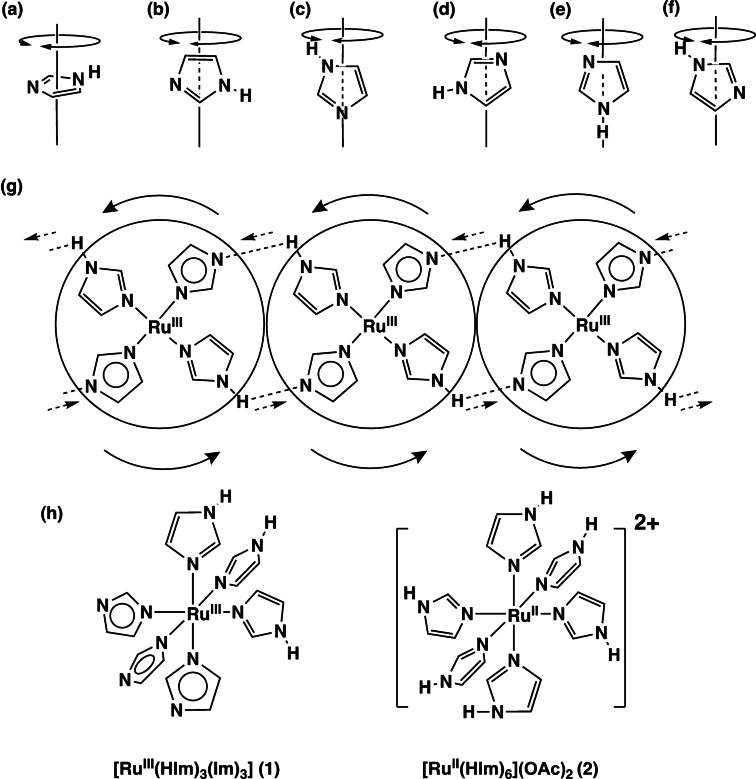
To increase proton mobility, it is important to control the proton‐conduction transfer carried out by the intermolecular N−H⋅⋅⋅N H‐bonds of the HIm groups through regular molecular rotation and a proton jump. [9] Meanwhile, a molecular design of metal complexes containing several HIm groups is effective for increasing the proton‐conduction carriers in the system. Therefore, a novel Ru3+ complex with six HIm groups of [RuIII(HIm)3(Im)3] (1, Figure 1h) was prepared in high yield of 79.9 %, and was found to have the crystal structure of proton‐conducting intermolecular N−H⋅⋅⋅N H‐bonding networks. In previous report, [10] Das and co‐worker prepared molecular protonic conductors with [NiII(HIm)6]2+ and dicarboxylate A2− as MHOFs, that are 9.7×10⁻⁴ to 3.5×10⁻⁴ S cm−1 at 80 °C and 98 %RH. Their high proton‐conductivities need H‐bonds with O atoms of carboxyl groups. For a HIm crystal, two HIm proton‐transfer pathways were proposed – one involving molecular rotation of HIms and the other, a H‐bonding proton jump, with the former shown as rotational motions in Figure 1a–f. In the former mechanism, the crystal of 1, in which one of two N atoms of a HIm coordinates to the Ru3+ ion, is limited as a proton conductor owing to the rotational motion of only the c‐type in Figure 1. In the latter mechanism, proton conduction occurs by a H‐bonded proton jump in 1, which has three Im− proton acceptors and three HIm proton donors that neutralise the charge separation that occurs if the protons taken up are the same as the protons that are released. [11]
Figure 1.
a)–f) Rotational motions of HIm around each axis. g) Proton transfer by a whole rotation of H‐bonded [RuIII(HIm)3(Im)3] (1). h) Structures of Ru‐Him complexes 1 and 2.
Complex 1 forms a quasi‐octahedral complex by coordinating three HIm and three Im− groups to a Ru3+ ion. The residual six N atoms of HIm or Im− groups without a metal coordination form complementary intermolecular N−H⋅⋅⋅N H‐bonds with other complexes of 1. The H‐bonding Im−H⋅⋅⋅Im− groups of 1 in the crystal can conduct some protons to other complexes of 1 through N−H⋅⋅⋅N H‐bonds by rotational relay followed by a proton jump. The crystal of 1 has a relatively high proton conductivity of 3.08×10⁻⁵ S cm−1 at 450 K with proton conduction proceeding solely through the Im−H⋅⋅⋅Im− H‐bonding groups. The crystallographic data for the crystal of 1 shows that it has a cubic high‐symmetry structure in the Pa (#205) space group with twofold interpenetration formed by two chiral H‐bonding networks with a novel Icy‐c* topological network. [12] This crystal system is a relatively rare structure and the Icy‐c*‐net structure with a twofold interpenetration has been previously found only in the crystal structures of {(Et3NH)[Zn4(ip)3(bta)3]}n (ip2−=isophthalate, bta−=benzotriazolate) and {[Zn4O(tda)3(MeOH)] ⋅ DMF ⋅ 4H2O}n (tda2−=thiophen dicarboxylate).[ 13 , 14 ] The cubic structure implies that the proton conductivity on the crystal of 1 will have almost the same values for every crystal face owing to the absence of crystallographic anisotropy.
A bulk HIm crystal forms a crystal structure with one‐dimensional linear chains of complementary intermolecular N−H⋅⋅⋅N H‐bonds. [15] A H‐bonded proton bound by two HIms in the crystal can mainly transfer to other neighbouring HIms, that is, from a H‐bonding N−H donor to a H‐bonding N acceptor by either a proton jump or rotation. Such a proton jump through intermolecular H‐bonds of 1 is caused by changing the bond alternation of each HIm, and the HIm rotation leads to configuration defects in the crystal. The crystal of 1 with complementary Im−H⋅⋅⋅Im− H‐bonding groups forms cubic three‐dimensional H‐bonding networks with several symmetrical proton‐conductive routes, leading to high proton conductivity with not only a local proton transfer by small HIm framework rotations but also by a large whole‐molecule rotation of 1, similar to the molecular rotations of HSO4 − and H2PO4 − in the solid ionic conductors. [16] This pathway has a novel proton conducting mechanism and is shown in Figure 1g.
Results and Discussion
The samples of 1 are prepared as follows: excess HIm and RuIIICl3 ⋅ 3H2O were added to ethylene glycol, and the mixed solution was heated in a microwave for 5 min. The obtained solution was concentrated, and a small amount of NH3 solution was added to afford an oxidised blue precipitate of [RuIII(HIm)3(Im)3](1) with an initial yield of approximately 80 %. The single crystals were recrystallised from the mixed‐solution of methylbenzoate (PhCOOMe)/MeOH, and the crystal of 1 has a unique external form indicating a direct penta‐connection of 5 quadrangular‐pyramid fragments, as shown in Figure S10 in the Supporting Information. Prior to the addition of the NH3 solution, a small amount of saturated NaOAc aqueous solution was added to the initial microwaved and concentrated solution to afford [RuII(HIm)6](OAc)2 (2, Figure 1h) yellow microcrystals in 75 % yield.
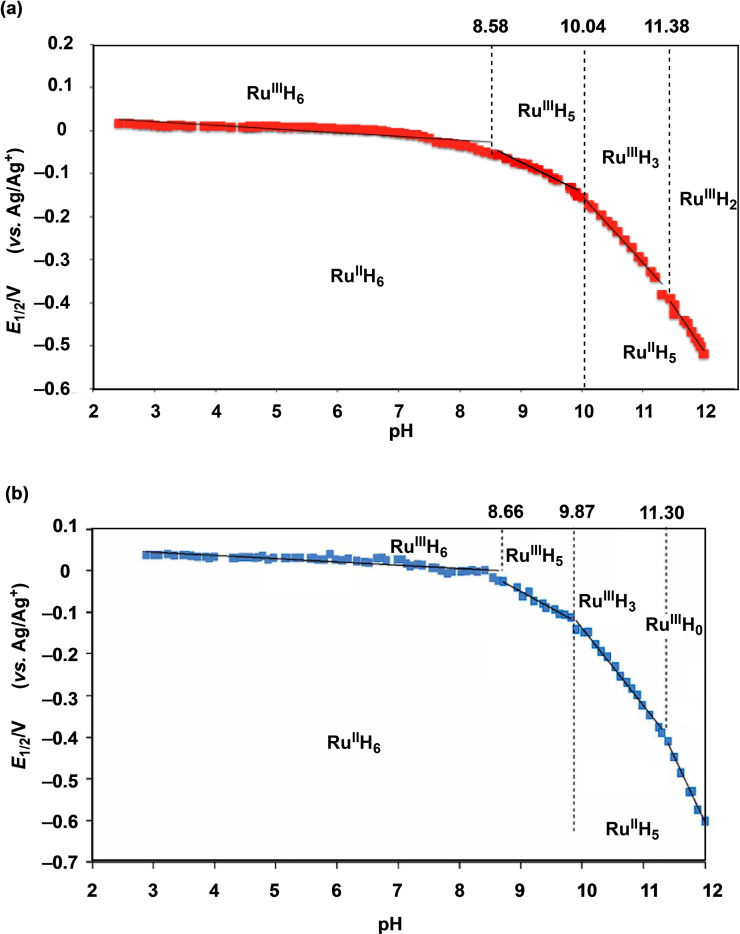
The results of cyclic voltammetry (CV) measurements of 2 in MeCN revealed a reversible one‐step and one‐electron transfer reaction of RuII/RuIII in which E 1/2=+0.03 V and ΔE=90 mV (vs. Ag/Ag+). Furthermore, the Pourbaix diagrams [17] for different pH values were plotted to determine redox potentials of 2 in MeCN/Britton‐Robinson buffer (1 : 1) solution, as shown in Figure 2a. The diagram shows some protons transferred by the RuII/RuIII redox reaction at relative pH values rather than the pure pH value measured only in water. The change in the number of the transferred protons of 2 was confirmed by UV‐vis absorption spectroscopy. In the pH range 8.58–2.20, no proton transfer takes place in the one‐electron redox reaction of 2 ([RuII(HIm)6]2+⇄[RuIII(HIm)6]3++e−), which has a pH‐voltage slope of −8 mV/pH. Furthermore, in the pH range 8.58–10.04, 2 undergoes a one‐proton and one‐electron transfer reaction ([RuII(HIm)6]2+⇄[RuIII(HIm)5(Im)]2++H++e−) with a pH‐voltage slope of −56 mV/pH, whereas in the pH range 10.04–11.38, two‐proton and one‐electron transfer reaction ([RuII(HIm)5(Im)]+⇄[RuIII(HIm)3(Im)3]0+2H++e−) occurs with a pH‐voltage slope of −156 mV/pH. In the pH range 11.38–12.02, three‐proton and one‐electron transfer reaction ([RuII(HIm)5(Im)1]+⇄[RuIII(HIm)2(Im)4]−+3H++e−) occurs with a pH‐voltage slope of −210 mV/pH. Moreover, in the pH range 2.20–12.02, the redox potentials of 2 are shifted by ΔE 1/2=0.59 V towards the reductive direction from E 1/2=+0.05 V (pH 2.20) to E 1/2=−0.54 V (vs. Ag/Ag+; pH 12.00). In the other Pourbaix diagram measured in the MeCN/Britton‐Robinson buffer (2 : 1) solution (Figure 2b), 2 undergoes a five‐proton and one‐electron redox reaction ([RuII(HIm)5(Im)]+⇄[RuIII(Im)6]3−+5H++e−), as determined from the pH‐voltage slope of −313.1 mV/pH in the pH range 11.30–12.02. In the pH range 9.87–11.30, three‐proton and one‐electron transfer of the redox reaction ([RuII(Im)(HIm)5]2+⇄[RuIII(Im)4(HIm)2]−+3H++e−) was observed along with a pH‐voltage slope of −185.9 mV/pH. In the pH range 8.66–9.87, one‐proton transfer was observed along with the pH‐voltage slope of −80.0 mV/pH. Thus, 2 can undergo one‐electron and five‐proton transfer in the solvent MeCN/buffer (2 : 1). Interestingly, the redox reaction involving the transfer of only one electron can also transfer more than three protons in strongly basic conditions. Complex 2 had already been used in a new thermo‐electrochemical cell exploiting both protons and electrons. [18]
Figure 2.
Pourbaix diagrams of 2 in a) 1 : 1 and b) 2 : 1 MeCN/buffer. The diagrams indicate that some protons are transferred by the RuII/RuIII redox reaction for a relative pH value, not the pure pH value measured in water. The change in the number of transferring protons of 2 is confirmed by UV‐vis absorption spectroscopy.
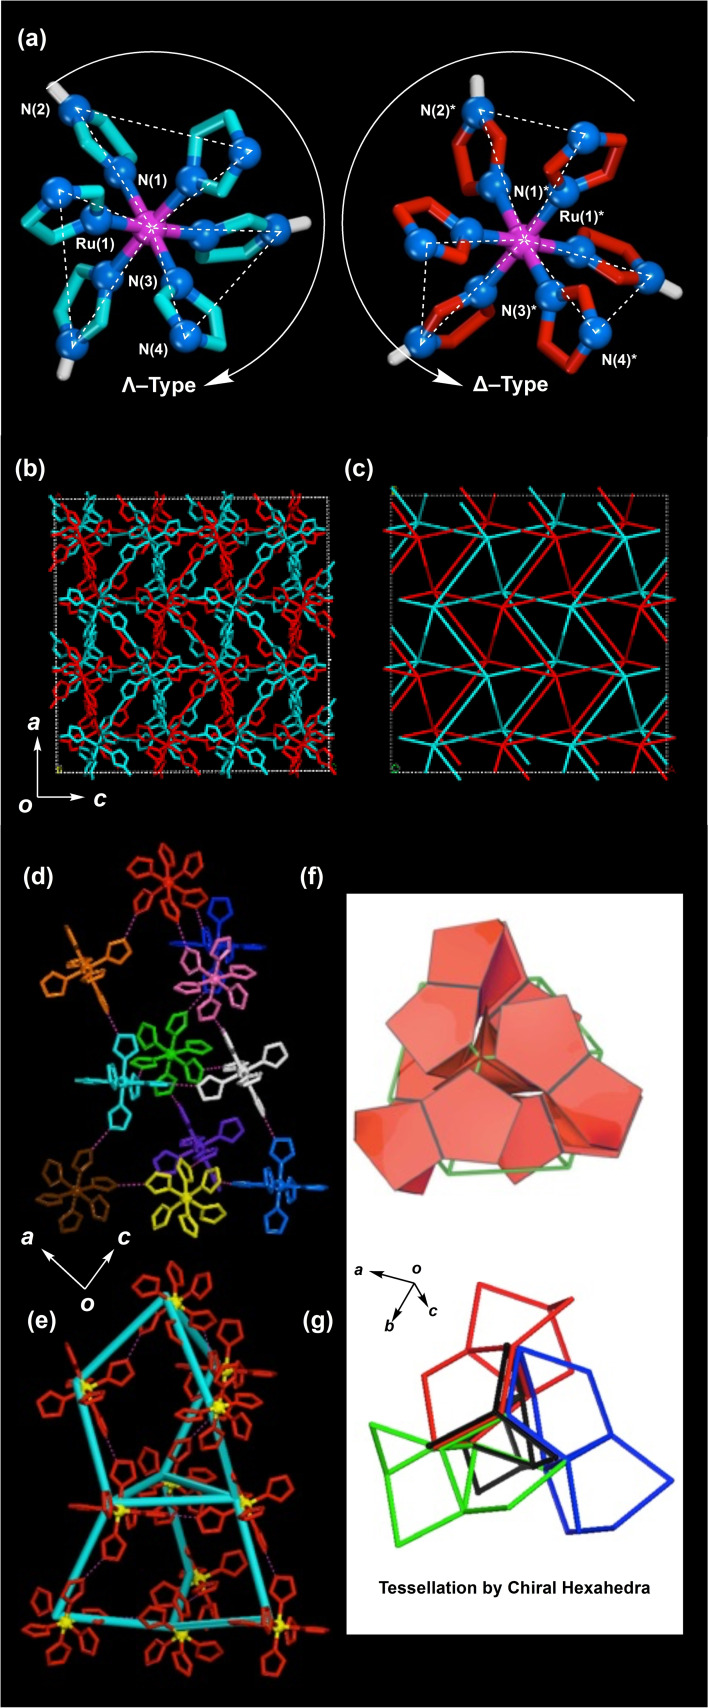
As revealed by X‐ray crystal structure analysis, the crystal of 1 has a high‐symmetry crystal structure with a cubic Pa (#205) space group constructed from two chiral intermolecular H‐bonding networks through twofold interpenetration. The chiral networks are formed by complementary N−H⋅⋅⋅N H‐bonding between HIm and Im− groups. In the projection views along the threefold axis of the two complexes of 1 in Figure 3a, three front Im− groups shown in blue (left) show a right‐handed propeller direction termed as the Λ isomer, while those shown in red (right) show a left‐handed propeller direction termed as the Δ isomer. [19] Therefore, the blue‐coloured Λ isomer and the red‐coloured Δ isomer form two chiral H‐bonding networks with the twofold interpenetration of the blue and red lines, respectively (Figure 3b).
Figure 3.
a) Λ (left) and Δ (right) optical isomers of 1. b) The down view along the b‐axis shows two chiral H‐bonding networks formed by the Λ (blue) and Δ (red) isomers. c) Two chiral H‐bonding networks through twofold interpenetration along the b‐axis that are directly connected via Ru3+ ions through six intermolecular N−H⋅⋅⋅N−H‐bonds of 1; the other atoms of HIm and Im− are omitted for clarity. d) Unique chiral hexahedron formed from the H‐bonding of eleven Δ complexes. e) A chiral hexahedron (blue line) is formed by the connection of Ru3+ ions of 1. f) and g) Repeating chiral hexahedrons lead to crystal packing of the lcy‐c* type. [12]
Figure 3c shows two kinds of H‐bonding networks (blue and red lines) constructed by the two optical isomers of 1. The respective blue and red lines are connected through Ru3+ ions through six intermolecular N−H⋅⋅⋅N H‐bonds in the crystal. Each 2D projection view along the three axes of the blue and red lines indicates almost the same pattern formed from the structural units of one rhombus and two adjacent triangles such as a snub square tiling [20] because of the cubic Pa space group. Thus, the crystal of 1 has the same H‐bonding network patterns in the three Cartesian directions so that its structure is isotropic. Furthermore, in the 3D tessellation structure, alternating blue and red H‐bonding networks are constructed from the smallest repeating polygons as a unique chiral hexahedron connected by intermolecular H‐bonds of eleven chiral complexes of the Δ or Λ isomers (Figure 3d, e). The chiral hexahedron is constructed by binding at the centre of a triangle between the upper three five‐membered rings and the lower three similar rings as shown in Figure 3f, g. They can be fully stacked without small empty spaces resulting in a crystal packing of the Icy‐c* type, which provides the first example of a H‐bonding crystal in molecular crystals.
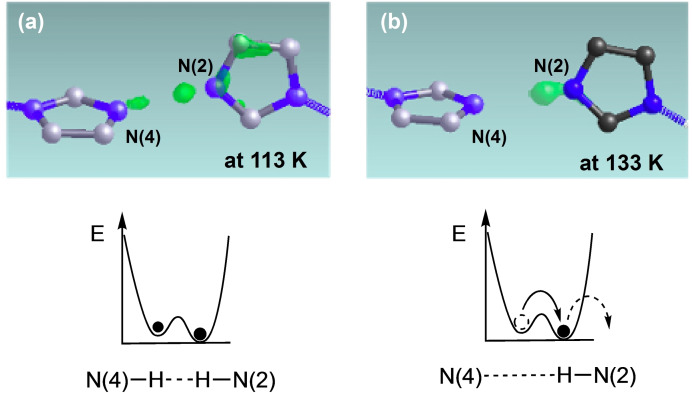
The temperature‐dependent X‐ray crystal analyses at eight temperatures of 93, 113, 133, 173, 233, 298, 353, and 373 K were performed for the crystal of 1 with the obtained electron densities shown in Figure 4 for the H‐bonding protons between HIm and Im− groups on the differential Fourier map. Since the crystal volume and the length of the a axis of 1 drastically increased from 93 K (V=4729(14) Å3, a=16.785(17) Å) to 113 K (V=4766(11) Å3, a=16.829(13) Å), but remain almost monotonically increased at more than 133 K (V=4767(16) Å3, a=16.830(19) Å). It is clear that the motion of the H‐bonded proton is activated at approximately 93–113 K due to volume expansion. The electron density of a H‐bonding proton freezes at the two minimum positions of N(2) and N(4) in the double‐minimum potential of N−H⋅⋅⋅N H‐bonds for temperatures lower than 113 K. However, two electron densities gradually shift to N(2) in the temperature range 113–233 K and are completely localised on the N(2) side of the double‐minimum potential at more than 233 K. This is because the two potential minima are asymmetric in the presence of proton conduction. The conducting protons appear to be localised at the N(2) side with a lower potential minimum for the time‐averaged electron density, as shown in Figure 4. The proton conductive motion is frozen at extremely low temperatures of less than 93 K, which is near the blocking temperature of the proton conduction, and the electron densities for the frozen protons are found randomly at either one of the two minimum positions. As the temperature increases to enable the transfer of the distributed protons, the protons are gradually conducted through an asymmetric double potential owing to the increasing crystal volume. Therefore, a proton in the asymmetric double potential has a different residence time, and it appears to exist on only one side as shown by integrating the residence time. Thus, these results provide evidence for proton transport.
Figure 4.
Electron density maps for the H‐bonding proton of N(2)⋅⋅⋅N(4): at a) 113 and b) 133 K. Between 113 and 133 K, the dielectric constant ϵ‘ slightly increases to induce proton motion.
The crystal of 1 contains 1.5 H2O as a repeating unit of a crystalline solvent, which is confirmed by thermogravimetry (TG) measurements. Two different void spaces (narrow A and wide B) exist because of the interpenetration between the two chiral hexahedra (red and blue in Figure S11). Two H2O molecules occupy the two void spaces of A in the crystal, and one disordered H2O molecule exists at either of the two sites in the wide space B with a 0.5 occupancy factor. These water molecules are released into the atmosphere by the thermal decomposition of the crystal framework at 453 K. Therefore, various measurements can be recorded for the crystal of 1 up to the temperature of ∼450 K, with an endothermic peak corresponding to framework decomposition observed at 478 K by DSC (differential scanning calorimetry) measurements. Temperature‐dependent X‐ray powder diffraction (XRD) measurements carried out up to the temperature of 430 K show that the confined H2O molecules are strongly stabilised in the framework structure, as indicated by the almost unchanged XRD patterns (Figure 5S).
Figure 5.
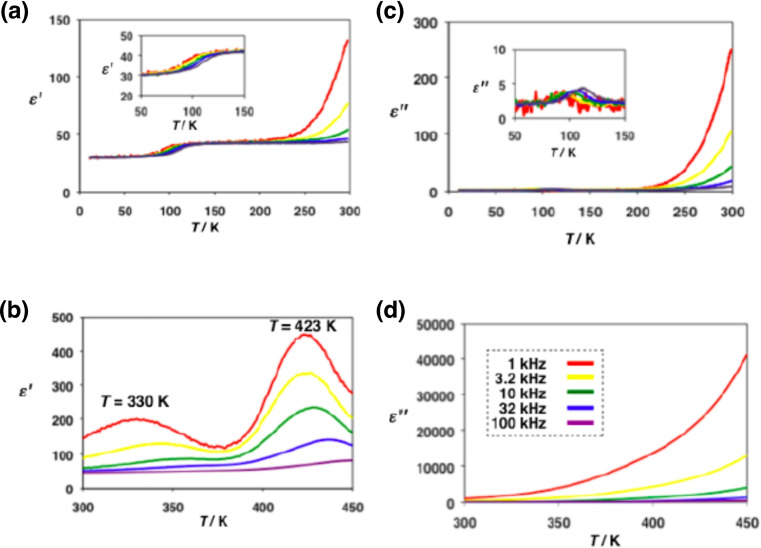
Left: dielectric constant ϵ‘ and right: dielectric loss ϵ‘‘ of 1 over the ranges 10–300 K (top) and 300–350 K (bottom).
No obvious phase transition was observed in DSC measurements upon heating from 173 to 400 K because the crystal structure remains almost unchanged. However, the changes in the electron densities at 93 and 113 K obtained by X‐ray structure crystal analysis are compared to the blocking temperature for an order‐disorder transition of the H‐bonding protons, which is manifested by a small increase in the dielectric constant ϵ’ in the impedance measurements. Figure 5a, b shows the temperature‐dependent dielectric constant ϵ’ for the frequency modulation of 1 kHz to 1 MHz, and Figure 5c, d shows the temperature‐dependent dielectric loss ϵ’’. As the temperature increased from 90 to 140 K, ϵ’ increased slightly from 28 to 40 depending on the frequency. This is owing to the increasing interface polarisation, [21] where some mobile protons are localised on one side of the double‐well energy surface of the H‐bonds depending on the electric field modulation. Alternatively, the change in ϵ' could also be caused by the order‐disorder motion of H2O molecule in the void space B at approximately 113 K. However, H2O molecules confined to the two void spaces of A and B are not strongly related to the temperature‐dependent proton conductivity because they are not involved directly in the formation of the Im−H⋅⋅⋅Im−−H‐bonding networks and can be fixed at this low temperature.
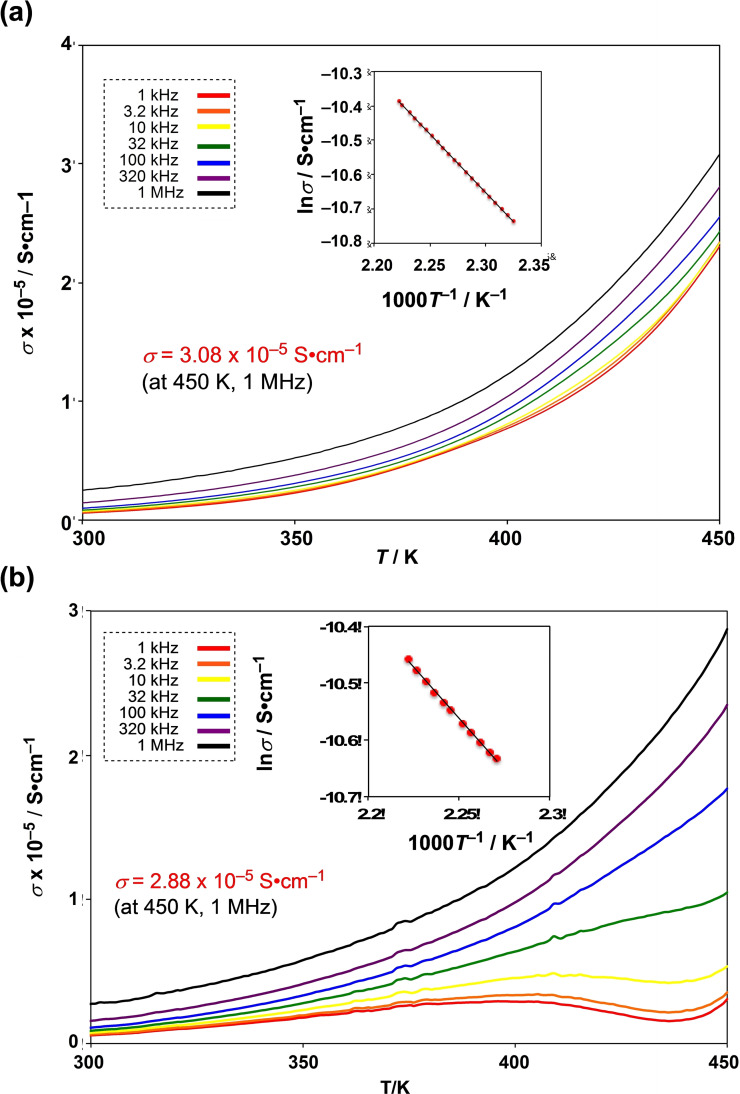
Meanwhile, the rapid increase of ϵ’’ from ∼200 K reveals the starting temperature of the rotational motions of the HIm groups [22] coordinated to Ru3+ ions. The imaginary component of the dielectric loss ϵ’’ shows the same behaviour as the conductivity (σ), which increases with the higher frequency. As a result, a large conductive component of σ=3.08×10⁻⁵ S cm−1 at 1 MHz was demonstrated until the highest temperature of 450 K, at which point the crystal was still not decomposed (Figure 6a). The activation energy of proton conduction was obtained as E a=0.28 eV (at 350∼450 K on 1 MHz) from the Arrhenius plot for the conductivities at every temperature. The electric field and polarisation curvature (P−E curve) measurement of 1 shows paraelectric behaviour in the temperature range 70–410 K without hysteresis. Additionally, the deuteron conductivity of the deuterated crystal of 1’ with D2O was measured to investigate whether the conductive carrier is a deuteron (proton) (Figure 6b). The conductivity of 1’ was 2.88×10⁻⁵ S cm−1 at 1 MHz and 450 K, and the activation energy E a=0.30 eV (at 400–450 K at 1 MHz); the ratio of σ(H)/σ(D)=1.21 was slightly smaller than the theoretical isotope effect value. The ratio of the self‐diffusion constants D H+ and D D+ is D D+/D H+≤√2. The proton conductivity of 1 shows a larger value (3.44×10⁻⁵ S cm−1) in the second cycle at 450 K than in the first cycle. The increasing proton conductivity at second cycles could be attributed to the formation of a regular conductive route in the crystal that would enable the smooth flow of protons.
Figure 6.
Proton and deuteron conductivity of 1 and 1′ determined by alternative impedance measurements conducted in a) H2O and b) D2O.
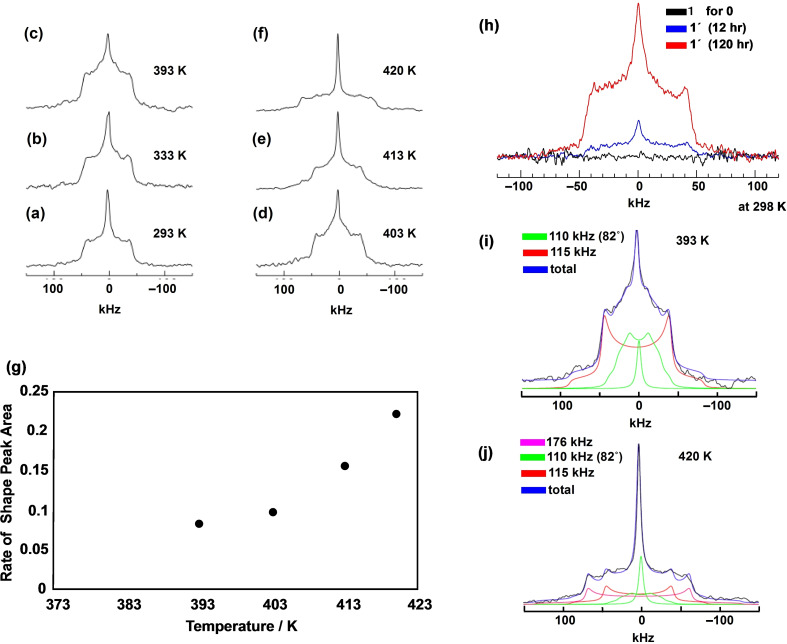
To confirm the proton conductivity and rotational motion, deuterons were introduced into the crystal of 1 to replace the protons using two exchange methods, I and II, and the obtained 1’ with deuterons was investigated by solid‐state 2H NMR spectroscopy. In method I, the crystals of 1’ with the deuterated DIm groups were prepared by recrystallisation where PhCOOMe was diffused in a basic MeONa/d1‐MeOD solution with 1. In method II, the crystals of 1 were left in the D2O vapour atmosphere at 333 K for 120 h to obtain the crystals of 1’, because the proton conductivity of 1 was activated only at 333 K. Using these two methods, only protons on the N−H groups of HIm were deuterated, but the protons directly connected to the C−H groups of HIm were not deuterated. Figure 7a–f shows the temperature‐dependent solid state 2H NMR spectra of 1' obtained in the temperature range 293–420 K. The peak intensities of localised rotations (−50 to +50 kHz) increase slightly until 403 K, while the peak intensities around the centre of the spectrum (−5 to 5 kHz) increase in the temperature range 403–420 K. At temperatures greater than 420 K, the wide peaks of the localised rotation are broadened (−70 to +70 kHz). Figure 7 h shows the solid‐state 2H NMR spectra at 298 K that confirms the deuteron exchange and the formation of 1’, prepared by method II. Even at 298 K, deuteron exchange to form 1’ was completed and the peak intensity of 1’ showed no change for more than 120 h. The crystals of 1’ prepared by method I also showed the completely deuterated peaks of the DIm groups. The solid state 2H NMR spectra obtained at 393 K for the crystal of 1’ were fitted by three peaks indicated by two green and one red lines in Figure 7i. The red peak was located in the range of −50 kHz to +50 kHz (e2qQ/η=115 kHz, η=0) and is related to the D2O confined in the wide void space B. The motion of D2O is limited by the strong H‐bonding interaction because the thermal decomposition of the crystal framework by the evaporation of D2O only occurs at 453 K. The other broadened green peak is assigned to the flip‐flop rotation of the coordinated DIm groups (e 2 qQ/η=110 kHz, η=0) with a rotational angle of 82°. The smaller and sharper green peak at around 0 kHz is most likely due to rotational motion of the whole molecule of 1'. As shown in Figure 7j, for the spectrum obtained at 420 K, the rate of change in the 2H NMR spectrum varied with temperature, and the occupancy rate of the peak area around 0 KHz increased from 0.10 at 403 K to 0.23 at 420 K, as shown in Figure 7g. Then, the intensity of the narrow peak around the centre of the spectrum increases dramatically due to the strong rotation of the whole molecule of 1’. Furthermore, new peaks shown in violet (e 2 qQ/η=176 kHz, η=0) appeared because these peaks correspond to D2O in the narrow void space A.
Figure 7.
a)–f) Temperature‐dependent solid‐state 2H NMR spectra of 1’ at 293, 333, 393, 403, 413, and 420 K. g) The rate of change of shape peak area around 0 ppm (the narrow green line in (i) and (j)) of the solid‐state 2H NMR increases with increasing temperatures from 393 K. At 420 K, the rate constant has the largest value. Solid state 2H NMR spectra: h) the peak intensity of 1’ increases upon exposure to D2O vapour at 298 K because protons of 1 are completely exchanged by deuterons of D2O after 120 h. i) The spectrum at 393 K is separated into three portions by the red line and two broad and narrow green lines. j) The spectrum at 420 K is separated into four portions with the addition of the new violet peak.
The 1’ complexes are locally connected by six N−D⋅⋅⋅N H‐bonds between the intermolecular Im−D⋅⋅⋅Im− groups that form 3D H‐bonding networks. The six Im−D⋅⋅⋅Im− H‐bonded groups coordinated to a Ru3+ ion can conduct deuterons sequentially by intermolecular deuteron jumps and rotations that occur randomly to break the Im−D⋅⋅⋅Im− H‐bonds. Thus, the whole‐molecule rotation of 1’ is also possible at less than 293 K by the temporary simultaneous breaking of all six Im−H⋅⋅⋅Im− H‐bonds despite the large H‐bonding energy of the six Im−D⋅⋅⋅Im groups. The simultaneous breaking of six bonds requires sufficient energy to overcome the energy barrier imposed by the sum of the bond energies of the six bonds. However, in this case, each of the six H‐bonds constantly breaks even at low energies. For a whole‐molecule rotation of 1’, the six H‐bonds should simultaneously break through rotations of each H‐bond. Therefore, even at low temperatures, the probability of breaking each H‐bond and the consequent whole‐molecule rotation of 1’ is low. In contrast, at high temperatures, rotation and breaking of H‐bonds would be enhanced, and the probability of the whole‐molecule rotation also increases as the probability of all six H‐bonds breaking simultaneously increases. As the crystal of 1 has no intermolecular 1D H‐bonding chains such as those found in a bulk HIm crystal, the H‐bonding protons are not only transported through proton jumps and two localised rotations of the coordinating HIm and Im− groups, but also through the whole‐molecule rotations at high temperatures.
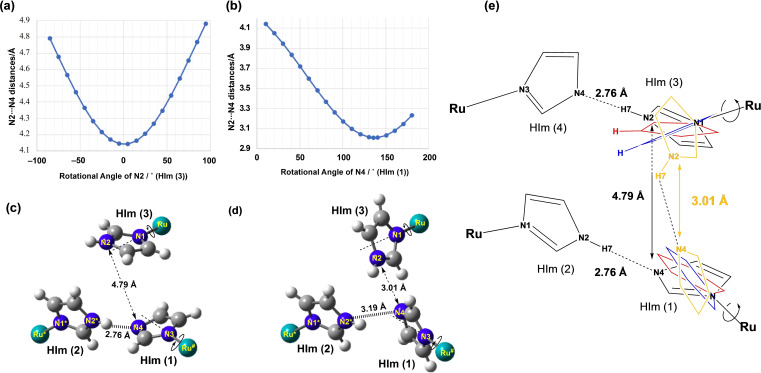
Based on the rapid proton conduction and the results obtained from deuteron substitution, probable proton conduction routes in the crystal can be proposed. When the Im−H⋅⋅⋅Im−−H‐bonds of 1 are broken, the HIm groups rotate and form H‐bonds with other N atoms of Im− in other complexes of 1. The H‐bonding protons of 1 are mainly transferred through such a process. Therefore, we have theoretically examined with the GaussView3 [23] based on Z‐matrix by the X‐ray crystal analysis to determine whether the H‐bonding proton can transfer from N(2) of HIm(3) to N(4) of HIm (1) by rotation around the axes of Ru(1)−N(1) and Ru(1)*−N(3), respectively, as shown in Figure 8. First, by the rotation of HIm (3) around the N(1)−Ru(1) axis, the distance of 4.79 Å between the N(2) and N(4) atoms decreases to its shortest at 4.15 Å (Figure 8a). Furthermore, fixing the position of the optimised N(2) atom, by the rotation of HIm(1) around the N(3)−Ru(1) axis, the shortest distances were calculated as N(2)⋅⋅⋅N(4)*=3.01 Å and N(2)*⋅⋅⋅N(4)*=3.19 Å (Figure 8b). The H‐bond distance of 3.01 Å is sufficiently short to trap and release the protons in the solid even though it is longer than the original N(2)*⋅⋅⋅N(4)* distance of 2.76 Å.
Figure 8.
H‐bonding distance of N(2)⋅⋅⋅N(4) optimised around the two rotational angles of a) HIm(3) and b) Hbim(1). c) The rotational angle of HIm(3) decreases at 4.79–4.15 Å by optimisation of the rotation angle 100°. d) The shortest length of N(2)⋅⋅⋅N(4) is 3.01 Å, optimised by the rotation of HIm(1) and N(2)*⋅⋅⋅N(4)*, which is changed from 2.76 to 3.19 Å. e) Schematic representation of the optimisation of the H‐bonding distance of N(2)⋅⋅⋅N(4) to from 4.79 to 3.19 Å.
Conclusion
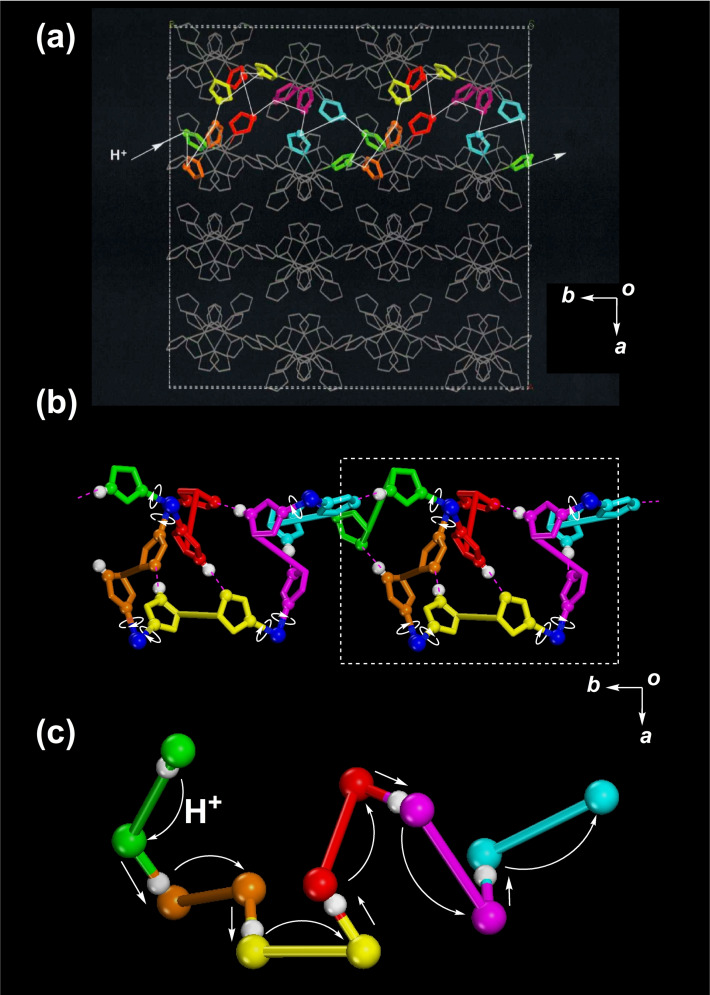
Protons can conduct between molecules of 1 by the process of breaking the Im−H⋅⋅⋅Im−−H‐bonds and rotation of the coordinating HIm and Im− groups. Such a proton conduction route can be traced through a practical crystal structure of 1 along the b‐axis, where all the H‐bonding positions are colour‐coded, as in Figure 9. The crystal of 1 has a cubic symmetry enabling proton conduction in any direction. Practically, to transfer protons, proton jumps of direct H‐bonds between N−H groups and N atoms are required first, and rotational motions of HIm and Im− are essential. A local energy gradient is required to generate the proton current. Two N atoms in an H‐bonding Im−H⋅⋅⋅Im− group have two different energy minima and a time‐averaged proton position is localised on either side at temperatures below 113 K. Proton motion starts at temperatures above 133 K; a proton of the N(4) atom transfers to a N(2) atom and is localised on the N(2) atom, as shown in the dynamic electron density map. At the low temperature of 200 K, proton conductivity occurs mainly by a proton jump and a localised rotation of HIm and Im− groups coordinated to Ru3+ ions. Whole‐molecule rotation of 1 is also observed even at 293 K through the random simultaneous breaking of six Im−H⋅⋅⋅Im− H‐bonds of 1. However, for temperatures greater than 420 K, the contribution of whole‐molecule rotation of 1 towards proton conductivity increases and becomes dominant. Thus, the whole‐molecule rotation of 1 rapidly increases the proton conductivity at temperatures greater than 420 K. Evidence for the whole‐molecule rotation of 1 was obtained from solid‐state 2H NMR spectra, indicated by the increase in the high proton conduction component in the high‐temperature region of the isotropic peak around 0 kHz in the 2H NMR spectra and the dielectric constant of 1 separated into two peaks in the high‐temperature region. However, proton conductivity at temperatures above 450 K remains challenging to investigate as the crystal collapses at these temperatures. Nevertheless, if the crystal of 1 contains no H2O as the crystalline solvent, it should be possible to conduct measurements for proton conductivity at high temperatures.[ 24 , 25 ]
Figure 9.
a) Proton conductive route along the b‐axis in a down view. b) Proton conductive route with each H‐bonding part represented through various colours. c) Repeating units of the proton conductive route with proton jumps and rotations of H‐bonding HIm and Im− groups; all atoms except the H‐bonding N and H atoms are omitted for clarity.
Experimental Section
Preparation
[RuIII(HIm)3(Im)3] (1): Ruthenium(III) chloride trihydrate (1.00 g, 3.80 mmol) was dissolved in EtOH (70 cm3) and refluxed for 10 min by a microwave. The green solution was evaporated in dryness. HIm (5.17 g, 76.0 mmol) and ethylene glycol (10 cm3) was added to the residues and refluxed for 10 min by a microwave again. After cooling, to the obtained yellow solution was added H2O (20 cm3) and NH3 aqueous solution (20 cm3), and the mixture was stirred over night at room temperature to give violet crystalline solids. The precipitates were filtered and washed with H2O, MeOH and Et2O in turn, and air drying. Yield: 1.54 g (79.9 %) The precipitates of 1 were recrystallised from alkalic MeOH and PhCOOMe. FAB‐mass: m/z 508 ([Ru(HIm)5(Im)]+), IR spectrum (KBr)/cm−1: 3367, 3135, 2453, 1941, 1585, 1454, 1143, 1074, 752, 669; elemental analysis calcd (%) for [RuIII(HIm)3(Im)3]: C 42.68, H 4.18, N 33.18; found: C 42.28, H 4.68, N 32.81 %. (vacuum dried for 6 h at 120 °C); XPS: 280.8 eV (3d5/2).
[RuII(HIm)6](AcO)2 (2): The complex of 3 (0.50 g, 0.86 mmol) was dissolved in H2O (20 cm3), and to the solution was added AcONa (1.41 g, 17.2 mmol) to give yellow precipitates. The precipitates were filtered and washed with H2O, MeOH and Et2O in turn, and air drying. The microcrystal of 2 was recrystallised from MeOH/Et2O. Yield: 0.24 g (75.0 %) FAB‐mass: m/z 508 ([Ru(HIm)5(Im)]+), IR spectrum (KBr)/cm−1: 3124, 2992, 2896, 1620, 1560, 1410, 1310, 1119, 1105, 1080, 1020, 932, 747, 690, 652; elemental analysis calcd (%) for [RuII(HIm)6](AcO)2 (C22H30N12Cl4Ru): C 42.10, H 4.82, N 26.87; found: C 41.79, H 4.74, N 27.04; XPS: 279.3 eV (3d5/2).
[RuII(HIm)6]Cl2 (3): In the same synthetic method of 1, after microwave refluxing for 10 min, the reaction solution was added to Me2CO (500 cm3). The obtained yellow precipitates were filtered and washed with H2O, MeOH and Et2O in turn, and air drying. The microcrystal of 3 was recrystallised from a warming water. Yield: 1.17 g (68.1 %) FAB‐mass: m/z 508 ([Ru(HIm)5(Im)]+), IR spectrum (KBr)/cm−1: 3284, 3133, 3060, 2954, 2857, 2607, 1326, 1066, 802, 676, 613; elemental analysis calcd (%) for [RuII(HIm)6]Cl2 (C18H24N12Cl2Ru): C 37.25, H 4.17, N 28.96; found: C 37.18, H 3.89, N 28.60; XPS: 279.4 eV (3d5/2).
Experimental: The alternative impedance measurements were performed for a single crystal of 1 attached an Au paste with a gold conducting wire (ϕ = 25 μm) using a Solartron 1260 impedance/gain‐phase analyser with a Solartron 1296 dielectric interface (Solartron Co. Ltd). X‐ray crystal analysis was conducted using a Brüker APEX‐II diffractometer. The CV measurements were obtained using a CHIALS 6121B (BAS Co. Ltd.). The reference electrode used was Ag/Ag+ and the counter electrode was a Pt wire. The electrolyte solution was 0.1 M nBu4NPF6 in MeCN. We measured the N⋅⋅⋅N distances of HIm moiety based on the crystal structure of 1 by GaussView3 (Gaussian. Inc., released 2000–2003). Initially, we reconstructed the crystal structure using Z‐matrix, and measured the N⋅⋅⋅N distances by rotating the HIm plane every 10 degrees. FAB mass‐spectra (JMS‐AX505H) and XPS spectra (JPS‐9010MC) were measured. The complex 2 was previously reported. [26]
Pourbaix diagram: The Pourbaix diagram was constructed using the precursor complex of [RuII(HIm)6](AcO)2 (2). The measurements were conducted in 1 : 1 and 2 : 1 (v/v) mixed solutions of MeCN and Britton‐Robinson buffer water solution, containing H3PO4 (40 mM), H3BO3 (40 mM), and AcOH (40 mM). [RuII(HIm)6](AcO)2 (2) (1 mM) was dissolved in this solution and NaOH (1 M) was added in 20 μL increments. The CV measurements were performed at pH values from pH 2 to 12 in increments of 0.1. The pH values were measured using a pH/mV portable meter (Five GO, Mettler Toledo Co. Ltd.). The CV measurements were obtained using a CHIALS 6121B (BAS Co. Ltd.). The pH domains of each species from pH 2.0 to 12.0 were determined from the UV‐vis spectra (JASCO V‐550) obtained at every 0.2 increase in pH. The reference electrode used was Ag/Ag+, the counter electrode was a Pt wire, and the working electrode was GC. The acidity measurements are not strictly “pH” values. The pH value in such a mixed solvent system is much more complicated to define. A Pourbaix diagram reports absolute values of thermochemical quantity, and is usually referenced to the standard hydrogen electrode at pH 0 and E=0, which is not the case here because our reference electrode is ferrocene.
Crystal structures of [RuIII(HIm)3(Im)3] (1): T=93 K, C18H24N12O1.5Ru, M=530.54, cubic, space group Pa (#205), a=16.785(17) Å, V=4729(14) Å3, Z=8, F(000)=2152, D calcd=1.490 g cm−3, μ(MoKα)=7.04 cm−1, radiation=0.71073 Å, R 1=0.0394 for I>2.0σ(I), wR 2=0.1124 for all data (1815 reflections 2θ<54.96°), GOF=1.101 (99 parameters). The maximum and minimum peaks in the final differential map were 1.226 and −0.439 e−/Å3, respectively. T=113 K, a=16.829(13) Å, V=4766(11) Å3, D calcd=1.479 g cm−3, μ(MoKα)=6.96 cm−1, R 1=0.0366 for I>2.0σ(I), wR 2=0.1016 for all data (1821 reflections 2θ<54.93°), GOF=1.068 (99 parameters). The maximum and minimum peaks in the final differential map were 0.945 and −0.501 e−/Å3, respectively. T=133 K, a=16.830(19) Å, V=4767(16) Å3, D calcd=1.478 g cm−3, μ(MoKα)=6.96 cm−1, R 1=0.0398 for I>2.0σ(I), wR 2=0.1152 for all data (1823 reflections 2θ<54.92°), GOF=1.050 (99 parameters). The maximum and minimum peaks in the final differential map were 0.911 and −0. 558 e−/Å3, respectively. T=173 K, a=16.863(17) Å, V=4795(15) Å3, D calcd=1.470 g cm−3, μ(MoKα)=6.91 cm−1, R 1=0.0388 for I>2.0σ(I), wR 2=0.1083 for all data (1826 reflections 2θ<54.87°), GOF=1.063 (99 parameters). The maximum and minimum peaks in the final differential map were 0.717 and −0.478 e−/Å3, respectively. T=233 K, a=16.888(19) Å, V=4817(16) Å3, D calcd=1.463 g cm−3, μ(MoKα)=6.88 cm−1, R 1=0.0376 for I>2.0σ(I), wR 2=0.1029 for all data (1828 reflections 2θ<54.91°), GOF=1.067 (99 parameters). The maximum and minimum peaks in the final differential map were 0.594 and −0.417 e−/Å3, respectively. T=298 K, a=16.929(18) Å, V=4852(15) Å3, D calcd=1.453 g cm−3, μ(MoKα)=6.83 cm−1, R 1=0.0368 for I>2.0σ(I), wR 2=0.1058 for all data (1846 reflections 2θ<54.95°), GOF=1.077 (99 parameters). The maximum and minimum peaks in the final differential map were 0.547 and −0.567 e−/Å3, respectively. T=353 K, a=17.000(19) Å, V=4913(16) Å3, D calc=1.435 g cm−3, μ(MoKα)=6.75 cm−1, R 1=0.0393 for I>2.0σ(I), wR 2=0.1081 for all data (1871 reflections 2θ<54.88°), GOF=1.065 (99 parameters). The maximum and minimum peaks in the final differential map were 0.512 and −0.500 e−/Å3, respectively. T=373 K, a=17.06(2) Å, V=4964(17) Å3, D calcd=1.420 g cm−3, μ(MoKα)=6.68 cm−1, R 1=0.0390 for I>2.0σ(I), wR 2=0.1114 for all data (1880 reflections 2θ<54.80°), GOF=1.041 (99 parameters). The maximum and minimum peaks in the final differential map were 0.505 and −0.424 e−/Å3, respectively.
Data reduction, structure solution and refinement, and all the necessary computational data processes were carried out using the APEX, SAINT, and SHELXTL programs. All H atoms were fixed onto the coordinates and refined with isotropic temperature factors during the calculation of the X‐ray structures. Deposition Numbers 2167384 (for 1 at 93 K), 2167385 (for 1 at 113 K), 2167386 (for 1 at 133 K), 2167387 (for 1 at 173 K), 2167388 (for 1 at 233 K), 2167389 (for 1 at 298 K), 2167390 (for 1 at 353 K), and 2167391 (for 1 at 373 K) contain the supplementary crystallographic data for this paper. These data are provided free of charge by the joint Cambridge Crystallographic Data Centre and Fachinformationszentrum Karlsruhe Access Structures service.
Conflict of interest
The authors declare no conflict of interest.
Supporting information
As a service to our authors and readers, this journal provides supporting information supplied by the authors. Such materials are peer reviewed and may be re‐organized for online delivery, but are not copy‐edited or typeset. Technical support issues arising from supporting information (other than missing files) should be addressed to the authors.
Supporting Information
Acknowledgements
This work was supported by a Grant‐in‐Aid for Scientific Research (No. 15H03851) in Priority Areas from the Ministry of Education, Science and Culture, Japan. Further, the authors thank the Analytical Center at the Tokyo University of Science for the use of a single‐crystal X‐ray diffractometer. This work was performed under the Cooperative Research Program of “Network Joint Research Center for Materials and Devices”.
M. Tadokoro, M. Itoh, R. Nishimura, K. Sekiguchi, N. Hoshino, H. Kamebuchi, J. Miyazaki, F. Kobayashi, M. Mizuno, T. Akutagawa, Chem. Eur. J. 2022, 28, e202201397.
References
- 1. Hu F., Luo W., Hong M., Science 2010, 330, 505–508. [DOI] [PMC free article] [PubMed] [Google Scholar]
- 2.
- 2a. Costentin C., ACS Catal. 2020, 10, 7958–7967; [Google Scholar]
- 2b. Keough J. M., Jenson D. L., Zuniga A. N., Barry B. A., J. Am. Chem. Soc. 2009, 131, 10567–10573. [DOI] [PMC free article] [PubMed] [Google Scholar]
- 3. Sirohiwal A., Neese F., Pantazis D. A., J. Am. Chem. Soc. 2019, 141, 3217–3231. [DOI] [PMC free article] [PubMed] [Google Scholar]
- 4. Horiuchi S., Kagawa F., Hatahara K., Kobayashi K., Kumai R., Murakami Y., Tokura Y., Nat. Commun. 2012, 3, 1308. [DOI] [PMC free article] [PubMed] [Google Scholar]
- 5. Krishnan K., Iwatsuki H., Hara M., Nagano S., Nagao Y., J. Mater. Chem. A 2014, 2, 6895–6903. [Google Scholar]
- 6.
- 6a. Bureekaew S., Horike S., Higuchi M., Mizuno M., Kawamura T., Tanaka D., Yanai N., Kitagawa S., Nat. Mater. 2009, 8, 831–6; [DOI] [PubMed] [Google Scholar]
- 6b. Bai Z., Liu S., Chen P., Cheng G., Wu G., Liu Y., Nanotechnology 2020, 31 125702; [DOI] [PubMed] [Google Scholar]
- 6c. Jankowska A., Zalewska A., Skalska A., Ostrowski A., Kowalak S., Chem. Commun. 2017, 53, 2475–2478; [DOI] [PubMed] [Google Scholar]
- 6d. Xu H., Tao S., Jiang D., Nat. Mater. 2016, 15, 722–726. [DOI] [PubMed] [Google Scholar]
- 7. Kawada A., McGhie A. R., Labes M. M., J. Chem. Phys. 1970, 52, 3121–3125. [Google Scholar]
- 8.
- 8a. Zhang F.-M., Dong L.-Z., Qin J.-S., Guan W., Liu J., Li S.-L., Lu M., Lan Y.-Q., Su Z.-M., Zhou H.-C., J. Am. Chem. Soc. 2017, 139, 6183–6189; [DOI] [PubMed] [Google Scholar]
- 8b. Ye Y., Zhang L., Peng Q., Wang G.-E., Shen Y., Li Z., Wang L., Ma X., Chen Q.-H., Zhang Z., Xiang S., J. Am. Chem. Soc. 2015, 137, 913–918. [DOI] [PubMed] [Google Scholar]
- 9.
- 9a. Kreuer K. D., Fuchs A., Ise M., Spaeth M., J. Mater. Electrochim. Acta 1993, 43, 1281; [Google Scholar]
- 9b. Iannuzzi M., J. Chem. Phys. 2006, 124, 204710; [DOI] [PubMed] [Google Scholar]
- 9c. Bu-ngern W., Chaiwongwattana S., Suwannakham P., Sagarik K., RSC Adv. 2016, 6, 99391–99403. [DOI] [PMC free article] [PubMed] [Google Scholar]
- 10. Chand S., Pal S. C., Pal A., Ye Y., Lin Q., Zhang Z., Xiang S., Das M. C., Chem. Eur. J. 2019, 25, 1691–1695. [DOI] [PubMed] [Google Scholar]
- 11. Hori Y., Chikai T., Ida T., Mizuno M., Phys. Chem. Chem. Phys. 2018, 20, 10311–10318. [DOI] [PubMed] [Google Scholar]
- 12. Bonneau C., O'Keeffe M., Acta Crystallogr. Sect. A 2015, 71, 82–91. [DOI] [PubMed] [Google Scholar]
- 13. Qin Y. Y., Zhang J., Li Z. J., Zhang L., Cao X. Y., Yao Y. G., Chem. Commun. 2008, 44, 2532–2534. [DOI] [PubMed] [Google Scholar]
- 14. Takashima Y., Bonneau C., Furukawa S., Kondo M., Matsuda R., Kitagawa S., Chem. Commun. 2010, 46, 4142–4144. [DOI] [PubMed] [Google Scholar]
- 15. Craven M., McMullan R. K., Bell J. D., Freeman H. C., Acta Crystallogr. Sect. B 1977, 33, 2585–2589. [Google Scholar]
- 16. Aili D., Gao Y., Han J., Li Q., Solid State Ionics 2017, 306, 13–19. [Google Scholar]
- 17. Drissi S. H., Refait P., Abdelmoula M., Génin J. M. R., Corros. Sci. 1995, 37, 2025–2041. [Google Scholar]
- 18. Kobayashi T., Yamada T., Tadokoro M., Kimizuka N., Chem. Eur. J. 2021, 27, 4287–4290. [DOI] [PubMed] [Google Scholar]
- 19.The optical isomers of Δ and Λ types have special structures of an OH formation, which are determined by the positions of N−H groups and N atoms with three HIm-Im− pairs in a diagonal direction.
- 20. Écija D., Urgel J. I., Papageorgiou A. C., Joshi S., Auwärter W., Seitosonen P., Klyatskaya S., Ruben M., Fischer S., Vijayaraghaven S., Reichert J., Barth J. V., Proc. Natl. Acad. Sci. USA 2013, 110, 6678–6681. [DOI] [PMC free article] [PubMed] [Google Scholar]
- 21. Psarras G. C. in Dielectric Polymer Materials for High-Density Energy Storage (Ed.: Dang Z. M.), Elsevier, New York, 2018, pp. 11–57. [Google Scholar]
- 22. Kumar M., Venkatnathan A., J. Phys. Chem. B 2015, 119, 3213–3222. [DOI] [PubMed] [Google Scholar]
- 23. GaussView3.0, Gaussian, Pittsburgh, PA.
- 24. Schuster M. F. H., Meyer W. H., Annu. Rev. Mater. Res. 2003, 33, 233–261. [Google Scholar]
- 25. Jannasch P., Curr. Opin. Colloid Interface Sci. 2003, 8, 96–102. [Google Scholar]
- 26. Bastos C. M., Gordon K. A., Ocain T. D., Bioorg. Med. Chem. Lett. 1998, 8, 147–150. [DOI] [PubMed] [Google Scholar]
Associated Data
This section collects any data citations, data availability statements, or supplementary materials included in this article.
Supplementary Materials
As a service to our authors and readers, this journal provides supporting information supplied by the authors. Such materials are peer reviewed and may be re‐organized for online delivery, but are not copy‐edited or typeset. Technical support issues arising from supporting information (other than missing files) should be addressed to the authors.
Supporting Information


