

Abstract
The purpose of this study was to assess how severe acute hypoxia alters the neural mechanisms of muscle activation across a wide range of torque output in a fatigued muscle. Torque and electromyography responses to transcranial and motor nerve stimulation were collected from 10 participants (27 years ± 5 years, 1 female) following repeated performance of a sustained maximal voluntary contraction that reduced torque to 60% of the pre‐fatigue peak torque. Contractions were performed after 2 h of hypoxic exposure and during a sham intervention. For hypoxia, peripheral blood oxygen saturation was titrated to 80% over a 15‐min period and remained at 80% for 2 h. Maximal voluntary torque, electromyography root mean square, voluntary activation and corticospinal excitability (motor evoked potential area) and inhibition (silent period duration) were then assessed at 100%, 90%, 80%, 70%, 50% and 25% of the target force corresponding to the fatigued maximal voluntary contraction. No hypoxia‐related effects were identified for voluntary activation elicited during motor nerve stimulation. However, during measurements elicited at the level of the motor cortex, voluntary activation was reduced at each torque output considered (P = .002, η p 2 = .829). Hypoxia did not impact the correlative linear relationship between cortical voluntary activation and contraction intensity or the correlative curvilinear relationship between motor nerve voluntary activation and contraction intensity. No other hypoxia‐related effects were identified for other neuromuscular variables. Acute severe hypoxia significantly impairs the ability of the motor cortex to voluntarily activate fatigued muscle across a wide range of torque output.
Keywords: corticospinal excitability, exercise, fatigue, hypoxemia, transcranial magnetic stimulation
Ten participants were exposed to a sham condition and a hypoxia condition (80% peripheral blood oxygen saturation) for 2 h. Transcranial magnetic stimulation (TMS) and motor nerve stimulation (MNS) were employed following fatiguing maximal elbow flexion contractions. Voluntary activation (VA) assessed with TMS was significantly reduced in hypoxia, while VA assessed with MNS remained unaffected.

Abbreviations
- AMS
acute mountain sickness
- BPS
brachial plexus stimulation
- EMG
electromyography
- EMGRMS
root‐mean‐square of the EMG
- FIO2
fraction of inspired oxygen
- GABA
gamma‐aminobutyric acid
- MEP
motor evoked potential
- Mmax
maximal compound action potential
- MNS
motor nerve stimulation
- MVC
maximal voluntary contraction
- SpO2
peripheral blood oxygen saturation
- TMS
transcranial magnetic stimulation
- VA
voluntary activation
1. INTRODUCTION
During exposure to low‐oxygen environments, exercise performance is disrupted across a range of contraction tasks and exercise modalities. A converging line of evidence indicates that several factors underlie the likelihood that a decline in motor performance occurs during acute hypoxia. These factors include the duration of hypoxic exposure, where short exposures up to 1 h have minimal effects on performance (Katayama et al., 2007; Rupp et al., 2012, 2015; Soo et al., 2020; Szubski et al., 2006), and the severity of hypoxic stimulus, where <80% peripheral blood oxygen saturation (SpO2) is more likely to affect performance due to cerebral hypoxia and disruptions in neurotransmitter turnover (Amann et al., 2007; Gibson & Duffy, 1981; Koob & Annau, 1974; Olson et al., 1983). As the progressive reduction in exercise performance is a consequence of limited oxygen availability to meet energy demand (Lannergren & Westerblad, 1991), it is not surprising that hypoxia‐related impairments in voluntary activation (VA) are particularly evident during prolonged or exhaustive exercise (Amann et al., 2013; Goodall et al., 2012, 2010; McKeown et al., 2021; O'Keeffe et al., 2021; Rasmussen et al., 2010; Ruggiero et al., 2018).
Prolonged or exhaustive exercise often leads to accumulation of metabolites within contracting muscles, which causes increased firing of group III/IV muscle afferents and a subsequent decrease in output from cortical motoneurons (Adreani et al., 1997; Amann et al., 2011; Balzamo et al., 1992; Gandevia, 1998; Kaufman et al., 1983). When exposed to a hypoxic stimulus, discharge of group III/IV muscle afferents is enhanced because of an accentuated development of metabolites, resulting in further inhibition of cortical neurons (Amann, Romer, et al., 2006; Katayama et al., 2007). Although hypoxic‐induced changes in the muscle can impair the output of cortical motoneurones, there is also a direct impact of hypoxic exposure on corticospinal excitability. Specifically, motor evoked potentials (MEPs) from upper and lower limb musculature, and the minimal transcranial magnetic stimulation (TMS) input needed to elicit a MEP response (i.e., the motor threshold), have been shown to change during sustained and intermittent exercise in acute hypoxic environments compared to normoxic environments (Goodall et al., 2012; McKeown et al., 2020; Miscio et al., 2009; Rupp et al., 2012). Increases in the excitability of the corticospinal pathway are likely due to changes in cortical ion‐channel properties, gamma‐aminobutyric acidergic (GABA) transmission and suboptimal output from the motor cortex because of substantial cerebral hypoxia (Goodall et al., 2012; McKeown et al., 2020; Miscio et al., 2009; Szubski et al., 2006).
The assessment of VA using both motor nerve stimulation (MNS) and TMS allows further investigation of supraspinal and spinal components of fatigue development (Gandevia et al., 1996; Sogaard et al., 2006; Todd et al., 2007, 2003). Previously, the relationship between VA and contraction intensity has been assessed across a wide range of torque output in the unfatigued and fatigued elbow flexors (Todd et al., 2003). During measures of VA from the cortex, a strong linear relationship exists, where incremental increases in voluntary torque result in corresponding increases of VA above 50% maximal voluntary contraction (MVC). However, during measures of elbow flexor VA from the motor nerve, a curvilinear relationship exists where, at high torques, smaller increases in activation occur (De Serres & Enoka, 1998; Todd et al., 2003). This is possibly due to unmatched activation of brachioradialis motor units (radial nerve) compared to biceps brachii and brachialis motor units (musculocutaneous nerve) during MNS. Furthermore, this difference may be due to motor unit activation occurring synaptically versus axonally with TMS and MNS, respectively. Nonetheless, the linear and curvilinear relationships between VA and contraction intensity are retained in the fatigued muscle, albeit with reduced VA and torque generation capacity due to fatigue. With respect to low‐oxygen environments, hypoxia‐induced impairments in VA during maximal contractions are consistently reported. Furthermore, reductions in TMS measures of VA specifically, indicate that the locus of hypoxia‐induced impairment in neuromuscular activation is, in part, due to impaired cortical neural drive to spinal motoneurones (Goodall et al., 2010; McKeown et al., 2020; O'Keeffe et al., 2021; Ruggiero et al., 2018; Rupp et al., 2012). However, it is unclear how hypoxia impairs VA at submaximal intensities or whether the relationship between VA and contraction intensity is altered with reduced oxygen availability.
The purpose of this study was to assess the post‐fatigue ability to activate muscle in the presence of severe acute hypoxia. After 2 h of exposure to a low fraction of inspired oxygen (FIO2) that decreased SpO2 to 80%, participants repeatedly performed a sustained elbow flexor MVC until a standardised level of fatigue was achieved (a decline in torque to 60% of the peak control value). After each fatigue‐inducing MVC, TMS and MNS were used to assess the ability of the central nervous system to voluntarily activate the elbow flexors across a wide range of torque output. It was hypothesised that hypoxia‐induced impairments in VA would be most evident during higher torques when neural drive to the contracting muscle is largest, and these hypoxia‐related effects would be absent at lower intensities when neural drive is low. Therefore, the VA and contraction intensity relationships would be disrupted. It was also hypothesised that supraspinal mechanisms would be primarily responsible for any hypoxia‐related reductions in VA following the fatiguing contractions.
2. MATERIALS AND METHODS
2.1. Ethics statement
Each participant provided written informed consent prior to testing. All experimental procedures were approved by the Griffith University Human Research Ethics Committee (reference number: 2018/838). The study conformed to the standards set by the Declaration of Helsinki, except for registration in a database.
2.2. Experiment design
This study was a two‐way, sham‐controlled, cross‐over design, where participants attended two testing sessions separated by 1 week. A single‐blind design was necessary as an investigator was required to monitor SpO2 throughout each testing session. The intervention was counterbalanced to avoid order effects, where half of the participants underwent a hypoxia intervention in their first visit, and the other half of participants underwent a sham intervention in their first session.
2.3. Participants
Ten healthy individuals volunteered to participate in the study (Table 1). Each participant completed a medical history questionnaire prior to their first testing session, which contained exclusion criteria specific to reduced blood oxygen saturation, magnetic stimulation and electrical stimulation. Participants were also screened to ensure they had not been exposed to acute or chronic hypoxic environments for at least 6 months leading up to the study. Participants were not permitted to take any form of central nervous system medications and were instructed to refrain from any form of stimulant or depressant such as caffeine, alcohol or moderate‐to‐high intensity exercise for 12 h before testing.
TABLE 1.
Participant characteristics
| Variable | |
|---|---|
| Number of participants | 9 male and 1 female |
| Age (years) | 27.7 ± 5.1 |
| Age range (years) | 20–36 |
| Height (cm) | 180.1 ± 7.3 |
| Weight (kg) | 83.1 ± 13.1 |
| BMI | 25.4 ± 3.1 |
| Lever arm (cm) | 25.1 ± 1.7 |
| Handedness | Right |
2.4. Hypoxia intervention
An altitude simulator (Altitude Training Systems, ATS200HP, Australia) and a sealed facemask were used to reduce SpO2 to 80% via regulation of the FIO2. As sensitivity to altered oxygen availability is variable between individuals (Rojas‐Camayo et al., 2018), FIO2 was titrated over a 15 min period for everyone at a rate of .01 FIO2 every 1.5 min. The FIO2 that consequently resulted in 80% SpO2 was maintained for the 2‐h experimental protocol (.125 ± .011 FIO2 by the end of the titration phase). SpO2 and heart rate were continuously monitored using a pulse oximeter (Model 7500, Nonin Medical Inc, Minnesota, USA) attached to the middle finger of the non‐active hand. Participants were carefully monitored for symptoms of acute mountain sickness (AMS) throughout testing, including dizziness, headaches, sleepiness and nausea. The sham intervention reflected all hypoxia testing procedures, including the requirement of wearing the mask; however, SpO2 was not manipulated and remained at pre‐testing levels.
2.5. Electromyography and torque measurements
Participants sat in a chair with their right wrist secured in a custom‐built transducer to measure isometric elbow flexion torque (Figure 1a). The shoulder and elbow were placed in 90° of flexion and the participant's arm was fixed to the device at the wrist (Kavanagh et al., 2019). A precision S‐beam load cell (PT4000, PT Ltd, New Zealand) with a 1.1‐kN range and full‐scale output of 3 mV/V was used to measure elbow flexion force, which was later converted to torque offline. Surface electromyography (EMG) was recorded from the biceps brachii and triceps brachii by attaching circular 24‐mm Ag/AgCl electrodes (Kendall Arbo) in a muscle belly‐muscle tendon arrangement (60‐mm inter‐electrode distance). A ground electrode was placed on the acromion of the test limb. Torque and EMG signals were sampled at 2000 Hz using a 16‐bit analog‐to‐digital converter (CED 1401; Cambridge Electronic Design, UK). Torque signals remained unfiltered, whereas EMG signals were amplified (×300) and bandpass filtered (10–1000 Hz) using a CED 1902 amplifier (Cambridge Electronic Design, UK).
FIGURE 1.
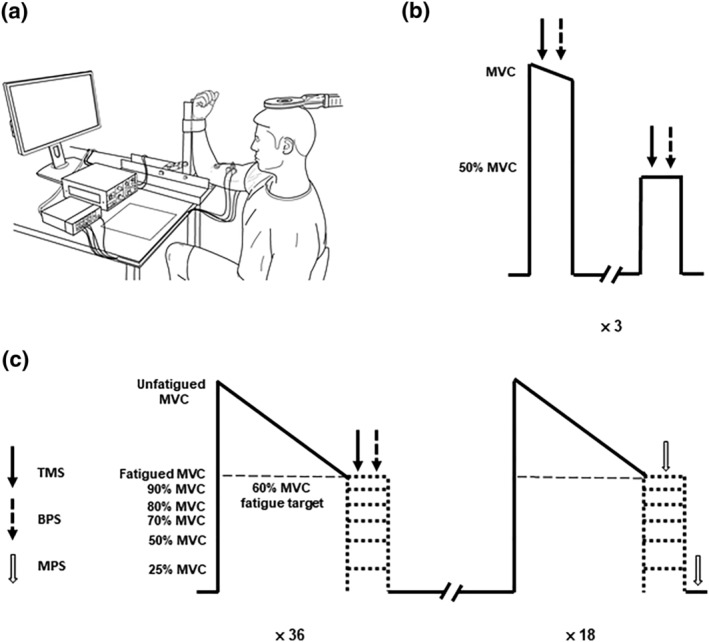
Participant set up (a), control contraction protocol (b) and the fatigue protocol (c). Participants sat in a custom‐built transducer with their right arm secured to measure isometric elbow flexion torque (a). After a 2‐h exposure to hypoxia or sham, the control contraction protocol was performed. The peak maximal voluntary contraction (MVC) torque determined in the control contractions was used to calculate the fatigue target of 60% peak torque (b). Participants performed sets of contractions that each involved a sustained maximal elbow flexion to a fatigue target. Participants immediately received transcranial magnetic (TMS) and brachial plexus stimulations (BPS) or motor nerve stimulations (MNS) at 100%, 90%, 80%, 70%, 50% and 25% of the fatigue target in a randomised order to assess corticospinal and peripheral excitability as well as voluntary activation. Thirty‐six contractions were performed where TMS and BPS stimulation was received, and 18 contractions were performed where MNS stimulation was received, for a total of 54 contractions performed by the participants (c).
2.6. Cortical stimulation
A Magstim 2002 TMS unit with a 90‐mm circular coil (Magstim Co., UK) positioned over the vertex was used to elicit MEPs in the biceps brachii and triceps brachii. The coil was positioned to preferentially activate the left motor cortex projecting to the participant's right arm. The stimulator intensity which elicited the highest elbow flexor twitch torque during a brief isometric MVC, with a MEP that was greater than 60% of the biceps brachii maximal compound action potential (Mmax) and less than 20% of the triceps brachii Mmax (Todd et al., 2003), was chosen as the optimal stimulus intensity for each testing session (70%–75% stimulus output). This ensured that the TMS pulse activated a large proportion of the biceps brachii motoneurone pool while minimising activation of the antagonist motoneurone pool, triceps brachii, during maximal and submaximal elbow flexions (Todd et al., 2016). As this was primarily a twitch study, the stimulator output that elicited the largest twitch response of the elbow flexors took precedence.
2.7. Brachial plexus stimulation
A constant current stimulator (DS7AH, Digitimer, Ltd., UK) was used to deliver single electrical pulses of 100 μs to the brachial plexus at Erb's point to determine the Mmax of the biceps brachii and triceps brachii. A surface anode was positioned over the acromion of the right limb. Optimal positioning of the cathode over the right supraclavicular fossa was determined using a MNS pen (stimulus intensity of 20 mA), before a surface cathode was affixed to the skin. Stimulus intensity for experimental testing was determined by progressively increasing the stimulator current until the Mmax of both the biceps brachii and triceps brachii was reached. The stimulator intensity was then set at 130% of the current that elicited the Mmax in both the biceps brachii and the triceps brachii (sham protocol: 149 ± 29 mA, 119–208 mA; hypoxia protocol 144 ± 21 mA, 119–182 mA). Stimulator intensity was not different between the sham and hypoxia protocols (P = .340).
2.8. Motor nerve stimulation
Intramuscular nerve fibres of the biceps brachii were stimulated with single supramaximal pulses of 100‐μs duration via a second constant current stimulator (DS7AH, Digitimer Ltd., UK). Following placement of the EMG electrodes, a surface anode was positioned over the distal biceps brachii tendon, and a surface cathode was positioned over the muscle belly of the biceps brachii. Optimal positioning of the surface cathode was determined by using a MNS pen (stimulus intensity of 50 mA) and was based on the location that elicited the highest elbow flexion twitch torque. Maximal resting twitch was determined by progressively increasing the stimulator current until there was no longer an increase in the elicited elbow flexor twitch torque. Stimulus intensity was then set at 120% of the current that elicited the maximal resting twitch (sham protocol: 172 ± 59 mA, 84–288 mA; hypoxia protocol: 168 ± 57 mA, 84–288 mA). Stimulus intensity was not different between the sham and hypoxia protocols (P = .607).
2.9. Experimental procedures
Participants visited the laboratory on two occasions, where they were exposed to either a sham or hypoxia intervention that titrated SpO2 to 80% over a 15 min period. Once the target SpO2 was reached, participants were required to rest under hypoxic conditions for a 2‐h duration prior to control contractions being performed (McKeown et al., 2021, 2020). Control TMS and MNS measures were obtained from each individual when performing three pairs of a brief MVC, followed by a brief 50% MVC (Figure 1b). The MVC with the largest peak torque was used to calculate the fatigued MVC target (60% of the control MVC) as well as the submaximal intensity targets.
The fatigue protocol consisted of performing sustained maximal elbow flexion contractions to a target of 60% of the control peak MVC torque (fatigued MVC; Figure 1c). Once participants could not maintain torque above 60% of their control MVC for more than 3 s, they received stimulation (fatigued MVC) or were instructed to reduce their torque to the target corresponding to 90%, 80%, 70%, 50% or 25% of the fatigued MVC for 4 s. Following each contraction, participants were instructed to rest for a maximum duration of 2 min before performing the next contraction. If participants were unable to maintain a torque output greater than 60% MVC for at least 10 s, a longer rest period was given. TMS and brachial plexus stimulations (BPS), as well as MNS, were delivered at each target torque. For contractions with TMS and BPS, a magnetic stimulus was delivered to the motor cortex once participants had reached the target intensity which was then followed by BPS 2‐s later. For contractions with MNS, electrical stimuli were delivered to the motor nerve once participants had reached the target intensity then at rest 4 s later. A total of six TMS and BPS, and three MNS stimulation responses were collected at each contraction intensity for each participant. Target torques were performed in a randomised order, but each participant performed the 54 contractions in the same order in their sham and hypoxia session.
2.10. Data analysis
All torque and electrophysiology data were analysed offline using Spike2 (version 7.02, Cambridge Electronic Design) to assess the individual responses of each contraction prior to ensemble averaging. Average raw traces were created for each contraction intensity and type (i.e., TMS and BPS vs. MNS) using Signal (version 6.05, Cambridge Electronic Design). The average raw trace torque and electrophysiology data were then analysed offline using Signal. The amplitude of MVC torque and root mean square of the EMG (EMGRMS) of the biceps brachii were calculated during a 200‐ms window before the stimulus artefact. MNS superimposed and resting twitches were calculated from the increase in torque following electrical stimulation to assess motor nerve level of VA (Merton, 1954). TMS superimposed twitches were also calculated from the increase in torque following stimulation to assess cortical level of VA (Todd et al., 2003); however, the estimated resting twitch was determined as the y‐intercept of the linear regression of the amplitude of the ensemble‐averaged TMS‐evoked superimposed twitch at 100% and 50% MVC (control contractions) or 100%, 90%, 80%, 70% and 50% of the fatigued MVC (fatigued contractions). Twitch responses at 25% of the fatigued MVC torque were not included due to non‐linearity in responses <50% MVC (Todd et al., 2003). For the fatigued contractions, R 2 values of the regression ranged from .90–1.00. The level of VA was then calculated for MNS as [1 – (superimposed twitch/resting twitch)] × 100, and for TMS as [1 – (superimposed twitch/estimated resting twitch)] × 100. MEP area was measured after each TMS pulse and then normalised to the area of the Mmax elicited 2 s later, to account for activity‐dependent changes in muscle fibre action potentials. Silent period duration was the time from the delivery of the TMS pulse (EMG stimulus artefact) to the continuous recommencement of voluntary EMG, which was verified by visual inspection by a single examiner to avoid inter‐examiner variability.
2.11. Statistical analysis
Normality of data was assessed using Shapiro–Wilk tests. Greenhouse–Geisser corrections were applied when assumptions of sphericity were violated. Possible differences between conditions for control 100% and 50% MVC torque, EMG measurements and time‐to‐fatigue of the first sustained MVC were assessed using Student's paired t tests. Two‐way repeated measures ANOVAs were employed to examine main effects of condition (hypoxia vs sham) and contraction intensity (100%, 90%, 80%, 70%, 50%, and of the fatigued MVC). Condition by contraction intensity interaction effects were also evaluated. Cortical measures of superimposed twitch torque and VA elicited via TMS during 25% of the fatigued MVC were excluded during statistical analysis due to the non‐linearity of responses at contraction intensities <50% MVC (Todd et al., 2003). All statistical procedures were performed using IBM SPSS Statistics (version 27; IBM Australia Ltd, Australia) with α levels set at <.05. Effect sizes are presented as partial eta‐squared values (η p 2 ). Data in tables are presented as group means and standard deviation of the mean. Figures are presented as individual responses overlayed with group means and error bars representing the standard deviation of the mean.
3. RESULTS
3.1. Control neuromuscular function
Prior to commencing the fatigue protocol, neuromuscular function was assessed in the unfatigued muscle during a brief MVC and 50% MVC following 2 h of sham and acute hypoxia (Table 2) to provide an indication of control measurements. No significant hypoxia‐related differences were identified for unfatigued measurements (P > .05), apart from the biceps brachii silent period duration where the hypoxic stimulus significantly shortened the silent period at 50% MVC (P = .02).
TABLE 2.
Control neuromuscular measures for the unfatigued muscle following 2 h of sham or hypoxic exposure (80% SpO2)
| Sham | Hypoxia | P value | |
|---|---|---|---|
| Control MVC | |||
| Elbow flexion torque (N·m) | 81.02 ± 15.19 | 81.59 ± 15.16 | .63 |
| Biceps brachii EMGRMS (% Mmax) | 60.22 ± 16.73 | 54.31 ± 18.28 | .31 |
| Triceps brachii EMGRMS (% Mmax) | 6.93 ± 4.25 | 7.71 ± 4.10 | .49 |
| Motor cortical superimposed twitch torque (N·m) | .72 ± .43 | .86 ± .64 | .43 |
| Motor cortical estimated resting twitch torque (N·m) | 17.51 ± 7.92 | 16.97 ± 5.76 | .77 |
| Motor cortical level of voluntary activation (%) | 94.93 ± 4.54 | 94.71 ± 3.65 | .90 |
| Biceps brachii MEP area (% Mmax) | 75.18 ± 10.97 | 72.45 ± 12.30 | .49 |
| Triceps brachii MEP area (% Mmax) | 9.79 ± 6.90 | 7.88 ± 4.40 | .16 |
| Biceps brachii silent period (ms) | 123 ± 55 | 124 ± 53 | .87 |
| Control 50% MVC | |||
| Elbow flexion torque (N·m) | 39.33 ± 6.39 | 39.78 ± 4.18 | .72 |
| Biceps brachii EMGRMS (% Mmax) | 9.00 ± 4.36 | 8.79 ± 6.56 | .94 |
| Triceps brachii EMGRMS (% Mmax) | 2.58 ± 1.79 | 3.55 ± 3.66 | .51 |
| TMS‐elicited superimposed twitch torque (N·m) | 9.36 ± 4.13 | 8.76 ± 3.30 | .49 |
| Biceps brachii MEP area (% Mmax) | 91.06 ± 14.22 | 86.06 ± 19.70 | .35 |
| Triceps brachii MEP area (% Mmax) | 8.78 ± 6.51 | 9.09 ± 7.33 | .97 |
| Biceps brachii silent period (ms) | 172 ± 60 | 158 ± 59* | .02 |
Note: Measures of motor cortical estimated resting twitch torque are derived from twitch response to TMS at 100% and 50% MVC. Asterisk indicates significant difference compared to sham measures. Electromyography root‐mean‐square, EMGRMS; maximal voluntary contraction, MVC; maximal compound action potential, Mmax; motor evoked potential, MEP; peripheral blood oxygen saturation, SpO2; transcranial magnetic stimulation, TMS. Data are presented as mean ± SD (n = 10).
3.2. Fatigued elbow flexion torque output and EMGRMS
During the initial sustained MVC of the fatigue protocol, participants fatigued at a greater rate during hypoxia compared to sham. This was indicated by a shorter time‐to‐fatigue during hypoxia (32 ± 14 s) compared to sham (40 ± 12 s; P = .02). Elbow flexion torque and EMGRMS of the biceps and triceps brachii were assessed at 100%, 90%, 80%, 70%, 50% and 25% of the fatigued MVC during the sham and hypoxic conditions. No main effect of condition (P = .272, η p 2 = .196) or condition × contraction intensity interaction (P = .097, η p 2 = .256) was detected for elbow flexion torque (Figure 2a). For biceps brachii EMGRMS, no main effect of condition (P = .238, η p 2 = .223) or condition × contraction intensity interaction (P = .346, η p 2 = .164) was detected. As expected with a wide range of elbow flexion torques, a main effect of contraction intensity was detected (F [1.142, 6.849] = 23.435, P = .002, η p 2 = .796; Figure 2b). No main effect of condition (P = .316, η p 2 = .166) or condition × contraction intensity interaction (P = .452, η p 2 = .139) was detected for triceps brachii EMGRMS. However, a main effect of contraction intensity was detected (F [1.375, 8.251] = 41.313, P < .001, η p 2 = .873; Figure 2b).
FIGURE 2.

Elbow flexion voluntary torque (a) and biceps brachii and triceps brachii EMGRMS (b) during sham and hypoxia. Elbow flexion torque and EMGRMS data prior to the fatigue protocol (triangles) and following the fatigue protocol (circles). A main effect of contraction intensity was detected for elbow flexion torque (P < .001), biceps brachii EMGRMS (P = .002) and triceps brachii EMGRMS (P < .001). Solid symbols represent the group mean and error bars represent the standard deviation of the mean (n = 10). Individual data are presented as open symbols.
3.3. Voluntary activation assessed via motor cortical stimulation
After performing the sustained fatiguing contraction, magnetic stimulation of the motor cortex elicited larger superimposed twitches in the fatigued muscle compared to the unfatigued muscle (Figure 3), indicating that voluntary output from the motor cortex was reduced. However, fatigue did not impact the linear relationship of twitch responses >50% fatigued MVC torque in either the sham or hypoxia conditions. Specifically, there was no main effect of condition (P = .512, η p 2 = .750) or condition × contraction intensity interaction (P = .196, η p 2 = .215) for TMS‐evoked superimposed twitch amplitude at >50% fatigued MVC. A significant hypoxia‐related difference was observed for the fatigued estimated resting twitch (P = .007; Figure 4b) where the estimated resting twitch during hypoxia condition was lower than the sham condition. A main effect of condition was detected for VA at >50% fatigued MVC (F [1, 6] = 29.190, P = .002, η p 2 = .829; Figure 4c), where VA during hypoxia was lower than sham. No condition × contraction intensity interaction (P = .623, η p 2 = .100) was detected.
FIGURE 3.

Post‐fatigue twitch responses to transcranial magnetic stimulation (TMS) and motor nerve stimulation (MNS) during sham and hypoxia. Ensemble average of elbow flexion twitch torque for a single participant are presented for TMS and MNS at 100% (a), 90% (b), 80% (c), 70% (d), 50% (e) and 25% of the fatigued maximal voluntary contraction (MVC). Resting twitch (RT) is also presented for MNS during the sham and hypoxia condition.
FIGURE 4.

Superimposed twitch torque (a), estimated resting twitch torque (b) and voluntary activation (VA; c) assessed via motor cortical stimulation. (a) Superimposed twitches prior to the fatigue protocol (triangles) and following the fatigue protocol (circles). Twitch responses at 25% maximal voluntary contraction (MVC) torque were not included in calculation of the estimated resting twitch due to the non‐linearity in responses <50% MVC. (b) Although not different prior to fatigue, the estimated resting twitch of the fatigued muscle was significantly lower in hypoxia compared to the sham condition (P = .007). (c) Although not different prior to fatigue, a main effect of condition was detected for VA, where >50% VA measured in hypoxia was lower than VA measured in the sham condition (P = .002; hash represents the condition main effect). Solid symbols represent the group mean and error bars represent the standard deviation of the mean (n = 10). Individual data are presented as open symbols. Dotted line is the line of identity.
3.4. Voluntary activation assessed via motor nerve stimulation
When superimposed twitches are elicited from stimulation of the motor nerve, the degree of suboptimal output from the motoneurone pool can be determined. Like TMS‐elicited twitches, the (curvilinear) relationship that characterises twitch responses from MNS was not altered by fatigue during both conditions (Figure 3). No main effect of condition (P = .561, η p 2 = .091) or condition × contraction intensity interaction (P = .237, η p 2 = .271) was detected for superimposed twitch. Further, no main effect of condition (P = .753, η p 2 = .022), contraction intensity (P = .225, η p 2 = .231) or condition × contraction intensity interaction (P = .067, η p 2 = .323) was detected for resting twitch (Figure 5b). In accordance with the superimposed and resting twitch data, no main effect of condition (P = .361, η p 2 = .278) or condition × contraction intensity interaction (P = .341, η p 2 = .292) was detected for VA.
FIGURE 5.
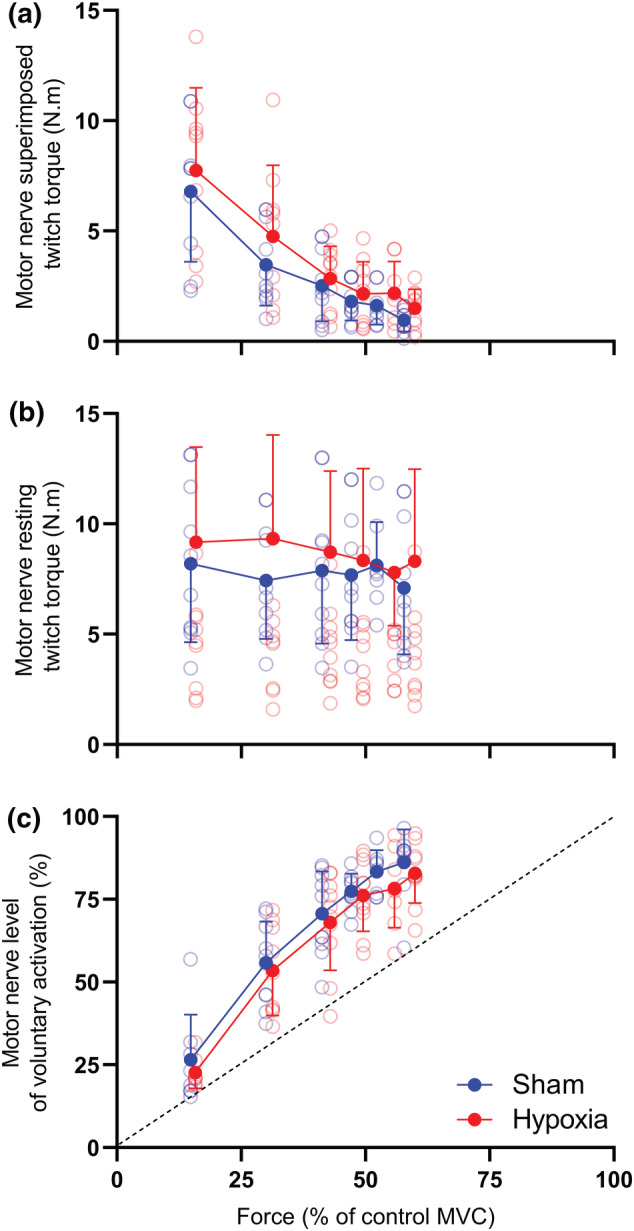
Superimposed twitch torque (a), resting twitch torque (b) and voluntary activation (c) assessed via motor nerve stimulation of the biceps brachii. (a) Superimposed and (b) resting twitches prior to the fatigue protocol (triangles) and following the fatigue protocol (circles). (c) The resultant voluntary activation (VA) was then calculated. Solid symbols represent the group mean and error bars represent the standard deviation of the mean (n = 10). Individual data are presented as open symbols. Dotted line is the line of identity.
3.5. Corticospinal and peripheral excitability
EMG responses to motor nerve and motor cortical stimulation were collected across a wide range of torque output in the fatigued muscle (Figure 6). When exposed to the acute hypoxic stimulus, fatigue‐related changes in MEP area, Mmax area, and silent period duration were not different compared to the sham condition. That is, there was no main effect of condition (P = .974, η p 2 = .001) or condition × contraction intensity interaction (P = .612, η p 2 = .108) for biceps brachii MEP area (Figure 7a). Further, no main effect of condition (P = .866, η p 2 = .006), contraction intensity (P = .478, η p 2 = .157) or condition × contraction intensity interaction (P = .237, η p 2 = .262) was detected for triceps brachii MEP area. Biceps brachii Mmax area had no main effect of condition (P = .555, η p 2 = .061), contraction intensity (P = .374, η p 2 = .155), or condition × contraction intensity interaction (P = .547, η p 2 = .106; Figure 7b). Finally, there was no main effect of condition (P = .278, η p 2 = .192) or condition × contraction intensity interaction (P = .238, η p 2 = .194) was detected for biceps brachii silent period duration (Figure 7c).
FIGURE 6.

Electromyography (EMG) responses during sham (a) and hypoxia (b) elicited from electrical and magnetic stimulation. Responses from a single participant are presented for electrical stimulation of the brachial plexus (maximal compound action potential, Mmax) and magnetic stimulation of the motor cortex (biceps and triceps motor evoked potentials, MEP) in the fatigued muscle.
FIGURE 7.

Responses of the corticospinal pathway to motor cortical stimulation. Measures of corticospinal excitability (a), peripheral excitability (b) and corticospinal inhibition (c) prior to the fatigue protocol (triangles) and following the fatigue protocol (circles). Solid symbols represent the group mean and error bars represent the standard deviation of the mean (n = 10).
4. DISCUSSION
The purpose of this study was to assess the post‐fatigue ability to activate muscle in the presence of severe acute hypoxia. After 2 h of exposure to 80% SpO2, participants performed sustained maximal isometric elbow flexions until a standardised level of fatigue was achieved. Measurements of VA as well as corticospinal and peripheral excitability were then made across a wide range of torques. Our main findings were (1) acute hypoxia did not adversely affect the maximal torque generating capacity, or the control VA, of the elbow flexors, (2) acute hypoxia reduced VA of the fatigued elbow flexors measured from twitches elicited during TMS of the motor cortex across all contraction intensities and (3) acute hypoxia did not adversely affect corticospinal excitability (MEP area), inhibition (silent period duration) or peripheral excitability (Mmax area), after fatiguing contractions.
4.1. Elbow flexion torque and surface EMG was unaffected by acute hypoxia
During prolonged exercise, the torque generating capacity of a muscle decreases as central and peripheral fatigue develops, in a manner dependent upon the intensity and duration of contraction (Burnley et al., 2012; Eichelberger & Bilodeau, 2007; Marshall et al., 2021; Yoon et al., 2007). As absolute torque output differs between participants and can influence the time‐course of fatigue‐induced changes in the motor system, we normalised the level of fatigue to a predetermined target of 60% MVC torque. During brief MVCs prior to the fatigue protocol, peak torque was not different between conditions, which means that the torque outputs of fatigued contractions were also not different for the hypoxia and sham sessions. With exposure to hypoxia, the time taken to reach the 60% MVC fatigue target during the initial sustained MVC of the fatigue protocol was significantly shorter compared to sham. This indicates that hypoxia enhanced the rate of fatigue development. When performing sustained isometric MVC, the ability to delivery blood to exercising muscle is impaired by the opposing increase in intramuscular pressure (Degens et al., 1998; Wigmore et al., 2004). In turn, localised muscular ischaemia occurs, which increases firing of metabosensitive III/IV afferents, leading to reduced upper motoneuronal output, muscle contractility and consequently torque production (Taylor et al., 2000). During the hypoxia condition, reduced oxygen availability would have exacerbated the impact of muscle ischaemia occurring during the sustained MVC (Fulco et al., 1996; Hogan, Kohin, et al., 1999), resulting in a greater rate of decline in torque production compared to the sham condition. In line with our previous findings and those of others, during a fatigued state, we observed hypoxia‐related reductions in VA assessed by TMS, without a corresponding effect of hypoxia on maximal torque output (Goodall et al., 2012; McKeown et al., 2021, 2020). Maintenance of the torque generating capacity of a muscle has been linked to potential increases in adrenergic activity that leads to widespread modulatory effects on cortical circuits (Chandler et al., 2014), facilitation of persistent inward currents at motoneurone dendrites (Lee & Heckman, 1999, 2000) and increased motoneurone acetylcholine release (Young et al., 1980). However, as M‐wave responses were not impaired, adrenergic neuromodulation seems unlikely (Goodall et al., 2010; Ruggiero et al., 2018; Szubski et al., 2007; Young et al., 1980).
During sustained maximal fatiguing contractions, there is a progressive reduction in EMGRMS as descending drive to spinal motoneurones decreases, resulting in reduced motoneurone firing rate (Kukulka et al., 1986; Moritani et al., 1985). In the current study, sham and hypoxia EMGRMS was similarly reduced compared to control measurements after the fatigue‐inducing contractions. This provides indirect evidence that the recruitment and firing of motor unit populations were not affected by hypoxia after performing sustained maximal fatiguing contractions. Greater fatigue‐related reductions in EMG activity have been documented during sustained and exhaustive contractions performed in acute hypoxia, compared to normoxia (Amann et al., 2007; Fulco et al., 1996; McKeown et al., 2020; Millet et al., 2012). However, the majority of findings indicate that acute hypoxia has a minimal impact on EMG activity during both maximal and submaximal contraction tasks (Amann, Eldridge, et al., 2006; Dousset et al., 2001; Goodall et al., 2010; Katayama et al., 2010; Millet et al., 2009; Millet et al., 2012; Soo et al., 2020). The maintained EMG activity (and muscle torque) in the presence of a hypoxia‐induced reduction in descending drive may be explained by motoneuronal facilitation, as group III/IV muscle afferent feedback has been shown to increase the size of cervicomedullary motor evoked potential for biceps brachii and brachioradialis (Martin et al., 2006). With lower oxygen availability during hypoxia, there was an increased rate of fatigue development, which has been linked to greater metabolite accumulation (Hogan, Richardson, & Haseler, 1999). This would lead to greater activation of group III/IV muscle afferents during hypoxia and the possibility that motoneurone facilitation mitigates the impact of reduced descending cortical drive to motoneurone pools.
4.2. Motor cortical, but not motor nerve, measures of VA were reduced during acute hypoxia
VA can be assessed using both electrical stimulation of the motor nerve and magnetic stimulation of the cortex (Gandevia et al., 1996; Sogaard et al., 2006; Taylor et al., 2000; Todd et al., 2003). With the introduction of an acute severe hypoxic stimulus, cortical measures of VA were impaired, whereas there were no changes to MNS measures across all contraction intensities. This suggests that the fatigue‐related failure of supraspinal circuits to produce motor cortical drive to activate motor units of the elbow flexors is exacerbated during hypoxia. Furthermore, it is likely the locus of this disruption is due to reductions in descending neural drive from motor cortical circuits (indicated by a reduced cortical VA but no change to MNS VA or EMGRMS). In addition, the relationships of contraction intensity to TMS VA (linear) and MNS VA (curvilinear) identified by Todd et al. (2003) were also seen during the current study. This indicates that the relationship of elbow flexor muscle activation is maintained in the presence of acute hypoxia.
Reductions in VA have been consistently reported during and following fatiguing exercise in hypoxia (Amann et al., 2013; Goodall et al., 2012, 2014; McKeown et al., 2021; Rasmussen et al., 2010; Ruggiero et al., 2018). However, one hypoxia study has used TMS and MNS concurrently to assess VA during acute hypoxia (Goodall et al., 2012). Similar to the findings of the current study, Goodall et al. (2012) documented hypoxia‐induced (.13 FIO2) reductions in cortical measures of VA in the quadriceps following constant‐load cycling at 80% of maximal work rate performed to exhaustion. However, these reductions were not reflected in motor nerve assessments of VA. Additionally, the decline of cortical VA occurred in parallel with reductions in cerebral oxygen delivery and oxygenation leading to cerebral hypoxia. Severe exposures of hypoxia exacerbate cortical reductions in oxygen availability and increase group III and IV afferent feedback from fatiguing respiratory and exercising muscle (Amann et al., 2007; Balzamo et al., 1992; Hill et al., 1992). As such, the decline in cortical VA observed in this study is likely due to disruptions in motor cortical output brought about by direct (inadequate cortical oxygenation of neural circuits within the motor cortex responsible for muscle activation), and indirect (inhibitory feedback from metabosensitive afferents) mechanisms. However, this impairment in motor cortical output may be transient, as prolonged stays in hypoxic environments (i.e., high altitude) restores cortical VA. Indeed, Goodall et al. (2014), found that 2 weeks of acclimatisation to altitude (5260 m above sea level) led to mitigation of the reduction in cortical VA seen during a similar acute hypoxia exposure. Furthermore, this coincided with increases in corticospinal excitability and cerebral oxygen delivery.
4.3. Corticospinal excitability and inhibition were unaffected by acute hypoxia, independent of contraction intensity
The responsiveness of the corticospinal pathway was assessed using TMS across a wide range of torque output. During fatiguing, sustained MVCs performed in normoxia, changes in the inputs to, and intrinsic properties of, motoneurones occur. This results in the progressive increase in MEP area (Gandevia et al., 1996; Hunter et al., 2006; Taylor et al., 1996). Additionally, modulation in inhibitory circuits of the brain as a result of GABAergic mechanisms causes the silent period duration to elongate when performing fatiguing contractions (Sogaard et al., 2006). In the current study, MEP area and silent period duration increased with fatigue as expected during the sham condition, with no additional effect of hypoxia.
Previous research has documented changes in the excitability of the motor cortex (resting motor thresholds) during acute hypoxic exposure, however not in the context of fatigue (Miscio et al., 2009; Szubski et al., 2006). In the context of fatigue, we previously demonstrated that corticospinal excitability (MEP area) is unaffected by acute hypoxia during submaximal and maximal contractions immediately following a 20 s sustained elbow flexion MVC (McKeown et al., 2020). In contrast, Goodall et al. (2012) and Rupp et al. (2012) demonstrated increased MEP amplitudes across a range of TMS stimulator outputs. During the current study, MEP responses elicited from the fatigued elbow flexors were not different between the sham and hypoxia conditions. Similarly, the fatigue‐related increase in silent period duration was not different between conditions. This indicates that hypoxia did not impair intrinsic properties of upper and lower motoneurones or modulate inhibitory circuits within the cortex. Disassociations between EMG and twitch responses to TMS have previously been reported following fatiguing exercise (Gandevia et al., 1996; McNeil et al., 2009), where muscle ischaemia results in sustained III/IV afferent feedback. Consequently, EMG responses (MEP and silent period) recovery rapidly, whereas VA remains impaired so long as group III/IV muscle afferent feedback is maintained. It is likely the influence of group III/IV afferent feedback had a similar impact on the TMS‐responses seen in the current study. However, as this was primarily a twitch study, TMS intensity was optimised for twitch response of the elbow flexors and not EMG responses. Therefore, potential changes in intrinsic properties of motoneurones and inhibitory cortical circuits, induced by hypoxic exposure, cannot be excluded.
5. CONCLUSION
The current study assessed the hypoxia‐induced effects on VA, corticospinal excitability, corticospinal inhibition and peripheral excitability, across a wide range of torque output in the fatigued elbow flexors after performing sustained isometric contractions to a predetermined level of 60% peak MVC torque. When exposed to 2 h of a severe acute hypoxic stimulus, the ability of the motor cortex to drive muscle activation in the presence of fatigue is impaired across a wide range of torque output. This was indicated by reductions in VA elicited via TMS of the motor cortex, but not at the level of the muscle belly.
CONFLICT OF INTEREST
The authors report no conflict of interest.
AUTHOR CONTRIBUTIONS
All authors contributed to the conception and design of this work, as well as the drafting and final approval of the manuscript. All authors agree to be accountable for all aspects of the work in ensuring that questions related to the accuracy or integrity of any part of the work are appropriately investigated and resolved. All persons designated as authors qualify for authorship, and all those who qualify for authorship are listed. Data collection and analysis was performed by DJM at Griffith University, Australia.
PEER REVIEW
The peer review history for this article is available at https://publons.com/publon/10.1111/ejn.15773.
ACKNOWLEDGEMENTS
We would like to express our gratitude to all the participants involved in our study, for their support and patience, and for contributing their time. Open access publishing facilitated by Griffith University, as part of the Wiley ‐ Griffith University agreement via the Council of Australian University Librarians.
McKeown, D. J. , McNeil, C. J. , Simmonds, M. J. , & Kavanagh, J. J. (2022). Post‐fatigue ability to activate muscle is compromised across a wide range of torques during acute hypoxic exposure. European Journal of Neuroscience, 56(5), 4653–4668. 10.1111/ejn.15773
Edited by: Gregor Thut
DATA AVAILABILITY STATEMENT
The data supporting the findings of this study are available from the corresponding author upon reasonable request.
REFERENCES
- Adreani, C. M. , Hill, J. M. , & Kaufman, M. P. (1997). Responses of group III and IV muscle afferents to dynamic exercise. Journal of Applied Physiology, 82(6), 1811–1817. 10.1152/jappl.1997.82.6.1811 [DOI] [PubMed] [Google Scholar]
- Amann, M. , Blain, G. M. , Proctor, L. T. , Sebranek, J. J. , Pegelow, D. F. , & Dempsey, J. A. (2011). Implications of group III and IV muscle afferents for high‐intensity endurance exercise performance in humans. Journal of Physiology, 589(Pt 21), 5299–5309. 10.1113/jphysiol.2011.213769 [DOI] [PMC free article] [PubMed] [Google Scholar]
- Amann, M. , Eldridge, M. W. , Lovering, A. T. , Stickland, M. K. , Pegelow, D. F. , & Dempsey, J. A. (2006). Arterial oxygenation influences central motor output and exercise performance via effects on peripheral locomotor muscle fatigue in humans. Journal of Physiology, 575(Pt 3), 937–952. 10.1113/jphysiol.2006.113936 [DOI] [PMC free article] [PubMed] [Google Scholar]
- Amann, M. , Goodall, S. , Twomey, R. , Subudhi, A. W. , Lovering, A. T. , & Roach, R. C. (2013). AltitudeOmics: On the consequences of high‐altitude acclimatization for the development of fatigue during locomotor exercise in humans. Journal of Applied Physiology, 115(5), 634–642. 10.1152/japplphysiol.00606.2013 [DOI] [PMC free article] [PubMed] [Google Scholar]
- Amann, M. , Romer, L. M. , Pegelow, D. F. , Jacques, A. J. , Hess, C. J. , & Dempsey, J. A. (2006). Effects of arterial oxygen content on peripheral locomotor muscle fatigue. Journal of Applied Physiology, 101(1), 119–127. 10.1152/japplphysiol.01596.2005 [DOI] [PubMed] [Google Scholar]
- Amann, M. , Romer, L. M. , Subudhi, A. W. , Pegelow, D. F. , & Dempsey, J. A. (2007). Severity of arterial hypoxaemia affects the relative contributions of peripheral muscle fatigue to exercise performance in healthy humans. Journal of Physiology, 581(Pt 1), 389–403. 10.1113/jphysiol.2007.129700 [DOI] [PMC free article] [PubMed] [Google Scholar]
- Balzamo, E. , Lagier‐Tessonnier, F. , & Jammes, Y. (1992). Fatigue‐induced changes in diaphragmatic afferents and cortical activity in the cat. Respiration Physiology, 90(2), 213–226. 10.1016/0034-5687(92)90082-8 [DOI] [PubMed] [Google Scholar]
- Burnley, M. , Vanhatalo, A. , & Jones, A. M. (2012). Distinct profiles of neuromuscular fatigue during muscle contractions below and above the critical torque in humans. Journal of Applied Physiology, 113(2), 215–223. 10.1152/japplphysiol.00022.2012 [DOI] [PubMed] [Google Scholar]
- Chandler, D. J. , Gao, W. J. , & Waterhouse, B. D. (2014). Heterogeneous organization of the locus coeruleus projections to prefrontal and motor cortices. Proceedings of the National Academy of Sciences of the United States of America, 111(18), 6816–6821. 10.1073/pnas.1320827111 [DOI] [PMC free article] [PubMed] [Google Scholar]
- De Serres, S. J. , & Enoka, R. M. (1998). Older adults can maximally activate the biceps brachii muscle by voluntary command. Journal of Applied Physiology, 84(1), 284–291. 10.1152/jappl.1998.84.1.284 [DOI] [PubMed] [Google Scholar]
- Degens, H. , Salmons, S. , & Jarvis, J. C. (1998). Intramuscular pressure, force and blood flow in rabbit tibialis anterior muscles during single and repetitive contractions. European Journal of Applied Physiology, 78(1), 13–19. 10.1007/s004210050381 [DOI] [PubMed] [Google Scholar]
- Dousset, E. , Steinberg, J. G. , Balon, N. , & Jammes, Y. (2001). Effects of acute hypoxemia on force and surface EMG during sustained handgrip. Muscle & Nerve, 24(3), 364–371. [DOI] [PubMed] [Google Scholar]
- Eichelberger, T. D. , & Bilodeau, M. (2007). Central fatigue of the first dorsal interosseous muscle during low‐force and high‐force sustained submaximal contractions. Clinical Physiology and Functional Imaging, 27(5), 298–304. 10.1111/j.1475-097X.2007.00751.x [DOI] [PubMed] [Google Scholar]
- Fulco, C. S. , Lewis, S. F. , Frykman, P. N. , Boushel, R. , Smith, S. , Harman, E. A. , Cymerman, A. , & Pandolf, K. B. (1996). Muscle fatigue and exhaustion during dynamic leg exercise in normoxia and hypobaric hypoxia. Journal of Applied Physiology, 81(5), 1891–1900. 10.1152/jappl.1996.81.5.1891 [DOI] [PubMed] [Google Scholar]
- Gandevia, S. C. (1998). Neural control in human muscle fatigue: Changes in muscle afferents, motoneurones and motor cortical drive [corrected]. Acta Physiologica Scandinavica, 162(3), 275–283. 10.1046/j.1365-201X.1998.0299f.x [DOI] [PubMed] [Google Scholar]
- Gandevia, S. C. , Allen, G. M. , Butler, J. E. , & Taylor, J. L. (1996). Supraspinal factors in human muscle fatigue: Evidence for suboptimal output from the motor cortex. Journal of Physiology, 490(Pt 2), 529–536. 10.1113/jphysiol.1996.sp021164 [DOI] [PMC free article] [PubMed] [Google Scholar]
- Gibson, G. E. , & Duffy, T. E. (1981). Impaired synthesis of acetylcholine by mild hypoxic hypoxia or nitrous oxide. Journal of Neurochemistry, 36(1), 28–33. 10.1111/j.1471-4159.1981.tb02373.x [DOI] [PubMed] [Google Scholar]
- Goodall, S. , Gonzalez‐Alonso, J. , Ali, L. , Ross, E. Z. , & Romer, L. M. (2012). Supraspinal fatigue after normoxic and hypoxic exercise in humans. Journal of Physiology, 590(11), 2767–2782. 10.1113/jphysiol.2012.228890 [DOI] [PMC free article] [PubMed] [Google Scholar]
- Goodall, S. , Ross, E. Z. , & Romer, L. M. (2010). Effect of graded hypoxia on supraspinal contributions to fatigue with unilateral knee‐extensor contractions. Journal of Applied Physiology, 109(6), 1842–1851. 10.1152/japplphysiol.00458.2010 [DOI] [PubMed] [Google Scholar]
- Goodall, S. , Twomey, R. , Amann, M. , Ross, E. Z. , Lovering, A. T. , Romer, L. M. , Subudhi, A. W. , & Roach, R. C. (2014). AltitudeOmics: Exercise‐induced supraspinal fatigue is attenuated in healthy humans after acclimatization to high altitude. Acta Physiologica, 210(4), 875–888. 10.1111/apha.12241 [DOI] [PMC free article] [PubMed] [Google Scholar]
- Hill, J. M. , Pickar, J. G. , Parrish, M. D. , & Kaufman, M. P. (1992). Effects of hypoxia on the discharge of group III and IV muscle afferents in cats. Journal of Applied Physiology, 73(6), 2524–2529. 10.1152/jappl.1992.73.6.2524 [DOI] [PubMed] [Google Scholar]
- Hogan, M. C. , Kohin, S. , Stary, C. M. , & Hepple, R. T. (1999). Rapid force recovery in contracting skeletal muscle after brief ischemia is dependent on O(2) availability. Journal of Applied Physiology, 87(6), 2225–2229. 10.1152/jappl.1999.87.6.2225 [DOI] [PubMed] [Google Scholar]
- Hogan, M. C. , Richardson, R. S. , & Haseler, L. J. (1999). Human muscle performance and PCr hydrolysis with varied inspired oxygen fractions: A 31P‐MRS study. Journal of Applied Physiology, 86(4), 1367–1373. 10.1152/jappl.1999.86.4.1367 [DOI] [PubMed] [Google Scholar]
- Hunter, S. K. , Butler, J. E. , Todd, G. , Gandevia, S. C. , & Taylor, J. L. (2006). Supraspinal fatigue does not explain the sex difference in muscle fatigue of maximal contractions. Journal of Applied Physiology, 101(4), 1036–1044. 10.1152/japplphysiol.00103.2006 [DOI] [PubMed] [Google Scholar]
- Katayama, K. , Amann, M. , Pegelow, D. F. , Jacques, A. J. , & Dempsey, J. A. (2007). Effect of arterial oxygenation on quadriceps fatigability during isolated muscle exercise. American Journal of Physiology. Regulatory, Integrative and Comparative Physiology, 292(3), R1279–R1286. 10.1152/ajpregu.00554.2006 [DOI] [PubMed] [Google Scholar]
- Katayama, K. , Yoshitake, Y. , Watanabe, K. , Akima, H. , & Ishida, K. (2010). Muscle deoxygenation during sustained and intermittent isometric exercise in hypoxia. Medicine & Science in Sports & Exercise, 42(7), 1269–1278. 10.1249/MSS.0b013e3181cae12f [DOI] [PubMed] [Google Scholar]
- Kaufman, M. P. , Longhurst, J. C. , Rybicki, K. J. , Wallach, J. H. , & Mitchell, J. H. (1983). Effects of static muscular contraction on impulse activity of groups III and IV afferents in cats. Journal of Applied Physiology: Respiratory, Environmental and Exercise Physiology, 55(1 Pt 1), 105–112. 10.1152/jappl.1983.55.1.105 [DOI] [PubMed] [Google Scholar]
- Kavanagh, J. J. , McFarland, A. J. , & Taylor, J. L. (2019). Enhanced availability of serotonin increases activation of unfatigued muscle but exacerbates central fatigue during prolonged sustained contractions. Journal of Physiology, 597(1), 319–332. 10.1113/JP277148 [DOI] [PMC free article] [PubMed] [Google Scholar]
- Koob, G. F. , & Annau, Z. (1974). Behavioral and neurochemical alterations induced by hypoxia in rats. American Journal of Physiology, 227(1), 73–78. 10.1152/ajplegacy.1974.227.1.73 [DOI] [PubMed] [Google Scholar]
- Kukulka, C. G. , Russell, A. G. , & Moore, M. A. (1986). Electrical and mechanical changes in human soleus muscle during sustained maximum isometric contractions. Brain Research, 362(1), 47–54. https://www.ncbi.nlm.nih.gov/pubmed/3942866, 10.1016/0006-8993(86)91397-1 [DOI] [PubMed] [Google Scholar]
- Lannergren, J. , & Westerblad, H. (1991). Force decline due to fatigue and intracellular acidification in isolated fibres from mouse skeletal muscle. Journal of Physiology, 434, 307–322. 10.1113/jphysiol.1991.sp018471 [DOI] [PMC free article] [PubMed] [Google Scholar]
- Lee, R. H. , & Heckman, C. J. (1999). Enhancement of bistability in spinal motoneurons in vivo by the noradrenergic alpha1 agonist methoxamine. Journal of Neurophysiology, 81(5), 2164–2174. 10.1152/jn.1999.81.5.2164 [DOI] [PubMed] [Google Scholar]
- Lee, R. H. , & Heckman, C. J. (2000). Adjustable amplification of synaptic input in the dendrites of spinal motoneurons in vivo. Journal of Neuroscience, 20(17), 6734–6740. https://www.ncbi.nlm.nih.gov/pubmed/10964980, 10.1523/JNEUROSCI.20-17-06734.2000 [DOI] [PMC free article] [PubMed] [Google Scholar]
- Marshall, P. W. , Finn, H. T. , & Enoka, R. M. (2021). Declines in muscle contractility and activation during isometric contractions of the knee extensors vary with contraction intensity and exercise volume. Experimental Physiology, 106(10), 2096–2106. 10.1113/EP089788 [DOI] [PubMed] [Google Scholar]
- Martin, P. G. , Smith, J. L. , Butler, J. E. , Gandevia, S. C. , & Taylor, J. L. (2006). Fatigue‐sensitive afferents inhibit extensor but not flexor motoneurons in humans. Journal of Neuroscience, 26(18), 4796–4802. 10.1523/JNEUROSCI.5487-05.2006 [DOI] [PMC free article] [PubMed] [Google Scholar]
- McKeown, D. J. , McNeil, C. J. , Brotherton, E. J. , Simmonds, M. J. , & Kavanagh, J. J. (2021). Severe acute hypoxia impairs recovery of voluntary muscle activation after sustained submaximal elbow flexion. The Journal of Physiology, 599, 5379–5395. 10.1113/JP281897 [DOI] [PubMed] [Google Scholar]
- McKeown, D. J. , McNeil, C. J. , Simmonds, M. J. , & Kavanagh, J. J. (2020). Time course of neuromuscular responses to acute hypoxia during voluntary contractions. Experimental Physiology, 105, 1855–1868. 10.1113/EP088887 [DOI] [PubMed] [Google Scholar]
- McNeil, C. J. , Martin, P. G. , Gandevia, S. C. , & Taylor, J. L. (2009). The response to paired motor cortical stimuli is abolished at a spinal level during human muscle fatigue. The Journal of Physiology, 587(23), 5601–5612. 10.1113/jphysiol.2009.180968 [DOI] [PMC free article] [PubMed] [Google Scholar]
- Merton, P. A. (1954). Voluntary strength and fatigue. Journal of Physiology, 123(3), 553–564. 10.1113/jphysiol.1954.sp005070 [DOI] [PMC free article] [PubMed] [Google Scholar]
- Millet, G. Y. , Aubert, D. , Favier, F. B. , Busso, T. , & Benoit, H. (2009). Effect of acute hypoxia on central fatigue during repeated isometric leg contractions. Scandinavian Journal of Medicine & Science in Sports, 19(5), 695–702. 10.1111/j.1600-0838.2008.00823.x [DOI] [PubMed] [Google Scholar]
- Millet, G. Y. , Muthalib, M. , Jubeau, M. , Laursen, P. B. , & Nosaka, K. (2012). Severe hypoxia affects exercise performance independently of afferent feedback and peripheral fatigue. Journal of Applied Physiology, 112(8), 1335–1344. 10.1152/japplphysiol.00804.2011 [DOI] [PubMed] [Google Scholar]
- Miscio, G. , Milano, E. , Aguilar, J. , Savia, G. , Foffani, G. , Mauro, A. , Mordillo‐Mateos, L. , Romero‐Ganuza, J. , & Oliviero, A. (2009). Functional involvement of central nervous system at high altitude. Experimental Brain Research, 194(1), 157–162. 10.1007/s00221-009-1729-1 [DOI] [PubMed] [Google Scholar]
- Moritani, T. , Muro, M. , Kijima, A. , Gaffney, F. A. , & Parsons, D. (1985). Electromechanical changes during electrically induced and maximal voluntary contractions: Surface and intramuscular EMG responses during sustained maximal voluntary contraction. Experimental Neurology, 88(3), 484–499. 10.1016/0014-4886(85)90065-2 [DOI] [PubMed] [Google Scholar]
- O'Keeffe, K. , Raccuglia, G. , Hodder, S. , & Lloyd, A. (2021). Mental fatigue independent of boredom and sleepiness does not impact self‐paced physical or cognitive performance in normoxia or hypoxia. Journal of Sports Sciences, 39(15), 1687–1699. 10.1080/02640414.2021.1896104 [DOI] [PubMed] [Google Scholar]
- Olson, E. B. Jr. , Vidruk, E. H. , McCrimmon, D. R. , & Dempsey, J. A. (1983). Monoamine neurotransmitter metabolism during acclimatization to hypoxia in rats. Respiration Physiology, 54(1), 79–96. 10.1016/0034-5687(83)90115-9 [DOI] [PubMed] [Google Scholar]
- Rasmussen, P. , Nielsen, J. , Overgaard, M. , Krogh‐Madsen, R. , Gjedde, A. , Secher, N. H. , & Petersen, N. C. (2010). Reduced muscle activation during exercise related to brain oxygenation and metabolism in humans. Journal of Physiology, 588(Pt 11), 1985–1995. 10.1113/jphysiol.2009.186767 [DOI] [PMC free article] [PubMed] [Google Scholar]
- Rojas‐Camayo, J. , Mejia, C. R. , Callacondo, D. , Dawson, J. A. , Posso, M. , Galvan, C. A. , Davila‐Arango, N. , Bravo, E. A. , Loescher, V. Y. , Padilla‐Deza, M. M. , Rojas‐Valero, N. , Velasquez‐Chavez, G. , Clemente, J. , Alva‐Lozada, G. , Quispe‐Mauricio, A. , Bardalez, S. , & Subhi, R. (2018). Reference values for oxygen saturation from sea level to the highest human habitation in the Andes in acclimatised persons. Thorax, 73(8), 776–778. 10.1136/thoraxjnl-2017-210598 [DOI] [PubMed] [Google Scholar]
- Ruggiero, L. , Yacyshyn, A. F. , Nettleton, J. , & McNeil, C. J. (2018). UBC‐Nepal expedition: Acclimatization to high‐altitude increases spinal motoneurone excitability during fatigue in humans. Journal of Physiology, 596(15), 3327–3339. 10.1113/JP274872 [DOI] [PMC free article] [PubMed] [Google Scholar]
- Rupp, T. , Jubeau, M. , Wuyam, B. , Perrey, S. , Levy, P. , Millet, G. Y. , & Verges, S. (2012). Time‐dependent effect of acute hypoxia on corticospinal excitability in healthy humans. Journal of Neurophysiology, 108(5), 1270–1277. 10.1152/jn.01162.2011 [DOI] [PubMed] [Google Scholar]
- Rupp, T. , Racinais, S. , Bringard, A. , Lapole, T. , & Perrey, S. (2015). Modulation of exercise‐induced spinal loop properties in response to oxygen availability. European Journal of Applied Physiology, 115(3), 471–482. 10.1007/s00421-014-3032-5 [DOI] [PubMed] [Google Scholar]
- Sogaard, K. , Gandevia, S. C. , Todd, G. , Petersen, N. T. , & Taylor, J. L. (2006). The effect of sustained low‐intensity contractions on supraspinal fatigue in human elbow flexor muscles. Journal of Physiology, 573(Pt 2), 511–523. 10.1113/jphysiol.2005.103598 [DOI] [PMC free article] [PubMed] [Google Scholar]
- Soo, J. , Billaut, F. , Bishop, D. J. , Christian, R. J. , & Girard, O. (2020). Neuromuscular and perceptual responses during repeated cycling sprints‐usefulness of a "hypoxic to normoxic" recovery approach. European Journal of Applied Physiology, 120(4), 883–896. 10.1007/s00421-020-04327-3 [DOI] [PubMed] [Google Scholar]
- Szubski, C. , Burtscher, M. , & Loscher, W. N. (2006). The effects of short‐term hypoxia on motor cortex excitability and neuromuscular activation. Journal of Applied Physiology, 101(6), 1673–1677. 10.1152/japplphysiol.00617.2006 [DOI] [PubMed] [Google Scholar]
- Szubski, C. , Burtscher, M. , & Loscher, W. N. (2007). Neuromuscular fatigue during sustained contractions performed in short‐term hypoxia. Medicine & Science in Sports & Exercise, 39(6), 948–954. 10.1249/mss.0b013e3180479918 [DOI] [PubMed] [Google Scholar]
- Taylor, J. L. , Allen, G. M. , Butler, J. E. , & Gandevia, S. C. (2000). Supraspinal fatigue during intermittent maximal voluntary contractions of the human elbow flexors. Journal of Applied Physiology, 89(1), 305–313. 10.1152/jappl.2000.89.1.305 [DOI] [PubMed] [Google Scholar]
- Taylor, J. L. , Butler, J. E. , Allen, G. M. , & Gandevia, S. C. (1996). Changes in motor cortical excitability during human muscle fatigue. Journal of Physiology, 490(Pt 2), 519–528. 10.1113/jphysiol.1996.sp021163 [DOI] [PMC free article] [PubMed] [Google Scholar]
- Todd, G. , Taylor, J. L. , Butler, J. E. , Martin, P. G. , Gorman, R. B. , & Gandevia, S. C. (2007). Use of motor cortex stimulation to measure simultaneously the changes in dynamic muscle properties and voluntary activation in human muscles. Journal of Applied Physiology, 102(5), 1756–1766. 10.1152/japplphysiol.00962.2006 [DOI] [PubMed] [Google Scholar]
- Todd, G. , Taylor, J. L. , & Gandevia, S. C. (2003). Measurement of voluntary activation of fresh and fatigued human muscles using transcranial magnetic stimulation. Journal of Physiology, 551(Pt 2), 661–671. 10.1113/jphysiol.2003.044099 [DOI] [PMC free article] [PubMed] [Google Scholar]
- Todd, G. , Taylor, J. L. , & Gandevia, S. C. (2016). Measurement of voluntary activation based on transcranial magnetic stimulation over the motor cortex. Journal of Applied Physiology, 121(3), 678–686. 10.1152/japplphysiol.00293.2016 [DOI] [PubMed] [Google Scholar]
- Wigmore, D. M. , Damon, B. M. , Pober, D. M. , & Kent‐Braun, J. A. (2004). MRI measures of perfusion‐related changes in human skeletal muscle during progressive contractions. Journal of Applied Physiology, 97(6), 2385–2394. 10.1152/japplphysiol.01390.2003 [DOI] [PubMed] [Google Scholar]
- Yoon, T. , Schlinder Delap, B. , Griffith, E. E. , & Hunter, S. K. (2007). Mechanisms of fatigue differ after low‐ and high‐force fatiguing contractions in men and women. Muscle & Nerve, 36(4), 515–524. 10.1002/mus.20844 [DOI] [PubMed] [Google Scholar]
- Young, A. , Wright, J. , Knapik, J. , & Cymerman, A. (1980). Skeletal muscle strength during exposure to hypobaric hypoxia. Medicine & Science in Sports & Exercise, 12(5), 330–335. https://www.ncbi.nlm.nih.gov/pubmed/7453509, 10.1249/00005768-198025000-00005 [DOI] [PubMed] [Google Scholar]
Associated Data
This section collects any data citations, data availability statements, or supplementary materials included in this article.
Data Availability Statement
The data supporting the findings of this study are available from the corresponding author upon reasonable request.