

Summary
Chromosome alignment to the spindle equator is a hallmark of mitosis thought to promote chromosome segregation fidelity in metazoans. Yet chromosome alignment is only indirectly supervised by the spindle assembly checkpoint (SAC) as a byproduct of chromosome bi-orientation, and the consequences of defective chromosome alignment remain unclear. Here, we investigated how human cells respond to chromosome alignment defects of distinct molecular nature by following the fate of live HeLa cells after RNAi-mediated depletion of 125 proteins previously implicated in chromosome alignment. We confirmed chromosome alignment defects upon depletion of 108/125 proteins. Surprisingly, in all confirmed cases, depleted cells frequently entered anaphase after a delay with misaligned chromosomes. Using depletion of prototype proteins resulting in defective chromosome alignment, we show that misaligned chromosomes often satisfy the SAC and directly missegregate without lagging behind in anaphase. In-depth analysis of specific molecular perturbations that prevent proper kinetochore-microtubule attachments revealed that misaligned chromosomes that missegregate frequently result in micronuclei. Higher-resolution live-cell imaging indicated that, contrary to most anaphase lagging chromosomes that correct and reintegrate the main nuclei, misaligned chromosomes are a strong predictor of micronuclei formation in a cancer cell model of chromosomal instability, but not in non-transformed near-diploid cells. We provide evidence supporting that intrinsic differences in kinetochore-microtubule attachment stability on misaligned chromosomes account for this distinct outcome. Thus, misaligned chromosomes that satisfy the SAC may represent a previously overlooked mechanism driving chromosomal/genomic instability during cancer cell division, and we unveil genetic conditions predisposing for these events.
Keywords: mitosis, micronuclei, kinetochore, Mad2, cyclin B1, chromosome congression, spindle assembly checkpoint, aneuploidy, chromosomal instability, cancer
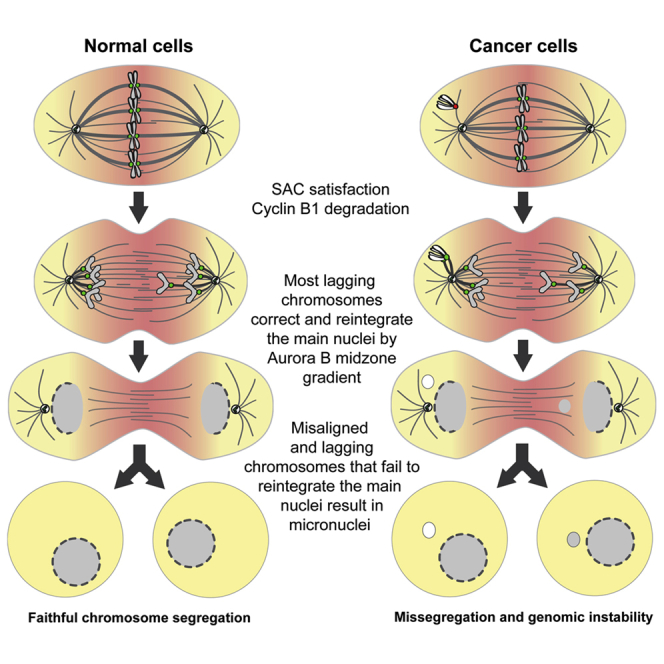
Graphical abstract
Highlights
-
•
Chromosome alignment defects of distinct molecular nature often satisfy the SAC
-
•
Missegregation of misaligned chromosomes is a strong predictor of micronucleation
-
•
Micronuclei formation from misaligned chromosomes is frequent in cancer cells
-
•
Misaligned chromosomes that satisfy the SAC may drive genomic instability in cancer
Gomes et al. use high-content live-cell imaging combined with RNAi to systematically investigate how human cells respond to chromosome alignment defects of distinct molecular nature. They find that misaligned chromosomes that satisfy the SAC are a strong predictor of micronuclei formation and may account for genomic instability in cancer.
Introduction
Chromosome alignment in human cells relies on the concerted action of motor-dependent and -independent mechanisms, which are determined by chromosome positioning at nuclear envelope breakdown (NEB), the establishment of end-on or lateral kinetochore-microtubule interactions and specific tubulin post-translational modifications.1, 2, 3, 4, 5, 6, 7, 8 Despite its key role in promoting mitotic fidelity,9, 10, 11 chromosome alignment is only indirectly supervised by the spindle assembly checkpoint (SAC), which monitors the establishment of end-on kinetochore-microtubule attachments required for chromosome bi-orientation and regulates the metaphase-anaphase transition.12,13 It is therefore widely assumed that, under physiological conditions, cells only enter anaphase once all chromosomes align and bi-orient.14, 15, 16, 17, 18, 19, 20, 21, 22 However, chromosome alignment may occur independently of end-on kinetochore-microtubule attachments and chromosome bi-orientation,5,23,24 and conditions exist in which vertebrate cells may enter anaphase in the presence of misaligned chromosomes.25 Additionally, misaligned chromosomes generated after functional perturbation of the kinetochore-associated CENP-E/Kinesin-7 in primary mouse fibroblasts and human HeLa cells in culture, as well as in regenerating hepatocytes in vivo, did not prevent anaphase onset in approximately 25%, 40%, and 95% of cell divisions, respectively, resulting in missegregation and aneuploidy.26, 27, 28 Importantly, as opposed to massive aneuploidy that renders cells unviable and has a tumor suppressing effect,29,30 gain/loss of just one or few chromosomes that are unable to complete alignment represents a real threat to chromosomal stability and has been shown to contribute to tumorigenesis in vivo.31 Thus, understanding how human cells respond to chromosome alignment defects and determining what happens to an enduring misaligned chromosome remain fundamental unanswered questions with strong clinical implications.
Results
A broad range of chromosome alignment defects directly lead to missegregation
To systematically inquire how human cells respond to chromosome alignment defects of distinct molecular nature, we used siRNAs to knockdown 125 different proteins previously implicated in this process (Data S1, S2, and S3), combined with high-content live-cell microscopy in human HeLa cells stably expressing histone H2B-GFP (to visualize chromosomes) and α-tubulin-mRFP (to visualize mitotic spindles) (Figure 1) (see also http://chromosomecongression.i3s.up.pt). Control cells underwent consecutive rounds of mitosis and completed chromosome alignment in 23 ± 8 min (mean ± SD, n = 7,229 cells), indicating no relevant phototoxicity. In contrast, experimental perturbation of chromosome alignment led to three main mitotic phenotypes: (1) cells that entered anaphase after a delay in completing chromosome alignment (≥2 SD in control-depleted cells), (2) cells that entered anaphase without completing chromosome alignment, and (3) cells that died without completing chromosome alignment (Figures 2A and 2B). In some cases (ILK, septin-7, Aki, HIP1r, ANKRD53, ASB7, NuMA, CENP-U, CEP164, CDCA4, and MCAK), we were unable to detect any significant defect in chromosome alignment under our experimental conditions (Data S1), while others (Shp2, GAK, CEP72, CEP90, CENP-H, and Mis12) turned out to be off-targets (Figure S1) and were not pursued further. Interestingly, upon depletion of several Augmin complex subunits,32 CLASPs33 or the Ska complex,34 among others, a fraction of cells was also unable to maintain chromosome alignment after completing congression to the spindle equator and showed signs that resembled cohesion fatigue and/or loss of spindle pole integrity (Figures S2A and S2B). Not surprisingly, defective chromosome alignment was often associated with a significant mitotic delay, indicating a functional SAC whose timely satisfaction was nevertheless compromised (Figures 2B and S3). Moreover, the severity of the observed chromosome alignment defects varied extensively, suggesting that certain proteins, such as CENP-E, several cytoplasmic Dynein subunits, members of the KNL1, Mis12, and Ndc80 (KMN) network,35 the Ska complex,34 and the Augmin complex,32 are more crucial for this process than others (Figure 2B). However, less penetrant phenotypes due to sub-optimal protein depletion cannot be excluded. Most relevant, and regardless of the underlying molecular nature, cells frequently entered anaphase with misaligned chromosomes that often missegregated.
Figure 1.

Schematic illustration of the high-content analysis of chromosome alignment defects
Different steps between protocol optimization and automated live-cell imaging of 125 different RNAi conditions against genes previously implicated in chromosome congression.
Figure 2.

A broad range of chromosome alignment defects directly lead to missegregation
(A) Examples of time-lapse sequences illustrating the three main mitotic phenotypes observed. Arrows indicate chromosomes at the poles in cells exhibiting chromosome alignment defects. Pixels were saturated for optimal visualization of misaligned chromosomes. Scale bars, 5 μm. Time, h:min.
(B) Quantification of congression phenotypes in control (siScramble) and siRNA-depleted cells. At least 2 independent experiments per condition were performed.
The total number of cells analyzed for each condition is indicated in Data S1. ∗p ≤ 0.05, ∗∗p ≤ 0.01, ∗∗∗p ≤ 0.001, ∗∗∗∗p ≤ 0.0001; ns, not significantly different from control; Fisher’s exact two-tailed test; # highlights a possible off-target associated with siRNA oligo 1 against HURP.
Mild, yet penetrant, chromosome alignment defects are compatible with mitotic progression and cell viability
Next, we investigated how the extent of chromosome alignment defects impacts cell viability during and after mitosis (Figures 3A and 3B). We found a strong positive correlation between the propensity of cells to die in mitosis and the time they spent in mitosis due to chromosome alignment defects (Figures 3B–3D). A positive, yet weaker correlation was also observed between the likelihood of cells to die in the subsequent interphase and the time they spent in mitosis due to chromosome alignment defects (Figures 3B, 3E, and 3F). In one particular case (NUP107 RNAi), most cells died in the subsequent interphase likely due to a well-established role in nuclear pore complex assembly and function.36 Interestingly, a direct comparison between CENP-E-depleted (with mild, yet highly penetrant chromosome alignment problems) and Ndc80-depleted cells (with severe, but less penetrant chromosome alignment problems), revealed a clear link between the extent of chromosome alignment defects and cell death, either in mitosis or in the subsequent interphase (Figures S4A–S4B′). Importantly, conditions such as CENP-E or Kif18a depletion, in which cells entered anaphase with only one or few misaligned chromosomes, and/or a less compact metaphase plate,10 were compatible with mitotic progression and cell viability (Figure 3B), thereby representing a threat to chromosomal stability.
Figure 3.

Mild, yet penetrant, chromosome alignment defects are compatible with mitotic progression and cell viability
(A) Examples of time-lapse sequences illustrating the fates exhibited by HeLa cells undergoing congression defects following siRNA knockdown. Time, h:min, from nuclear envelope breakdown (NEB) to each cellular outcome. Scale bars, 5 μm.
(B) Frequency of cells that either died in mitosis (magenta) or died in interphase (green) in control and siRNA-depleted cells. The total number of cells analyzed for each condition is indicated in Data S1. ∗p ≤ 0.05, ∗∗p ≤ 0.01, ∗∗∗p ≤ 0.001, ∗∗∗∗p ≤ 0.0001; ns, not significantly different from control; Fisher’s exact two-tailed test; # highlights a possible off-target associated with siRNA oligo 1 against HURP.
(C) Correlation between mitotic duration and cell death in mitosis for each condition.
(D) Correlation between the severity of the congression phenotypes and the frequency of cell death in mitosis.
(E) Correlation between the mitotic duration after siRNA treatment and cell death in interphase.
(F) Correlation between congression severity and the frequency of cell death in interphase. Pearson’s correlation (r) and respective p values are indicated in the plots (two-tailed test).
Cells with misaligned chromosomes enter anaphase after satisfying the spindle assembly checkpoint
In contrast to cells that satisfy the SAC, human cells undergoing mitotic slippage37 upon complete microtubule depolymerization with nocodazole retain the SAC proteins, Mad1, Mad2, and BubR1 at kinetochores and very slowly degrade cyclin B1 due to residual APC/C activity.38, 39, 40 To distinguish between these possibilities, we used live imaging in HeLa cells stably expressing Mad2-GFP to monitor the status of the SAC in control- or CENP-E-depleted cells that entered anaphase with one or few misaligned chromosomes at very high frequency after a mitotic delay (Figure 2B; see also Maia et al.27 and Tanudji et al.28). As expected, in cells treated with a control siRNA Mad2-GFP accumulated at kinetochores during prometaphase and gradually disappeared as chromosomes bi-oriented and aligned at the metaphase plate, being undetectable at kinetochores when cells entered anaphase (Figure 4A; Video S1). Likewise, Mad2-GFP accumulated exclusively at the kinetochores from those few chromosomes that never completed alignment after CENP-E depletion, becoming undetectable before anaphase onset and throughout anaphase (Figure 4A; Video S1). To obtain a more quantitative picture, we used immunofluorescence in fixed HeLa cells to measure the fluorescence of the SAC protein Mad1 relative to CENP-C (a constitutive kinetochore component) on misaligned chromosomes after CENP-E depletion in early anaphase (Figure 4B). We found that, in striking contrast to misaligned chromosomes during prometaphase where Mad1 signal was clearly detected at kinetochores in both control- and CENP-E-depleted cells (Figure 4C), virtually no Mad1 signal was detected at both kinetochores from misaligned chromosomes (an indication of syntelic attachments in which both kinetochores of a misaligned chromosome are oriented toward the same spindle pole) that persisted in early anaphase after CENP-E depletion (Figure 4C). Together, these data suggest that cells with misaligned chromosomes enter anaphase after a delay by satisfying the SAC.
Figure 4.

Cells with misaligned chromosomes enter anaphase after satisfying the spindle assembly checkpoint
(A) Selected time frames of representative HeLa cells stably expressing Mad2-GFP (green) and chromosomes labeled with SiR-DNA (magenta) in control and after CENP-E depletion. White arrowheads point to a misaligned chromosome during anaphase. Time, min:s. Time 00:00, anaphase onset.
(B) Immunofluorescence of HeLa cells stained for DNA (blue), Mad1 (green), CENP-C (white), and β-tubulin (magenta). Insets show higher magnification of selected regions with misaligned chromosomes (grayscale for single channels of Mad1 and CENP-C). Images are maximum-intensity projections of deconvolved z stacks. Scale bars, 5 μm.
(C) Quantification of the fluorescence intensity of Mad1 relative to CENP-C on misaligned chromosomes. Each dot represents an individual kinetochore. The horizontal line indicates the mean of all quantified kinetochores, and the error bars represent the standard deviation from a pool of two independent experiments (mock/prometaphase, n = 90 kinetochores, 9 cells; siCENP-E/prometaphase, n = 72 kinetochores, 17 cells; siCENP-E/anaphase, n = 19 kinetochores, 14 cells; ∗∗∗∗p ≤ 0.0001 relative to control, Mann-Whitney test).
Time-lapse recording of HeLa cells stably expressing Mad2-GFP (green) and SiR-DNA to visualize chromosomes (magenta) after control siScramble and CENP-E depletion. Corresponding inverted grayscale panels show Mad2-GFP signal alone. Black arrows indicate Mad2-GFP associated at kinetochores of pole-proximal chromosomes after CENP-E depletion. Time = h:min.
To further validate this conclusion, we used time-lapse fluorescence microscopy in HeLa and non-transformed near-diploid RPE-1 cells to quantify the levels and monitor the respective degradation kinetics of endogenously tagged cyclin B1 with the fluorescent protein Venus40 after depletion of CENP-E, or a second unrelated protein (TACC3) whose depletion also resulted in misaligned chromosomes41 (Figures 2B and S5A–S5C). Consistent with previous reports15,42 and in stark contrast with cyclin B1 degradation kinetics over more than 12 h during mitotic slippage/death upon complete microtubule depolymerization with nocodazole (Figures S5D and S5E; see also Brito and Rieder,38 Gascoigne and Taylor,39 and Novais-Cruz et al.40), cyclin B1 starts to be steadily degraded a few minutes before the onset of anaphase and continues to decline throughout anaphase in control HeLa or RPE-1 cells, becoming undetectable as chromosomes decondense in telophase (Figures 5A and 5B; Videos S2 and S3). Similar degradation kinetics were observed in CENP-E-depleted or TACC3-depleted cells that entered anaphase, with or without completion of chromosome alignment (Figures 5A, 5B, S5A, and S5B; Videos S2 and S3). In this particular set of experiments ∼40% of the CENP-E-depleted and ∼20% of the TACC3-depleted anaphase HeLa cells formed micronuclei directly from chromosomes that never aligned at the spindle equator and missegregated (Figure 5C). The frequency of these events was significantly lower in RPE-1 cells, likely due to higher efficiency in chromosome alignment after CENP-E depletion (Figure S5C). Taken together, these data indicate that cells with misaligned chromosomes may enter anaphase after satisfying the SAC and undergoing normal cyclin B1 degradation.
Figure 5.

Cells with misaligned chromosomes enter anaphase after undergoing normal cyclin B1 degradation
(A) Selected time frames from live-cell microscopy of HeLa cells stably expressing H2B-mCherry and cyclin B1-Venus in control, CENP-E, and TACC3 RNAi. Time, min:s. Time 00:00, anaphase onset. Scale bars, 5 μm. Black arrowheads point to misaligned chromosomes at anaphase onset.
(B) Cyclin B1 degradation curves for control, CENP-E-, and TACC-3-depleted cells that properly align their chromosomes at the metaphase plate or exit mitosis with misaligned chromosomes and form micronuclei. The curves represent mean cyclin B1-Venus fluorescence intensity from all analyzed cells, and error bars represent the standard deviation from a pool of two independent experiments (siScramble n = 20; siCENP-E [misaligned + micronuclei] n = 22; siCENP-E [aligned] n = 15; siTACC3 [misaligned + micronuclei] n = 5; siTACC3 [aligned] n = 12).
(C) Frequency of anaphase cells with aligned chromosomes, misaligned chromosomes, and misaligned chromosomes that result in micronuclei in control (black bars), CENP-E- (green bars), and TACC3-depleted cells (magenta bars).
Time-lapse recording of HeLa cells stably expressing cyclin B1-venus (fire lookup table) and H2B-mCherry to visualize chromosomes (inverted grayscale) after control siScramble, CENP-E depletion and TACC3 depletion. Time = h:min.
Time-lapse recording of RPE-1 cells stably expressing cyclin B1-venus (fire lookup table) and H2B-mCherry to visualize chromosomes (inverted grayscale) after control siScramble and CENP-E depletion. Time = h:min.
Although most micronuclei originate from anaphase lagging chromosomes, misaligned chromosomes are a stronger predictor of micronuclei formation
The origin of micronuclei has been linked to the presence of lagging chromosomes during anaphase that form due to incorrect merotelic kinetochore-microtubule attachments (when individual kinetochores bind to microtubules oriented to both spindle poles).43,44 More recently, DNA bridges that persist during anaphase were also implicated in micronuclei formation.45 Here, we sought to compare the relative contributions of lagging and misaligned chromosomes, as well as DNA bridges, to micronuclei formation during HeLa cell division (Figure 6A). To do so, we focused our analysis on a subset of experimental conditions that are recognized to prevent proper kinetochore-microtubule attachments (Figure 6B). As a rule, and in line with our previous findings,46 these conditions led to a substantial increase in the frequency of daughter cells with micronuclei (9.0% ± 7.3%, mean ± SD of all conditions, and up to 40% on specific conditions such as KNL1 depletion) when compared with daughter cells treated with a control siRNA (1.4%) (Figure 6B). As expected, most of the resulting micronuclei derived from anaphase lagging chromosomes (62% ± 19%, mean ± SD of all conditions) and only few (8.5% ± 6.2%, mean ± SD of all conditions) originated from DNA bridges (Figure 6B). However, we also found that a significant fraction of cells (29% ± 20%, mean ± SD of all conditions) formed micronuclei that derived directly from misaligned chromosomes (Figure 6B). Noteworthy, although occurring at much lower frequency, the relative origin of micronuclei in control HeLa cells was in line with that generally observed upon experimental perturbation of kinetochore-microtubule attachments (56%, 22%, and 22%, for lagging chromosomes, DNA bridges, and misaligned chromosomes, respectively; n = 1,700 cells) (Figure 6B). This scenario changed significantly both regarding frequency and origin of micronuclei upon monastrol treatment and washout, which induces the formation of erroneous kinetochore-microtubule attachments leading to a high frequency of anaphase lagging chromosomes47,48 (Figure 6B).
Figure 6.

Although most micronuclei originate from anaphase lagging chromosomes, misaligned chromosomes are a stronger predictor of micronuclei formation
(A) Examples of time-lapse sequences illustrating the different origins of micronuclei. Time, min:s. Time 00:00, anaphase onset. White arrowheads track misaligned chromosomes, DNA bridges, or lagging chromosomes until they eventually form micronuclei. Pixels were saturated for optimal visualization of misaligned chromosomes, DNA bridges, and lagging chromosomes. Scale bars, 5 μm.
(B) Frequency of daughter cells with micronuclei that derived either from lagging chromosomes (black bars), DNA bridges (green bars), or misaligned chromosomes (magenta bars) under the specified conditions (siScramble, n = 1,700; MonWO, n = 327; siAstrin, n = 423; siBub1, n = 457; siKif18a, n = 540; siCENP-N, n = 422; siSka1, n = 395; siTACC3, n = 485; siNsl1, n = 400; siSka3, n = 383; siZw10, n = 404; siNdc80, n = 440; siAurora A, n = 388; siCLERC, n = 263; siNuf2, n = 428; siCENP-I, n = 389; siAurora B, n = 499; siDsn1, n = 688; siCENP-E, n = 346; siSpc24, n = 418; siBubR1, n = 387; siSpc25, n = 425; siHURP_oligo1, n = 296; siHURP_oligo2, n = 200; siKNL1, n = 413; pool of 2 independent experiments for each siRNAi per condition, with the exception of Aurora A and CLERC in which only 1 experiment for the second siRNAi was performed. All independent experiments were pooled). ∗p ≤ 0.05, ∗∗p ≤ 0.01, ∗∗∗p ≤ 0.001, ∗∗∗∗p ≤ 0.0001; ns, not significantly different from control; Fisher’s exact two-tailed test; # highlight a possible off-target associated with siRNA oligo 1 against HURP.
(C) Relative probability (sum of the 3 independent absolute probabilities normalized to 1) of micronuclei formation from a lagging chromosome (black bars), a DNA bridge (green bars), or a misaligned chromosome (magenta bars) under the specified conditions (∗p ≤ 0.05, ∗∗p ≤ 0.01, ∗∗∗p ≤ 0.001, ∗∗∗∗p ≤ 0.0001; ns, no significant difference from what would be expected if all missegregation events were equally likely to cause micronuclei in each experimental condition; chi-square test).
Next, we determined the respective probabilities of micronuclei formation given a specific condition, which can either be a lagging chromosome, a DNA bridge, or a misaligned chromosome. Surprisingly, and despite the fact that most micronuclei derived from anaphase lagging chromosomes, we found that in unperturbed HeLa cells treated with a control siRNA the absolute and relative probability of micronuclei formation from a misaligned chromosome (0.92 and 0.70, respectively) clearly outcompeted the other two classes, including anaphase lagging chromosomes (0.28 and 0.21, for absolute and relative probabilities, respectively) (Figures 6C and S6A). Those probabilities were significantly higher than what would be expected if all missegregation events were equally likely to cause micronuclei (p < 0.0001; chi-square test). Interestingly, although the experimental perturbation of kinetochore-microtubule attachment stability did not result in gross alterations of the relative origins of micronuclei, in most cases, it reverted or attenuated the much higher probability of micronuclei formation from misaligned chromosomes observed in unperturbed cells (Figures 6C and S6A). This result is consistent with a role of stable kinetochore-microtubule attachments in anaphase error correction and micronuclei prevention from lagging chromosomes.46 One noticeable exception was HURP, which gave rise to much milder congression problems with no obvious bias for micronuclei formation from misaligned chromosomes with a second siRNA, in contrast with the original siRNA, despite equivalent depletion efficiency (Data S3). We suspect that the first siRNA against HURP might by hitting the SAC component MAD2, which is highly prone to off-targeting49 and would force HURP-depleted cells with incomplete chromosome congression to enter anaphase prematurely, directly leading to micronuclei formation due to incomplete chromosome alignment. Overall, we conclude that, although the majority of micronuclei originate from anaphase lagging chromosomes, misaligned chromosomes are a stronger predictor of micronuclei formation during HeLa cell division.
Micronuclei formation from misaligned chromosomes is a frequent outcome in a cancer cell model of chromosomal instability, but not in non-transformed near-diploid cells
Next, we set out to investigate the origin of micronuclei that form spontaneously during cell division in RPE-1 and chromosomally unstable U2OS cells.50 To visualize the entire chromosome set and spindle microtubules, these cell lines were engineered to stably express histone H2B-GFP and mRFP-α-tubulin and were inspected by 4D live-cell spinning-disk confocal microscopy, with a temporal resolution between 30 s and 2 min (Figures 7A and 7B). In parallel, we promoted chromosome missegregation by performing either CENP-E depletion or a monastrol treatment and washout. Unperturbed RPE-1 cells showed only a residual (1.2%) formation of micronuclei after cell division and none derived from a misaligned chromosome (Figure 7C). CENP-E depletion or monastrol treatment/washout in RPE-1 cells significantly increased the frequency of micronuclei formation (3.2% and 4.2%, respectively), most of which (71% and 89%, respectively) derived from anaphase lagging chromosomes, and only very few derived from a misaligned chromosome (2.1% and 0.95% of the cells, respectively) (Figure 7C), further demonstrating a robust chromosome alignment capacity in normal cells. This scenario was strikingly different even in unperturbed U2OS cells, which formed micronuclei in 5.8% of the cases, of which 53% derived from anaphase lagging chromosomes, 14% from DNA bridges and 33% from misaligned chromosomes (Figure 7C). Monastrol treatment/washout only slightly increased (without statistical significance) the percentage of dividing U2OS cells that formed micronuclei, which in this case derived mostly from anaphase lagging chromosomes (80%), likely due to an increase in merotelic attachments.47 In contrast, CENP-E depletion in U2OS cells significantly increased the percentage of dividing U2OS cells that formed micronuclei (17.2%), of which 62% derived from anaphase lagging chromosomes, 21% from DNA bridges and 17% from misaligned chromosomes (Figure 7C).
Figure 7.

Micronuclei formation from misaligned chromosomes is a frequent outcome in a chromosomally unstable cancer cell model, but not in non-transformed cells
(A and B) Examples of time-lapse sequences illustrating possible origins of micronuclei in RPE-1 (A) and U2OS (B) cells. Time, min:s. Time 00:00, anaphase onset. White arrowheads track misaligned chromosomes, DNA bridges, or lagging chromosomes until they eventually form micronuclei. Pixels were saturated for optimal visualization of misaligned chromosomes, DNA bridges, and lagging chromosomes. Scale bars, 5 μm.
(C) Frequency of RPE-1 and U2OS daughter cells with micronuclei that derived either from lagging chromosomes (black bars), DNA bridges (green bars), or misaligned chromosomes (magenta bars) in control, siCENP-E, and after monastrol treatment/washout (MonWO). RPE-1 cells: control, n = 163; siCENP-E, n = 95; MonWO, n = 105. U2OS cells: control, n = 250; siCENP-E, n = 81; MonWO, n = 49 (Fisher’s exact two-tailed test).
(D) Relative probability (sum of the 3 independent absolute probabilities normalized to 1) of micronuclei formation from a lagging chromosome (black bars), a DNA bridge (green bars), or a misaligned chromosome (magenta bars) in RPE-1 and U2OS cells in control and after CENP-E depletion or monastrol treatment/washout. ∗p ≤ 0.05, ∗∗p ≤ 0.01, ∗∗∗p ≤ 0.001, ∗∗∗∗p ≤ 0.0001; ns, no significant difference from what would be expected if all missegregation events were equally likely to cause micronuclei in each experimental condition; chi-square test.
We next determined the relative probabilities of micronuclei formation from lagging chromosomes, DNA bridges, and misaligned chromosomes scored in both RPE-1 and U2OS cells, with and without CENP-E, as well as with and without monastrol treatment/washout (Figure 7D) (for absolute probabilities, see Figure S6B). In line with our previous observations in HeLa cells (Figures 6C and S6A), this analysis revealed that misaligned chromosomes have the highest absolute and relative probability of resulting in micronuclei in unperturbed chromosomally unstable U2OS cells (0.63 and 0.80, respectively) (Figures 7D and S6B). These probabilities were significantly higher than what would be expected if all missegregation events were equally likely to cause micronuclei (p < 0.0001; chi-square test). In agreement with our findings in HeLa cells, both CENP-E depletion and monastrol treatment/washout reverted this tendency in U2OS cells, likely due to a significant increase in the frequency of anaphase lagging chromosomes (Figures 7C, 7D, and S6B).47 Most striking, and in sharp contrast to unperturbed HeLa and U2OS cells, unperturbed RPE-1 cells always entered anaphase after completing chromosome alignment and, consequently, no micronuclei from misaligned chromosomes were ever detected in our recordings (Figures 7D and S6B). Likewise, human primary fibroblasts were previously shown to never enter anaphase with misaligned chromosomes even after nocodazole treatment and washout, and the resulting lagging chromosomes appeared during anaphase after completing chromosome alignment during metaphase.44 We concluded that spontaneous misaligned chromosomes in unperturbed chromosomally unstable cancer cell models, but not in non-transformed near-diploid cells, have a strong probability to missegregate and result in micronuclei.
Misaligned chromosomes in chromosomally unstable cancer cells have hyper-stabilized kinetochore-microtubule attachments
Chromosomally unstable cancer cells have hyper-stabilized kinetochore-microtubule attachments and a poor error correction capacity.50,51 To investigate whether increased kinetochore-microtubule attachment stability in chromosomally unstable cancer cells allows misaligned chromosomes to satisfy the SAC, we implemented a protocol that promotes the formation of few misaligned chromosomes after nocodazole treatment and washout (Figure S7A) (STAR Methods), followed by quantification of fluorescence intensity after a nocodazole shock to completely depolymerize microtubules in fixed cells (Figure S7A). Both qualitative and quantitative analyses revealed that, under these experimental conditions, kinetochore microtubules in chromosomally unstable U2OS cells are more resistant to depolymerization when compared with non-transformed near-diploid RPE-1 cells (Figures S7A and S7B). Measurement of the respective half-life of polymerized tubulin, confirmed ∼2-fold increase in U2OS cells relative to RPE1 cells (Figures S7A and S7B). These results provide an explanation for the inefficient correction of few misaligned chromosomes that eventually satisfy the SAC in a chromosomally unstable cancer cell model and thus may represent important drivers of chromosomal instability and micronuclei formation in human cancers.
Discussion
It is currently thought that anaphase lagging chromosomes resulting from erroneous merotelic attachments that satisfy the SAC are major drivers of genomic instability in human cancers.52,53 Although anaphase lagging chromosomes resulting from merotelic attachments rarely missegregate,54,55 they may fail to incorporate into the respective daughter nuclei during cell division and result in the formation of micronuclei. Micronuclei were recently implicated as key intermediates of chromothripsis, a series of massive genomic rearrangements that may drive rapid tumor evolution and account for acquired drug resistance and oncogene activation.43,56, 57, 58, 59 We now show that although most micronuclei derive from anaphase lagging chromosomes, simply because these events occur at a very high frequency in chromosomally unstable cancer cells,54 misaligned chromosomes that satisfy the SAC often directly missegregate (without lagging behind in anaphase) and have the highest probability to form micronuclei, specifically in human cancer cell models (see graphical abstract). This is consistent with recent high-resolution live-cell studies in both cancer and non-cancer human cells that showed that the vast majority of lagging chromosomes have a transient nature and are corrected during anaphase by an Aurora-B-dependent mechanism that prevents micronuclei formation,46,60 and the relatively low frequency of micronuclei formation even after induction of massive chromosome segregation errors by experimental abrogation of the SAC.61,62
Defects in chromosome alignment are normally avoided by increased Aurora B activity at centromeres of misaligned chromosomes.27 However, the correction of erroneous attachments underlying some chromosome alignment defects (e.g., syntelic attachments) appears to be less robust in cancer cells that also show overly stabilized kinetochore-microtubule attachments.50,51 Indeed, RPE-1 cells treated with microtubule-targeting drugs at concentrations that stabilize microtubules satisfy the SAC in the presence of misaligned chromosomes and do so faster under conditions that promote the formation of syntelic attachments.62, 63, 64 In addition to direct missegregation from misaligned chromosomes, late-aligning chromosomes are also more prone to lag behind in anaphase and missegregate at higher frequencies in human cancer cells, or upon SAC inactivation or stabilization of incorrect kinetochore-microtubule attachments in normal cells.62,65 Together with the fact that non-transformed human cells rely on a robust p53-dependent mechanism that limits the proliferation of aneuploid cells,66 the present work helps to explain how spontaneous misaligned chromosomes in cancer cells eventually satisfy the SAC and may constitute a direct route to chromosomal instability.
This work also unveils a wide range of genetic perturbations that predispose for these events and might account for the underlying chromosomal and genomic instability commonly observed in human cancers. A paramount case is the perturbation of CENP-E function that has been linked to tumorigenesis in vivo.31 Previous studies have shown that ∼40% of CENP-E-depleted HeLa cells enter anaphase with misaligned chromosomes.27,28 Fixed-cell analysis revealed that these misaligned chromosomes accumulate Mad2, but micronuclei generated from CENP-E-depleted cells did not, suggesting that misaligned chromosomes satisfy the SAC.27 Although suggestive, the origin of the scored micronuclei was not determined in these fixed-cell experiments, and so it remains possible that the scored micronuclei did not derive directly from misaligned chromosomes (they may alternatively derive from anaphase lagging chromosomes; Figures 6B and 6C), and cells with misaligned chromosomes entered anaphase without satisfying the SAC. Indeed, previous experiments in fixed CENP-E KO MEFs revealed continued localization of SAC proteins at misaligned chromosomes seen in anaphase cells, suggesting ongoing SAC signaling.26 Our live-cell imaging of Mad2-GFP upon CENP-E depletion in HeLa cells, supported by quantitative analyses in fixed cells soon after anaphase onset, show that Mad1/Mad2 dissociate from kinetochores of misaligned chromosomes in cells that entered anaphase, suggesting SAC satisfaction. Moreover, live-cell imaging revealed a normal degradation kinetics of cyclin B1 in CENP-E-depleted or unrelated TACC3-depleted cells that entered anaphase with misaligned chromosomes. This contrasts with the pattern observed upon mitotic slippage, in which mitotic cells that cannot satisfy the SAC exit mitosis with high Mad1/Mad2 levels at kinetochores and after very slow and prolonged degradation of cyclin B1.39,64,67 Combined, these data provide direct evidence that, at least under certain conditions, cancer cells with misaligned chromosomes may enter anaphase after SAC satisfaction and have a high risk of forming micronuclei (see graphical abstract). In line with these findings, recent experiments in which CENP-E activity was inhibited in human RPE-1 cells suggest that endomembrane “ensheathing” of misaligned chromosomes may facilitate micronuclei formation and delay SAC satisfaction.68
Our systematic analysis of more than 100 different molecular perturbations further indicates that entering anaphase with misaligned chromosomes might be a frequent outcome in cancer cells. In particular, perturbations such as CENP-E or Kif18a depletion were largely compatible with cell viability, despite the high incidence of cells that entered anaphase in the presence of misaligned chromosomes. This contrasts with more drastic scenarios that result from perturbation of end-on kinetochore-microtubule attachments (e.g., depletion of KMN components) that often result in massive chromosome missegregation and cell death. Noteworthy, while the loss of Kif18a, which causes asynchronous segregation of misaligned chromosomes due to loss of interchromosome compaction during anaphase, does not promote chromosomal instability and tumorigenesis,10,69 the loss of CENP-E that typically originates one or few pole-proximal chromosomes directly leads to aneuploidy and the spontaneous formation of lymphomas and lung tumors in aged animals.26,31 These data suggest that the origin and properties of the resulting micronuclei is genetically determined and might have implications for the propensity to undergo massive chromosome rearrangements, such as those commonly observed in chromothripsis. Interestingly, micronuclei derived from segregation errors associated with Kif18a loss of function appear to form stable nuclear envelopes.69 However, because misaligned chromosomes that form after perturbation of CENP-E function are brought very close to Aurora A activity at the spindle poles,2 this might compromise proper nuclear envelope formation.70,71 In agreement, micronuclei derived from misaligned chromosomes after CENP-E perturbation were recently suggested to activate the cGAS-STING pathway in cancer cells.72 Thus, cellular response to micronuclei might depend on their relative origin. Overall, our findings incite for an in-depth characterization of the properties and fate of micronuclei of different origins, while evaluating their respective potential to drive and/or sustain cell transformation. In this regard, our study indicates that micronuclei formation from misaligned chromosomes appears to be a specific outcome of cancer cells and may represent a possible therapeutic opportunity in human cancers.
STAR★Methods
Key resources table
| REAGENT or RESOURCE | SOURCE | IDENTIFIER |
|---|---|---|
| Antibodies | ||
| mouse anti-Mad1 | Merck Millipore | Cat#MABE867; RRID:AB_2910099 |
| mouse anti-α-tubulin | Sigma | T5168; RRID:AB_477579 |
| rabbit anti-β-tubulin | Abcam | Ab6046; RRID:AB_2210370 |
| guinea pig anti-CENP-C | MBL International | PD030; RRID:AB_10693556 |
| mouse anti-Aim1 | BD Biosciences | Cat#611083; RRID:AB_398396 |
| mouse anti-Hec1 (9GA) | Abcam | Ab3613; RRID:AB_303949 |
| mouse anti-Dsn1 | Gift from A. Musacchio | N/A |
| mouse anti-ATRX | Santa Cruz Biotechnology | sc-55584; RRID:AB_831012 |
| rabbit anti-CEP72 | Novus Biologicals | NB100-60661; RRID:AB_920952 |
| mouse anti-GAK | R&D Systems | MAB6918; RRID:AB_10972463 |
| rabbit anti-WDHD1/And-1 | Novus Biologicals | NBP1-89091; RRID:AB_11041095 |
| rabbit anti-Aurora A | Novus Biologicals | NB100-267; RRID:AB_10002481 |
| rabbit anti-HURP | Gift from P. Meraldi | N/A |
| mouse anti-INCENP | Santa Cruz Biotechnology | sc-376514; RRID:AB_11149761 |
| mouse anti-Sgo1 (F-8) | Santa Cruz Biotechnology | sc-393993; RRID:AB_2910101 |
| rabbit anti-DHC | ThermoFisher Scientific | PA5-49373; RRID:AB_2634827 |
| sheep anti-Bub1 | Gift from S. Taylor | N/A |
| rabbit anti-Septin-2 | Novus Biologicals | NBP1-85212; RRID:AB_11002313 |
| mouse anti-Ska3 | Santa Cruz Biotechnology | sc-390326; RRID:AB_2923182 |
| rabbit anti-CEP90 | Novus Biologicals | NBP2-56805; RRID:AB_2923183 |
| mouse anti-Ska2 | Santa Cruz Biotechnology | sc-514495; RRID:AB_2923184 |
| mouse anti-4.1r (B-11) | Santa Cruz Biotechnology | sc-166759; RRID:AB_2098363 |
| rabbit anti-Astrin (N-terminal) | Gift from D. Compton | N/A |
| rabbit anti-Kif4a | ThermoFisher Scientific | pa5-30492; RRID:AB_2547966 |
| rat anti-CLASP1 | Maffini et al.73 | N/A |
| rat anti-CLASP2 | Maffini et al.73 | N/A |
| rabbit anti-BubR1 | Abcam | Ab4637; RRID:AB_2066074 |
| mouse anti-Nde1 | Abnova | H00054820-M01; RRID:AB_425994 |
| rabbit anti-SHP2 | Abcam | Ab10555; RRID:AB_297290 |
| rabbit anti-survivin | Novus Biologicals | NB500-201; RRID:AB_10001517 |
| mouse anti-GAPDH | Proteintech | 60004-1-Ig; RRID:AB_2107436 |
| rabbit anti-vinculin | ThermoFisher Scientific | 700062; RRID:AB_2532280 |
| rabbit anti-Mis12 | Gift from C. Sunkel | N/A |
| rabbit anti-Kif18a | Bethyl Laboratories | A301-079A; RRID:AB_873056 |
| rabbit anti-KNL1 | Novus Biologicals | NBP2-92855; RRID:AB_2923185 |
| rabbit anti-Nsl1 | Novus Biologicals | NBP2-58614; RRID:AB_2923186 |
| rabbit anti-Ska1 | Gift from P. Meraldi | N/A |
| goat anti-TACC3 | Novus Biologicals | AF5720-SP; RRID:AB_2923187 |
| rabbit anti-Zw10 | Novus Biologicals | NBP2-38644; RRID:AB_2923188 |
| rabbit anti-CENP-E | Abcam | Ab133583; RRID:AB_2910100 |
| rabbit anti-CENP-I | Gift from P. Meraldi | N/A |
| rabbit anti-CENP-H | Novus Biologicals | NBP1-82546; RRID:AB_11032306 |
| rabbit anti-CENP-N | Novus Biologicals | NBP1-79664; RRID:AB_11004955 |
| rabbit anti-LRRCC1/CLERC | Abcam | Ab95450; RRID:AB_10680341 |
| Goat anti-mouse Alexa Fluor 488 | Thermo Fisher Scientific | Cat# A-11029; RRID:AB_2534088 |
| Goat anti-mouse Alexa Fluor 568 | Thermo Fisher Scientific | Cat# A-11031; RRID:AB_144696 |
| Goat anti-rabbit Alexa Fluor 568 | Thermo Fisher Scientific | Cat# A-11011; RRID:AB_143157 |
| Goat anti- guinea pig Alexa Fluor 568 | Thermo Fisher Scientific | Cat# A-21450; RRID:AB_2735091 |
| anti-mouse-HRP | Jackson ImmunoResearch Laboratories | Cat#115-035-003; RRID:AB_10015289 |
| anti-rabbit-HRP | Jackson ImmunoResearch Laboratories | Cat#111-035-003; RRID:AB_2313567 |
| anti-sheep-HRP | Jackson ImmunoResearch Laboratories | Cat#713-035-003; RRID:AB_2340709 |
| anti-rat-HRP | Jackson ImmunoResearch Laboratories | Code: 112-035-143; RRID:AB_2338138 |
| anti-goat-HRP | Jackson ImmunoResearch Laboratories | Cat#305-035-003; RRID:AB_2339400 |
| Chemicals, peptides, and recombinant proteins | ||
| Nocodazole | Sigma-Aldrich | Cat#M1401 |
| MG132 | EMD Millipore | Cat#133407-82-6 |
| Monastrol | Tocris | Cat#1305 |
| Deposited data | ||
| Additional videos and quantifications for all analyzed siRNAs | This paper | http://chromosomecongression.i3s.up.pt |
| Experimental models: Cell lines | ||
| Human HeLa parental | Gift from Y.Mimori-Kiyosue | N/A |
| Human HeLa H2B-GFP, α-tubulin-mRFP | Generated by lentiviral transduction | N/A |
| Human HeLa Mad2-GFP | Schweizer et al.74 | N/A |
| Human HeLa Cyclin B1-Venus | Gift from J. Pines | N/A |
| Human HeLa Cyclin B1-Venus, H2B-mRFP | Generated by lentiviral transduction | N/A |
| Human U2OS parental | Gift from S. Geley | N/A |
| Human U2OS H2B-GFP, mCherry-α-tubulin | Gift from S. Geley | N/A |
| Human hTERT-RPE-1 (RPE-1) parental | Gift from Ben Black | N/A |
| Human RPE-1 H2B-GFP, mCherry-α-tubulin | Generated by lentiviral transduction | N/A |
| Human RPE-1 Cyclin B1-Venus | Gift from J. Pines | N/A |
| Human RPE-1 Cyclin B1-Venus, H2B-mRFP | Generated by lentiviral transduction | N/A |
| Oligonucleotides | ||
| Data S2 | N/A | N/A |
| Software and algorithms | ||
| Fiji/ImageJ | ImageJ | N/A |
| Nikon Elements | Nikon Instruments | https://www.microscope.healthcare.nikon.com/products/software/nis-elements |
Resource availability
Lead contact
Further information and requests for resources and reagents should be directed to and will be fulfilled by the lead contact, Helder Maiato (maiato@i3s.up.pt).
Materials availability
All reagents generated in this study are available from the lead contact without restriction.
Experimental model and subject details
Cell lines
All cell lines were cultured at 37°C in 5% CO2 atmosphere in Dulbecco’s modified medium (DMEM, Gibco, Thermofisher) containing 10% fetal bovine serum (FBS, Gibco, Thermofisher). HeLa H2B-GFP/α-tubulin-mRFP, HeLa Cyclin B1-Venus/H2B-mRFP, RPE-1 H2B-GFP/mCherry-α-tubulin and RPE-1 Cyclin B1-Venus/H2B-mRFP cells were generated by lentiviral transduction. HeLa parental was kindly provided by Y. Mimori-Kiyosue (RIKEN, Japan). U2OS parental and H2B-GFP/mCherry-α-tubulin were kindly provided by S. Geley (Innsbruck Medical University, Innsbruck, Austria). hTERT-RPE-1 (RPE-1) parental (ATCC CRL-400) was kindly provided by Ben Black (U. Pennsylvania, PA, USA). HeLa Mad2-GFP cells were previously described.74 HeLa and RPE-1 cells expressing Cyclin B1-Venus were kindly provided by J. Pines (Cancer Research Institute, London, UK).
Method details
High-content live-cell imaging RNAi screen
All siRNA sequences used were either a commercial predesigned siRNA from Sigma-Aldrich (MISSION siRNA) or Dharmacon, many of which were previously validated by other published studies (see Data S2). For each protein, depletion efficiency was first optimized after preliminary phenotypic analysis between 24-96 h upon siRNA transfection (for specific conditions see Data S1) and confirmed by western blotting whenever antibodies against specific proteins were available (Data S3). For few proteins whose role in chromosome congression remained unclear at the mechanistic level or were followed-up in subsequent experiments, a second siRNA was used to rule-out possible off-targeting effects. This led to the identification of six proteins (Shp2, GAK, CEP72, CEP90, CENP-H and Mis12), where no discernable congression phenotype was observed with the second siRNA, despite a clear reduction in protein levels with both siRNA sequences (Figure S1), or a clear congression phenotype was observed despite no evident reduction in protein levels with two siRNA sequences, suggesting that they are off-targets. A second siRNA was also used to validate all selected conditions that were followed-up to determine the origin of micronuclei (Data S2). Whenever the results obtained with the second siRNA oligonucleotide were consistent with those obtained with the original siRNA oligonucleotide, the data from both experiments was pooled for statistical analysis. All exceptions (Arp1, Haspin, CENP-F, HAUS4 and CENP-T) that could not be validated by western blotting due to the poor quality of the antibodies we had access to are clearly marked in the respective figures and main text, and were not followed-up in subsequent experiments. Treatment with scramble siRNA was undistinguishable from mock transfection (Lipofectamine only) and was therefore used as a negative control throughout the manuscript. A total of 125 proteins were analyzed in this study (Data S1). For high-content live-cell imaging, HeLa cells stably expressing H2B-GFP/α-tubulin-mRFP were plated onto 96-well plate in DMEM supplemented with 5% FBS and after 1 h transfected with siRNA oligonucleotides (Data S2) at a final concentration of 50 nM. Transfections were performed using Lipofectamine RNAiMAX in Opti-MEM medium (both from Thermo Fisher Scientific) according to the manufacturer's instructions. Transfection medium was replaced with complete medium after 6 h. For time-lapse microscopy acquisition, cell culture medium was changed to DMEM without phenol red supplemented with 10% FBS 6-12 h before acquisition. Cells were imaged for 72 h in an IN CELL Analyzer 2000 microscope (GE Healthcare, Chicago, IL, USA) equipped with temperature and CO2 controller, using a Nikon 20x/0.45 NA Plan Fluor objective according to manufacturer instructions. For some validation experiments with a second siRNA oligonucleotide a Nikon ECLIPSE TI microscope (Nikon, Japan) equipped with temperature and CO2 controller, using a Nikon 20x/0.45 NA Plan Fluor objective according to the manufacturer’s instructions, using 24-well plates. Single planes were acquired every 10 min for approximately 72 h. Images were processed using ImageJ software. Long-term recordings of HeLa Cyclin B1-venus treated with nocodazole and MG132 were also performed under similar conditions using the same IN CELL Analyzer 2000 microscope system, imaged every 15 min for 13 h.
Other RNAi experiments
For high-resolution live cell imaging and immunofluorescence analysis of CENP-E depletion (siCENP-E), cells were plated at 50-60% confluence onto 22 x 22 mm No. 1.5 glass coverslips in DMEM supplemented with 5% of FBS. RNAi transfection was performed using Lipofectamine RNAiMAX reagent (Thermofisher) with 20 nM of siRNA against human CENP-E (see siRNA sequence in Data S2), diluted in serum-free media (Opti-MEM, Thermofisher). Depletion of CENP-E was maximal at 24 h after siRNA transfection and all of the analysis was performed at 24 h.
Drug treatments
Microtubule depolymerization was induced by nocodazole (Sigma-Aldrich) at 1 μM. To inhibit the proteasome, induce a metaphase arrest, and prevent exit due to a compromised SAC, cells were treated with 5 μM MG132 (EMD Millipore). To promote chromosome missegregation, a monastrol washout assay was performed. Briefly, cells were incubated during 8-10 h with 100 μM monastrol. After this period, monastrol was washed twice with warm PBS followed by washing with warm fresh medium and entry in anaphase was monitored under the microscope.
High-resolution time-lapse microscopy
For high-resolution time-lapse microscopy, cells were plated onto 22 x 22 mm No. 1.5 glass coverslips (Corning) and cell culture medium was changed to phenol-red-free DMEM CO2-independent medium (Invitrogen) supplemented with 10% FBS 6-12 h before mounting. Coverslips were mounted onto 35-mm magnetic chambers (14 mm, no. 1.5, MaTek corporation) immediately before imaging. Time-lapse imaging was performed in a heated chamber (37°C) using a 100x oil-immersion 1.40 NA Plan-Apochromatic objective mounted on an inverted microscope (Eclipse TE2000U; Nikon) equipped with a CSU-X1 spinning-disk confocal head (Yokogawa Corporation of America) controlled by NIS-Elements software and with three laser lines (488nm, 561nm, and 647 nm). Images were detected with a iXonEM+ EM-CCD camera (Andor Technology). Images of U2OS and RPE-1 expressing H2B-GFP, mCherry-α-tubulin were collected every 2 minutes or 30 seconds: 9 x 2 μm z-stacks spanning a total volume of 16 μm. For imaging of HeLa Mad2-GFP and HeLa and RPE-1 expressing Cyclin-B1-Venus/H2B-mRFP eleven 1-μm-separated z-planes covering the entire volume of the mitotic spindle were collected every 2 min. All displayed images represent maximum-intensity projections of Z-stacks, analysed with the open source image analysis software ImageJ.
Immunofluorescence microscopy
For immunofluorescence processing, cells were fixed with 4% Paraformaldehyde (Electron Microscopy Sciences) for 10 min followed by extraction with 0.3% Triton X-100 in PBS (Sigma-Aldrich) for 10 min. After blocking with 10% FBS in PBS with 0.1% Triton X-100, all primary antibodies were incubated at 4°C overnight. Then, the cells were washed with PBS containing 0.1% Triton X-100 and incubated with the respective secondary antibodies for 1 h at room temperature. Primary antibodies used were: mouse anti-Mad1 (1:500; Merck Millipore); mouse anti α-tubulin (1:2000; Sigma); rabbit anti-β-tubulin (1:2000; Abcam); anti-guinea pig CENP-C (1:1000; MBL International). Secondary antibodies used were Alexa Fluor 488, Alexa Fluor 568 and Alexa Fluor 647 (1:1000; Themofisher). DNA was counterstained with 1 μg/mL DAPI (4',6'-diamino-2-fenil-indol; Sigma-Aldrich) and mounted onto glass slides with 20 mM Tris pH8, 0.5 N-propyl gallate and 90% glycerol. Images were acquired using an AxioImager Z1 (63x, Plan oil differential interference contract objective lens, 1.46 NA; from Carl Zeiss), coupled with a CCD camera (ORCA-R2; Hamamatsu Photonics) and the Zen software (Carl Zeiss). Blind deconvolution of 3D image datasets was performed using Autoquant X software (Media Cybernetics).
Western Blotting
Cell extracts were collected after trypsinization and centrifuged at 1200 rpm for 5 min, washed and re-suspended in Lysis Buffer (NP-40, 20 nM HEPES/KOH pH 7.9; 1 mM EDTA pH 8; 1 mM EGTA; 150 mM NaCl; 0.5% NP40; 10% glycerol, 1:50 protease inhibitor; 1:100 Phenylmethylsulfonyl fluoride). The samples were then flash frozen in liquid nitrogen and kept on ice for 30 min. After centrifugation at 14000 rpm for 20 min at 4°C the supernatant was collected and protein concentration determined by the Bradford protein assay (Bio-Rad). Fifty micrograms of total extract were then loaded in SDS-polyacrylamide gels and transferred onto nitrocellulose membranes for western blot analysis. The membranes were blocked with 5% milk in TBS with 0.1% Tween-20 (TBS-T) at room temperature during 1 h, and all primary antibodies were incubated at 4°C overnight. After three washes in TBS-T the membranes were incubated with the secondary antibody for 1 h at room temperature. The membranes were washed in the same conditions than previously and the detection was performed with Clarity Western ECL Substrate (Bio-Rad). The following antibodies were used for western blot: mouse anti-Hec1 (9GA) (1:500; Abcam), mouse anti-Dsn1 (1:1000; a gift from Andrea Musacchio, MPI, Dortmund, Germany), rabbit anti-CENP-E (1:250; Abcam), mouse anti-Aim1 (1:1000; BD Bioscience), mouse anti-ATRX (1:1000; Santa Cruz Biotechnology), rabbit anti-CEP72 (1:1000; Novus Biologicals), mouse anti-GAK (1:500; R&D Systems), rabbit anti- WDHD1/And-1 (1:1000; Novus Biologicals), rabbit anti-Aurora-A (1:1000; Novus Biologicals), rabbit anti-HURP (1:500, a gift from Patrick Meraldi), mouse anti-INCENP (1:500; Santa Cruz Biotechnology), rabbit anti-LRRCC1/CLERC (1:1000; Abcam), mouse anti-Sgo-1 (F-8) (1:1000; Santa Cruz Biotechnology), rabbit anti-DHC (1:500; ThermoFisher Scientific), mouse anti-Nde1 (1:1000; Abnova), sheep anti-Bub1 (1:1000; a gift from Stephen Taylor); rabbit anti-Septin-2 (1:500; Novus Biologicals), rabbit anti-CEP90/PIBF1 (1:1000; Novus Biologicals), mouse anti-Ska2 (1:1000; Santa Cruz Biotechnology), mouse anti-4.1r (B-11) (1:1000; Santa Cruz Biotechnology), rabbit anti-Astrin (N-terminal) (1:500; a gift from Duane Compton), rabbit anti-Kif4a (1:1000; ThermoFisher Scientific), rat anti-CLASP1 (1:50; Maffini et al., 2009), rat anti-CLASP2 (1:50; Maffini et al., 2009), rabbit anti-BubR1 (1:1000; Abcam), rabbit anti-SHP2 (1:1000; Abcam), rabbit anti-survivin (1:1000; Novus Biologicals), mouse anti-Ska3 (1:500; Santa Cruz Biotechnology), rabbit anti-Mis12 (1:1000, a gift from Claudio Sunkel), rabbit anti-Kif18a (1:1000; Bethyl Laboratories), rabbit anti-KNL1 (1:1000; Novus Biologicals), rabbit anti-Nsl1 (1:500, Novus Biologicals), rabbit anti-Ska1 (1:500; a gift from Patrick Meraldi), goat anti-TACC3 (1:1000; Novus Biologicals), rabbit anti-Zw10 (1:1500; Novus Biologicals), rabbit anti-CENP-I (1:250; a gift from Patrick Meraldi), rabbit anti-CENP-H (1:500; Novus Biologicals), rabbit anti-CENP-N (1:500; Novus Biologicals), rabbit anti-CLERC (1:500, Abcam), mouse anti-GAPDH (1:40000; Proteintech), rabbit anti-vinculin (1:1000;ThermoFisher Sientific), mouse anti-α-tubulin (clone B-512; 1:5000; Sigma-Aldrich) were used as primary antibodies, and anti-mouse-HRP, anti-rabbit-HRP, anti-sheep-HRP, anti-rat-HRP and anti-goat-HRP were used as secondary antibodies (1:5000; Jackson ImmunoResearch Laboratories,).
Quantification and statistical analysis
Quantification of mitotic errors
Mitotic errors were tracked and quantified manually through the assessment of H2B localization in single plane images. Mitotic errors were divided into 3 main classes: lagging chromosomes, DNA bridges or misaligned chromosomes and these were discriminated according to location and morphology associated with H2B localization. Lagging chromosomes retained normal DNA condensation and emerged at different stages during anaphase. Any H2B-positive material between the two chromosomes masses, but distinguishably separated from them, was counted as lagging chromosomes. DNA bridges were characterized by stretches of DNA that connected both daughter nuclei and often displayed aberrant DNA condensation as judged by H2B localization. Misaligned chromosomes were characterized by any H2B-positive material that remained near the spindle pole or clearly outside the metaphase plate. To determine micronuclei origin, fully formed micronuclei were backtracked to reveal whether these originated from lagging chromosomes, DNA bridges or misaligned chromosomes. The absolute probability of micronucleus formation from a lagging chromosome was determined by the ratio between the number of daughter cells with micronuclei derived from lagging chromosomes and the total number of cells with lagging chromosomes. The absolute probability of micronucleus formation from a DNA bridge was determined by the ratio between the number of daughter cells with micronuclei derived from DNA bridges and the total number of cells with DNA bridges. The absolute probability of micronucleus formation from a misaligned chromosome was determined by the ratio between the number of daughter cells with micronuclei derived from misaligned chromosomes and the total number of cells that exit mitosis with a misaligned chromosome. For the relative probabilities, the sum of the 3 independent absolute probability values was normalized to 1.
Quantitative image analysis
For quantification of Mad1 fluorescence intensity, images were analysed using ImageJ. Briefly, individual kinetochores were identified by CENP-C staining and marked by a region of interest (ROI). The average fluorescence intensity of signals of Mad1 at kinetochores was measured on the focused z plan. The background signal was measured within a neighbouring region and was subtracted from the measured fluorescence intensity the region of interest. Fluorescence intensity measurements were normalized to the CENP-C signals. Mad1 negative values were considered zero, since resulted from the high background fluorescence observed in early anaphase cells. Approximately 90 kinetochore pairs from 9 cells were analysed for control prometaphase cells, 72 kinetochore pairs from 14 cells for prometaphase in CENP-E depleted cells and 19 kinetochore pairs from 14 cells for early anaphase in CENP-E depleted cells. The fluorescence levels of Cyclin B1 in HeLa cells treated with nocodazole were measured using the IN Cell Developer Toolbox software (GE Healthcare). After background subtraction, fluorescence intensities were normalized to the level at time = 0 and represented as a function of time. The levels of Cyclin B1 in siScramble, siCENP-E, siTACC3 HeLa cells and siScramble, siCENP-E RPE-1 were measured using ImageJ. A small square region of interest (ROI) was defined, and Cyclin B1 fluorescence intensity measured, throughout time in the cell. The same ROI was used to measure the background outside the region of interest. All fluorescence intensity values were then background corrected and the values were normalized at 14 or 8 minutes before anaphase onset in HeLa and RPE-1 cells, respectively. The microtubule depolymerization rate after nocodazole treatment in U2OS and RPE-1 cells was determined by the proportion of total and soluble α-tubulin levels. The total α-tubulin intensity was measured by drawing a larger oval shaped region of interest (ROI) contained the entire cell in sum-projected images (ImageJ). The soluble α-tubulin levels were determined by drawing five smaller oval shaped ROI outside the chromosome region and the average of these values were calculated in sum-projected images. The fluorescence intensities were normalized to the level at time = 0 and represented as a function of time.
Statistical analysis
All results presented in this manuscript were obtained from pooling data from at least 2 independent experiments unless otherwise stated. Sample sizes and statistical tests used for each experiment are indicated in the respective figure legends. Quantifications of mitotic errors (i.e. cell death and micronuclei) were analyzed using the Fisher’s exact two-tailed test. Correlations were calculated using two-tailed Pearson′s correlation coefficients. When only two experimental groups were compared, we used either a parametric t test or a nonparametric Mann-Whitney test. Distribution normalities were assessed using the D′Agostino-Pearson omnibus test. For the comparison of the single exponential fitting curve extra sum-of square F test was used. Probabilities were calculated using Chi-squared test. For each graph, where applicable, ns= non-significant, ∗p ≤ 0.05, ∗∗p ≤ 0.01 ∗∗∗p ≤ 0.001 and ∗∗∗∗p ≤ 0.0001, unless stated otherwise. In all plots error bars represent standard deviation. All statistical analysis was performed using GraphPad Prism V7 (GraphPad Software).
Acknowledgments
We thank André Maia for technical assistance. A.M.G., M.N.-C., and J.M.-M. are recipients of PhD studentships from Fundação para a Ciência e a Tecnologia (FCT) (SFRH/BD/130938/2017, SFRH/BD/117063/2016, and 2021.07945.BD). This work was funded by the European Research Council consolidator grant CODECHECK, under the European Union’s Horizon 2020 research and innovation program (681443), FCT (PTDC/MED-ONC/3479/2020), and a La Caixa Health Research Grant (LCF/PR/HR21/52410025).
Author contributions
Conceptualization, supervision, project administration, and funding acquisition, H.M.; methodology, A.M.G., B.O., M.N.-C., F.D.S., and C.F.; investigation, formal analysis, and validation, A.M.G., B.O., M.N.-C., F.D.S., C.F., J.M.-M., C.L., and H.M.; visualization, A.M.G., B.O., M.N.-C., F.D.S., C.F., J.M.-M., and H.M.; writing – original draft, A.M.G. and H.M.; writing – review & editing, A.M.G., B.O., M.N.-C., C.F., and H.M.
Declaration of interests
B.O. declares that he is a consultant specialist at Volastra Therapeutics.
Published: September 2, 2022
Footnotes
Supplemental information can be found online at https://doi.org/10.1016/j.cub.2022.08.026.
Supplemental information
Data and code availability
-
•
A public repository where time-lapse videos, phenotypical fingerprints, siRNA sequences and available western blotting analysis for each condition can be conveniently browsed and is freely available as a community resource at http://chromosomecongression.i3s.up.pt.
-
•
This paper does not report original code.
-
•
Any additional information required to reanalyze the data reported in this paper is available from the lead contact upon request.
References
- 1.Maiato H., Gomes A.M., Sousa F., Barisic M. Mechanisms of chromosome congression during mitosis. Biology. 2017;6:13. doi: 10.3390/biology6010013. [DOI] [PMC free article] [PubMed] [Google Scholar]
- 2.Barisic M., Aguiar P., Geley S., Maiato H. Kinetochore motors drive congression of peripheral polar chromosomes by overcoming random arm-ejection forces. Nat. Cell Biol. 2014;16:1249–1256. doi: 10.1038/ncb3060. [DOI] [PubMed] [Google Scholar]
- 3.Yang Z., Tulu U.S., Wadsworth P., Rieder C.L. Kinetochore dynein is required for chromosome motion and congression independent of the spindle checkpoint. Curr. Biol. 2007;17:973–980. doi: 10.1016/j.cub.2007.04.056. [DOI] [PMC free article] [PubMed] [Google Scholar]
- 4.Vorozhko V.V., Emanuele M.J., Kallio M.J., Stukenberg P.T., Gorbsky G.J. Multiple mechanisms of chromosome movement in vertebrate cells mediated through the Ndc80 complex and dynein/dynactin. Chromosoma. 2008;117:169–179. doi: 10.1007/s00412-007-0135-3. [DOI] [PMC free article] [PubMed] [Google Scholar]
- 5.Kapoor T.M., Lampson M.A., Hergert P., Cameron L., Cimini D., Salmon E.D., McEwen B.F., Khodjakov A. Chromosomes can congress to the metaphase plate before biorientation. Science. 2006;311:388–391. doi: 10.1126/science.1122142. [DOI] [PMC free article] [PubMed] [Google Scholar]
- 6.Wood K.W., Sakowicz R., Goldstein L.S., Cleveland D.W. CENP-E is a plus end-directed kinetochore motor required for metaphase chromosome alignment. Cell. 1997;91:357–366. doi: 10.1016/s0092-8674(00)80419-5. [DOI] [PubMed] [Google Scholar]
- 7.Barisic M., Silva e Sousa R., Tripathy S.K., Magiera M.M., Zaytsev A.V., Pereira A.L., Janke C., Grishchuk E.L., Maiato H. Mitosis. Microtubule detyrosination guides chromosomes during mitosis. Science. 2015;348:799–803. doi: 10.1126/science.aaa5175. [DOI] [PMC free article] [PubMed] [Google Scholar]
- 8.Barisic M., Maiato H. The tubulin code: a navigation system for chromosomes during mitosis. Trends Cell Biol. 2016;26:766–775. doi: 10.1016/j.tcb.2016.06.001. [DOI] [PMC free article] [PubMed] [Google Scholar]
- 9.Orr B., Maiato H. No chromosome left behind: the importance of metaphase alignment for mitotic fidelity. J. Cell Biol. 2019;218:1086–1088. doi: 10.1083/jcb.201902041. [DOI] [PMC free article] [PubMed] [Google Scholar]
- 10.Fonseca C.L., Malaby H.L.H., Sepaniac L.A., Martin W., Byers C., Czechanski A., Messinger D., Tang M., Ohi R., Reinholdt L.G., et al. Mitotic chromosome alignment ensures mitotic fidelity by promoting interchromosomal compaction during anaphase. J. Cell Biol. 2019;218:1148–1163. doi: 10.1083/jcb.201807228. [DOI] [PMC free article] [PubMed] [Google Scholar]
- 11.Matos I., Pereira A.J., Lince-Faria M., Cameron L.A., Salmon E.D., Maiato H. Synchronizing chromosome segregation by flux-dependent force equalization at kinetochores. J. Cell Biol. 2009;186:11–26. doi: 10.1083/jcb.200904153. [DOI] [PMC free article] [PubMed] [Google Scholar]
- 12.Lara-Gonzalez P., Pines J., Desai A. Spindle assembly checkpoint activation and silencing at kinetochores. Semin. Cell Dev. Biol. 2021;117:86–98. doi: 10.1016/j.semcdb.2021.06.009. [DOI] [PMC free article] [PubMed] [Google Scholar]
- 13.Rieder C.L., Schultz A., Cole R., Sluder G. Anaphase onset in vertebrate somatic cells is controlled by a checkpoint that monitors sister kinetochore attachment to the spindle. J. Cell Biol. 1994;127:1301–1310. doi: 10.1083/jcb.127.5.1301. [DOI] [PMC free article] [PubMed] [Google Scholar]
- 14.Taylor S.S., McKeon F. Kinetochore localization of murine Bub1 is required for normal mitotic timing and checkpoint response to spindle damage. Cell. 1997;89:727–735. doi: 10.1016/s0092-8674(00)80255-x. [DOI] [PubMed] [Google Scholar]
- 15.Clute P., Pines J. Temporal and spatial control of cyclin B1 destruction in metaphase. Nat. Cell Biol. 1999;1:82–87. doi: 10.1038/10049. [DOI] [PubMed] [Google Scholar]
- 16.Howell B.J., Hoffman D.B., Fang G., Murray A.W., Salmon E.D. Visualization of Mad2 dynamics at kinetochores, along spindle fibers, and at spindle poles in living cells. J. Cell Biol. 2000;150:1233–1250. doi: 10.1083/jcb.150.6.1233. [DOI] [PMC free article] [PubMed] [Google Scholar]
- 17.Maresca T.J., Salmon E.D. Intrakinetochore stretch is associated with changes in kinetochore phosphorylation and spindle assembly checkpoint activity. J. Cell Biol. 2009;184:373–381. doi: 10.1083/jcb.200808130. [DOI] [PMC free article] [PubMed] [Google Scholar]
- 18.Murray A.W. A brief history of error. Nat. Cell Biol. 2011;13:1178–1182. doi: 10.1038/ncb2348. [DOI] [PubMed] [Google Scholar]
- 19.Pesenti M.E., Weir J.R., Musacchio A. Progress in the structural and functional characterization of kinetochores. Curr. Opin. Struct. Biol. 2016;37:152–163. doi: 10.1016/j.sbi.2016.03.003. [DOI] [PubMed] [Google Scholar]
- 20.Acquaviva C., Herzog F., Kraft C., Pines J. The anaphase promoting complex/cyclosome is recruited to centromeres by the spindle assembly checkpoint. Nat. Cell Biol. 2004;6:892–898. doi: 10.1038/ncb1167. [DOI] [PubMed] [Google Scholar]
- 21.Pereira A.J., Maiato H. Maturation of the kinetochore-microtubule interface and the meaning of metaphase. Chromosome Res. 2012;20:563–577. doi: 10.1007/s10577-012-9298-8. [DOI] [PubMed] [Google Scholar]
- 22.Hein J.B., Nilsson J. Stable MCC binding to the APC/C is required for a functional spindle assembly checkpoint. EMBO Rep. 2014;15:264–272. doi: 10.1002/embr.201337496. [DOI] [PMC free article] [PubMed] [Google Scholar]
- 23.Cai S., O'Connell C.B., Khodjakov A., Walczak C.E. Chromosome congression in the absence of kinetochore fibres. Nat. Cell Biol. 2009;11:832–838. doi: 10.1038/ncb1890. [DOI] [PMC free article] [PubMed] [Google Scholar]
- 24.Khodjakov A., Cole R.W., McEwen B.F., Buttle K.F., Rieder C.L. Chromosome fragments possessing only one kinetochore can congress to the spindle equator. J. Cell Biol. 1997;136:229–240. doi: 10.1083/jcb.136.2.229. [DOI] [PMC free article] [PubMed] [Google Scholar]
- 25.Rieder C.L., Davison E.A., Jensen L.C., Cassimeris L., Salmon E.D. Oscillatory movements of monooriented chromosomes and their position relative to the spindle pole result from the ejection properties of the aster and half-spindle. J. Cell Biol. 1986;103:581–591. doi: 10.1083/jcb.103.2.581. [DOI] [PMC free article] [PubMed] [Google Scholar]
- 26.Weaver B.A., Bonday Z.Q., Putkey F.R., Kops G.J., Silk A.D., Cleveland D.W. Centromere-associated protein-E is essential for the mammalian mitotic checkpoint to prevent aneuploidy due to single chromosome loss. J. Cell Biol. 2003;162:551–563. doi: 10.1083/jcb.200303167. [DOI] [PMC free article] [PubMed] [Google Scholar]
- 27.Maia A.F., Feijão T., Vromans M.J., Sunkel C.E., Lens S.M. Aurora B kinase cooperates with CENP-E to promote timely anaphase onset. Chromosoma. 2010;119:405–413. doi: 10.1007/s00412-010-0265-x. [DOI] [PubMed] [Google Scholar]
- 28.Tanudji M., Shoemaker J., L'Italien L., Russell L., Chin G., Schebye X.M. Gene silencing of CENP-E by small interfering RNA in HeLa cells leads to missegregation of chromosomes after a mitotic delay. Mol. Biol. Cell. 2004;15:3771–3781. doi: 10.1091/mbc.e03-07-0482. [DOI] [PMC free article] [PubMed] [Google Scholar]
- 29.Kops G.J., Foltz D.R., Cleveland D.W. Lethality to human cancer cells through massive chromosome loss by inhibition of the mitotic checkpoint. Proc. Natl. Acad. Sci. USA. 2004;101:8699–8704. doi: 10.1073/pnas.0401142101. [DOI] [PMC free article] [PubMed] [Google Scholar]
- 30.Silk A.D., Zasadil L.M., Holland A.J., Vitre B., Cleveland D.W., Weaver B.A. Chromosome missegregation rate predicts whether aneuploidy will promote or suppress tumors. Proc. Natl. Acad. Sci. USA. 2013;110:E4134–E4141. doi: 10.1073/pnas.1317042110. [DOI] [PMC free article] [PubMed] [Google Scholar]
- 31.Weaver B.A., Silk A.D., Montagna C., Verdier-Pinard P., Cleveland D.W. Aneuploidy acts both oncogenically and as a tumor suppressor. Cancer Cell. 2007;11:25–36. doi: 10.1016/j.ccr.2006.12.003. [DOI] [PubMed] [Google Scholar]
- 32.Uehara R., Nozawa R.-S., Tomioka A., Petry S., Vale R.D., Obuse C., Goshima G. The augmin complex plays a critical role in spindle microtubule generation for mitotic progression and cytokinesis in human cells. Proc. Natl. Acad. Sci. USA. 2009;106:6998–7003. doi: 10.1073/pnas.0901587106. [DOI] [PMC free article] [PubMed] [Google Scholar]
- 33.Logarinho E., Maffini S., Barisic M., Marques A., Toso A., Meraldi P., Maiato H. CLASPs prevent irreversible multipolarity by ensuring spindle-pole resistance to traction forces during chromosome alignment. Nat. Cell Biol. 2012;14:295–303. doi: 10.1038/ncb2423. [DOI] [PubMed] [Google Scholar]
- 34.Gaitanos T.N., Santamaria A., Jeyaprakash A.A., Wang B., Conti E., Nigg E.A. Stable kinetochore-microtubule interactions depend on the Ska complex and its new component Ska3/C13Orf3. EMBO J. 2009;28:1442–1452. doi: 10.1038/emboj.2009.96. [DOI] [PMC free article] [PubMed] [Google Scholar]
- 35.Cheeseman I.M., Chappie J.S., Wilson-Kubalek E.M., Desai A. The conserved KMN network constitutes the core microtubule-binding site of the kinetochore. Cell. 2006;127:983–997. doi: 10.1016/j.cell.2006.09.039. [DOI] [PubMed] [Google Scholar]
- 36.Beck M., Hurt E. The nuclear pore complex: understanding its function through structural insight. Nat. Rev. Mol. Cell Biol. 2017;18:73–89. doi: 10.1038/nrm.2016.147. [DOI] [PubMed] [Google Scholar]
- 37.Rieder C.L., Maiato H. Stuck in division or passing through: what happens when cells cannot satisfy the spindle assembly checkpoint. Dev. Cell. 2004;7:637–651. doi: 10.1016/j.devcel.2004.09.002. [DOI] [PubMed] [Google Scholar]
- 38.Brito D.A., Rieder C.L. Mitotic checkpoint slippage in humans occurs via cyclin B destruction in the presence of an active checkpoint. Curr. Biol. 2006;16:1194–1200. doi: 10.1016/j.cub.2006.04.043. [DOI] [PMC free article] [PubMed] [Google Scholar]
- 39.Gascoigne K.E., Taylor S.S. Cancer cells display profound intra- and interline variation following prolonged exposure to antimitotic drugs. Cancer Cell. 2008;14:111–122. doi: 10.1016/j.ccr.2008.07.002. [DOI] [PubMed] [Google Scholar]
- 40.Novais-Cruz M., Alba Abad M., van IJcken W.F., Galjart N., Jeyaprakash A.A., Maiato H., Ferrás C. Mitotic progression, arrest, exit or death relies on centromere structural integrity, rather than de novo transcription. eLife. 2018;7 doi: 10.7554/eLife.36898. [DOI] [PMC free article] [PubMed] [Google Scholar]
- 41.Gergely F., Draviam V.M., Raff J.W. The ch-TOG/XMAP215 protein is essential for spindle pole organization in human somatic cells. Genes Dev. 2003;17:336–341. doi: 10.1101/gad.245603. [DOI] [PMC free article] [PubMed] [Google Scholar]
- 42.Afonso O., Castellani C.M., Cheeseman L.P., Ferreira J.G., Orr B., Ferreira L.T., Chambers J.J., Morais-de-Sá E., Maresca T.J., Maiato H. Spatiotemporal control of mitotic exit during anaphase by an aurora B-Cdk1 crosstalk. eLife. 2019;8 doi: 10.7554/eLife.47646. [DOI] [PMC free article] [PubMed] [Google Scholar]
- 43.Crasta K., Ganem N.J., Dagher R., Lantermann A.B., Ivanova E.V., Pan Y., Nezi L., Protopopov A., Chowdhury D., Pellman D. DNA breaks and chromosome pulverization from errors in mitosis. Nature. 2012;482:53–58. doi: 10.1038/nature10802. [DOI] [PMC free article] [PubMed] [Google Scholar]
- 44.Cimini D., Fioravanti D., Salmon E.D., Degrassi F. Merotelic kinetochore orientation versus chromosome mono-orientation in the origin of lagging chromosomes in human primary cells. J. Cell Sci. 2002;115:507–515. doi: 10.1242/jcs.115.3.507. [DOI] [PubMed] [Google Scholar]
- 45.Umbreit N.T., Zhang C.Z., Lynch L.D., Blaine L.J., Cheng A.M., Tourdot R., Sun L., Almubarak H.F., Judge K., Mitchell T.J., et al. Mechanisms generating cancer genome complexity from a single cell division error. Science. 2020;368:eaba0712. doi: 10.1126/science.aba0712. [DOI] [PMC free article] [PubMed] [Google Scholar]
- 46.Orr B., De Sousa F., Gomes A.M., Afonso O., Ferreira L.T., Figueiredo A.C., Maiato H. An anaphase surveillance mechanism prevents micronuclei formation from frequent chromosome segregation errors. Cell Rep. 2021;37 doi: 10.1016/j.celrep.2021.109783. [DOI] [PMC free article] [PubMed] [Google Scholar]
- 47.Cimini D., Moree B., Canman J.C., Salmon E.D. Merotelic kinetochore orientation occurs frequently during early mitosis in mammalian tissue cells and error correction is achieved by two different mechanisms. J. Cell Sci. 2003;116:4213–4225. doi: 10.1242/jcs.00716. [DOI] [PubMed] [Google Scholar]
- 48.Lampson M.A., Renduchitala K., Khodjakov A., Kapoor T.M. Correcting improper chromosome-spindle attachments during cell division. Nat. Cell Biol. 2004;6:232–237. doi: 10.1038/ncb1102. [DOI] [PubMed] [Google Scholar]
- 49.Sigoillot F.D., Lyman S., Huckins J.F., Adamson B., Chung E., Quattrochi B., King R.W. A bioinformatics method identifies prominent off-targeted transcripts in RNAi screens. Nat. Methods. 2012;9:363–366. doi: 10.1038/nmeth.1898. [DOI] [PMC free article] [PubMed] [Google Scholar]
- 50.Bakhoum S.F., Genovese G., Compton D.A. Deviant kinetochore microtubule dynamics underlie chromosomal instability. Curr. Biol. 2009;19:1937–1942. doi: 10.1016/j.cub.2009.09.055. [DOI] [PMC free article] [PubMed] [Google Scholar]
- 51.Salimian K.J., Ballister E.R., Smoak E.M., Wood S., Panchenko T., Lampson M.A., Black B.E. Feedback control in sensing chromosome biorientation by the aurora B kinase. Curr. Biol. 2011;21:1158–1165. doi: 10.1016/j.cub.2011.06.015. [DOI] [PMC free article] [PubMed] [Google Scholar]
- 52.Bakhoum S.F., Cantley L.C. The multifaceted role of chromosomal instability in cancer and its microenvironment. Cell. 2018;174:1347–1360. doi: 10.1016/j.cell.2018.08.027. [DOI] [PMC free article] [PubMed] [Google Scholar]
- 53.Soto M., Raaijmakers J.A., Medema R.H. Consequences of genomic diversification induced by segregation errors. Trends Genet. 2019;35:279–291. doi: 10.1016/j.tig.2019.01.003. [DOI] [PubMed] [Google Scholar]
- 54.Thompson S.L., Compton D.A. Chromosome missegregation in human cells arises through specific types of kinetochore-microtubule attachment errors. Proc. Natl. Acad. Sci. USA. 2011;108:17974–17978. doi: 10.1073/pnas.1109720108. [DOI] [PMC free article] [PubMed] [Google Scholar]
- 55.Cimini D., Cameron L.A., Salmon E.D. Anaphase spindle mechanics prevent mis-segregation of merotelically oriented chromosomes. Curr. Biol. 2004;14:2149–2155. doi: 10.1016/j.cub.2004.11.029. [DOI] [PubMed] [Google Scholar]
- 56.Zhang C.Z., Spektor A., Cornils H., Francis J.M., Jackson E.K., Liu S., Meyerson M., Pellman D. Chromothripsis from DNA damage in micronuclei. Nature. 2015;522:179–184. doi: 10.1038/nature14493. [DOI] [PMC free article] [PubMed] [Google Scholar]
- 57.Shoshani O., Brunner S.F., Yaeger R., Ly P., Nechemia-Arbely Y., Kim D.H., Fang R., Castillon G.A., Yu M., Li J.S.Z., et al. Chromothripsis drives the evolution of gene amplification in cancer. Nature. 2021;591:137–141. doi: 10.1038/s41586-020-03064-z. [DOI] [PMC free article] [PubMed] [Google Scholar]
- 58.Stephens P.J., Greenman C.D., Fu B., Yang F., Bignell G.R., Mudie L.J., Pleasance E.D., Lau K.W., Beare D., Stebbings L.A., et al. Massive genomic rearrangement acquired in a single catastrophic event during cancer development. Cell. 2011;144:27–40. doi: 10.1016/j.cell.2010.11.055. [DOI] [PMC free article] [PubMed] [Google Scholar]
- 59.Janssen A., van der Burg M., Szuhai K., Kops G.J., Medema R.H. Chromosome segregation errors as a cause of DNA damage and structural chromosome aberrations. Science. 2011;333:1895–1898. doi: 10.1126/science.1210214. [DOI] [PubMed] [Google Scholar]
- 60.Sen O., Harrison J.U., Burroughs N.J., McAinsh A.D. Kinetochore life histories reveal the origins of chromosome mis-segregation and correction mechanisms. Preprint at bioRxiv. 2021 doi: 10.1101/2021.03.30.436326. [DOI] [PMC free article] [PubMed] [Google Scholar]
- 61.Cohen-Sharir Y., McFarland J.M., Abdusamad M., Marquis C., Bernhard S.V., Kazachkova M., Tang H., Ippolito M.R., Laue K., Zerbib J., et al. Aneuploidy renders cancer cells vulnerable to mitotic checkpoint inhibition. Nature. 2021;590:486–491. doi: 10.1038/s41586-020-03114-6. [DOI] [PMC free article] [PubMed] [Google Scholar]
- 62.Klaasen S.J., Truong M.A., van Jaarsveld R.H., Koprivec I., Štimac V., de Vries S.G., Risteski P., Kodba S., Vukušić K., de Luca K.L., et al. Nuclear chromosome locations dictate segregation error frequencies. Nature. 2022;607:604–609. doi: 10.1038/s41586-022-04938-0. [DOI] [PMC free article] [PubMed] [Google Scholar]
- 63.Yang Z., Kenny A.E., Brito D.A., Rieder C.L. Cells satisfy the mitotic checkpoint in Taxol, and do so faster in concentrations that stabilize syntelic attachments. J. Cell Biol. 2009;186:675–684. doi: 10.1083/jcb.200906150. [DOI] [PMC free article] [PubMed] [Google Scholar]
- 64.Brito D.A., Yang Z., Rieder C.L. Microtubules do not promote mitotic slippage when the spindle assembly checkpoint cannot be satisfied. J. Cell Biol. 2008;182:623–629. doi: 10.1083/jcb.200805072. [DOI] [PMC free article] [PubMed] [Google Scholar]
- 65.Kuniyasu K., Iemura K., Tanaka K. Delayed chromosome alignment to the spindle equator increases the rate of chromosome missegregation in cancer cell lines. Biomolecules. 2018;9:10. doi: 10.3390/biom9010010. [DOI] [PMC free article] [PubMed] [Google Scholar]
- 66.Thompson S.L., Compton D.A. Proliferation of aneuploid human cells is limited by a p53-dependent mechanism. J. Cell Biol. 2010;188:369–381. doi: 10.1083/jcb.200905057. [DOI] [PMC free article] [PubMed] [Google Scholar]
- 67.Canman J.C., Sharma N., Straight A., Shannon K.B., Fang G., Salmon E.D. Anaphase onset does not require the microtubule-dependent depletion of kinetochore and centromere-binding proteins. J. Cell Sci. 2002;115:3787–3795. doi: 10.1242/jcs.00057. [DOI] [PubMed] [Google Scholar]
- 68.Ferrandiz N., Downie L., Starling G.P., Royle S.J. Endomembranes promote chromosome missegregation by ensheathing misaligned chromosomes. Preprint at bioRxiv. 2021 doi: 10.1101/2021.04.23.441091. [DOI] [PMC free article] [PubMed] [Google Scholar]
- 69.Sepaniac L.A., Martin W., Dionne L.A., Stearns T.M., Reinholdt L.G., Stumpff J. Micronuclei in Kif18a mutant mice form stable micronuclear envelopes and do not promote tumorigenesis. J. Cell Biol. 2021;220 doi: 10.1083/jcb.202101165. [DOI] [PMC free article] [PubMed] [Google Scholar]
- 70.Portier N., Audhya A., Maddox P.S., Green R.A., Dammermann A., Desai A., Oegema K. A microtubule-independent role for centrosomes and aurora a in nuclear envelope breakdown. Dev. Cell. 2007;12:515–529. doi: 10.1016/j.devcel.2007.01.019. [DOI] [PMC free article] [PubMed] [Google Scholar]
- 71.Hachet V., Canard C., Gönczy P. Centrosomes promote timely mitotic entry in C. elegans embryos. Dev. Cell. 2007;12:531–541. doi: 10.1016/j.devcel.2007.02.015. [DOI] [PubMed] [Google Scholar]
- 72.Hakozaki Y., Kashima Y., Morita T.Y., Tanaka K., Kobayashi S.S., Ohashi A. Abstract 1030: CENP-E inhibition generates micronucleus formation activating the cGAS-STING pathway in cancer cells. Cancer Res. 2021;81:1030. doi: 10.1158/1538-7445.AM2021-1030. [DOI] [Google Scholar]
- 73.Maffini S., Maia A.R.R., Manning A.L., Maliga Z., Pereira A.L., Junqueira M., et al. Motor-independent targeting of CLASPs to kinetochores by CENP-E promotes microtubule turnover and poleward flux. Curr. Biol. 2009;19:1566–1572. doi: 10.1016/j.cub.2009.07.059. [DOI] [PMC free article] [PubMed] [Google Scholar]
- 74.Schweizer N., Ferrás C., Kern D.M., Logarinho E., Cheeseman I.M., Maiato H. Spindle assembly checkpoint robustness requires Tpr-mediated regulation of Mad1/Mad2 proteostasis. J. Cell Biol. 2013;203:883–893. doi: 10.1083/jcb.201309076. [DOI] [PMC free article] [PubMed] [Google Scholar]
Associated Data
This section collects any data citations, data availability statements, or supplementary materials included in this article.
Supplementary Materials
Time-lapse recording of HeLa cells stably expressing Mad2-GFP (green) and SiR-DNA to visualize chromosomes (magenta) after control siScramble and CENP-E depletion. Corresponding inverted grayscale panels show Mad2-GFP signal alone. Black arrows indicate Mad2-GFP associated at kinetochores of pole-proximal chromosomes after CENP-E depletion. Time = h:min.
Time-lapse recording of HeLa cells stably expressing cyclin B1-venus (fire lookup table) and H2B-mCherry to visualize chromosomes (inverted grayscale) after control siScramble, CENP-E depletion and TACC3 depletion. Time = h:min.
Time-lapse recording of RPE-1 cells stably expressing cyclin B1-venus (fire lookup table) and H2B-mCherry to visualize chromosomes (inverted grayscale) after control siScramble and CENP-E depletion. Time = h:min.
Data Availability Statement
-
•
A public repository where time-lapse videos, phenotypical fingerprints, siRNA sequences and available western blotting analysis for each condition can be conveniently browsed and is freely available as a community resource at http://chromosomecongression.i3s.up.pt.
-
•
This paper does not report original code.
-
•
Any additional information required to reanalyze the data reported in this paper is available from the lead contact upon request.