

Summary
Regulatory landscapes drive complex developmental gene expression, but it remains unclear how their integrity is maintained when incorporating novel genes and functions during evolution. Here, we investigated how a placental mammal-specific gene, Zfp42, emerged in an ancient vertebrate topologically associated domain (TAD) without adopting or disrupting the conserved expression of its gene, Fat1. In ESCs, physical TAD partitioning separates Zfp42 and Fat1 with distinct local enhancers that drive their independent expression. This separation is driven by chromatin activity and not CTCF/cohesin. In contrast, in embryonic limbs, inactive Zfp42 shares Fat1’s intact TAD without responding to active Fat1 enhancers. However, neither Fat1 enhancer-incompatibility nor nuclear envelope-attachment account for Zfp42’s unresponsiveness. Rather, Zfp42’s promoter is rendered inert to enhancers by context-dependent DNA methylation. Thus, diverse mechanisms enabled the integration of independent Zfp42 regulation in the Fat1 locus. Critically, such regulatory complexity appears common in evolution as, genome wide, most TADs contain multiple independently expressed genes.
Keywords: topologically associating domains, lamina-associated domain, enhancer-promoter specificity, DNA methylation, developmental gene regulation, evolution, loop extrusion, cohesin, CTCF, 3D genome organization
Graphical abstract
Highlights
-
•
Novel genes can emerge in evolution without adopting or disrupting existing regulation
-
•
TADs can be grossly restructured by chromatin activity independently of cohesin/CTCF
-
•
NE attachment need not block gene activation or enhancer communication
-
•
Context-dependent promoter silencing can refine enhancer usage in multi-gene TADs
Multiple genetic and epigenetic mechanisms resolve the gene regulatory conflicts that inevitably arise during genome evolution.
Introduction
During development, enhancers with diverse activities drive extraordinarily complex transcription at target genes in time and space (Long et al., 2016). Such enhancers can activate target genes often lying hundreds of kilobases away by physically contacting promoters in three-dimensional space via chromatin folding (Bonev and Cavalli, 2016; Furlong and Levine, 2018). This collectively allows many developmental loci to be regulated by complex modular ensembles of enhancers distributed within large gene regulatory landscapes (Robson et al., 2019). Modifying such regulatory landscapes and their transcriptional outputs is viewed as central for acquiring novel phenotypic traits in evolution (Wittkopp and Kalay, 2011). However, what mechanisms allow regulatory landscapes to be modified to incorporate novel activities without compromising their existing functions remains largely unknown.
In recent years, the 3D organization of the genome has emerged as one such modifiable feature that can alter a landscape’s activities. Regulatory landscapes are partitioned into preferentially self-interacting blocks termed topologically associated domains (TADs) by cohesin and the zinc-finger transcription factor CCCTC-binding factor (CTCF) (Dixon et al., 2016; Nora et al., 2012; Rao et al., 2014). Cohesin is thought to form TADs by progressively extruding chromatin loops until blocked by CTCF boundaries, thereby bringing distant loci into frequent spatial proximity (Fudenberg et al., 2016; Sanborn et al., 2015). In this way, TADs support gene regulation by continuously driving promoters to preferentially sample all enhancers within the same but not neighboring domains (Kane et al., 2021; Symmons et al., 2014; Zuin et al., 2022). As such, TADs and their enhancer landscapes are frequently conserved across cell types and species to sustain transcription in development and evolution (Dixon et al., 2012; Fraser et al., 2015; Harmston et al., 2017; Krefting et al., 2018). The importance of this general concept is demonstrated by TAD-disrupting genomic rearrangements that generate ectopic enhancer-promoter contacts driving gene misexpression and disease (Spielmann et al., 2018). However, in evolution, such re-wiring of enhancer-promoter interactions can also be a major source of phenotypic novelty (Acemel et al., 2017; Real et al., 2020). TADs thus provide a framework to understand the partitioning of regulatory information and how this can be modified in evolution to drive phenotypic innovation.
Nonetheless, this simple modular framework of interchangeable enhancers and promoters in shuffled TADs cannot alone explain how regulatory landscapes evolve. Although TADs transmit enhancer activities to all positions in a domain (Anderson et al., 2014; Zuin et al., 2022), newly emerged or reshuffled genes do not universally adopt all these regulatory inputs. Indeed, many TADs generated by evolution contain multiple genes with non-overlapping expression, despite all promoters contacting the same enhancers (Dixon et al., 2016). Likewise, mutations that create novel ectopic enhancer-promoter contacts within rearranged TADs frequently do so without driving corresponding gene misexpression or phenotypic change (Despang et al., 2019; Ghavi-Helm et al., 2019; Laugsch et al., 2019; Yin et al., 2021). Evolutionary altered regulatory landscapes must therefore employ additional mechanisms that further refine how and when promoters use enhancer activities. For example, strict enhancer-promoter compatibility or rendering promoters inert through repressive mechanisms like DNA methylation could allow modified landscapes to incorporate multiple divergently expressed genes (Furlong and Levine, 2018). Alternatively, isolation at the nuclear envelope (NE) in repressive lamina-associated domains (LADs) could sequester specific promoters away from enhancers within newly modified TADs (van Steensel and Belmont, 2017). However, the regulatory effects of LADs, enhancer-promoter compatibility, or DNA methylation are largely only inferred from correlative genome-wide studies or functional in vitro assays (Bergman et al., 2022; Borgel et al., 2010; Jagadeesh et al., 2021; Leemans et al., 2019; Zabidi et al., 2015). Consequently, it is unknown how extensively these features actually regulate endogenous genes in development and so can facilitate or constrain the evolution of regulatory landscapes.
Here, we address this by reconstructing how a new gene regulatory program could emerge during evolution within a more ancient TAD without disrupting its prior activities. By examining the Zfp42/Fat1 locus, we find that a 300-kb region encompassing the Zfp42 gene emerged within Fat1’s ancient TAD in placental mammals. We find two mechanisms that enabled independent Zfp42 regulation while maintaining conserved Fat1 expression. In embryonic stem cells (ESCs), the ancient TAD is partitioned to physically separate Zfp42 and Fat1 with distinct enhancers in smaller domains, thereby driving their independent activity. However, in embryonic limbs, Zfp42 is rendered inert to Fat1 enhancers that it contacts within the intact ancient TAD by highly context-dependent DNA methylation. Hence, multiple novel expression programs can be incorporated into a single locus during evolution through at least restructuring 3D-chromatin landscapes and selective promoter silencing. In this way, we demonstrate generalizable principles of how the genome resolves regulatory conflicts that inevitably arise in development and evolution.
Results
Zfp42R genes emerged within Fat1’s ancient TAD landscape
Zfp42 (Rex1) is a well-studied pluripotency transcription factor that emerged from a retroposition duplication of Yin Yang 1 (Yy1) in eutherian mammals (Kim et al., 2007; Masui et al., 2008). Capture Hi-C (cHi-C) in mouse E11.5 embryonic limbs revealed Zfp42 locates in a ∼3.5 Mb CTCF-delimited TAD that contains eight genes (Figure 1A). Specifically, Zfp42 is positioned within the TAD’s central 293-kb region (Zfp42R) together with two additional eutherian-specific genes Triml1 and Triml2 that are controlled by a bidirectional promoter (Figure S2D). Directly adjacent to Zfp42R lie Adam26a, 26b, and 34 (Adam region [AdamR]) which also arose from retroposition but specifically in rodents (Long et al., 2012). By contrast, Fat1 and Mtnr1a are conserved across all vertebrates and position near the TAD’s telomeric boundary.
Figure 1.

Zfp42R genes emerged with divergent expression in Fat1’s ancient TAD regulatory landscape
(A–C) cHi-C or Hi-C from mouse (A), opossum (B), and chicken (C) embryonic limb buds with ATAC-seq and CTCF ChIP-seq peaks below. Genes are colored bars and lines indicate the TAD (light blue), the 293 kb sub-Zfp42 region (Zfp42R, orange), and sub-Adam region (AdamR, gray). An ultra-conserved Fat1 enhancer (Fat1-enh, blue circle) is also highlighted. ATAC peaks are colored by sequence conservation (seq) with or without matching functional ATAC signal (func.). Red (seq+, func.+); green (seq+, func.−); gray (seq−,func.−).
(D) Species-specific Fat1 WISH in embryonic limbs. n = 2–4. Scale bar, 0.5 mm.
(E) Quantification of pairwise conservation of species ATAC-seq peaks.
(F) LacZ reporter assay of mouse Fat1-enh in E11.5 embryos. n = 4 embryos.
(G) Phylogenetic tree with presence of Fat1, the TAD, Fat1-enh, Zfp42R, or flanking synteny outside the TAD indicated.
(H and I) Gene activity overview from Fantom5 CAGE expression (H) and WISH (I). Fat1 WISH staining is seen in the ear (e), mammary glands (m), face (f), forebrain (fb), distal limb (dl), and proximal limb (pl). Trophoblast stem cells (TSCs). Scale bar, 1 mm.
See Figures S1 and S2 and Tables S1, S2, and S6.
Figure S2.

Extended Zfp42R and Fat1 scRNA-seq gene expression analysis and expanded promoter mapping, related to Figure 1
(A–C) UMAPs from re-processed scRNA-seq from whole gastrulating embryos (A), the developing placenta (B), and whole embryos during organogenesis (C) (Cao et al., 2019; Marsh and Blelloch, 2020; Pijuan-Sala et al., 2019). UMAP embedding is colored according to cell type (left), developmental stage (middle), or expression of Triml2, Zfp42 or Fat1 (right). Zfp42R genes (Triml2 and Zfp42) are expressed in the extraembryonic ectoderm and endoderm (A) and placental trophoblasts (B). Zfp42 is also expressed in the E6.5 epiblast (A). Fat1 is expressed widely in many tissues (A–C) but is absent, for example, in blood progenitors and erythroid cells (A and C).
(D) Zoom of the centromeric TAD arm, Zfp42R and Fat1 gene body with H3K4me3 and H3K36me3 ChIP-seq shown. Note that Triml1 and Triml2 are transcribed from a single shared bidirectional promoter as indicated by a single peak of H3K4me3 and broad H3K36me3 marking the transcribed gene body.
We first tested how Zfp42R gene-emergence influenced the pre-existing regulatory landscapes of the ancient vertebrate Fat1 and Mtnr1a genes. We thus applied Hi-C to morphologically stage-matched limb buds from opossum and chicken embryos and re-processed published Hi-C from tissues of diverse vertebrate species (Figure S1A; Li et al., 2020; Niu et al., 2021; Yang et al., 2020; Zhang et al., 2019). This revealed the placental-mammal TAD is conserved across vertebrates despite frequent flanking synteny breaks and has maintained a largely constant length relative to diploid genome size (Figures 1A–1C, S1A, and S1B; Jerković et al., 2017). However, only Fat1 universally occupies the TAD in all tested vertebrate species with Triml1/2 and Zfp42 uniquely appearing in placental mammals (Figure S1A; Kim et al., 2007; Sadeqzadeh et al., 2014; Zhang et al., 2020). Similarly, Mtnr1a occupied a smaller isolated TAD in vertebrates and only became incorporated into Fat1’s TAD in the therian lineage (Figure S1A). Finally, the AdamR genes were most recently incorporated in rodents. Thus, Fat1 and its conserved mono-gene TAD co-evolved in ancestral vertebrates prior to Zfp42R gene insertion in eutherians.
Figure S1.

Extended TAD evolutionary analysis and impact of Fat1-enh deletion, related to Figure 1
(A and B) Hi-C from species spanning the vertebrate family tree (A) with quantification of TAD:Diploid genome size (B) (Li et al., 2020; Niu et al., 2021; Yang et al., 2020; Zhang et al., 2019). Fat1 (dark blue box) has been universally maintained with a large gene desert and TAD (light blue line) whose size scales with diploid genome size. This is in spite of synteny breaks that relocate Mtnr1a (zebrafish), Frg1 (opossum), Mtmr7 (human), and Sorbs2 (pig). The limb Fat1-enh emerged in tetrapods while Mtnr1a and its isolated TAD became incorporated into Fat1’s TAD in the Mammalia lineage. Triml1, Triml2 and Zfp42 emerged in eutherian placental mammals where they are universally conserved within the ancient TAD. Finally, retroposition events created a cluster of disintegrin metalloproteinases (Adam26b, 26a and 34) within the Adam gene cluster specifically in rodents (Brachvogel et al., 2002; Choi et al., 2004; Long et al., 2012).
(C) RNA-seq expression effects of Fat1-enh deletion in E11.5 limbs. Error bars: standard deviation calculated from 4 biological replicates. non-significant (ns) p > 0.05.
We therefore postulated the conserved TAD originally evolved to solely regulate Fat1. Supporting this, whole mount in situ hybridization (WISH) demonstrates that Fat1 expression is conserved over ∼300 million years in mouse, opossum, and chicken embryonic limbs (Figure 1D; Helmbacher, 2018). Moreover, we find this preserved Fat1 limb expression is driven by a conserved enhancer landscape. Specifically, matched limb assay for transposase-accessible chromatin using sequencing (ATAC-seq) identified 25–62 putative cis-regulatory elements per species which consistently cluster in the TAD’s distal arm or Fat1’s gene body (Figures 1A–1C). Of these, 5%–27% had conserved ATAC signal in pairwise species comparisons, and we tested one universally conserved distal element, Fat1-enh, in a mouse lacZ reporter assay (Figures 1E and 1F; Baranasic et al., 2021; see STAR Methods). Critically, Fat1-enh recapitulated a sub-set of Fat1’s overall expression in the proximal limb (pl) and neural tube, supporting the landscape's original function in regulating Fat1 (Figure 1F). Moreover, deleting Fat1-enh had no effect on Fat1 limb expression by RNA-seq, indicating multiple enhancers redundantly facilitate its expression (Figure S1C). Combined, this indicates Fat1 co-evolved with a structurally stable TAD and functionally conserved enhancer landscape that drive its embryonic limb expression (Figure 1G). By contrast, Zfp42R genes emerged in the TAD in eutherian mammals without disrupting Fat1’s conserved expression.
Fat1 and Zfp42R genes are differentially expressed despite sharing a regulatory landscape
We now sought to determine how Zfp42R genes became functionally “wired into” Fat1’s pre-existing regulatory landscape. As TADs facilitate enhancer-promoter communication throughout evolutionarily and pathologically rearranged domains, we predicted Zfp42R genes would at least partially adopt Fat1 expression (Real et al., 2020; Spielmann et al., 2018). However, gene expression profiling from available cap analysis of gene expression (CAGE) and single-cell RNA sequencing (scRNA-seq) atlases of mouse development revealed this is not the case (Figures 1H and S2A–S2C; Cao et al., 2019; FANTOM Consortium and the RIKEN PMI and CLST (DGT) et al., 2014; Lizio et al., 2015; Marsh and Blelloch, 2020; Pijuan-Sala et al., 2019). Zfp42R genes and Fat1 are co-transcribed in ESCs, placental trophoblasts, and the extraembryonic ectoderm and endoderm (Figures 1H, S2A, and S2B; Masui et al., 2008; Zhang et al., 2020). Nevertheless, Zfp42R genes are inactive after gastrulation despite continued Fat1 transcription in a variety of tissues, including E11 limb buds (Figures 1H and S2C). Confirming this, WISH demonstrated Fat1 activity in the E11.5 limb, ear, snout, and mammary glands, whereas Zfp42R genes were undetectable, as previously reported (Figure 1I; Ciani et al., 2003; Helmbacher, 2018; Kim et al., 2011; Zhang et al., 2020). Thus, despite sharing a regulatory landscape, Fat1 and Zfp42R genes are largely independently expressed. By contrast, Mtnr1a and AdamR gene expression was absent in all analyzed tissues, thereby excluding them from further analyses.
Collectively, this demonstrates that a monogenic TAD can incorporate new genes with independent expression patterns without disrupting its pre-existing gene’s expression. As such, currently unknown mechanisms must control which enhancers Fat1 and Zfp42R genes utilize in their shared placental mammal landscape.
Fat1 and Zfp42 independently utilize local enhancers in separated restructured domains in ESCs
We therefore sought to identify the mechanisms adapting the ancient TAD landscape for independent Fat1 and Zfp42R gene regulation in placental mammals. Thus, we mapped active enhancers and chromatin structure in mouse tissues where Fat1 and Zfp42R genes are differentially expressed (E11.5 limbs) or active together (ESCs) (Figure 2). Significantly, both Zfp42 and Fat1 are dispensable for pluripotency and limb development, with the latter possessing functional redundancy with Fat2, 3, or 4 (Ciani et al., 2003; Masui et al., 2008; Sadeqzadeh et al., 2014). As such, alterations to their regulation can be studied in ESCs and limbs without confounding effects.
Figure 2.

Fat1 and Zfp42 independently utilize local enhancers in separated restructured domains in ESCs
(A and B) cHi-C from E11.5 limb buds (A) and ESCs (B) with insulation score (Ins. Score), H3K27ac, CTCF & Rad21 ChIP-seq, and called putative enhancers below. For cHi-C, black arrows indicate interactions between active H3K27ac-marked regions and dotted rectangle indicates lost interactions between inactive D1 and D2. E11.5 limb cHi-C is reproduced from Figure 1.
(C and D) Schematic of deletion mutants (C) with gene expression effects analyzed by RNA-seq (D). Error bars, SD calculated from 2–4 biological replicates per sample. ∗∗∗p < 0.001, ∗p < 0.05, non-significant (ns).
(E and F) cHi-C from dCTCF (E) or dRad21 (F) ESCs with wild type (gray) or depletion (green) Ins. Scores below. Green arrows indicate flanking TADs disrupted by CTCF/Rad21 depletion.
In E11.5 limbs, ChIP-seq confirmed active H3K27ac-marked putative enhancers cluster near the TAD’s centromeric boundary and within Fat1’s gene body (Figures 2A and S3A; Andrey et al., 2017). However, in ESCs, a radically different TAD structure and underlying enhancer landscape emerged. Here, ESC-enhancer activities are redistributed into two distinct clusters found locally within Zfp42R and Fat1’s gene body (Figures 2B and S3A; Bauer et al., 2021). Correspondingly, Zfp42R and Fat1 eliminate interactions with flanking gene deserts 1 and 2 (D1 & D2) and become insulated in individual active domains with these separate local enhancers. Combined, these alterations collectively partition the TAD into four domains (D1, Zfp42R, D2, and Fat1) in all tested cell types where Fat1 and Zfp42R genes are active together, including 8-cell mouse embryos and human ESCs (Figures S3B–S3D; Du et al., 2017; Zhang et al., 2019). Thus, although evolutionarily stable, the ancient TAD has adopted a flexible structure in pluripotent eutherian cells that physically restricts Fat1 and Zfp42R genes to contacting only their respective local enhancers.
Figure S3.

Confirmation of TAD disassembly in placental mammal pluripotency, CTCF/Rad21 depletion, and LAD signal strength, related to Figures 2 and 3
(A) Zooms of E11.5 limb and ESC H3K27ac, CTCF and RAD21 ChIP-seq with called enhancers or CTCF peaks below.
(B) Low input Hi-C from mouse 8-cell embryos (top) and pluripotent cells from the inner cell mass (bottom) (Du et al., 2017).
(C and D) Hi-C from human cardiomyocytes (C) and H1 ESCs (D) with corresponding H3K27ac, CTCF ChIP-seq and DamID shown below. Note DamID from retinal pigment epithelium (RPE) cells was used to define locus lamina-association when Zfp42R is inactive in differentiated cells.
(E) Schematic of deletion mutants (top) with effects on gene expression determined by RNA-seq (bottom). Error bars: standard deviation calculated from 2–4 biological replicates per sample. ∗∗∗p < 0.001, ∗p < 0.05, non-significant (ns).
(F) FACs distributions of GFP signal in CTCF-AID-GFP (top) and Rad21-AID-GFP (bottom) ESCs following indicated auxin treatments.
(G) Distribution of cell-cycle phases in Rad21-AID-GFP ESCs showing rapid accumulation in S and G2/M within 6 h. To account for accumulation of Rad21-AID-GFP ESCs in G2/M phase caused by failed sister chromatid cohesion, cHi-C was performed on sorted G1 cells 3.5 h post-auxin addition (Liu et al., 2021). By contrast, due to technical difficulties plating fixed cells on coverslips, FISH was performed on unsorted 2 h-induced Rad21-AID-GFP ESCs where only moderate shifts in the G1:S:G2/M ratio were observed.
(H) Genome-wide quantification of LAD scores from E11.5 limb DamID. The Zfp42 LAD is highlighted and lies in the 88th percentile of LADs genome wide.
We therefore tested if locus restructuring reflects which enhancers Fat1 and Zfp42R genes utilize by generating a series of deletions in E11.5 embryos and ESCs (Kraft et al., 2015). Specifically, we eliminated the placental mammal-specific Zfp42R (ΔZfp42R) or the ancient D1 and D2 regions (ΔD1, ΔD2, or ΔD1+2) (Figures 2C and S3E). RNA-seq in mutant E11.5 limb buds revealed that Fat1 expression was severely disrupted by deletion of the ancient D1 and D2 gene deserts but not the more recently emerged Zfp42R. Specifically, limb-wide Fat1 expression was reduced by 56%–67% in ΔD1 and ΔD1+2 mutants, corresponding with the loss of putative centromeric limb enhancers that include the validated Fat1-enh (Figures 2D and S3E). By contrast, Zfp42R genes remained inactive in wild type and all mutant limbs. Hence, in later development, Fat1 expression is driven by its ancient TAD regulatory landscape and distal enhancers, but these have no effect on Zfp42R gene expression.
In contrast, in ESCs, Fat1 expression remained universally unaffected in ΔD1, ΔD2, ΔD1+2, and ΔZfp42R mutants (Figures 2C, 2D, and S3E). Similarly, Zfp42R genes were unaffected by single ΔD1/ΔD2 or combined ΔD1+2 deletions, except Triml1/2 that showed mildly decreased activity in ΔD2 ESCs. Thus, in ESCs, Fat1 and Zfp42R genes utilize only local enhancers for activity within their physically isolated domains in the dismembered TAD. As such, during pluripotency, Fat1 and Zfp42R genes are functionally independent from one another in the now partitioned ancient regulatory landscape.
The Zfp42/Fat1 TAD is partitioned in ESCs independently of CTCF and cohesin
We next searched for the mechanism(s) that equip the ancient conserved TAD with such structural flexibility in ESCs. The current prevailing model is that TADs are formed by cohesin progressively extruding chromatin loops until blocked at CTCF boundaries (Fudenberg et al., 2016; Sanborn et al., 2015). As previously reported, binding sites for CTCF and the cohesin subunit Rad21 are enriched within Zfp42R specifically in ESCs (Figures 2B and S3A; Bonev et al., 2017). From this, we speculated that ESC-specific CTCF binding in Zfp42R blocks cohesin extrusion inside the center of the TAD, thereby driving locus restructuring.
We therefore globally depleted CTCF or Rad21 in ESCs (Figures S3F and S3G; Liu et al., 2021; Nora et al., 2017). As previously reported, most surrounding TADs and insulation collapsed once loop extrusion was either unconstrained (dCTCF) or eliminated entirely (dRad21) (Figures 2E and 2F; Liu et al., 2021; Nora et al., 2017; Rao et al., 2017). However, the Zfp42/Fat1 locus surprisingly continued to partition into four discrete domains. Therefore, Zfp42/Fat1 TAD partitioning in ESCs occurs independently of CTCF and loop extrusion and must instead be driven by one or several other dominant forces.
Compartmentalization dominates in ESCs to partition the Zfp42/Fat1 TAD
Beyond loop extrusion, chromatin is also antagonistically structured by the tendency of active or repressed chromatin to physically separate into mutually exclusive A and B compartments, respectively (Nuebler et al., 2018). Many B compartments then further interact with the NE to form repressive LADs (Falk et al., 2019; Rao et al., 2014; Robson et al., 2017). As the Zfp42/Fat1 TAD restructures into active and inactive domains independently of cohesin, we reasoned that altered compartmentalization at the NE could drive its partitioning in ESCs.
To examine this possibility, we comprehensively mapped E11.5 limb and ESC compartments by Hi-C and corresponding NE attachment by DNA adenine methyltransferase identification sequencing (DamID-seq) (Figures 3A and 3B; Allou et al., 2021; Vogel et al., 2007). To further directly link altered 3D structure and NE attachment simultaneously at single loci, we additionally applied polymer modeling and 3D-structured illumination microscopy (3D-SIM) (see Figure S4 and STAR Methods for summary) (Barbieri et al., 2012; Nicodemi and Prisco, 2009) (Beliveau et al., 2015; Gustafsson et al., 2008; Schermelleh et al., 2008; Szabo et al., 2018, 2020). For the latter, chromatin was visualized through Oligopaint fluorescence in situ hybridization (FISH) and the NE through Lamin B1 immunolabeling (Figure S4D). Through this modeling and microscopy, we successfully measured simulated and observed structural features, including object NE-proximity, intermingling, and geometric shape (sphericity) (Figures 3E and S4F–S4J). In all cases, trends extracted from modeling and microscopy closely overlapped and so will be described below interchangeably. However, both measurements can be viewed together for comparison in Figures S4F–S4J.
Figure 3.

The Zfp42/Fat1 TAD accommodates different chromatin environments in limb but is restructured into discrete compartments in ESCs
(A and B) cHi-C from E11.5 limb buds (A) and ESCs (B) with H3K27ac-ChIP-seq, compartments, and Lamin B1 DamID tracks and called LADs below. cHi-C is reproduced from Figures 1 and 2.
(C) Representative polymer model of locus with simulated NE (red) in E11.5 limbs (top) and ESCs (bottom).
(D) Representative immunoFISH Z-slice with Lamin B1 (red), D1+D2 (blue) and Zfp42R or Fat1 (green). Scale bar, 500 nm.
(E) FISH measurements from wild-type limb or wild-type, CTCF-depleted (dCTCF), and Rad21-depleted (dRad21) ESCs. Object centroid distance to the NE (left) and intermingling fraction with D1+D2 (right) measurements are shown. Gray line highlights median limb values for reference. ∗∗∗p < 0.001, ∗∗p < 0.01, ∗p < 0.05, and non-significant (ns) from Welch's t test comparisons between indicated samples. n = 16–138 alleles of at least two biological replicates.
(F) cHi-C and Lamin B1 DamID in ΔZfp42+Triml ESCs with gray lines highlighting deleted H3K27ac regions.
(G and H) Quantification of D1:D2 (G) and D1:Fat1 (H) cHi-C interactions in indicated samples.
Figure S4.

Comparison of SBS modeling with NE attachment and Oligopaint FISH and summary of ESC H3K27ac-deletion mutants, related to Figure 3
(A) Schematic representation of the modified strings-and-binders (SBS) polymer model. cHi-C contact maps were used to define PRISM-assigned chromatin binders. The chromatin polymer is then structured in silco through simulated DNA interactions created by the self-association between matching binders (Barbieri et al., 2012; Nicodemi and Prisco, 2009). Generated structures were subsequently dynamically attached to a modeled NE with polymer affinities determined from sample-matched DamID (see STAR Methods).
(B and C) Reconstructed contact maps from simulated limb structures before (B) and after (C) NE attachment with 0.4, 1.2, and 3.0 kTb interaction energies. Corresponding subtraction maps and representative structures are shown below. n = 25–88 simulations.
(D) Oligopaint FISH 3D-SIM imaging strategy. A library of single stranded DNA oligos with genomic homology and overhangs allow multiplexed staining of multiple regions of interest.
(E) Quantification of object NE-distance (left), intermingling fraction (middle) and sphericity (right) for simulated limb structures following at indicated NE-attachment energies. 1.2 kTb was selected for further analysis as it produced NE-proximities without deforming the structure’s intermingling or sphericity relative to FISH measurements.
(F–H) Comparison of simulated NE-attachment model at 1.2 kTb and experimental FISH data in wild-type E11.5 limbs and ESCs. Measurements are object NE-distance (F), intermingling fraction (G), and object sphericity with D1+D2 (H).
(I) Comparison of simulated and observed D1 and D2 intermingling fraction.
(J) Quantification of combined FISH sphericity of Zfp42R with D1+D2 in indicated samples. Gray line highlights median limb values for reference. ∗∗∗p < 0.001, ∗∗p < 0.01, and ∗p < 0.05 from Welch's t test comparisons. Non-significant (ns). FISH; n = 16–138 alleles of at least two biological replicates.
(K) Zooms of Zfp42R with indicated ESC H3K27ac, CTCF ChIP-seq, Lamin B1 DamID tracks below. Shaded boxes highlight deleted H3K27ac regions.
(L) cHi-C and DamID in ΔZfp42 ESCs.
(M) Published Micro-C of JM8.N4 ESCs where transcription is inhibited by flavopiridol (Hsieh et al., 2020). Arrows indicate Trim1/2, Zfp42 or Fat1 interactions with active chromatin and evasion of heterochromatin.
This revealed that active and inactive chromatin is successfully combined in the intact TAD in limbs but is partitioned into discrete compartments in ESCs. Specifically, in limbs, the inactive Zfp42R is incorporated with D1 and D2 into a large NE-attached B compartment that spans most of the TAD, as reported in other differentiated mouse and human cell types (Figures 3A, S3C, and S3D) (Takebayashi et al., 2012; van Schaik et al., 2020; Zhang et al., 2019). The strength of this NE attachment is above average, lying in the 88th percentile of LAD scores genome wide (Figure S3H). By contrast, Fat1 locates within an active A compartment and, together with its limb Fat1-enh, remains locally detached from the NE in the same domain. Thus, the intact limb TAD simultaneously supports multiple interacting inactive and active compartments.
However, despite successfully mixing in limbs, active and inactive chromatin is partitioned at the locus in ESCs. Active Fat1 and Zfp42R are now re-organized with their proximal enhancers into separated A compartments possessing reduced NE-proximity and lower intermingling with D1+D2 (Figures 3B–3E, S4F, and S4G). Conversely, D1 and D2 themselves remain as NE-attached B compartments but now poorly intermingle together (Figures 3B, S4F, and S4I). As a result, collective Zfp42R+D1+D2 or Fat1+D1+D2 sphericity is reduced in ESCs, thereby indicating the objects now exist as separated structures in a non-spherical elongated state (Figures 3B–3D and S4H). Critically, this partitioning in compartments further intensifies when loop extrusion is eliminated, as exemplified by reduced Zfp42R intermingling and combined sphericity with D1+D2 in dRad21 ESCs (Figures 3E and S4J). Combined, this suggests that antagonistic compartmentalization defined by chromatin state overrides loop extrusion in ESCs to disassemble the TAD.
To test this, we removed the active epigenetic signature from Zfp42R that is suggested to drive A compartments to physically separate from inactive chromatin (Rosencrance et al., 2020; Xie et al., 2022). Deleting the H3K27ac peaks that reportedly represent the Zfp42 and Triml1/2 promoters, and most nearby enhancers collapses TAD partitioning in ESCs (Sima et al., 2019). Specifically, removing H3K27ac at Zfp42 (ΔZfp42) and then Triml1/2 (ΔZfp42+Triml) causes NE attachment to progressively invade Zfp42R in ESCs (Figures 3F, S4K, and S4L). In parallel, D1+D2 cHi-C interactions are also progressively restored with both one another and Zfp42R, thereby partially reassembling the TAD (Figure 3G). However, full TAD restoration is prevented by Fat1’s continued association in an isolated active compartment that maintains its independent separation (Figure 3H). Critically, similar collapsed partitioning is not observed following ablation of transcription alone, confirming mutants disrupt locus structure by eliminating active chromatin and not Zfp42R gene transcription per se (Figure S4M; Hsieh et al., 2020).
In summary, chromatin state dominates the locus’s structure in ESCs through compartmentalization, thereby isolating Fat1 and Zfp42R genes with independent enhancers. During pluripotency, Zfp42R and Fat1 can thus operate as independent entities in their shared regulatory landscape.
LADs neither directly silence nor indirectly insulate Zfp42R genes
We now sought to dissect the later embryonic limb situation where Zfp42R genes remain inactive, despite contacting Fat1 and its distal limb (dl) enhancers in a shared intact TAD. LADs are compacted heterochromatin domains known to repress transcription (Leemans et al., 2019; Ou et al., 2017; Robson et al., 2016). Accordingly, we reasoned that the LAD environment of Zfp42R inactivates its genes in limbs, either by direct repression or by indirectly blocking communication with Fat1 enhancers.
To investigate this, we mapped the availability of Fat1 regulatory activity by integrating minimal β-globin (Glob) promoter-LacZ sensor constructs at seven positions within and one position outside the TAD (Symmons et al., 2014). LacZ staining of E12.5 embryos revealed all seven intra-TAD “sensor” locations recapitulated most of Fat1’s expression pattern, although subtle positional differences were observed (Figures 4A–4C). Critically, this sensor activity was abolished when integrated at Zfp42Rb in ΔD1+2 embryos that lack most of the TAD, confirming its dependence on Fat1 enhancers (Figures 4A–4C). Likewise, the sensor was activated entirely distinctly from Fat1 in the snout and external genitalia when insulated from its enhancers following integration outside the TAD near Frg1 (Figures 4B and S5B). Thus, the genomic positions of the inactive Zfp42R genes can paradoxically sample Fat1 enhancers within the TAD despite extensive surrounding and intervening heterochromatic LADs. In short, LADs neither directly silence Zfp42R genes nor indirectly block their communication with Fat1 enhancers.
Figure 4.

NE attachment neither blocks Zfp42R gene activation nor their communication with Fat1 enhancers
(A) Hi-C from wild-type and ΔD1+2 E11.5 limb buds, with the former reproduced from Figure 1.
(B) Staining of endogenous Fat1 (WISH, left) or integrated β-globin LacZ sensors (LacZ, right) in E12.5 embryos. n = 4–10 embryos. Integration sites are indicated by lines and their NE attachment in limb by black (LAD) or gray (non-LAD) boxes. Staining is indicated in the ear (e), distal limb (dl), proximal limb (pl), mammary glands (m), and face (f). Scale bar, 1 mm.
(C) Summary of gene, enhancer, and sensor activities with LAD-status indicated.
Figure S5.

Testing intrinsic promoter activities, bisulfite conversion cloning and generation and analysis of DNMT3A/B knockouts, related to Figures 4 and 5
(A) Triml2 and Zfp42 WISH stainings in E12.5 embryos. Scale bar is 1 mm.
(B) Staining from β-globin LacZ sensors integrated at Frg1 and Zfp42Rb in E13.0 embryos. n = 4–10 stained embryos per position.
(C) Zoom of Rosa26 safe harbor locus with CAGE, H3K27ac ChIP-seq and WGBS shown. Sensor integration site is indicated by the gray bar with insert transcription orientation matching Rosa26.
(D) LacZ stainings from E12.5 embryos with sensors driven by indicated promoters integrated at the Rosa26 locus.
(E) Strategy for Dnmt3b knockout in ESC clones with western blot confirmation shown below. DNMT3A increases following loss of DNMT3B.
(F) Schematic of bisulfite conversion cloning strategy with quantification of methylated CpGs at the endogenous or transplanted Zfp42 promoter in E11.5 limbs.
(G) Corresponding lollipop diagrams of Zfp42 promoter methylation (black methylated and white unmethylated CpGs).
(H and I) cHi-C from E11.5 DNMT3B−/− limb buds (H) with subtraction to wild type shown below (I).
Strict enhancer-promoter specificity cannot account for Zfp42R gene inactivity
As regulatory information is sampled throughout the intact limb TAD, we postulated that strict functional incompatibility of Zfp42R promoters with Fat1 enhancers maintains their later embryonic inactivity (van Arensbergen et al., 2014). We therefore exchanged the Zfp42, Triml1/2, or Fat1 core promoters into the LacZ regulatory sensor and positioned these constructs at Zfp42Rb, 20 kb from the endogenous Zfp42 promoter (Figure 5A). As a control, these modified sensor constructs were first integrated at the Rosa26 safe harbor locus to confirm their lack of autonomous, enhancer-independent transcription (Figure S5C). In all cases, no LacZ signal was observed at the enhancer-free Rosa26 locus (Figure S5D). By contrast, the transplanted Triml1/2, Zfp42, and Fat1 promoters integrated at Zfp42Rb all recapitulated the Fat1-like limb, face, and ear LacZ activity pattern observed with the previous β-globin sensor (Figure 5A). Thus, remarkably, Zfp42R and Fat1 promoter sequences are compatible with active Fat1 enhancers in the TAD in later embryos. Nevertheless, differences in Fat1 enhancers responsiveness were observed. qPCR in embryonic limbs demonstrated the Glob and Triml1/2 promoters drive 66% and 29% less lacZ RNA transcription, respectively, than their Fat1 and Zfp42 counterparts (Figure 5B). Likewise, the Fat1 promoter generated additional Fat1-expression domains, including the forebrain (fb) and limb apical ectodermal ridge (AER), thereby indicating some degree of selectivity exists (Figure 5A). However, despite this, it is clear that these differences in enhancer-promoter compatibility cannot explain complete Zfp42R gene inactivity in later embryos. Instead, this inactivity must be maintained by highly context-dependent promoter silencing.
Figure 5.

DNA methylation and not enhancer compatibility renders Zfp42 insensitive to Fat1 regulatory information
(A) E12.5 embryos stained for Fat1 WISH (left) or LacZ expression (right) driven at Zfp42Rb by the Triml1/2, Zfp42, Fat1, or β-globin (Glob) core promoters. n = 4–10 embryos. Staining indicated in the ear (e), mammary glands (m), face (f), forebrain (fb), proximal limb (pl), and apical ectodermal ridge (AER). Scale bar, 1 mm. WISH is reproduced from Figure 4.
(B) qRT-PCR expression analysis of Promotor-LacZ sensor mRNA in E12.5 limbs. Error bars, SD calculated from 3–8 biological replicates. ∗∗∗p < 0.001, ∗p < 0.05, and non-significant (ns) from Welch's t test comparisons.
(C) CAGE, H3K27ac, H3K27me3, H3K9me3, and WGBS tracks from ESCs and/or E11.5 limb buds. Cloned minimal promoters are highlighted in gray. Differentially methylated regions (DMRs) are denoted by black bars.
(D) RNA-seq expression effects of Dnmt3b knockout with or without D1+D2 deletion. Error bars: standard deviation calculated from 3–4 biological replicates. ∗∗∗p < 0.001, ∗p < 0.05, non-significant (ns).
(E) Staining of lacZ-tagged endogenous Zfp42 in wild-type and DNTM3B−/− E12.5 embryos. Scale bar, 1 mm.
DNA methylation desensitizes Zfp42 to limb enhancers
We thus sought to determine which repressive mechanisms could drive the context-dependent silencing of more recent Zfp42R genes in the embryonic limb. Analysis of published ChIP-seq identified no enrichment of H3K27me3 or H3K9me3 at Zfp42R promoters in E11.5 limbs, thereby ruling out both polycomb and classical heterochromatization as silencing mechanisms (Figure 5C; Gorkin et al., 2020). However, similar to past reports, our whole genome bisulfite sequencing (WGBS) identified differentially methylated regions (DMRs) between limb buds and ESCs that surround the Zfp42 and Triml1/2 promoters (Figure 5C; Borgel et al., 2010; Kim et al., 2014). Specifically, the DMRs at the Zfp42 or Triml1/2 promoters go from 13%–25% DNA methylation in ESCs to 57%–93% methylation in limb buds. Conversely, matching its on-going transcription, the Fat1 promoter remains permanently unmethylated in both tissues. Consequently, we reasoned that highly context-specific DNA methylation renders Zfp42R genes permanently insensitive to ancient Fat1-enhancer activities in later embryonic tissues. Supporting this, bisulfite conversion cloning demonstrated that DNA methylation is lost at the transplanted Zfp42 promoter when inserted only 20 kb from its endogenous location at Zfp42Rb (Figures S5F and S5G).
We thus generated E11.5 embryos lacking the de novo DNA methyltransferase 3B (Dnmt3b) (Figure S5E). WGBS in Dnmt3b−/− embryonic limbs confirmed a DMR denoting a 71% loss of methylation at the Zfp42 but not Triml1/2 or Fat1 promoters, as reported previously (Figure 5C; Borgel et al., 2010). Unfortunately, further reductions to DNA methylation in limbs was not possible as embryos lacking both DNMT3A and DNMT3B died before E11.5, as observed in past reports (data not shown) (Okano et al., 1999). This redundancy meant Triml1/2’s still methylated promoter remained transcriptionally repressed in E11.5 Dnmt3b−/− limbs. Nevertheless, Zfp42 displayed 6-fold upregulation when partially unmethylated and we confirmed this ectopic activity is driven by Fat1 enhancers (Figure 5D). Specifically, ectopic Zfp42 limb expression was abolished when most Fat1 enhancers were removed in double Dnmt3b−/−;ΔD1+D2 embryos (Figure 5D). Moreover, tagging the endogenous Zfp42 with LacZ demonstrated ectopic expression occurs in a Fat1-like pattern and only in E12.5 Dnmt3b−/− embryos (Figure 5E). Combined, this demonstrates the endogenous Zfp42 promoter is rendered insensitive to Fat1 limb enhancers by highly context-dependent silencing that is driven by at least DNMT3B-driven DNA methylation.
Nevertheless, we note two intriguing observations. First, Zfp42 was only activated in Dnmt3b−/− limbs to 1/25th of Fat1’s limb expression and to 1/150th of its maximal potential activity in ESCs. As such, additional redundant silencing, for example, by DNMT3A or alterative repressive mechanisms, likely operate simultaneously. Second, ectopic Zfp42 activation was associated with a ∼50% reduction in Fat1 expression, suggesting the competing use of Fat1 enhancers impairs the latter’s regulation (Figure 5D). However, this cannot be explained by altered enhancer-promoter contacts or TAD structure as neither was observably affected in Dnmt3b−/− limb cHi-C (Figures S5H and S5I).
Conflicting gene expression is common within multi-gene TADs
Our results indicate that at least two mechanisms can adapt single regulatory landscapes to host multiple expression programs in evolution. We thus globally quantified how pervasive such conflicting expression is in regulatory landscapes genome wide with available Hi-C and FANTOM5 expression data (Figure 6; Bonev et al., 2017; Consortium et al., 2014; Kraft et al., 2019). We find ∼12% of the ∼2,400 TADs found in several mouse cell types contained only a single gene that were collectively enriched in developmental GO-terms (Figure S6A; Eden et al., 2009). Thus, as previously suggested, a fraction of developmental loci are isolated alone within dedicated mono-gene TAD regulatory landscapes (Wu et al., 2021). Nevertheless, ∼88% of TADs contained multiple genes which we classified into ubiquitous (Ubiq.) or non-ubiquitous (non-Ubiq.) expression classes (Figures 6B, S6B, and S6C) (see STAR Methods). Thus, multi-gene TADs like the Zfp42/Fat1 domain dominate in the genome and frequently contain multiple non-Ubiq. “developmental” and/or Ubiq. “housekeeping” genes.
Figure 6.

Divergent promoter regulation is common in TADs throughout the genome
(A) Summary of TAD co-expression analysis. Gene pair co-expression was determined from FANTOM5 CAGE data, whereas TADs were identified in limb, cortical neuron (CN), and ESC Hi-C (Bonev et al., 2017; Consortium et al., 2014; Kraft et al., 2019; Lizio et al., 2015).
(B) Average frequency distribution of non-Ubiq. and Ubiq. genes in TADs.
(C) Fraction of co-expressing intra-TAD and inter-TAD gene pairs according to their linear separation. Lines represent a moving window average of 2,000 gene pairs.
(D) Frequency distribution of mean expression correlation between all non-Ubiq. genes in a domain for all multi-gene TADs.
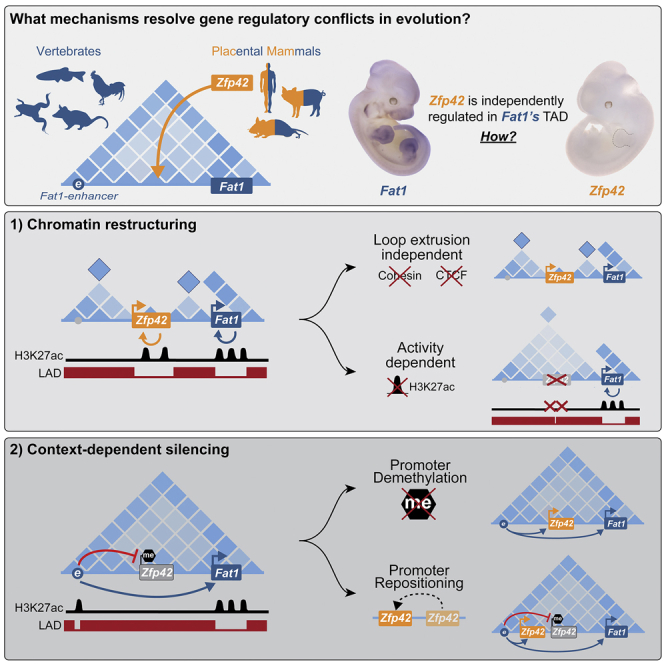
(E–G) Model for evolution of independent Zfp42R and Fat1 regulation.
(E) Fat1, its enhancers, and TAD existed together as a regulatory unit in all vertebrates despite frequent flanking synteny breaks. Zfp42 and Triml1/2 emerged with independent regulation in placental mammals.
(F) In limbs, Fat1 enhancers emerge from LADs and promiscuously sample promoters throughout the domain's both active and NE-attached inactive compartments. However, despite this and its functional compatibility with Fat1 enhancers, DNA methylation of Zfp42’s promoter prevents its activation.
(G) In ESCs, activity-driven compartmentalization and perhaps weakened loop extrusion restructures the TAD, thereby driving the Zfp42R and Fat1 genes to independently utilize only local enhancers.
See Figure S6.
Figure S6.

Summaries of co-expression analysis and genome-wide effects of DNA hypomethylation, related to Figure 6
(A) GO-term enrichment for genes within single-gene TADs (Eden et al., 2009).
(B) Classification of genes into non-ubiquitously (non-Ubiq.) and ubiquitously (Ubiq.) expressed classes according to their maximum and median expression across FANTOM5 CAGE samples.
(C) TAD and gene statistics in limb, CNs and ESCs.
(D) Mean observed/expected KR-normalized Hi-C contact frequency between intra-TAD or inter-TAD gene pairs. Lines represent a moving window average of 2,000 gene pairs. Non-Ubiq. gene co-expression strongly correlates with their increased contact frequency within TADs and, in particular, near TAD boundaries.
(E) non-Ubiq. and Ubiq. expression classification of genes that possess hypomethylated DMR promoters in DNMT3B−/− limbs. Unclassified reflects genes that were detected in limb RNA-seq but did not pass thresholds for classification into Ubiq. or non-Ubiq. FANTOM5 classes.
(F) Fraction of non-Ubiq. versus Ubiq. genes in each TAD of hypomethylated DMR promoters.
(G–I) Hi-C at the Dppa2/4 locus from E11.5mouse limb buds (G), mouse ESCs (H) morphologically stage-matched chicken limb buds (I). Matching CTCF and H3K27ac ChIP-seq, compartments and Lamin B1 DamID tracks are shown below. Dotted lines demarcate partitioned domains. Nectin3 and Trat (dark blue) occupy a large gene desert and TAD (light blue) into which Morc1 (orange) emerged in tetrapods. Dppa2 and 4 (orange) emerged later in eutherians. Like Zfp42R genes, Dppa2/4 and Morc1 are active in ESCs where they are isolated with local enhancers in a separate domain within a disassembled TAD (Sima et al., 2019).
We thus determined if multi-gene TADs support co-ordinated or divergent gene activities through co-expression analysis. We find so-called “developmental” non-Ubiq. genes, but not their “housekeeping” Ubiq. counterparts, were more frequently co-expressed when located within the same TAD, similar to past reports (Figure 6C; Flavahan et al., 2016; Nora et al., 2012; Shen et al., 2012; Zhan et al., 2017). Significantly, such gene co-expression correlated with the higher Hi-C contact frequency that occurs within TAD boundaries, suggesting that it is a product of increased shared enhancer interactions (Figure S6D). Despite this, most non-Ubiq. genes sharing a TAD are not co-regulated, and hence, only 5% of TADs display high mean co-regulation between all their hosted non-Ubiq. genes (Figure 6D) (see STAR Methods). Thus, like Zfp42/Fat1, conflicting developmental gene expression within shared TAD regulatory landscapes is a pervasive feature of the genome during evolution.
We finally tested the extent to which DNA methylation resolves these pervasive regulatory conflicts by expanding our analysis of Dnmt3b−/− limbs. We detected 594 promoters displaying hypomethylated DMRs that displayed distinct transcriptional responses to hypomethylation (42 upregulated, 4 downregulated, 546 unaffected). As we predicted, these behaviors were linked to a DMR promoter’s expression class and TAD environment. Upregulated DMR promoters were enriched in non-Ubiq. “developmental” genes and were located in TADs that contain a higher fraction of other non-Ubiq. genes (Figures S6E and S6F). By contrast, unaffected DMR promoters were enriched in Ubiq. “housekeeping” genes and were located within TADs that contain fewer non-Ubiq. genes. Thus, like Zfp42, lost DNA methylation preferentially activates promoters if they are (1) developmental and (2) exposed to the enhancers of other developmental loci in the same TAD.
Together, this indicates that regulatory conflicts arise frequently as genes emerge or are rearranged into shared domains during evolution. However, such conflicts can be resolved by DNA methylation-driven silencing, 3D restructuring, and likely additional cooperating mechanisms (Figures 6E–6G).
Discussion
TADs are frequently described as stable and conserved structural scaffolds that ensure transmission of enhancer activities to promoters found within a domain’s boundaries (Andrey and Mundlos, 2017). In this simple model, genes with similar functions can be controlled together in a shared TAD, whereas those requiring divergent regulation must be placed alone in separated domains (Wu et al., 2021). However, we find most TADs in the genome contain multiple independently regulated developmental genes as seen in previous studies of specific loci (e.g., the essential Hox genes) (Andrey et al., 2013; Huang et al., 2017; Noordermeer et al., 2011; Palstra et al., 2003; Soshnikova and Duboule, 2009). Consequently, a simple TAD regulation model cannot alone explain genome evolution. Instead, we show multiple mechanisms incorporated Zfp42R gene regulation without disrupting the pre-existing Fat1 landscape and its diverse reported physiological functions (Figures 6E–6G; Peng et al., 2021). As such, even single loci can easily incorporate conflicting regulatory programs in evolution and this capacity equips the genome with enormous regulatory complexity and flexibility. In human genetics, this also likely explains why many genomic rearrangements that create new enhancer-promoter combinations in shuffled TADs do not drive gene misexpression or disease (Despang et al., 2019; Laugsch et al., 2019). Specifically, because other mechanisms—including 3D-restructuring and context-dependent silencing—refine enhancer usage in regulatory landscapes.
We reveal that even evolutionarily stable TADs can be massively restructured to regulate transcription in specific cell types. However, unlike previous examples, we show this is unexpectedly driven independently of cohesin and CTCF by underlying chromatin activity (Bonev et al., 2017; Isoda et al., 2017). Specifically, the activity of the Zfp42 and Fat1 regions in ESCs drives the antagonistic tendency of active and inactive chromatin to spatially separate. As such, both genes become separated with independent enhancers in isolated domains. Intriguingly, other loci reportedly show similar activity-dependent isolation within larger existing TADs, including Dppa2/4, that we find also emerged in a pre-existing domain in placental mammals (Figures S6G–S6I; Sima et al., 2019). Thus, TADs are structured by compartmentalization as well as loop extrusion, and this can be altered for evolutionary adaptation. However, this further raises the exciting generalizable possibility that chromatin structure and underlying epigenetic state could both reciprocally drive and self-reinforce one another to control transcription.
We demonstrate that chromatin positioning at the NE in LADs need not have a deterministic role in regulating endogenous gene expression. Several groups have previously ectopically transplanted promoters to or from LADs in vitro and revealed the NE is a generally transcriptionally repressive environment (Finlan et al., 2008; Leemans et al., 2019; Reddy et al., 2008). Accordingly, retaining specific genes at the NE reportedly maintains their inactivity during in vitro differentiation (Poleshko et al., 2017; Robson et al., 2016). However, we find that Fat1 enhancers can still activate LacZ reporter genes despite their integration in LADs and extensive intervening lamina-association separating them. Thus, LADs are neither (1) sufficient to silence genes nor (2) effective insulators of enhancer-promoter communication. Instead, LADs can likely be readily restructured to allow genes to locally escape and activate when needed (Brueckner et al., 2020; Therizols et al., 2014). As such, LADs are not entirely inhospitable environments for gene regulation or the emergence of novel gene activities in evolution.
Instead, we find that extreme differences in expression in multi-gene TADs can be driven by a promoter’s exact endogenous position and sequence-context rather than its incompatibility with specific enhancers. Specifically, the Triml1/2 and Zfp42 promoters can be activated by embryonic Fat1 enhancers in their TAD, but only when relocated away from their endogenous positions. This is significant as the extent to which enhancer-promoter compatibility regulates mammalian transcription remains controversial and is largely examined outside of native contexts in episomal in vitro assays (Bergman et al., 2021; Martinez-Ara et al., 2022; Ray-Jones and Spivakov, 2021; van Arensbergen et al., 2014). As result, such approaches may fail to predict many endogenous gene expression outcomes found in native regulatory landscapes (Arnold et al., 2017; Martinez-Ara et al., 2022).
Last, we find that DNA methylation can drive context-dependent silencing but is not only targeted to genes by promoter sequence. Instead, we find promoter DNA methylation can be dependent on genomic position and, presumably, the sequence of the adjacent flanking DNA. We thus extend the features that target DNA methylation beyond the absence/presence of specific chromatin modifications (Ooi et al., 2007; Weinberg et al., 2021; Zhang et al., 2010). However, in doing so, we also demonstrate an additional means through which DNA methylation controls genes, not by suppressing a promoter’s intrinsic transcriptional activity but instead its sensitivity to enhancers. Importantly, this may explain why only minor gene expression defects are observed when DNA methylation is eliminated entirely in early embryos (Grosswendt et al., 2020; Yagi et al., 2020). In this view, misexpression would be limited to only unmethylated genes exposed to enhancers within shared landscapes and, even then, only in the specific cell types where those enhancers are active. However, we note that our inability to entirely eliminate DNA methylation and survey transcription in all cell types prevents testing the full extent of this regulation. Nevertheless, DNA methylation adds to the repressive mechanisms known to refine promiscuous enhancer usage within multi-gene TADs (Gjaltema et al., 2021; Noordermeer et al., 2011; Soshnikova and Duboule, 2009).
Limitations of the study
We find that regulatory conflicts are a generalizable feature of evolving genomes and are resolved by surprisingly diverse mechanisms. However, it will be necessary to determine the extent to which these or other mechanisms resolve the extensive regulatory conflicts that we observe at a genome-wide scale. Combining recent enhancer-promoter models with cell-type-specific measurements of promoter state and 3D structure will greatly aid this (Fulco et al., 2019; Nasser et al., 2021; Zuin et al., 2021). Moreover, doing so will be particularly significant for human genetics where we cannot reliably predict which patient genomic rearrangements will be benign or will create pathogenic regulatory conflicts. A second essential next step will be to also identify which exact DNA sequences and factors direct context-dependent promoter DNA methylation. Third, we did not observe new enhancer-promoter contacts when Zfp42 was demethylated and ectopically activated. It will thus be important to elucidate if this is due to the technical resolution limits of cHi-C or because enhancers require only weak and transient promoter contact to activate genes. Last, although not accounting for divergent Fat1-Zfp42 activity, we find promoters that can display at least 3-fold differences in sensitivity to enhancers in the same TAD. It will be critical to determine the molecular basis of these different promoter sensitivities, and most importantly, if they meaningfully resolve regulatory conflicts in other multi-gene TADs genome wide (Long et al., 2016; van Arensbergen et al., 2014).
STAR★Methods
Key resources table
| REAGENT or RESOURCE | SOURCE | IDENTIFIER |
|---|---|---|
| Antibodies | ||
| rabbit anti-H3K27ac | Diagenode | C15410174 |
| rabbit anti-H3K4me1 | Diagenode | C15410037 |
| rabbit anti-H3K27me3 | Merck Millipore | 07-449 |
| rabbit anti-H3K4me3 | Merck Millipore | 07-473 |
| rabbit anti-lamin B1 | Abcam | ab160486 |
| donkey anti-rabbit IgG-Atto647 | Sigma Aldrich | 40839 |
| Anti-DIG-AP, 150 U | Roche Diagnostics | 11093274910 |
| rabbit anti-DNMT3A | Abcam | ab188470 lot GR224165-2 |
| rabbit antiDNMT3B | Cell Signaling | cs48488, lot 1 |
| rabbit antiACTIN | Sigma Aldrich | A2066 |
| Bacterial and virus strains | ||
| One Shot TOP 10 Chemically Competent Cells E.c. | Thermo Fisher | C404006 |
| Chemicals, peptides, and recombinant proteins | ||
| Advantage cDNA polymerase | Clontech | 639105 |
| Agencourt AMPure XP magnetic beads | Beckman Coulter | A63880 |
| Auxin | Abcam | ab14642 |
| Biozym Blue S'Green qPCR Kit Separate ROX | Biozym | 331416S |
| BCIP, 3ml (150 mg) | Roche Diagnostics | 11383221001 |
| Biotin-14-dATP-50 nmol | Thermo Fisher Scientific | 19524016 |
| BM-Purple, AP-Substrat | Roche Diagnostics | 11442074001 |
| cOmplete, Mini, EDTA-free Protease Inhibitor Coctail | Sigma Aldrich | 4693159001 |
| Covaris micro TUBE AFA Fiber Pre-Slit Snap-Cap tubes | Covaris | SKU - 520045 |
| DMEM, high glucose, no glutamine | Thermo Fisher | 11960085 |
| DNA Pol. Large Fragm. (Klenow) | New England Biolabs | M0210L |
| Dnase,recombinant,RNase-free (10000 U) | Roche Diagnostics | 4716728001 |
| DpnI, recombinant | New England Biolabs | R0176L |
| DpnII, recombinant | New England Biolabs | R0543S |
| Dynabeads MyOne Streptavidin T1-10 mL | Thermo Fisher Scientific | 65602 |
| ESGRO(LIF) | Millipore | ESG1107 |
| Formamide deionized for molecular biology | PanReac AppliChem | APP A2156,1000 |
| FuGENE HD Transfection Reagent | Promega | E2311 |
| Gelatin 2% solution from bovine skin cell | Sigma Aldrich | G1393 |
| Heparin sodium salt | Sigma Aldrich | H3149 |
| Hygromycin B (50mg/ml) | Thermo Fisher | 10687010 |
| Knockout DMEM-500 ml | Thermo Fisher | 10829018 |
| L-glutamine (200mM) | Lonza | 882027-12 |
| Lent-X concentrator | Takara | 631232 |
| Library Efficiency DH5a Competent Cells | Thermo Fisher | 18263012 |
| Lipofectamine 2000 Transfection Reagent | Thermo Fisher Scientific | 11668019 |
| MEM Non Essential Amino Acids Solution | Thermo Fisher | 11140068 |
| NBT, 3ml (300 mg) | Roche Diagnostics | 11383213001 |
| NEBNext High-Fidelity 2X PCR Master Mix | New England Biolabs | M0541S |
| NEBNext Multiplex Oligos for Illumina | New England Biolabs | E7335, E7500 |
| NEBNext Quick Ligation Reaction Buffer (5X) | New England Biolabs | B6058S |
| NEBNext Ultra II Q5 Master Mix | New England Biolabs | M0544L |
| Opti-MEM I Reduced Serum Medium, GlutaMAX Supplement | Thermo Fisher | 51985026 |
| Penicillin/Streptomycin | Fisher Bioreagents | 10003927 |
| Proteinase K | Roche Diagnostics | 1000144 |
| Puromycin | SIGMA-ALDRICH | P8833 |
| Recombinant Human/Mouse FGF-8b Isoform | R&D Systems | #423-F8-025/CF |
| Recombinant Mouse Wnt-3a protein | R&D Systems | #1324-WN-010/CF |
| Ribonuclease A from bovine pancreas, Type 1-A, RNase A | Sigma Aldrich | R4875 |
| Rnase Inhibitor (2000 U) | Roche Diagnostics | 3335399001 |
| Roti-Phenol/ Chloroform/ Isoamylalcohol | Carl Roth | A156.2 |
| SP6-RNA Polymerase (1000 U) | Roche Diagnostics | 10810274001 |
| SYBR Green I | Thermo Fisher | S7563 |
| T4 DNA Ligase | New England Biolabs | M0202L |
| T4 DNA Polymerase | New England Biolabs | M0203L |
| T4 Polynucleotide Kinase NK | New England BioLabs | M0201 |
| T7-RNA Polymerase (1000 U) | Roche Diagnostics | 10881767001 |
| Tagment DNA Buffer | Illumnia | 15027866 |
| Tagment DNA Enzyme 1 (TDE1) | Illumnia | 15027865 |
| tRNA from Baker's Yeast | Sigma Aldrich | R6750 |
| Trypsin-EDTA (0.05%), phenol red | Thermo Fisher | 25300096 |
| Water for Injection (WFI) for cell culture | Thermo Fisher | A1287303 |
| X-beta-Gal min 99 %, BioScience-Grade | Carl Roth | 2315.3 |
| Cot-1 DNA | Invitrogen Life Technologies | 18440-016 |
| Critical commercial assays | ||
| 0.45 μm2 low protein-binding PES syringe filter | Millipore | SLHP003RS |
| Accel-NGS Methyl-seq DNA library kit | Zymo | DL-ILMMS-12 |
| Agencourt AMPure XP beads | Beckman Coulter | A63881 |
| EpiTect Bisulfite Kit | QIAGEN | 59104 |
| Dig-RNA-labeling Mix | Roche Diagnostics | 11277073910 |
| DNA Clean & Concentrator-5 kit | Zymo | D4013 |
| Dneasy Blood & Tissue Kit(50) | QIAGEN | 69504 |
| EpiTect Bisulfite Kits | QIAGEN | N/A |
| EZ DNA Methylation-Gold Kit | Zymo | D5005 |
| iDeal ChIP-seq kit for histones | Diagenode | C01010051 |
| KAPA HyperPrep kit for NGS DNA Library Prep | Roche | 7962363001 |
| MinElute PCR Purification Kit | QIAGEN | 28004 |
| MinElute Reaction Clean up kit | QIAGEN | 28206 |
| MycoAlert Assay Control Set | Lonza | LT07-518 |
| MycoAlert detection kit | Lonza | LT07-118 |
| NEBNext Multiplex Oligos for Illumina kit | New England Biolabs | E7500 |
| PureLink Genomic DNA Mini Kit | Thermo Fisher | K182002 |
| Quick Ligation™ Kit | New England Biolabs | M2200S |
| Rneasy Mini Kit | QIAGEN | 74104 |
| Vectashield | Vector laboratories | H-1000 |
| Zymo DNA Clean & Concentrator-5 kit | Zymo | D4013 |
| Zymo Quick-DNA/RNA Microprep Plus Kit | Zymo | D7005 |
| FISH Tag DNA Kit | Invitrogen Life Technologies | F32951 |
| Deposited data | ||
| Raw and processed sequencing data | This study | GEO: GSE185775 |
| Whole genome bisulphite sequencing | This study | GEO: GSE185765 |
| RNA-Seq in wildtype & mutant mouse E11.5 limbs and ESCs | This study | GEO: GSE185766 |
| Hi-C in chicken and mouse embryonic limbs | This study | GEO: GSE185768 |
| DamID-seq in wildtype mouse E11.5 limbs and ESCs | This study | GEO: GSE185771 |
| ChIP-seq in wildtype mouse ESCs | This study | GEO: GSE185772 |
| ATAC-seq in wildtype mouse E11.5 limbs | This study | GEO: GSE185774 |
| HiC in mouse ESCs after transcription inhibition | Hsieh et al., 2020 | 4DNES14CNC1I |
| Hi-C in mouse ESCs and Cortical Neurons | Bonev et al., 2017 | GEO: GSE96107 |
| Hi-C in mouse E11.5 limb buds | Kraft et al., 2019 | GEO: GSE116794 |
| ChIP-seq for CTCF, Rad21 and H3K9me3 in mouse ESCs and E11.5 limb buds | Kraft et al., 2019 | GEO: GSE116794 |
| ChIP-seq for H3K4me1, H3K4me3, H3K27ac and H3K27me3 in E11.5 limb buds | Andrey et al., 2017 | GEO: GSE84795 |
| ATAC-seq in mouse ESCs | Bauer et al., 2021 | GEO: GSE157448 |
| Fantom5 CAGE Expression datasets | Lizio et al., 2015 | https://fantom.gsc.riken.jp/5/data/ |
| DamID in mouse E11.5 limb cells | Allou et al., 2021 | GEO: GSE137335 |
| Hi-C in mouse inner cell mass and 8-cell embros | Du et al., 2017 | GEO: GSE82185 |
| Hi-C and H3K27ac & CTCF ChIP-seq in human ESCs and cardiomyocytes | Zhang et al., 2019 | GEO: GSE116862 |
| Hi-C in 48 hr hpf Zebrafish | Yang et al., 2020 | GEO: GSE134055 |
| Hi-C in xenopus brain | Niu et al., 2021 | SRA: PRJNA606649 |
| Hi-C in pig embryonic fibroblasts | Li et al., 2020 | GEO: GSE153452 |
| DamID in human RPE and ESCs | van Schaik et al., 2020 | 4D nucleome |
| ChIP-seq for H3K36me3 in mouse ESCs | Encode | GEO: GSE31039 |
| ChIP-seq for CTCF in chicken | Jerković et al., 2017 | GEO: GSE86089 |
| scRNA-seq in gastrulating E6.5-8.5 mouse embryos | Pijuan-Sala et al., 2019 | ArrayExpress: E-MTAB-6967 |
| scRNA-seq in E9.5-E12.5 mouse embryos | Cao et al., 2019 | GEO: GSE119945 |
| scRNA-seq in E9.5-E14.5 mouse placentas | Marsh and Blelloch, 2020 | GEO: GSE152248 |
| Experimental models: Cell lines | ||
| G4 ESCs (XY, 129/Sv x C57BL/6 F1 hybrid) | Georg et al., 2007 | N/A |
| CTCF-AID-GFP E14 ESCs | Nora et al., 2017 | N/A |
| Rad21-AID-GFP E14 ESCs | Liu et al., 2021 | N/A |
| ∗mutant ESC lines are listed in Table 1 | This study | N/A |
| 293FT | Thermofisher | R70007 |
| Experimental models: Organisms/strains | ||
| Wild-type and mutant mice derived from G4 ESCs | This study | N/A |
| Opossums (Monodelphis domestica) | Naturkunde Museum, Berlin | N/A |
| Chicken (Gallus Gallus) | Valo Biomedia | N/A |
| Oligonucleotides | ||
| Zfp42/Fat1 cHi-C libary | This study | mm10, chr8: 39022300-48000000 |
| DamID oligos and primers see Table S2 | Vogel et al., 2007 | N/A |
| WISH probe primers see Table S2 | This study | N/A |
| Genotyping primers see Table S2 | This study | N/A |
| Cloning primers see Table S2 | This study | N/A |
| Oligopaint probes see Table S3 | This study | N/A |
| Recombinant DNA | ||
| pLGW-Dam-V5-Lamin B1 (Mm) | Steensel Lab | N/A |
| pLGW-V5-Dam | Steensel Lab | N/A |
| pMD2.G | Bird Lab | N/A |
| psPAX2 | Bird Lab | N/A |
| BAC for Fat1R | CHORI/BACPAC | RP23-451E23 |
| pX459 pSpCas9(BB)-2A-Puro vector | Addgene | #62988 |
| Fat1 promoter 302bp | This study | chr8: 44935221 - 44935522 |
| Zfp42 promoter 602bp | This study | chr8: 43306912 - 43307513 |
| Triml promoter 427bp | This study | chr8: 43180161 - 43180587 |
| Fat1 enhancer | This study | chr8: 41591354 - 41594915 |
| Knockin donor vectors & corresponding pX459 sgRNAs see Table S1 | This study | N/A |
| Software and algorithms | ||
| CRISPR design | https://www.benchling.com | N/A |
| R | https://www.r-project.org | N/A |
| MACS2.0 | https://github.com/taoliu/MACS | N/A |
| Bowtie2 | Langmead and Salzberg, 2012 | N/A |
| Samtools | http://samtools.sourceforge.net | N/A |
| HiCUP v0.8.1 | Wingett et al., 2015 | N/A |
| Cooltools | https://zenodo.org/record/5214125 | N/A |
| Juicer | Durand et al., 2016 | N/A |
| Genrich | https://github.com/jsh58/Genrich/ | N/A |
| UCSC genome browser | https://genome.ucsc.edu | N/A |
| WashU browser | https://epigenomegateway.wustl.edu | N/A |
| HMMt | https://github.com/gui11aume/HMMt | N/A |
| Other | ||
| FISH and SBS-modelling statistics summary see Table S5 | This study | N/A |
| List of bridging species for conservation analysis see Table S6 | This study | N/A |
Resource availability
Lead contact
Further information and requests for resources and reagents should be directed to, and will be fulfilled by, the lead contact Michael I. Robson (robson@molgen.mpg.de).
Material Availability
All unique/stable reagents generated in this study are available from the lead contact without restriction.
Experimental model and subject details
Mouse G4 ESCs (XY, 129S6/SvEvTac x C57BL/6Ncr F1 hybrid) were grown as described previously on a mitomycin-inactivated CD1 mouse embryonic fibroblast feeder monolayer on gelatinised dishes at 37oC, 7.5% CO2 (Andrey and Spielmann, 2017; George et al., 2007). CTCF-AID-GFP and Rad21-AID-GFP E14 ESCs were cultured feeder-free on gelatinised dishes at 37oC, 7.5% CO2. All ESCs were cultured in ESC medium containing knockout DMEM with 4,5 mg/ml glucose and sodium pyruvate supplemented with 15% FCS, 10 mM Glutamine, 1x penicillin/streptomycin, 1x non-essential amino acids, 1x nucleosides, 0.1 mM beta-Mercaptoethanol and 1000 U/ml LIF. Medium was changed every day while G4-cells were split every 2-3 days or were frozen at 1x 10⁶ cells/cryovial in ESC medium containing 20% FCS and 10% DMSO. ESCs and feeder cells were tested for Mycoplasma contamination using the MycoAlert detection kit and MycoAlert Assay Control Set.
E11.5 limb cells were isolated from C57BL/6 embryonic limbs through trypsinization, filtration (40 μm) and centrifugation. Cell suspensions were then plated on gelatine-coated plates at 37oC in 5.0% CO2 in DMEM/F12 supplemented with 10% FCS, 4 mM L-Glutamine, 1x penicillin/streptomycin, 250 ng/ml Recombinant Mouse Wnt-3a protein and 150 ng/ml Recombinant Human/Mouse FGF-8b Isoform.
Mutant embryos and mutant live animals were produced through tetraploid or diploid aggregation, respectively (Artus and Hadjantonakis, 2011). Female mice of the CD1 strain were used as foster mothers. Mutant lines were established and maintained by crossing with wildtype C57Bl.6/J animals. All mice were housed in a centrally controlled environment with a 12 h light and 12 h dark cycle, temperature of 20–22.2 °C, and humidity of 30–50%. Bedding, food and water were routinely changed. All animal procedures were conducted as approved by the local authorities (LAGeSo Berlin) under the license numbers G0176/19, G0247/13 and G0243/18.
HH22 and HH24 Chicken embryos were extracted from fertilised chicken eggs (Valo Biomedia) incubated at 37.8oC, 45% humidity.
Embryonic stages of opossum originated from the breeding colony of Monodelphis domestica maintained under permit ZH104 (issued by the local authority, LAGeSo) in the animal care facility of the Museum für Naturkunde, Berlin. All opossums were housed in a centrally controlled environment with a reversed 12 h dark and 12 h light cycle, temperature of 24–26 °C, and humidity of 60-65%. Bedding, food and water were routinely changed. Females were euthanized using an overdose of Isoflurane under T0198/13 (issued by LAGeSo) according to national and international standards. Samples were taken immediately after death was confirmed. To culture opossum embryonic fibroblasts (OEFs), stage 30 embryos were isolated and the heads removed by dissection. Following, cells were isolated through trypsinization, filtration (100 μm) and centrifugation. Cell suspensions were then plated on gelatine-coated plates at 37oC in 5.0% CO2 in ESGRO Complete Basal Medium with supplement until a stable line of OEFs was established.
Method details
Plasmid Construction
SgRNAs were designed at desired structural variant breakpoints or knockin sites using the Benchling design tool (https://www.benchling.com/). Complementary sgRNA oligos were subsequently annealed, phosphorylated, and cloned into the BbsI site of dephosphorylated pX459 pSpCas9(BB)-2A-Puro vector (Addgene; #62988). For insertion of lacZ sensors, asymmetric homology arms surrounding insertion sites were first synthesised with a multiple cloning site that bisected, and so inactivated, the sgRNA. Once homology arms were cloned into a vector, the lacZ sensor insert harbouring the β-globin minimal promoter and polyA terminator were subsequently inserted by restriction digest (Symmons et al., 2014). For testing alternative promoters, the β-globin promoter was substituted for synthesized or PCR-amplified Zfp42, Triml1/2, or Fat1 promoters through restriction cloning. In all cases, core promoters incorporate at least 250 bp upstream and 50 bp downstream of the major endogenous TSS-defined in FANTOM5 CAGE transcriptomes (Figure 5C; key resources table). The bidirectional Triml1/2 promoter was inserted to enable lacZ transcription from the Triml2 orientation. For enhancer lacZ reporter experiments, the mouse Fat1-enh sequence was PCR-amplified and inserted into a phosphoglycerate kinase (PGK) promoter targeting vector containing FRT sites for insertion into C2 ESCs. A list of sgRNAs, corresponding homology constructs and resulting mutant ESCs can be found in Table S1. Cloned enhancer and promoter sequences can be found in the key resources table. All plasmids are available on Addgene.
CRISPR-mediated genome editing
CRISPR was subsequently performed as described previously (Kraft et al., 2015). Briefly, 300,000 G4 ESCs (George et al., 2007) were seeded on CD1 feeders 16 h prior to transfection. For structural variants, ESCs were transfected with 4 μg of both sgRNAs targeting each breakpoint using FuGENE HD according to manufacturer’s instructions. For site-specific knockins, ESCs were transfected with 8 μg of the sgRNA and 4 μg of the homology construct. After 24 h, transfected cells were transferred onto puromycin-resistant DR4 feeders and treated with puromycin for 48 h. ESCs were grown for a further 4-6 days after which colonies were picked and transferred to CD1 feeders in 96-well plates. Plates were subsequently split into triplicates after 2-3 days, two for freezing and one for DNA harvesting. Following lysis and genotyping, selected clones were expanded from frozen plates after which genotypes were reconfirmed. Potential structural variant and knockin ESC clones were first identified by PCR-detection of unique deletion breakpoints or site-specific insertion breakpoints, respectively. Desired homozygous or heterozygous copy number were then determined by qPCR. All cell lines and corresponding genotyping primers can be found in Tables S1 and S2.
Enhancer Reporter Line Generation
The flippase (FLP)-flippase recognition target (FRT) system was used to introduce enhance-LacZ reporter constructs into C2 ESCs. This modified ESC line contains a phosphoglycerate kinase neomycin selection cassette flanked by FRT sites and a promoter- and ATG-less hygromycin cassette targeted downstream of the Col1A1 locus (Beard et al., 2006). 800,000 C2 ESCs were seeded onto a feeder-coated 6-well plate and transfected with 9 μg of targeting construct, 3 μg FLP-encoding vector, 1 μl Lipofectamine LTX Plus reagent (Thermo Fisher Scientific), 20 μl Lipofectamine LTX in a to a final OptiMEM volume 250 μl. After 24 h, transfected C2 cells were transferred onto hygromycin-resistant DR4 feeders and treated with hygromycin B (final concentration 150 μg/ml) in ES growth medium for 5-10 days. Colonies were then picked and transferred to CD1 feeders in 96-well plates. Plates were subsequently split into triplicates after 2-3 days, two for freezing and one for DNA harvesting. Following lysis and genotyping, selected clones were expanded from frozen plates after which genotypes were reconfirmed. Genetically modified C2 ESCs were used to produce embryos through diploid aggregation, and genotyping confirmed the presence of the desired mutations in the cells and later in the embryos. Enhancer reporter cell lines and corresponding genotyping primers can be found in Tables S1 and S2.
Auxin induced CTCF and Rad21 depletion
Available CTCF-AID-GFP and Rad21-AID-GFP E14 ESCs were treated with 500 μM auxin for 48 h and between 1-6 h, respectively (Liu et al., 2021; Nora et al., 2017). Successful depletion was confirmed through lost GFP signal by FACS. For CTCF-AID-GFP ESCs, bulk cell populations were plated on coverslips for FISH or directly fixed for cHi-C. For cHi-C on Rad21-AID-GFP ESCs, auxin-treated G1 cells were isolated by FACS following fixation and lysis for cHi-C and subsequent DAPI staining. For FISH on Rad21-AID-GFP ESCs, depleted cells were plated on coverslips following 2 h auxin-treatment where only modest changes to cell-cycle had occurred.
Western blot
2 million mESCs were collected and then washed twice in PBS. The cell pellet was then resuspended in cell lysis buffer (2 5mM HEPES pH7.6, 5 mM MgCl2, 25 mM KCl, 0.05 mM EDTA, 10% Glycerol, 0.1% IGEPAL, 1X Roche protease inhibitor, 1mM DTT). Nuclei were pelleted from the cell lysate by centrifugation for 5 minutes at 1500 rpm. The nuclei were then washed once (10mM HEPES pH7.6, 3 mM MgCl2, 100 mM KCl, 0.01 mM EDTA, 10% glycerol, 1X Roche protease inhibitor, 1 mM DTT) and centrifuged at 3000g for 5 minutes. Nuclei were then resuspended in 150 μl RIPA Buffer and vortexed for 20 minutes at 4°C. This mixture was spun at 12,000 rpm for 15 minutes and the supernatant was collected for blotting. Western blots were performed with anti-Dnmt3a (1:2000) and anti-Dnmt3b (1:1000) and imaged using HRP chemiluminescence.
Tetraploid morula complementation
Mutant ESCs were seeded on CD1 feeders, grown for 2 days and then subjected to diploid or tetraploid aggregation, as previously described (Artus and Hadjantonakis, 2011). CD1 female mice were used as foster mothers. Genotypes of resulting embryos or animals was determined by genotyping PCR as performed in originating ESCs.
Whole mount in situ hybridization
mRNAs were detected in embryos by WISH using digoxigenin-labelled antisense RNA probes transcribed from cloned mouse, opossum and chicken genomic sequences. Whole embryos were fixed overnight in 4% PFA/PBS, washed in PBS-Tween (PBST; 0.1% Tween) and then dehydrated for at least 10 min each in 25%, 50% and 75% methanol/PBST. Embryos were finally stored at −20°C in 100% methanol. For staining, embryos were rehydrated on ice in reversed methanol/PBST steps, washed in PBST, bleached in 6% H2O2/PBST for 1 h on ice. Following washing in PBST, embryos were then treated with 10 μg/ml proteinase K/PBST for 3 min, incubated in glycine/PBST, washed in PBST, and finally refixed for 20 min in 4% PFA/PBS, 0.2% glutaraldehyde, and 0.1% Tween 20. Following washing in PBST, embryos were incubated at 68°C in L1 buffer (50% deionized formamide, 5× saline sodium citrate, 1% SDS, 0.1% Tween 20 in diethyl pyrocarbonate, pH 4.5) for 10 min. Embryos were then incubated for 2 h at 68°C in hybridisation buffer 1 (L1 with 0.1% transfer RNA and 0.05% heparin). Afterwards, embryos were incubated overnight at 68 °C in hybridisation buffer 2 (hybridisation buffer 1 with 0.1% transfer RNA and 0.05% heparin and 1/500 digoxigenin probe). After overnight hybridisation, unbound probe was removed by 3 x 30 minute washing steps at 68°C in L1, L2 (50% deionized formamide, 2 × saline sodium citrate pH 4.5, 0.1% Tween 20 in diethyl pyrocarbonate, pH 4.5), and L3 (2 × saline sodium citrate pH 4.5, 0.1% Tween 20 in diethyl pyrocarbonate, pH 4.5). Subsequently, embryos were treated for 1 h with RNase solution (0.1 M NaCl, 0.01 M Tris pH 7.5, 0.2% Tween 20, 100 μg/ml RNase A in H2O), followed by washing in Tris-buffered saline, 0.1% Tween 20 (TBST 1) (140 mM NaCl, 2.7 mM KCl, 25 mM Tris-HCl, 1% Tween 20, pH 7.5). Embryos were then blocked for 2 h at room temperature in blocking solution (TBST 1 with 2% fetal bovine serum and 0.2% bovine serum albumin (BSA)), followed by incubation at 4 °C overnight in blocking solution containing 1:5,000 anti-digoxigenin-alkaline phosphatase. After overnight incubation, unbound antibody was removed by 6 × 30 min washings steps at room temperature with TBST 2 (TBST with 0.1% Tween 20 and 0.05% levamisole/tetramisole) and left overnight at 4 °C. At the next day, embryo staining was initiated by 3x 20 min washing steps in alkaline phosphatase buffer (0.02 M NaCl, 0.05 M MgCl2, 0.1% Tween 20, 0.1 M Tris-HCl and 0.05% levamisole/tetramisole in H2O) 3 × 20 min, followed by staining with BM Purple AP Substrate (Roche). At least three embryos were analysed from each mutant genotype. The stained embryos or their limb buds were imaged using a ZEISS SteREO Discovery.V12 with cold light source CL9000 microscope and Leica DFC420 digital camera. The sequences of primers used to generate Triml2, Zfp42, Fat1 are listed in Table S2.
LacZ staining in embryos
Whole-mount lacZ reporter staining was performed as previously described with minor adjustments (Lobe et al., 1999). E11.5 mouse embryos were dissected in cold PBS, fixed in 4% paraformaldehyde (PFA) in PBS on ice for 20 min and washed three times in lacZ buffer (2 mM MgCl2, 0.01% sodium deoxycholate, 0.02% Nonidet P-40 in PBS). Embryos were then incubated in staining solution (0.5 mg ml−1 X-gal, 5 mM potassium ferrocyanide, 5 mM potassium ferricyanide in lacZ buffer) at 37°C for a few hours to overnight until desired staining was achieved. Following staining, embryos were washed in lacZ buffer and stored at 4°C in 4% PFA in PBS. Finally, embryos were imaged using a ZEISS SteREO Discovery.V12 with cold light source CL9000 microscope and Leica DFC420 digital camera. LacZ signal was scored in at least 4 replicate embryos and was performed independently by at least two annotators blinded to genotype.
qRT-PCR
Hindlimb buds from somite staged E12.5 embryos were dissected, snap-frozen and stored at −80 °C until further processing. Following RNA isolation, cDNA was generated and LacZ mRNA levels quantified by qPCR for at least 3 biological replicates with each in technical triplicate. 2-ΔΔCt method has been used for analysis of relative lacZ expression levels. qPCR primers used: qPCR_LacZ_F, 5′-TTCAACATCAGCCGCTACAG-3′; qPCR_LacZ_R, 5′-CGTCGATATTCAGCCATGTG -3′; qPCR_mGAPDH_F, 5′-TCAAGAAGGTGGTGAAGCAG-3′ and qPCR_mGAPDH_R 5′-ACCACCCTGTTGCTGTAGCC-3′.
RNA-seq
Isolated ESCs were trypsinized, heavily feeder depleted, centrifuged and snap frozen. E11.5 forelimb buds were microdissected from wildtype and mutant embryos in cold PBS and immediately snap-frozen for storage at −80°C. Total RNAs were extracted using the RNeasy Mini Kit according to the manufacturer’s instructions. Samples were poly-A enriched, prepared into libraries using the Kapa HyperPrep Kit, and sequenced on a Novaseq2 with 75 bp or 100 bp paired-end reads. RNA-seq experiments were performed at least in duplicates.
Sample collection for DamID-seq, ChIP-seq, ATAC-seq, cHi-C and FISH
ESCs were trypsinized, heavily feeder depleted and pelleted by centrifugation. Chicken, opossum and mouse limb buds were microdissected from embryos in cold PBS. Isolated limbs were then trypsinised 5 minutes at 37°C with continuous agitation with a P1000 pipette until no visible clumps remained. Limb cell suspensions were then passed through a 40 μm filter, centrifuged at 250 g for 5 min. Supernatants were then removed from isolated ESCs or limb cells which could then be used for downstream applications.
DamID-seq
Lentiviral preparation and treatment
DamID was performed as described previously (Robson and Schirmer, 2016). Briefly, lentiviruses encoding the Dam methylase alone (pLgw V5-EcoDam) or fused to lamin B1 (pLgw-EcoDam-V5-Lamin) were generated in 293FT cells. Here, ∼6 million 293FT cells were transfected with 2.8 μg pMD2.G, 4.6 μg psPAX2, and 7.5 μg of pLgw V5-EcoDam or pLgw-EcoDam-V5-Lamin with 36 μl lipofectamine 2000 in 3 ml Optimem. After 16 h, 293FT media was replaced. Virus-containing supernatants were subsequently aspirated after 48 h and 72 h. Viral supernatants were then cleared of cellular debris by 10 min centrifugation at 3,500 rpm and subsequent filtration through a 0.45 μm2 low protein-binding PES syringe filter. Viral supernatants were finally purified using the Lent-X concentrator as per manufacturer's instructions and resuspended in Optimem. If not used immediately, aliquots were frozen at -80°C.
To perform DamID, ESCs and cultured E11.5 limb cells were transduced with DamID lentiviruses and harvested 72 or 48 h later, respectively. Specifically, 1,5x10⁵ ESCs were plated feeder-free onto gelatinized 6 well 1 h prior to transduction with DamID lentiviruses. Transduction was then performed overnight after which virus-containing media was removed and cells were plated with feeders in 6 cm plates. After 48 h, contaminating feeders were removed by further feeder-depletion and pure ESCs were isolated by centrifugation. By contrast, isolated E11.5 limb bud cells were directly plated and transduced after 1 h. Virus-containing media was removed 24 h later after which cells were isolated after an additional 48 h.
DamID library processing
DamID sample processing was then performed as described previously (Robson and Schirmer, 2016). Briefly, DNA was extracted from cells using the DNeasy tissue lysis kit as per manufacturer’s instructions. 2.5 μg of extracted DNA was then digested by DpnI and, following heat inactivation of DpnI, was ligated to the DamID adaptor duplex (dsAdR) generated from the oligonucleotides AdRt (5’-CTAATACGACTCACATAGGGCAGCGTGGTCGCGGCCGA-GGA-3’) and AdRb (5’-TCCTCGGCCG-3’) after which DNA was further digested by DpnII. To amplify DNA sequences methylated by the Dam methylase, 5 μl of DpnII digested material was then subjected to PCR in the supplied buffer in the presence of the 1.25 μM Adr-PCR primer (5’-GGTCGCGGCCGAGGATC-3’), 0.2 mM dNTPs and 1X of the Advantage cDNA polymerase. PCR was performed as previously described after which amplified DNA was purified, processed into NGS libraries using the KAPA HyperPrep kit and analyzed for quality by Bioanalyzer analysis. standard protocols. DamID-seq samples were sequenced 75 or 100 bp paired-end reads and each experiment was performed in duplicates for sequencing.
ATAC-seq
ATAC-seq was performed as described previously (Buenrostro et al., 2015). Briefly, 1x10⁵ isolated E11.5 limb cells were employed per biological replicate. Cells were washed in cold PBS, lysed in fresh lysis buffer (10mM TrisCl pH7.4, 10mM NaCl, 3mM MgCl2, 0.1% (v/v) Igepal CA-630) for 2 min on ice, and finally pelleted for 10 min at 500 x g and 4°C. Following supernatant aspiration, nuclei-containing pellets were subjected to transposition using Tn5 Transposase for 30 min at 37° C. Resulting DNA was then purified using MinElute Reaction Clean up kit, eluted in 11 μl of elution buffer and stored in -20° C, if not immediately processed further. Barcoded adapters were added to the transposed fragments by PCR. To avoid saturation in our PCR, we initially performed 5 cycles and extracted a 5 μl aliquot for qPCR to identify the number of cycles required without overamplification. Nextera qPCR primers were used for the amplification. The remaining 45 μl of the PCR reaction were then amplified for the desired number of cycles which never exceeded 12. Finally, samples were purified on AMPure XP beads and eluted in 20 μl. Concentration was measured with Qubit and the quality of the samples was estimated by Bioanalyzer analysis. ATAC-seq samples were sequenced yielding for 50 million 75 bp paired-end reads and each experiment was performed in duplicate.
ChIP-seq
ChIP-seq was performed using the iDeal ChIP-seq kit for histones with several modifications. Briefly, ESCs were fixed in 1% paraformaldehyde (PFA)/10% FCS/PBS for 10 min with rotation at room temperature. Fixation was stopped by glycine after which cells were pelleted by centrifugation (8 min, 250 x g, 4°C). Cells were lysed in Lysis buffer (50 mM Tris, pH 7.5; 150 mM NaCl; 5 mM EDTA; 0.5% NP-40; 1.15% Triton X-100; protease inhibitors) for 10 min on ice. Nuclei were resuspended in sonication buffer (10 mM Tris–HCl, pH 8.0; 100 mM NaCl; 1 mM EDTA; 0.5 mM EGTA; 0,1% Na-deoxycholate; 0.5% N-lauroylsarcosine; protease inhibitors). Chromatin was sheared using a Bioruptor until reaching a fragment size of 200–500 base pairs. Afterwards, samples were processed with the iDeal ChIP-seq kit according to the manufacturer’s instructions. For each Histone ChIP 5 μg chromatin was used in combination with antibodies against H3K4me1 (1 μg) H3K4me3 (1 μg), H3K27ac (1 μg) and H3K27me3 (1 μg). Libraries were prepared for sequencing using the KAPA HyperPrep kit and their quality confirmed by Bioanalyzer analysis. ChIP-seq libraries were finally sequenced at 100 bp paired-end reads with all samples analyzed in biological duplicates.
ChIPmentation
For chicken embryonic limb buds, ChIPmentation libraries were prepared as previously described (Schmidl et al., 2015). Briefly, dissociated limb cells were filtered through a 70 μm MACS® SmartStrainer before fixation with 1% MeOH-free formaldehyde in PBS on ice for 10 minutes. Fixation was quenched using glycine, and the pellet was collected after centrifugation (3000rpm, 5 min, 4°C. Cells were then lysed in lysis buffer (10mM Tris pH 8.0, 100mM NaCl, 1mM EDTA pH 8.0, 0.5mM EGTA, 0.1% Sodium deoxycholate, 0.5% N-lauroylsarcosine) on ice, before shearing with a Covaris E220 for a fragment distribution of 200-700bp. Sheared chromatin was incubated with appropriate histone antibodies overnight at 4C. Antibody-bound chromatin was immunoprecipitated with Dynabeads™ Protein G. Tn5-mediated ”tagmentation” of pull-downed chromatin was incubated at 37°C for 5min. Chromatin was de-crosslinked with Proteinase K at 65°C overnight. DNA was then purified using the MinElute Reaction Cleanup kit.
Nextera indexing primers (single-indexed) were added during library amplification. The number of PCR cycles for each library was estimated using Ct values as determined by qPCR (where number of cycles = rounded up Ct value +1). After amplification, DNA was cleaned up with AmPure XP beads, and then checked on a TapeStation D5000 HS for size distribution. Size selection was then carried out accordingly, with either a left-sided selection or a double-sided selection. The concentration of final eluted DNA was measured using Qubit HS and checked again on a TapeStation D5000HS. All libraries were sequenced on a Novaseq2 using 100bp paired-end reads. The same histone antibodies used for traditional ChIP-seq were also used here for ChIPmentation.
WGBS
Genomic DNA was extracted from ESCs and E11.5 limb buds using the PureLink Genomic DNA Mini Kit following manufacturer’s instructions. gDNA was then sheared in Covaris micro TUBE AFA Fiber Pre-Slit Snap-Cap tubes. Next, the sheared gDNA was purified with the Zymo DNA Clean & Concentrator according to manufacturer’s instructions. Purified DNA was then bisulfite converted using the EZ DNA Methylation-Gold Kit, and WGBS libraries were processed using the Accel-NGS Methyl-seq DNA library kit following manufacturer’s recommendations for each. Libraries were prepared and cleaned using Agencourt AMPure XP beads. The absence of adapters from the final libraries was verified using the Agilent TapeStation. WGBS libraries were sequenced on the NovaSeq6000 yielding 150 base pair paired-end reads.
Bisulfite-cloning sequencing
Genomic DNA from E11.5 forelimbs was obtained using Quick-DNA/RNA Microprep Plus Kit. Bisulfite conversion was performed on 1μg of DNA using the EpiTect Bisulfite Kit. Bisulfite-treated DNA was PCR amplified by nested PCR at the Zfp42 promoter and subsequently cloned into a pbluescript vector and sequenced. 10-20 clones from 2 replicates per samples were Sanger sequenced and a total of 12 CpG were analysed with BiQ Analyzer software (Bock et al., 2005).
Capture Hi-C (cHi-C)
SureSelect design: The cHi-C SureSelect library was designed over the genomic interval (mm10, chr8: 39022300-48000000) using the SureDesign tool from Agilent.
Fixation: Disassociated ESCs and limb cells were transferred to a 50-ml falcon tube and complemented with 10% FCS/PBS. 37% formaldehyde was added to a final concentration of 2% and cells were fixed for 10 min at room temperature. Crosslinking was quenched by adding glycine (final concentration; 125 mM). Fixed cells were washed twice with cold PBS and lysed using fresh lysis buffer (10 mM Tris, pH 7.5, 10 mM NaCl, 5 mM MgCl2, 0.1 mM EGTA with protease inhibitor) to isolate nuclei. Cell lysis was assessed microscopically after 10-min incubation in ice. Nuclei were centrifuged for 5 min at 480g, washed once with PBS and snap frozen in liquid N2.
cHi-C library preparation and sequencing: 3C libraries were prepared from fixed nuclei as described previously (Kragesteen et al., 2018). Briefly, lysis buffer was removed by centrifugation at 400 g for 5 min at 4 °C, followed by supernatant aspiration, snap-freezing, and pellet storage at − 80 °C. Later, nuclei pellets were thawed on ice, resuspended in 520 μl 1× DpnII buffer, and then incubated with 7.4 μl 20% SDS shaking at 900 rpm. at 37 °C for 1 h. Next, 75 μl 20% Triton X-100 was added and the pellet was left shaking at 900 rpm at 37°C for 1 h. A 15-μl aliquot was taken as a control for undigested chromatin (stored at − 20°C). The chromatin was digested using 40 μl 10 U/μl DpnII buffer shaking at 900 rpm at 37°C for 6 h; 40 μl of DpnII was added and samples were incubated overnight, shaking at 900 rpm. at 37°C. On day three, 20 μl DpnII buffer was added to the samples followed by shaking for an additional 5 h at 900 rpm. at 37 °C. DpnII subsequently was inactivated at 65 °C for 25 min and a 50-μl aliquot was taken to test digestion efficiency (stored at − 20 °C). Next, digested chromatin was diluted in 5.1 ml H2O, 700 μl 10× ligation buffer, 5 μl 30 U/μl T4 DNA ligase and incubated at 16°C for 4 h while rotating. Ligated samples were incubated for a further 30 min at room temperature. Chimeric chromatin products and test aliquots were de-cross-linked overnight by adding 30 μl and 5 μl proteinase K, respectively, and incubated at 65 °C overnight. On the fourth day, 30 μl or 5 μl of 10 mg ml−1 RNase was added to the samples and aliquots, respectively, and incubated for 45 min at 37°C. Next, chromatin was precipitated by adding 1 volume phenol-chloroform to the samples and aliquots, vigorously shaking them, followed by centrifugation at 4,000 rpm at room temperature for 15 min. To precipitate aliquot chromatin, 1 volume 100% ethanol and 0.1 volume 3M NaAc, pH 5.6 was added and the aliquots placed at -80°C for 30 min. DNA was then precipitated by centrifugation at 5,000 rpm. for 45 min at 4°C followed by washing with 70% ethanol, and resuspension in 20 μl with 10 mM Tris-HCl, pH 7.5. To precipitate samples, extracted sample aqueous phases were mixed with 7 ml H2O, 1 ml 3M NaAc, pH 5.6, and 35 ml 100% ethanol. Following incubation at −20°C for at least 3 h, precipitated chromatin was isolated by centrifugation at 5,000 rpm for 45 min at 4 °C. The chromatin pellet was washed with 70% ethanol and further centrifuged at 5,000 rpm for 15 min at 4 °C. Finally, 3C library chromatin pellets were dried at room temperature and resuspended in 10 mM Tris-HCl, pH 7.5. To check the 3C library, 600 ng were loaded on a 1% gel together with the undigested and digested aliquots. The 3C library was then sheared using a Covaris sonicator (duty cycle: 10%; intensity: 5; cycles per burst: 200; time: 6 cycles of 60 s each; set mode: frequency sweeping; temperature: 4–7 °C). Adaptors were added to the sheared DNA and amplified according to the manufacturer’s instructions for Illumina sequencing (Agilent). The library was hybridised to the custom designed SureSelect beads and indexed for sequencing (75–100 bp paired-end) following the manufacturer’s instructions (Agilent).
Hi-C
Hi-C libraries were prepared as described in a previously published in situ protocol (Melo et al., 2020; Rao et al., 2014). Briefly, ∼1 million cells were fixed in 2% formaldehyde, lysed, and digested overnight with DpnII enzyme. Digested DNA ends were marked with biotin-14-dATP and ligated overnight using T4 DNA ligase. Formaldehyde crosslinking was reversed by incubation in 5 M NaCl for 2 h at 68°C, followed by ethanol precipitation. A S-Series 220 Covaris was used to shear the DNA to fragments of 300–600 bp for library preparation, and biotin-filled DNA fragments were pulled down using Dynabeads MyOne Streptavidin T1 beads. DNA ends were subsequently repaired using T4 DNA polymerase and the Klenow fragment of DNA polymerase I and phosphorylated with T4 Polynucleotide Kinase NK. DNA was further prepared for sequencing by ligating adaptors to DNA fragments, using the NEBNext Multiplex Oligos for Illumina kit. Indexes were added via PCR amplification (4–8 cycles) using the NEBNext Ultra II Q5 Master Mix. PCR purification and size selection were carried out using Agencourt AMPure XP beads. Libraries were sequenced on a NovaSeq2 platform yielding 100 or 150 bp paired-end reads. For each sample, the Hi-C library was created by pooling a total of four technical replicates generated from two different cell isolations cultures in order to ensure higher complexity of the sequencing library.
Oligopaint fluorescence in situ hybridization with 3D-SIM imaging
Oligopaint library assembly: Oligopaint libraries were constructed as described previously (Beliveau et al., 2015); see the Oligopaints website (https://oligopaints.hms.harvard.edu) for further details. Libraries were ordered from CustomArray in the 92K Oligo pool format. The mm10 coordinates, size, number, density of oligonucleotides and primers used for the libraries are listed in Table S3. Oligopaint oligos were identified using the mm10 ‘balance’ BED files, which consist of 35–41-mer genomic sequences throughout the regions of interest (Beliveau et al., 2018). BED files can be retrieved from the Oligopaints website. Each library contains a universal primer pair followed by a specific primer pair hooked to genomic sequences (119-125 mer oligonucleotides). Oligopaint libraries were produced by emulsion PCR amplification from oligonucleotide pools followed by a ‘two-step PCR’ procedure and the lambda exonuclease method described by Beliveau et al. (2015). The two-step PCR leads to the addition of a specific binding sequence for signal amplification with a secondary oligonucleotide (Sec1-Alexa 488 for green probes or Sec6-Atto 565 for red probes) containing two additional fluorophores. Consequently, each probe carries three fluorophores in total. This strategy allows for the 2-color imaging between different combinations of the oligopaint probes. All oligonucleotides used for Oligopaint production were purchased from Integrated DNA Technologies. Oligonucleotide primer sequences (5′→3′) used for this approach are listed in Table S3.
BAC probe preparation
The BAC probe corresponding to the Fat1 gene was labeled with the Alexa Fluor 555 using the FISH Tag DNA Kit.
FISH and immunostaining
FISH was performed as described previously (Szabo et al., 2020). Briefly, 1,5-2 x10⁵ isolated ESCs or E11.5 limb cells were plated from single-cell suspensions onto 0.01% poly-lysine coated coverslips (170 ± 5 μm) for 2 h. Cells were fixed for 10 min in PBS/4% PFA, washed three times in PBS, incubated for 10 min in PBS/0.5% Triton X-100, washed three times in PBS, incubated for 10 min in 0.1 M of HCl and washed twice in 2× SSC/0.1% Tween 20 (2× SSCT). Cells were then incubated in 50% formamide/2× SSCT (20 min at room temperature followed by 20 min at 60 °C). Hybridisation solution was made with 20 μl of FISH hybridisation buffer (50% formamide, 10% dextran sulfate, 2× SSC and salmon sperm DNA (final concentration 0.5 mg/ml)), 0.8 μl of RNase A (10 mg/ml) and Oligopaint probes (primary and secondary probes at 1–3 μM final concentration). When required, co-hybridization of Oligopaints with the Fat1 BAC probe was performed using 25 ng of BAC probe together with a 50x excess of mouse Cot-1 DNA. Hybridisation solution was deposited on coverslips that were then sealed on glass slides with rubber cement. Slides were placed on a heating block immersed in a water bath for 3 min at 80 °C for denaturation. Probe hybridisation was performed overnight at 42 °C in a dark and humid chamber. Coverslips were removed from glass slides and washed for 15 min in 2× SSCT at 60 °C, 10 min in 2× SSCT at room temperature, 10 min in 0.2× SSC and in PBS. Cells were then washed in PBS/0.1% Tween 20 (PBT) and incubated for 1 h in PBT/2%BSA. Primary antibody (ant-lamin B1, 1:1,000 dilution in PBT/2% BSA) incubation was performed overnight at 4 °C between coverslips and glass slides in a humid and dark chamber. Cells were washed four times in PBT and secondary antibody (anti-rabbit-IgG-Atto 647, 1:100 dilution in PBT/2% BSA) incubation was performed for 1 h at room temperature between coverslips and glass slides in a dark and humid chamber. Last, cells were washed in PBT, stained with DAPI (final concentration at 1 μg/ml in PBS) and washed at least 3 times for 5 min each in PBS. Coverslips were mounted on slides with VECTASHIELD and sealed with nail polish.
Image acquisition
3D-SIM imaging was carried out with a DeltaVision OMX V4 microscope equipped with an ×100/1.4 numerical aperture (NA) Plan Super Apochromat oil immersion objective (Olympus) and electron-multiplying charge-coupled device (Evolve 512B; Photometrics) camera for a pixel size of 80 nm. Diode lasers at 405, 488, 561 and 647 nm were used with the standard corresponding emission filters. Z-stacks (z-step of 125 nm) were acquired using 5 phases and 3 angles per image plane. Raw images were reconstructed using SoftWorx v.6.5 (GE Healthcare Systems) using channel-specific optical transfer functions (pixel size of reconstructed images = 40 nm). TetraSpeck beads (200 nm) (T7280, Thermo Fisher Scientific) were used to calibrate alignment parameters between the different channels. The quality of reconstructed images was assessed using the SIMcheck plugin of ImageJ v.1.52i (Ball et al., 2015).
Quantification and statistical analysis
RNA-seq differential expression analysis
Single-end, 100 bp reads from Illumina sequencing were mapped to the reference genome (mm10) using the STAR mapper (splice junctions based on RefSeq; options: --alignIntronMin20 --alignIntronMax500000 --outFilterMismatchNmax 10). Differential gene expression was ascertained using the DESeq2 package (Love et al., 2014). The cut-off for significantly altered gene expression was an adjusted P value of 0.05.
Single cell RNA-seq
The expression of Triml2, Zfp42, and Fat1 genes was investigated in three sc-RNAseq datasets of early mammal development, whole placenta (Marsh and Blelloch, 2020), whole embryo gastrulation (Pijuan-Sala et al., 2019), and whole embryo organogenesis (Cao et al., 2019). For visualization, we used the originally reported Uniform Manifold Approximation and Projection (UMAP) embeddings for the whole placenta and the gastrulation datasets and the t-Distributed Stochastic Neighbor Embedding (tSNE) for the organogenesis dataset. Likewise, we used the reported cell type definitions for visualization. For the whole placenta dataset, we used the “integrated_snn_res.0.6” cell variable to color cell types. UMI counts for Triml2, Zfp42, and Fat1 were plotted for all datasets in the range 0 to >2.
DamID-seq analysis
Raw reads from DamID-seq experiments were mapped to the mouse mm10 reference genome using the alignment tool BWA-MEM (v.0.7.12) (Li and Durbin, 2009). The counts of mapped reads overlapping a DpnII (GATC) restriction fragment side were normalized by reads per kilobase, divided by the length of the fragment, per million mapped reads (RPKM). Based on these normalized counts the log2 fold change between the Dam–Lamin B1 transduced samples and the respective Dam-only-encoding samples was calculated. Finally, LADs were called within 20 kb bins using HMMt which quantifies DamID signal using a modified Baum-Welch algorithm with t emissions (https://github.com/gui11aume/HMMt).
ATAC-seq analysis
Raw sequencing fastq files were processed using cutadapt (Martin, 2011) for adapter trimming, Bowtie2 {Langmead, 2012 #2898) for mapping, SAMtools (Li et al., 2009) for filtering, sorting and removing duplicates, and deepTools (Ramírez et al., 2016) for generating coverage tracks.
ChIP-seq analysis
Raw sequencing fastq files were processed using STAR (Dobin et al., 2013) for mapping, SAMtools (Li et al., 2009) for filtering, sorting and removing duplicates, and deepTools (Ramírez et al., 2016) for generating coverage tracks.
Enhancer prediction
Enhancers were predicted using a series of established tools for ATAC-seq peak prediction and enhancer / promoter prediction. First, Genrich (not published, https://github.com/jsh58/Genrich/) was used to predict ATAC-seq peaks. We filtered for those that overlap a enhancer predicted by CRUP (Ramisch et al., 2019) and do not overlap an annotated TSS (UCSC) or a promoter predicted by eHMM (Zehnder et al., 2019).
Enhancer conservation analysis
ATAC-seq peaks and predicted enhancers were projected between mouse, opossum and chicken using a published stepped pairwise sequence alignment approach across multiple bridging species (Baranasic et al., 2021). For a genomic region with conserved synteny, any non-alignable coordinate can be approximately projected from one genome to another by interpolating its relative position between two alignable anchor points. The accuracy of such interpolations correlates with the distance to an anchor point. Therefore, projections between species with large evolutionary distances tend to be inaccurate due to a low anchor point density. Including so-called bridging species increases the anchor point density and thus improves projection accuracy. The optimal choice and combination of bridging species may vary from one genomic location to another. This presents a shortest path problem in a graph where every node is a species and the weighted edges between nodes correspond to a scoring function that represents the distances of genomic locations to their anchor points (|x - a|). The scoring function exponentially decreases with increasing distances |x - a|. The shortest path problem is solved using Dijkstra’s Shortest Path Algorithm (Dijkstra, 1959). The sets of bridging species used here are described in Table S6.
Projected elements from ATAC-seq peaks were then classified into directly (DC), indirectly (IC) or not conserved (NC) according to the following criteria: DC elements overlap a direct sequence alignment between the reference and the target species. IC elements do not overlap a direct alignment, but are projected with a score > 0.99, i.e. either overlapping or in direct vicinity to a multi-species anchor. A score of > 0.99 means that the sum of the distances from the element and its intermediate projections to their respective anchor points is < 150 bp throughout the optimal bridging species path. The remaining peaks are classified as non-conserved (NC).
cHi-C and Hi-C analysis
cHi-C analysis
Raw fastq files had read lengths of 75 bp and 100 bp, respectively. In a preprocessing step, fastq files with 100 bp read length were trimmed to 75 bp to achieve comparable initial read lengths for all samples. Afterwards, fastq files were processed with the HiCUP pipeline v0.8.1 (no size selection, Nofill: 1, Format: Sanger) for mapping, filtering and deduplication steps (Wingett et al., 2015). The pipeline was set up with Bowtie 2.4.2 for mapping short reads to reference genome mm10 (Langmead and Salzberg, 2012). If replicates were available, they were merged after the processing with the HiCUP pipeline. Binned and KR normalized cHi-C maps (Knight and Ruiz, 2013; Rao et al., 2014) were generated using Juicer tools v1.19.02 (Durand et al., 2016). Only read pairs for region chr8:39,030,001-48,000,000 and with MAPQ≥30 were considered for the generation of cHi-C maps.
In addition to the original cHi-C maps, custom reference genomes were derived from mm10 for the ΔD1+2 deletion line. cHi-C and Hi-C maps were displayed as linear-scaled heatmaps in which very high values were truncated to improve the visualization.
Hi-C analysis
Fastq files were processed with the Juicer pipeline v1.5.6 (Durand et al., 2016) (CPU version) using bwa v0.7.17 (Li and Durbin, 2010) for mapping short reads to the reference genomes mm10 (mouse), hg19 (human), galGal6 (chicken), monDom5 (opossum), susScr11.1 (pig), and AmexG_v6.0-DD (axolotl), respectively. Replicates were merged after the mapping, filtering and deduplication steps of the Juicer pipeline. Juicer tools v1.7.5 (Durand et al., 2016) were used to generate binned and KR normalized Hi-C maps from read pairs with MAPQ≥30.
For compartment analysis, hic-files were converted at 100kb bin size to the cool format using hic2cool (v0.8.2) (https://github.com/4dn-dcic/hic2cool) and balanced using cooler (v0.8.5) (Abdennur and Mirny, 2020). Afterwards, compartment analysis was performed using cooltools (v0.3.0) (https://github.com/open2c/cooltools) and using the GC content as reference track.
TADs were identified by applying TopDom v.0.0.228 on 50-kb binned and KR-normalized maps using a window size of 10 (Shin et al., 2016). Insulation scores were calculated using Cooltools (https://github.com/open2c/cooltools/tree/v0.4.1)
Gene co-regulation in TADs analysis
To calculate gene-expression correlations, we downloaded FANTOM stage 5’ CAGE TPM data (https://fantom.gsc.riken.jp/5/data/). We discarded samples annotated as belonging to ‘reference’ ‘whole body’ or similar samples, and also excluded testis and related tissues from the analysis. We also removed all libraries with fewer than 1 million reads, and all peaks with less than 32 reads across all samples. Overlapping each peak with the Gencode M23 annotation, we assigned peaks to genes if they overlapped a Gencode exon for that gene, or were less than 200bp upstream of a TSS. Peaks not overlapping a gene were discarded, and the counts for all of a gene’s peaks were summed.
Since the FANTOM data contained the resulting gene x sample count matrix was then normalized as per (Alam et al., 2020) – normalized counts-per-million for each sample. As many of the sample in the FANTOM CAGE data were highly correlated (due e.g. to being replicates or adjacent time points), we performed hierarchical clustering on the 829 remaining datasets, and then merged libraries with a pearson correlation of 0.95 or greater, resulting in a final 349 metasamples. Co-expression between two genes was then defined as pearson correlation across these 349 metasamples.
To identify housekeeping genes (Figure S6B), we replicated the procedure used by FANTOM previously (Consortium et al., 2014). Here, the 2D density of median and maximum normalized expression over all samples is first plotted, and then setting a cutoff on median expression that separated ubiquitous from non-ubiquitous genes. To assess the relationship between co-expression and linear gene distance separation or TAD co-occupancy and co-expression we next identified TADs in ESCs, E11.5 limb buds and cortical neurons (Bonev et al., 2017; Kraft et al., 2019). Plotting co-expression as a function of distance revealed, as expected, a strong relationship between linear proximity in the genome and co-expression. Since genes sharing TADs are necessarily more likely to be closely spaced, we plotted (log10) linear distance against co-expression separately for pairs either sharing or not sharing a TAD, pooling gene pairs with similar linear distance in a moving average over 2000 points. Mean Corr. Values were calculated by averaging correlations for all gene pairs within a TAD (Figure 6C).
WGBS processing
Raw reads were subjected to adapter and quality trimming using cutadapt (version 2.4; parameters: --quality-cutoff 20 --overlap 5 --minimum-length 25; Illumina TruSeq adapter clipped from both reads), followed by trimming of 10 nucleotides from the 5’ end of the first read, 15 nucleotides from the 5’ end of the second read and 5 nucleotides from the 3’ end of both reads (Kechin et al., 2017). The trimmed reads were aligned to the mouse genome (mm10) using BSMAP (version 2.90; parameters: -v 0.1 -s 16 -q 20 -w 100 -S 1 -u -R) (Xi and Li, 2009). Duplicates were removed using the ‘MarkDuplicates’ command from GATK (version 4.1.4.1; --VALIDATION_STRINGENCY=LENIENT --REMOVE_DUPLICATES=true) (McKenna et al., 2010). Methylation rates were called using mcall from the MOABS package (version 1.3.2; default parameters) (Sun et al., 2014). All analyses were restricted to autosomes and only CpGs covered by at least 10 reads and at most 150 reads were considered for downstream analyses.
Differentially methylated region (DMR) calling
DMRs were called using metilene (version 0.2-8; parameters: -m 10 -d 0.2 -c 1 -f 1) (Jühling et al., 2016) using two replicates per condition and filtered for a Q-value < 0.05. DMRs were assigned to overlap a promoter if 20% of the DMR or 20% of the promoter overlapped using bedtools ‘intersect’ (Quinlan and Hall, 2010). Genes on the X, Y or M chromosome were not considered for the analysis as these chromosomes were omitted from the methylation analysis. Promoters with and without DMRs were then subsequently assigned to the TAD with the maximum overlap.
SBS-polymer modelling with NE-attachment
We simulated the 3D structure of the Fat1/Zfp42 locus in ESC and E11.5 limb buds using a Strings and Binders Switch (SBS) polymer model that incorporates NE-attachment as described below (Barbieri et al., 2012; Chiariello et al., 2016; Nicodemi and Prisco, 2009).
Polymer model
Briefly, the SBS polymer model simulates a chromatin filament as a string with beads, possessing potential binding sites for specific interacting molecules (binders). The binder concentration and bead-binder interaction energies control the system’s state through a coil-globule transition occurring when they are above a threshold (Barbieri et al., 2012; Chiariello et al., 2016). The type and location of binding sites specific for different regions of the Zfp42/Fat1 locus were inferred from ESC or E11.5 limb cHi-C data using PRISMR (mm10 chr8: 40300000 - 46200000; 20 Kb resolution) (Bianco et al., 2018). This machine-learning based algorithm returns the minimal arrangement of binding sites to fit the input. As output, the best polymer modelling the Fat1/Zfp42 locus was generated with 13 distinct types of binding sites in each condition. From these polymers, we obtain a set of 3D structures representing chromatin conformations in ESC and E11.5 limb through standard Molecular Dynamics simulations (see below).
Details of Molecular Dynamics simulations
In order to build an ensemble of 3D structures representing the Fat1/Zfp42 locus in E11.5 limb and ESC cell lines, we perform extensive Molecular Dynamics (MD) simulations (Chiariello et al., 2016). For simplicity, bead and binders have the same diameter and mass in dimensionless units. A standard truncated Lennard-Jones (LJ) potential models the hard-core repulsion between the objects. By contrast, interaction between beads and binders is modelled with an attractive LJ potential with distance cutoff ranging from to and an interaction intensity, given by the minimum of the LJ potential, within the range of . An additional non-specific, weaker interaction (in the range) is set among binders and the polymer. Consecutive beads of the polymer are linked by FENE bonds (Kremer and Grest, 1990) with standard parameters (length and spring constant ). Beads and binders move through Brownian dynamics according to the standard Langevin equation (Allen and Tildesley, 2017) with temperature , a friction coefficient and an integration time step (dimensionless units). The polymer is first initialized as a Self-Avoiding-Walk and the binders are randomly located in the simulation box, then the system is equilibrated up to approximately 108 timesteps. From each model, we perform up to 102 independent simulations in which polymer configurations are sampled every 5∗105 timestep once equilibrium is reached. Simulations are performed with the LAMMPS package (Plimpton, 1995).
Modelling the nuclear envelope
To model the NE, we introduce a spherical wall of radius within the simulation box. Polymer beads can attractively interact with NE though a short range, truncated LJ potential with affinity ranging from to and cutoff distance . Among the NE-bead interaction energies tested, the structures obtained immediately after the NE-polymer adsorption (around ) generated structural measurements that most closely matched those observed by FISH (Figure S4). Alternatively, beads interact with NE only through a purely repulsive LJ potential. The NE sphere radius is set to . In order to define the interaction state (repulsive or attractive) of each polymer bead with NE, we employ DamID data for each wild or mutant ESC/limb sample. Briefly, we compute the average DamID signal in each 20kb window and evaluate its sign. Polymer beads associated with an average positive DamID signal are classified as attractively interacting with NE. Conversely, beads associated with a negative signal experience only a repulsive interaction. In this way, regions enriched with DamID tend to attach to the NE in the model. In our simulations, the NE is introduced after the SBS (polymer+binders) system is equilibrated, as described in the previous section. Then, in order to ensure the complete interaction of the polymer with the NE, the system is equilibrated up to other 7∗107 timesteps.
Quantification of measurements
Pairwise distance distributions are extracted from the population of 3D polymer structures as previously described (Chiariello et al., 2016; Conte et al., 2020). For each pair of objects, we first compute the center of mass of the polymer beads belonging to that object, then we evaluate the distance between the centers of mass. This distance is then averaged over the last 20 frames of each simulation. In order to map dimensionless length scale into physical units we compare pairwise distances measured by FISH. In total, we compare six different probe pairs (D1-D2, Fl1-Fl2, Zfp42R-D1, Zfp42R-D2, Zfp42R-Fl1, Zfp42R-Fl2) both in E11.5 limb and ESCs, for each pair we equalize the model and experimental median and then average over the different probe pairs. The resulting length scale mapping factor is .
Distances from NE shown in Figures S4E and S4F are estimated by computing: , where is the model NE radius, is the position of the center of mass of the object and is the position of the NE center. Physical distances are then obtained using the mapping factor previously calculated from the comparison with pairwise FISH distances.
Pairwise overlaps between two objects shown in Figure S4I are obtained by using the following expression: , where and are the surfaces of 2D projections associated to object 1 and object 2 respectively and is their common area. For simplicity, 2D projections are approximated as circles whose radii and are estimated as gyration radii from the projected coordinates, so and . In this way, overlapping areas can be easily estimated using standard geometric relations. Indeed, given the distance between the centers of the projected objects and supposing, without loss generality, , we have a partial overlap if . In this case: , where and (analogous relations hold for and ). If , we impose , i.e. objects are well separated in space; finally, if , we set , i.e. object 1 is completely contained within object 2. Three body overlaps shown in Figures S4E and S4G involving Zfp42R or Fat1 with D1+D2, are defined as: , where object 1 can be Zfp42R or Fat1. As for 3D distances, overlap values are averaged over the last 20 frames of each simulation. Analogously, a geometric mapping factor of 1.2 is found when comparing with pairwise experimental medians.
Sphericity is defined using the standard formula: , where and are area and volume of the object respectively. Area and volume are estimated from the coordinates of the polymer beads belonging to the region under consideration by means of a 3D convex hull approximation, computed with the Python package scipy.spatial. Sphericity measurements can be viewed in Figures S4E and S4H.
Contact maps are computed as previously described (Chiariello et al., 2016; Conte et al., 2020). We first measure the distance between any two beads and . If the distance is lower than threshold ( in Figures S4B and S4C), the beads are in contact. For each considered condition (without NE and with NE at different interaction energies), aggregated matrices are obtained over the different independent simulations. Visual and quantitative comparisons reveal a general good agreement between model and cHi-C data in both cell lines (Pearson and distance-corrected (Bianco et al., 2018) Pearson in HL, and in ESC, genomic distances ). Subtraction matrices are defined as the simple bin-wise difference , where and are the entries of the contact maps with and without NE respectively.
Polymer graphics
Polymer 3D snapshots shown in Figures 3 and S4 are representative single molecule structures taken from real MD simulations. Regions corresponding to Fl1, D1, Zfp42R, D2, Fat1, Fl2 are differently colored. A slice of the simulated NE is rendered as a thick spherical wall colored as in FISH imaging. To clarify the relationship between the polymer and NE, each image is presented from the same point-of-view through a geometrically calibrated 3D rotation matrix. For visual purposes, polymers are shown in a coarse-grained version of a smooth third-order polynomial spline passing through bead coordinates.
See Table S5 for a summary of statistical measurements from polymer modelling.
Oligopaint FISH image analyses
Image analysis was performed using Fiji and MATLAB (R2018-2019 and image processing toolbox). For overlap intermingling fraction and combined sphericity measurements, z-stacks of regions of interest (ROIs) of 3×3 μm2 surrounding FISH signals were extracted and smoothed using a 3D Gaussian filter (sigma = 0.5 pixel). FISH channels were then segmented in 3D using automatic Otsu’s method. Only ROIs containing 1 FISH segmented object per channel (or at least 1 object for the combined D1+D2 FISH) larger than 0.04 μm3 were kept for further analyses. Object intermingling fraction of Zfp42R or Fat1 with D1+D2 (Figures 3D and S4) was obtained by dividing the overlapping volume between Zfp42R or Fat1 and D1+D2 by the volume of Zfp42R or Fat1. Overlap (Figures 3D and S4) correspond to the Jaccard Index between the two segmented FISH objects. For combined sphericity calculation, FISH segmented objects from the two channels were merged into one, and only ROIs containing 1 merged object were considered for the analysis. Combined sphericity was defined as where V is the volume of the segmented object and A its surface area. For distance to lamin analysis, z-stacks of ROIs surrounding individual nuclei were extracted and smoothed using a 3D Gaussian filter (sigma = 0.5 pixel). FISH channels were segmented using a threshold value corresponding to 20% of the maximum pixel intensity. For a given FISH channel, only nuclei containing 2 segmented FISH objects larger than 0.04 μm3 were kept for further analysis. For each FISH object, an ROI surrounding its maximum and minimum z-coordinates was extracted and the lamin channel was segmented using Otsu’s method. Lamin segmented objects smaller than 0.02 μm3 were discarded and Lamin segmented channel was processed using the MATLAB imfill function. 3D Euclidean distance transform of the segmented Lamin channel was calculated using the MATLAB bwdistsc function and distance to the centroid of the FISH segmented object was extracted.
See Table S5 for a summary of statistical measurements from FISH analyses.
Acknowledgments
We thank Guillaume Andrey and the entire Mundlos lab for input and discussions, Elphege Nora for kindly providing Rad21- and CTCF-AID-GFP ESCs, Robin van der Weide for aiding LAD calling; Katja Zill for mouse line maintenance, Ute Fischer and Asita Stiege for genotyping and cloning assistance, Carola Dietrich for Hi-C sample processing, Norbert Brieske for WISH assistance, Vanessa Suckow for western blot assistance, Karsten Beyer for manufacturing a cover slip carrier, and J. Fiedler and K. Macura (MPIMG transgenic unit) for aggregations, and Myriam Hochradel for cHi-C processing (MPIMG sequencing core facility). We thank the Montpellier Ressources Imagerie facility (BioCampus Montpellier, Centre National de la Recherche Scientifique [CNRS], INSERM, University of Montpellier) and for computer resources from CINECA (ISCRA grant thanks to computer resources from INFN and CINECA [ISCRA Grant HP10C8JWU7]). G.C., Q.S., and F.B. were supported by a grant from the European Research Council (Advanced Grant 3DEpi, 788972) and by the CNRS. This work was funded by EMBO and the Wellcome Trust (ALTF1554-2016 and 206475/Z/17/Z; to M.I.R.) as well as the Deutsche Forschungsgemeinschaft (KR3985/7-3 and MU 880/16-1 to S.M.).
Author contributions
M.I.R. conceived the study with input from S.M.; M.I.R., A.R.R., K.C., and P.R. produced and validated transgenics; Q.S. and F.B. designed Oligopaint probes; A.R.R., Q.S., and F.B. performed FISH and image acquisition in the lab of G.C.; Q.S. performed FISH image analysis; A.M.C., S.B., and A.E. performed strings-and-binders (SBS) modeling in the lab of M.N.; M.I.R., A.R.R., and D.M.I. performed cHi-C and Hi-C, which R.S. processed; M.I.R., A.R.R., and V.L. performed and processed DamID-seq; A.R.R., M.S., and M.H.Q.P. performed ChIP-seq; A.R.R. and C.P. performed ATAC-seq; A.R.R. performed WISH; M.I.R. and A.R.R. performed and processed RNA-seq, M.I.R. processed ChIP-seq and ATAC-seq data; J.G. performed bisulfite-cloning sequencing; D.H. performed gene co-regulation analyses; A.L.M. performed WGBS in the lab of A.M.; S.H. processed WGBS data and performed genome-wide analysis of DNMT3B−/− limbs in the lab of A.M.; T.Z. performed evolutionary analysis; S.A.H. provided synteny browser for species genomes comparison; L.W. managed aggregations; C.A.P.-M. replotted scRNA-seq data; P.G. provided opossum embryos. M.I.R. and A.R.R. wrote the manuscript with input from all authors.
Declaration of interests
The authors declare no competing interests.
Published: September 29, 2022
Footnotes
Supplemental information can be found online at https://doi.org/10.1016/j.cell.2022.09.006.
Contributor Information
Stefan Mundlos, Email: mundlos@molgen.mpg.de.
Michael I. Robson, Email: robson@molgen.mpg.de.
Supplemental information
Breakpoint genotyping primers are used to detect deletions (del), site specific integration (ssi) or specific KI-construct (kic).
Data and code availability
-
•
All data reported in this paper will be shared by the lead contact upon request. This paper analyzes existing, publicly available data whose accession numbers are listed in the key resources table. Sequencing data generated in this study are available at the NCBI Gene Expression Omnibus, GEO: GSE185775.
-
•
This paper does not report original code.
-
•
Any additional information required to reanalyze the data reported in this work paper is available from the lead contact upon request.
References
- Abdennur N., Mirny L.A. Cooler: scalable storage for Hi-C data and other genomically labeled arrays. Bioinformatics. 2020;36:311–316. doi: 10.1093/bioinformatics/btz540. [DOI] [PMC free article] [PubMed] [Google Scholar]
- Acemel R.D., Maeso I., Gómez-Skarmeta J.L. Topologically associated domains: a successful scaffold for the evolution of gene regulation in animals. Wiley Interdiscip. Rev. Dev. Biol. 2017;6:e265. doi: 10.1002/wdev.265. [DOI] [PubMed] [Google Scholar]
- Alam T., Agrawal S., Severin J., Young R.S., Andersson R., Arner E., Hasegawa A., Lizio M., Ramilowski J.A., Abugessaisa I., et al. Comparative transcriptomics of primary cells in vertebrates. Genome Res. 2020;30:951–961. doi: 10.1101/gr.255679.119. [DOI] [PMC free article] [PubMed] [Google Scholar]
- Allen M.P., Tildesley D.J. Oxford University Press; 2017. Computer Simulation of Liquids. [Google Scholar]
- Allou L., Balzano S., Magg A., Quinodoz M., Royer-Bertrand B., Schöpflin R., Chan W.L., Speck-Martins C.E., Carvalho D.R., Farage L., et al. Non-coding deletions identify Maenli lncRNA as a limb-specific En1 regulator. Nature. 2021;592:93–98. doi: 10.1038/s41586-021-03208-9. [DOI] [PubMed] [Google Scholar]
- Anderson E., Devenney P.S., Hill R.E., Lettice L.A. Mapping the Shh long-range regulatory domain. Development. 2014;141:3934–3943. doi: 10.1242/dev.108480. [DOI] [PMC free article] [PubMed] [Google Scholar]
- Andrey G., Montavon T., Mascrez B., Gonzalez F., Noordermeer D., Leleu M., Trono D., Spitz F., Duboule D. A switch between topological domains underlies HoxD genes collinearity in mouse limbs. Science. 2013;340:1234167. doi: 10.1126/science.1234167. [DOI] [PubMed] [Google Scholar]
- Andrey G., Mundlos S. The three-dimensional genome: regulating gene expression during pluripotency and development. Development. 2017;144:3646–3658. doi: 10.1242/dev.148304. [DOI] [PubMed] [Google Scholar]
- Andrey G., Schöpflin R., Jerković I., Heinrich V., Ibrahim D.M., Paliou C., Hochradel M., Timmermann B., Haas S., Vingron M., et al. Characterization of hundreds of regulatory landscapes in developing limbs reveals two regimes of chromatin folding. Genome Res. 2017;27:223–233. doi: 10.1101/gr.213066.116. [DOI] [PMC free article] [PubMed] [Google Scholar]
- Andrey G., Spielmann M. CRISPR/Cas9 genome editing in embryonic stem cells. Methods Mol. Biol. 2017;1468:221–234. doi: 10.1007/978-1-4939-4035-6_15. [DOI] [PubMed] [Google Scholar]
- Arnold C.D., Zabidi M.A., Pagani M., Rath M., Schernhuber K., Kazmar T., Stark A. Genome-wide assessment of sequence-intrinsic enhancer responsiveness at single-base-pair resolution. Nat. Biotechnol. 2017;35:136–144. doi: 10.1038/nbt.3739. [DOI] [PMC free article] [PubMed] [Google Scholar]
- Artus J., Hadjantonakis A.K. Generation of chimeras by aggregation of embryonic stem cells with diploid or tetraploid mouse embryos. Methods Mol. Biol. 2011;693:37–56. doi: 10.1007/978-1-60761-974-1_3. [DOI] [PubMed] [Google Scholar]
- Ball G., Demmerle J., Kaufmann R., Davis I., Dobbie I.M., Schermelleh L. SIMcheck: a toolbox for successful super-resolution structured illumination microscopy. Sci. Rep. 2015;5:15915. doi: 10.1038/srep15915. [DOI] [PMC free article] [PubMed] [Google Scholar]
- Baranasic D., Hörtenhuber M., Balwierz P., Zehnder T., Mukarram A.K., Nepal C., Varnai C., Hadzhiev Y., Jimenez-Gonzalez A., Li N., et al. 2021. Integrated annotation and analysis of genomic features reveal new types of functional elements and large-scale epigenetic phenomena in the developing zebrafish. [DOI] [Google Scholar]
- Barbieri M., Chotalia M., Fraser J., Lavitas L.M., Dostie J., Pombo A., Nicodemi M. Complexity of chromatin folding is captured by the strings and binders switch model. Proc. Natl. Acad. Sci. USA. 2012;109:16173–16178. doi: 10.1073/pnas.1204799109. [DOI] [PMC free article] [PubMed] [Google Scholar]
- Bauer M., Vidal E., Zorita E., Üresin N., Pinter S.F., Filion G.J., Payer B. Chromosome compartments on the inactive X guide TAD formation independently of transcription during X-reactivation. Nat. Commun. 2021;12:3499. doi: 10.1038/s41467-021-23610-1. [DOI] [PMC free article] [PubMed] [Google Scholar]
- Beard C., Hochedlinger K., Plath K., Wutz A., Jaenisch R. Efficient method to generate single-copy transgenic mice by site-specific integration in embryonic stem cells. Genesis. 2006;44:23–28. doi: 10.1002/gene.20180. [DOI] [PubMed] [Google Scholar]
- Beliveau B.J., Boettiger A.N., Avendaño M.S., Jungmann R., McCole R.B., Joyce E.F., Kim-Kiselak C., Bantignies F., Fonseka C.Y., Erceg J., et al. Single-molecule super-resolution imaging of chromosomes and in situ haplotype visualization using Oligopaint FISH probes. Nat. Commun. 2015;6:7147. doi: 10.1038/ncomms8147. [DOI] [PMC free article] [PubMed] [Google Scholar]
- Beliveau B.J., Kishi J.Y., Nir G., Sasaki H.M., Saka S.K., Nguyen S.C., Wu C.T., Yin P. OligoMiner provides a rapid, flexible environment for the design of genome-scale oligonucleotide in situ hybridization probes. Proc. Natl. Acad. Sci. USA. 2018;115:E2183–E2192. doi: 10.1073/pnas.1714530115. [DOI] [PMC free article] [PubMed] [Google Scholar]
- Bergman D.T., Jones T.R., Liu V., Ray J., Jagoda E., Siraj L., Kang H.Y., Nasser J., Kane M., Rios A., et al. Compatibility rules of human enhancer and promoter sequences. Nature. 2022;607:176–184. doi: 10.1038/s41586-022-04877-w. [DOI] [PMC free article] [PubMed] [Google Scholar]
- Bergman D.T., Jones T.R., Liu V., Siraj L., Kang H.Y., Nasser J., Kane M., Nguyen T.H., Grossman S.R., Fulco C.P., et al. 2021. Compatibility logic of human enhancer and promoter sequences. [DOI] [PMC free article] [PubMed] [Google Scholar]
- Bianco S., Lupiáñez D.G., Chiariello A.M., Annunziatella C., Kraft K., Schöpflin R., Wittler L., Andrey G., Vingron M., Pombo A., et al. Polymer physics predicts the effects of structural variants on chromatin architecture. Nat. Genet. 2018;50:662–667. doi: 10.1038/s41588-018-0098-8. [DOI] [PubMed] [Google Scholar]
- Bock C., Reither S., Mikeska T., Paulsen M., Walter J., Lengauer T. BiQ Analyzer: visualization and quality control for DNA methylation data from bisulfite sequencing. Bioinformatics. 2005;21:4067–4068. doi: 10.1093/bioinformatics/bti652. [DOI] [PubMed] [Google Scholar]
- Bonev B., Cavalli G. Organization and function of the 3D genome. Nat. Rev. Genet. 2016;17:772. doi: 10.1038/nrg.2016.147. [DOI] [PubMed] [Google Scholar]
- Bonev B., Cohen N.M., Szabo Q., Fritsch L., Papadopoulos G.L., Lubling Y., Xu X.L., Lv X.D., Hugnot J.P., Tanay A., et al. Multiscale 3D genome rewiring during mouse neural development. Cell. 2017;171:557–572.e24. doi: 10.1016/j.cell.2017.09.043. [DOI] [PMC free article] [PubMed] [Google Scholar]
- Borgel J., Guibert S., Li Y., Chiba H., Schübeler D., Sasaki H., Forné T., Weber M. Targets and dynamics of promoter DNA methylation during early mouse development. Nat. Genet. 2010;42:1093–1100. doi: 10.1038/ng.708. [DOI] [PubMed] [Google Scholar]
- Brachvogel B., Reichenberg D., Beyer S., Jehn B., von der Mark K., Bielke W. Molecular cloning and expression analysis of a novel member of the disintegrin and metalloprotease-Domain (ADAM) family. Gene. 2002;288:203–210. doi: 10.1016/s0378-1119(02)00508-5. [DOI] [PubMed] [Google Scholar]
- Brueckner L., Zhao P.A., van Schaik T., Leemans C., Sima J., Peric-Hupkes D., Gilbert D.M., van Steensel B. Local rewiring of genome-nuclear lamina interactions by transcription. EMBO J. 2020;39:e103159. doi: 10.15252/embj.2019103159. [DOI] [PMC free article] [PubMed] [Google Scholar]
- Buenrostro J.D., Wu B., Chang H.Y., Greenleaf W.J. ATAC-seq: a method for assaying chromatin accessibility genome-wide. Curr. Protoc. Mol. Biol. 2015;109:21.29.1–21.29.9. doi: 10.1002/0471142727.mb2129s109. [DOI] [PMC free article] [PubMed] [Google Scholar]
- Cao J., Spielmann M., Qiu X., Huang X., Ibrahim D.M., Hill A.J., Zhang F., Mundlos S., Christiansen L., Steemers F.J., et al. The single-cell transcriptional landscape of mammalian organogenesis. Nature. 2019;566:496–502. doi: 10.1038/s41586-019-0969-x. [DOI] [PMC free article] [PubMed] [Google Scholar]
- Chiariello A.M., Annunziatella C., Bianco S., Esposito A., Nicodemi M. Polymer physics of chromosome large-scale 3D organisation. Sci. Rep. 2016;6:29775. doi: 10.1038/srep29775. [DOI] [PMC free article] [PubMed] [Google Scholar]
- Choi I., Oh J., Cho B.N., Ahnn J., Jung Y.K., Han Kim D., Cho C. Characterization and comparative genomic analysis of intronless Adams with testicular gene expression. Genomics. 2004;83:636–646. doi: 10.1016/j.ygeno.2003.10.001. [DOI] [PubMed] [Google Scholar]
- Ciani L., Patel A., Allen N.D., ffrench-Constant C. Mice lacking the giant protocadherin mFAT1 exhibit renal slit junction abnormalities and a partially penetrant cyclopia and anophthalmia phenotype. Mol. Cell. Biol. 2003;23:3575–3582. doi: 10.1128/MCB.23.10.3575-3582.2003. [DOI] [PMC free article] [PubMed] [Google Scholar]
- Conte M., Fiorillo L., Bianco S., Chiariello A.M., Esposito A., Nicodemi M. Polymer physics indicates chromatin folding variability across single-cells results from state degeneracy in phase separation. Nat. Commun. 2020;11:3289. doi: 10.1038/s41467-020-17141-4. [DOI] [PMC free article] [PubMed] [Google Scholar]
- Despang A., Schöpflin R., Franke M., Ali S., Jerkovic I., Paliou C., Chan W.-L., Timmermann B., Wittler L., Vingron M., et al. Functional dissection of TADs reveals non-essential and instructive roles in regulating gene expression. Nat. Genet. 2019;51:1263–1271. doi: 10.1038/s41588-019-0466-z. [DOI] [PubMed] [Google Scholar]
- Dijkstra E.W. A note on two problems in connexion with graphs. Numer. Math. 1959;1:269–271. doi: 10.1007/BF01386390. [DOI] [Google Scholar]
- Dixon J.R., Gorkin D.U., Ren B. Chromatin domains: the unit of chromosome organization. Mol. Cell. 2016;62:668–680. doi: 10.1016/j.molcel.2016.05.018. [DOI] [PMC free article] [PubMed] [Google Scholar]
- Dixon J.R., Selvaraj S., Yue F., Kim A., Li Y., Shen Y., Hu M., Liu J.S., Ren B. Topological domains in mammalian genomes identified by analysis of chromatin interactions. Nature. 2012;485:376–380. doi: 10.1038/nature11082. [DOI] [PMC free article] [PubMed] [Google Scholar]
- Dobin A., Davis C.A., Schlesinger F., Drenkow J., Zaleski C., Jha S., Batut P., Chaisson M., Gingeras T.R. STAR: ultrafast universal RNA-seq aligner. Bioinformatics. 2013;29:15–21. doi: 10.1093/bioinformatics/bts635. [DOI] [PMC free article] [PubMed] [Google Scholar]
- Du Z., Zheng H., Huang B., Ma R., Wu J., Zhang X., He J., Xiang Y., Wang Q., Li Y., et al. Allelic reprogramming of 3D chromatin architecture during early mammalian development. Nature. 2017;547:232–235. doi: 10.1038/nature23263. [DOI] [PubMed] [Google Scholar]
- Durand N.C., Shamim M.S., Machol I., Rao S.S., Huntley M.H., Lander E.S., Aiden E.L. Juicer provides a one-click system for analyzing loop-resolution Hi-C experiments. Cell Syst. 2016;3:95–98. doi: 10.1016/j.cels.2016.07.002. [DOI] [PMC free article] [PubMed] [Google Scholar]
- Eden E., Navon R., Steinfeld I., Lipson D., Yakhini Z. GOrilla: a tool for discovery and visualization of enriched GO terms in ranked gene lists. BMC Bioinformatics. 2009;10:48. doi: 10.1186/1471-2105-10-48. [DOI] [PMC free article] [PubMed] [Google Scholar]
- Falk M., Feodorova Y., Naumova N., Imakaev M., Lajoie B.R., Leonhardt H., Joffe B., Dekker J., Fudenberg G., Solovei I., et al. Heterochromatin drives compartmentalization of inverted and conventional nuclei. Nature. 2019;570:395–399. doi: 10.1038/s41586-019-1275-3. [DOI] [PMC free article] [PubMed] [Google Scholar]
- FANTOM Consortium and the RIKEN PMI and CLST (DGT) Kawaji H., Rehli M., Baillie J.K., de Hoon M.J., Haberle V., Lassmann T., Kulakovskiy I.V., Lizio M., et al. A promoter-level mammalian expression atlas. Nature. 2014;507:462–470. doi: 10.1038/nature13182. [DOI] [PMC free article] [PubMed] [Google Scholar]
- Finlan L.E., Sproul D., Thomson I., Boyle S., Kerr E., Perry P., Ylstra B., Chubb J.R., Bickmore W.A. Recruitment to the nuclear periphery can alter expression of genes in human cells. PLoS Genet. 2008;4:e1000039. doi: 10.1371/journal.pgen.1000039. [DOI] [PMC free article] [PubMed] [Google Scholar]
- Flavahan W.A., Drier Y., Liau B.B., Gillespie S.M., Venteicher A.S., Stemmer-Rachamimov A.O., Suvà M.L., Bernstein B.E. Insulator dysfunction and oncogene activation in IDH mutant gliomas. Nature. 2016;529:110–114. doi: 10.1038/nature16490. [DOI] [PMC free article] [PubMed] [Google Scholar]
- Fraser J., Ferrai C., Chiariello A.M., Schueler M., Rito T., Laudanno G., Barbieri M., Moore B.L., Kraemer D.C., Aitken S., et al. Hierarchical folding and reorganization of chromosomes are linked to transcriptional changes in cellular differentiation. Mol. Syst. Biol. 2015;11:852. doi: 10.15252/msb.20156492. [DOI] [PMC free article] [PubMed] [Google Scholar]
- Fudenberg G., Imakaev M., Lu C., Goloborodko A., Abdennur N., Mirny L.A. Formation of chromosomal domains by loop extrusion. Cell Rep. 2016;15:2038–2049. doi: 10.1016/j.celrep.2016.04.085. [DOI] [PMC free article] [PubMed] [Google Scholar]
- Fulco C.P., Nasser J., Jones T.R., Munson G., Bergman D.T., Subramanian V., Grossman S.R., Anyoha R., Doughty B.R., Patwardhan T.A., et al. Activity-by-contact model of enhancer-promoter regulation from thousands of CRISPR perturbations. Nat. Genet. 2019;51:1664–1669. doi: 10.1038/s41588-019-0538-0. [DOI] [PMC free article] [PubMed] [Google Scholar]
- Furlong E.E.M., Levine M. Developmental enhancers and chromosome topology. Science. 2018;361:1341–1345. doi: 10.1126/science.aau0320. [DOI] [PMC free article] [PubMed] [Google Scholar]
- George S.H., Gertsenstein M., Vintersten K., Korets-Smith E., Murphy J., Stevens M.E., Haigh J.J., Nagy A. Developmental and adult phenotyping directly from mutant embryonic stem cells. Proc. Natl. Acad. Sci. USA. 2007;104:4455–4460. doi: 10.1073/pnas.0609277104. [DOI] [PMC free article] [PubMed] [Google Scholar]
- Ghavi-Helm Y., Jankowski A., Meiers S., Viales R.R., Korbel J.O., Furlong E.E.M. Highly rearranged chromosomes reveal uncoupling between genome topology and gene expression. Nat. Genet. 2019;51:1272–1282. doi: 10.1038/s41588-019-0462-3. [DOI] [PMC free article] [PubMed] [Google Scholar]
- Gjaltema R.A.F., Schwämmle T., Kautz P., Robson M., Schöpflin R., Lustig L.R., Brandenburg L., Dunkel I., Vechiatto C., Ntini E., et al. 2021. Distal and proximal cis-regulatory elements sense X-chromosomal dosage and developmental state at the Xist locus. [DOI] [PubMed] [Google Scholar]
- Gorkin D.U., Barozzi I., Zhao Y., Zhang Y., Huang H., Lee A.Y., Li B., Chiou J., Wildberg A., Ding B., et al. An atlas of dynamic chromatin landscapes in mouse fetal development. Nature. 2020;583:744–751. doi: 10.1038/s41586-020-2093-3. [DOI] [PMC free article] [PubMed] [Google Scholar]
- Grosswendt S., Kretzmer H., Smith Z.D., Kumar A.S., Hetzel S., Wittler L., Klages S., Timmermann B., Mukherji S., Meissner A. Epigenetic regulator function through mouse gastrulation. Nature. 2020;584:102–108. doi: 10.1038/s41586-020-2552-x. [DOI] [PMC free article] [PubMed] [Google Scholar]
- Gustafsson M.G., Shao L., Carlton P.M., Wang C.J., Golubovskaya I.N., Cande W.Z., Agard D.A., Sedat J.W. Three-dimensional resolution doubling in wide-field fluorescence microscopy by structured illumination. Biophys. J. 2008;94:4957–4970. doi: 10.1529/biophysj.107.120345. [DOI] [PMC free article] [PubMed] [Google Scholar]
- Harmston N., Ing-Simmons E., Tan G., Perry M., Merkenschlager M., Lenhard B. Topologically associating domains are ancient features that coincide with Metazoan clusters of extreme noncoding conservation. Nat. Commun. 2017;8:441. doi: 10.1038/s41467-017-00524-5. [DOI] [PMC free article] [PubMed] [Google Scholar]
- Helmbacher F. Tissue-specific activities of the Fat1 cadherin cooperate to control neuromuscular morphogenesis. PLoS Biol. 2018;16:e2004734. doi: 10.1371/journal.pbio.2004734. [DOI] [PMC free article] [PubMed] [Google Scholar]
- Hsieh T.-H.S., Cattoglio C., Slobodyanyuk E., Hansen A.S., Rando O.J., Tjian R., Darzacq X. Resolving the 3D landscape of transcription-linked mammalian chromatin folding. Mol. Cell. 2020;78:539–553.e8. doi: 10.1016/j.molcel.2020.03.002. [DOI] [PMC free article] [PubMed] [Google Scholar]
- Huang P., Keller C.A., Giardine B., Grevet J.D., Davies J.O.J., Hughes J.R., Kurita R., Nakamura Y., Hardison R.C., Blobel G.A. Comparative analysis of three-dimensional chromosomal architecture identifies a novel fetal hemoglobin regulatory element. Genes Dev. 2017;31:1704–1713. doi: 10.1101/gad.303461.117. [DOI] [PMC free article] [PubMed] [Google Scholar]
- Isoda T., Moore A.J., He Z., Chandra V., Aida M., Denholtz M., Piet van Hamburg J., Fisch K.M., Chang A.N., Fahl S.P., et al. Non-coding transcription instructs chromatin folding and compartmentalization to dictate enhancer-promoter communication and T cell fate. Cell. 2017;171:103–119.e18. doi: 10.1016/j.cell.2017.09.001. [DOI] [PMC free article] [PubMed] [Google Scholar]
- Jagadeesh K.A., Dey K.K., Montoro D.T., Mohan R., Gazal S., Engreitz J.M., Xavier R.J., Price A.L., Regev A. 2021. Identifying disease-critical cell types and cellular processes across the human body by integration of single-cell profiles and human genetics. [DOI] [PMC free article] [PubMed] [Google Scholar]
- Jerković I., Ibrahim D.M., Andrey G., Haas S., Hansen P., Janetzki C., González Navarrete I., Robinson P.N., Hecht J., Mundlos S. Genome-wide binding of posterior HOXA/D transcription factors reveals subgrouping and association with CTCF. PLoS Genet. 2017;13:e1006567. doi: 10.1371/journal.pgen.1006567. [DOI] [PMC free article] [PubMed] [Google Scholar]
- Jühling F., Kretzmer H., Bernhart S.H., Otto C., Stadler P.F., Hoffmann S. metilene: fast and sensitive calling of differentially methylated regions from bisulfite sequencing data. Genome Res. 2016;26:256–262. doi: 10.1101/gr.196394.115. [DOI] [PMC free article] [PubMed] [Google Scholar]
- Kane L., Williamson I., Flyamer I.M., Kumar Y., Hill R.E., Lettice L.A., Bickmore W.A. 2021. Cohesin is required for long-range enhancer action. [DOI] [PMC free article] [PubMed] [Google Scholar]
- Kechin A., Boyarskikh U., Kel A., Filipenko M. cutPrimers: a new tool for accurate cutting of primers from reads of targeted next generation sequencing. J. Comput. Biol. 2017;24:1138–1143. doi: 10.1089/cmb.2017.0096. [DOI] [PubMed] [Google Scholar]
- Kim J.D., Faulk C., Kim J. Retroposition and evolution of the DNA-binding motifs of YY1, YY2 and REX1. Nucleic Acids Res. 2007;35:3442–3452. doi: 10.1093/nar/gkm235. [DOI] [PMC free article] [PubMed] [Google Scholar]
- Kim J.D., Kim H., Ekram M.B., Yu S., Faulk C., Kim J. Rex1/Zfp42 as an epigenetic regulator for genomic imprinting. Hum. Mol. Genet. 2011;20:1353–1362. doi: 10.1093/hmg/ddr017. [DOI] [PMC free article] [PubMed] [Google Scholar]
- Kim M., Park Y.K., Kang T.W., Lee S.H., Rhee Y.H., Park J.L., Kim H.J., Lee D., Lee D., Kim S.Y., et al. Dynamic changes in DNA methylation and hydroxymethylation when hES cells undergo differentiation toward a neuronal lineage. Hum. Mol. Genet. 2014;23:657–667. doi: 10.1093/hmg/ddt453. [DOI] [PubMed] [Google Scholar]
- Knight P.A., Ruiz D. A fast algorithm for matrix balancing. IMA J. Numer. Anal. 2013;33:1029–1047. [Google Scholar]
- Kraft K., Geuer S., Will A.J., Chan W.L., Paliou C., Borschiwer M., Harabula I., Wittler L., Franke M., Ibrahim D.M., et al. Deletions, inversions, duplications: engineering of structural variants using CRISPR/Cas in mice. Cell Rep. 2015;10:833–839. doi: 10.1016/j.celrep.2015.01.016. [DOI] [PubMed] [Google Scholar]
- Kraft K., Magg A., Heinrich V., Riemenschneider C., Schöpflin R., Markowski J., Ibrahim D.M., Acuna-Hidalgo R., Despang A., Andrey G., et al. Serial genomic inversions induce tissue-specific architectural stripes, gene misexpression and congenital malformations. Nat. Cell Biol. 2019;21:305–310. doi: 10.1038/s41556-019-0273-x. [DOI] [PubMed] [Google Scholar]
- Kragesteen B.K., Spielmann M., Paliou C., Heinrich V., Schöpflin R., Esposito A., Annunziatella C., Bianco S., Chiariello A.M., Jerković I., et al. Dynamic 3D chromatin architecture contributes to enhancer specificity and limb morphogenesis. Nat. Genet. 2018;50:1463–1473. doi: 10.1038/s41588-018-0221-x. [DOI] [PMC free article] [PubMed] [Google Scholar]
- Krefting J., Andrade-Navarro M.A., Ibn-Salem J. Evolutionary stability of topologically associating domains is associated with conserved gene regulation. BMC Biol. 2018;16:87. doi: 10.1186/s12915-018-0556-x. [DOI] [PMC free article] [PubMed] [Google Scholar]
- Kremer K., Grest G.S. Dynamics of entangled linear polymer melts: a molecular-dynamics simulation. J. Chem. Phys. 1990;92:5057–5086. [Google Scholar]
- Langmead B., Salzberg S.L. Fast gapped-read alignment with Bowtie 2. Nat. Methods. 2012;9:357–359. doi: 10.1038/nmeth.1923. [DOI] [PMC free article] [PubMed] [Google Scholar]
- Laugsch M., Bartusel M., Rehimi R., Alirzayeva H., Karaolidou A., Crispatzu G., Zentis P., Nikolic M., Bleckwehl T., Kolovos P., et al. Modeling the pathological long-range regulatory effects of human structural variation with patient-specific hiPSCs. Cell Stem Cell. 2019;24:736–752.e12. doi: 10.1016/j.stem.2019.03.004. [DOI] [PubMed] [Google Scholar]
- Leemans C., van der Zwalm M.C.H., Brueckner L., Comoglio F., van Schaik T., Pagie L., van Arensbergen J., van Steensel B. Promoter-intrinsic and local chromatin features determine gene repression in LADs. Cell. 2019;177:852–864.e14. doi: 10.1016/j.cell.2019.03.009. [DOI] [PMC free article] [PubMed] [Google Scholar]
- Li F., Wang D., Song R., Cao C., Zhang Z., Wang Y., Li X., Huang J., Liu Q., Hou N., et al. The asynchronous establishment of chromatin 3D architecture between in vitro fertilized and uniparental preimplantation pig embryos. Genome Biol. 2020;21:203. doi: 10.1186/s13059-020-02095-z. [DOI] [PMC free article] [PubMed] [Google Scholar]
- Li H., Durbin R. Fast and accurate short read alignment with Burrows-Wheeler transform. Bioinformatics. 2009;25:1754–1760. doi: 10.1093/bioinformatics/btp324. [DOI] [PMC free article] [PubMed] [Google Scholar]
- Li H., Durbin R. Fast and accurate long-read alignment with Burrows-Wheeler transform. Bioinformatics. 2010;26:589–595. doi: 10.1093/bioinformatics/btp698. [DOI] [PMC free article] [PubMed] [Google Scholar]
- Li H., Handsaker B., Wysoker A., Fennell T., Ruan J., Homer N., Marth G., Abecasis G., Durbin R., 1000 Genome Project Data Processing Subgroup The Sequence Alignment/Map format and SAMtools. Bioinformatics. 2009;25:2078–2079. doi: 10.1093/bioinformatics/btp352. [DOI] [PMC free article] [PubMed] [Google Scholar]
- Liu N.Q., Maresca M., van den Brand T., Braccioli L., Schijns M.M.G.A., Teunissen H., Bruneau B.G., Nora E.P., de Wit E. WAPL maintains a cohesin loading cycle to preserve cell-type-specific distal gene regulation. Nat. Genet. 2021;53:100–109. doi: 10.1038/s41588-020-00744-4. [DOI] [PMC free article] [PubMed] [Google Scholar]
- Lizio M., Harshbarger J., Shimoji H., Severin J., Kasukawa T., Sahin S., Abugessaisa I., Fukuda S., Hori F., Ishikawa-Kato S., et al. Gateways to the FANTOM5 promoter level mammalian expression atlas. Genome Biol. 2015;16:22. doi: 10.1186/s13059-014-0560-6. [DOI] [PMC free article] [PubMed] [Google Scholar]
- Lobe C.G., Koop K.E., Kreppner W., Lomeli H., Gertsenstein M., Nagy A. Z/AP, a double reporter for cre-mediated recombination. Dev. Biol. 1999;208:281–292. doi: 10.1006/dbio.1999.9209. [DOI] [PubMed] [Google Scholar]
- Long H.K., Prescott S.L., Wysocka J. Ever-changing landscapes: transcriptional enhancers in development and evolution. Cell. 2016;167:1170–1187. doi: 10.1016/j.cell.2016.09.018. [DOI] [PMC free article] [PubMed] [Google Scholar]
- Long J., Li M., Ren Q., Zhang C., Fan J., Duan Y., Chen J., Li B., Deng L. Phylogenetic and molecular evolution of the ADAM (A disintegrin and metalloprotease) gene family from Xenopus tropicalis, to Mus musculus, Rattus norvegicus, and Homo sapiens. Gene. 2012;507:36–43. doi: 10.1016/j.gene.2012.07.016. [DOI] [PubMed] [Google Scholar]
- Love M.I., Huber W., Anders S. Moderated estimation of fold change and dispersion for RNA-seq data with DESeq2. Genome Biol. 2014;15:550. doi: 10.1186/s13059-014-0550-8. [DOI] [PMC free article] [PubMed] [Google Scholar]
- Real F.M., Haas S.A., Franchini P., Xiong P., Simakov O., Kuhl H., Schöpflin R., Heller D., Moeinzadeh M.H., Heinrich V., et al. The mole genome reveals regulatory rearrangements associated with adaptive intersexuality. Science. 2020;370:208–214. doi: 10.1126/science.aaz2582. [DOI] [PMC free article] [PubMed] [Google Scholar]
- Marsh B., Blelloch R. Single nuclei RNA-seq of mouse placental labyrinth development. eLife. 2020;9:e60266. doi: 10.7554/eLife.60266. [DOI] [PMC free article] [PubMed] [Google Scholar]
- Martin M. Cutadapt removes adapter sequences from high-throughput sequencing reads. EMBnet. j. 2011;17:3. [Google Scholar]
- Martinez-Ara M., Comoglio F., van Arensbergen J., van Steensel B. Systematic analysis of intrinsic enhancer-promoter compatibility in the mouse genome. Mol. Cell. 2022;82:2519–2531.e6. doi: 10.1016/j.molcel.2022.04.009. [DOI] [PMC free article] [PubMed] [Google Scholar]
- Masui S., Ohtsuka S., Yagi R., Takahashi K., Ko M.S., Niwa H. Rex1/Zfp42 is dispensable for pluripotency in mouse ES cells. BMC Dev. Biol. 2008;8:45. doi: 10.1186/1471-213X-8-45. [DOI] [PMC free article] [PubMed] [Google Scholar]
- McKenna A., Hanna M., Banks E., Sivachenko A., Cibulskis K., Kernytsky A., Garimella K., Altshuler D., Gabriel S., Daly M., et al. The Genome Analysis Toolkit: a MapReduce framework for analyzing next-generation DNA sequencing data. Genome Res. 2010;20:1297–1303. doi: 10.1101/gr.107524.110. [DOI] [PMC free article] [PubMed] [Google Scholar]
- Melo U.S., Schöpflin R., Acuna-Hidalgo R., Mensah M.A., Fischer-Zirnsak B., Holtgrewe M., Klever M.K., Türkmen S., Heinrich V., Pluym I.D., et al. Hi-C identifies complex genomic rearrangements and TAD-shuffling in developmental diseases. Am. J. Hum. Genet. 2020;106:872–884. doi: 10.1016/j.ajhg.2020.04.016. [DOI] [PMC free article] [PubMed] [Google Scholar]
- Nasser J., Bergman D.T., Fulco C.P., Guckelberger P., Doughty B.R., Patwardhan T.A., Jones T.R., Nguyen T.H., Ulirsch J.C., Lekschas F., et al. Genome-wide enhancer maps link risk variants to disease genes. Nature. 2021;593:238–243. doi: 10.1038/s41586-021-03446-x. [DOI] [PMC free article] [PubMed] [Google Scholar]
- Nicodemi M., Prisco A. Thermodynamic pathways to genome spatial organization in the cell nucleus. Biophys. J. 2009;96:2168–2177. doi: 10.1016/j.bpj.2008.12.3919. [DOI] [PMC free article] [PubMed] [Google Scholar]
- Niu L., Shen W., Shi Z., Tan Y., He N., Wan J., Sun J., Zhang Y., Huang Y., Wang W., et al. Three-dimensional folding dynamics of the Xenopus tropicalis genome. Nat. Genet. 2021;53:1075–1087. doi: 10.1038/s41588-021-00878-z. [DOI] [PMC free article] [PubMed] [Google Scholar]
- Noordermeer D., Leleu M., Splinter E., Rougemont J., De Laat W., Duboule D. The dynamic architecture of Hox gene clusters. Science. 2011;334:222–225. doi: 10.1126/science.1207194. [DOI] [PubMed] [Google Scholar]
- Nora E.P., Goloborodko A., Valton A.L., Gibcus J.H., Uebersohn A., Abdennur N., Dekker J., Mirny L.A., Bruneau B.G. Targeted degradation of CTCF decouples local insulation of chromosome domains from genomic compartmentalization. Cell. 2017;169:930–944.e22. doi: 10.1016/j.cell.2017.05.004. [DOI] [PMC free article] [PubMed] [Google Scholar]
- Nora E.P., Lajoie B.R., Schulz E.G., Giorgetti L., Okamoto I., Servant N., Piolot T., van Berkum N.L., Meisig J., Sedat J., et al. Spatial partitioning of the regulatory landscape of the X-inactivation centre. Nature. 2012;485:381–385. doi: 10.1038/nature11049. [DOI] [PMC free article] [PubMed] [Google Scholar]
- Nuebler J., Fudenberg G., Imakaev M., Abdennur N., Mirny L.A. Chromatin organization by an interplay of loop extrusion and compartmental segregation. Proc. Natl. Acad. Sci. USA. 2018;115:E6697–E6706. doi: 10.1073/pnas.1717730115. [DOI] [PMC free article] [PubMed] [Google Scholar]
- Okano M., Bell D.W., Haber D.A., Li E. DNA methyltransferases Dnmt3a and Dnmt3b are essential for de novo methylation and mammalian development. Cell. 1999;99:247–257. doi: 10.1016/s0092-8674(00)81656-6. [DOI] [PubMed] [Google Scholar]
- Ooi S.K., Qiu C., Bernstein E., Li K., Jia D., Yang Z., Erdjument-Bromage H., Tempst P., Lin S.P., Allis C.D., et al. DNMT3L connects unmethylated lysine 4 of histone H3 to de novo methylation of DNA. Nature. 2007;448:714–717. doi: 10.1038/nature05987. [DOI] [PMC free article] [PubMed] [Google Scholar]
- Ou H.D., Phan S., Deerinck T.J., Thor A., Ellisman M.H., O'Shea C.C. ChromEMT: visualizing 3D chromatin structure and compaction in interphase and mitotic cells. Science. 2017;357:eaag0025. doi: 10.1126/science.aag0025. [DOI] [PMC free article] [PubMed] [Google Scholar]
- Palstra R.J., Tolhuis B., Splinter E., Nijmeijer R., Grosveld F., de Laat W. The beta-globin nuclear compartment in development and erythroid differentiation. Nat. Genet. 2003;35:190–194. doi: 10.1038/ng1244. [DOI] [PubMed] [Google Scholar]
- Peng Z., Gong Y., Liang X. Role of FAT1 in health and disease. Oncol. Lett. 2021;21:398. doi: 10.3892/ol.2021.12659. [DOI] [PMC free article] [PubMed] [Google Scholar]
- Pijuan-Sala B., Griffiths J.A., Guibentif C., Hiscock T.W., Jawaid W., Calero-Nieto F.J., Mulas C., Ibarra-Soria X., Tyser R.C.V., Ho D.L.L., et al. A single-cell molecular map of mouse gastrulation and early organogenesis. Nature. 2019;566:490–495. doi: 10.1038/s41586-019-0933-9. [DOI] [PMC free article] [PubMed] [Google Scholar]
- Plimpton S. Fast parallel algorithms for short-range Molecular Dynamics. J. Comp. Phys. 1995;117:1–19. [Google Scholar]
- Poleshko A., Shah P.P., Gupta M., Babu A., Morley M.P., Manderfield L.J., Ifkovits J.L., Calderon D., Aghajanian H., Sierra-Pagán J.E., et al. Genome-nuclear lamina interactions regulate cardiac stem cell lineage restriction. Cell. 2017;171:573–587.e14. doi: 10.1016/j.cell.2017.09.018. [DOI] [PMC free article] [PubMed] [Google Scholar]
- Quinlan A.R., Hall I.M. BEDTools: a flexible suite of utilities for comparing genomic features. Bioinformatics. 2010;26:841–842. doi: 10.1093/bioinformatics/btq033. [DOI] [PMC free article] [PubMed] [Google Scholar]
- Ramírez F., Ryan D.P., Grüning B., Bhardwaj V., Kilpert F., Richter A.S., Heyne S., Dündar F., Manke T. deepTools2: a next generation web server for deep-sequencing data analysis. Nucleic Acids Res. 2016;44:W160–W165. doi: 10.1093/nar/gkw257. [DOI] [PMC free article] [PubMed] [Google Scholar]
- Ramisch A., Heinrich V., Glaser L.V., Fuchs A., Yang X., Benner P., Schöpflin R., Li N., Kinkley S., Römer-Hillmann A., et al. CRUP: a comprehensive framework to predict condition-specific regulatory units. Genome Biol. 2019;20:227. doi: 10.1186/s13059-019-1860-7. [DOI] [PMC free article] [PubMed] [Google Scholar]
- Rao S.S., Huntley M.H., Durand N.C., Stamenova E.K., Bochkov I.D., Robinson J.T., Sanborn A.L., Machol I., Omer A.D., Lander E.S., et al. A 3D map of the human genome at kilobase resolution reveals principles of chromatin looping. Cell. 2014;159:1665–1680. doi: 10.1016/j.cell.2014.11.021. [DOI] [PMC free article] [PubMed] [Google Scholar]
- Rao S.S.P., Huang S.C., Hilaire B. G.St., Engreitz J.M., Perez E.M., Kieffer-Kwon K.R., Sanborn A.L., Johnstone S.E., Bascom G.D., et al. Cohesin loss eliminates all loop domains. Cell. 2017;171:305–320.e24. doi: 10.1016/j.cell.2017.09.026. [DOI] [PMC free article] [PubMed] [Google Scholar]
- Ray-Jones H., Spivakov M. Transcriptional enhancers and their communication with gene promoters. Cell. Mol. Life Sci. 2021;78:6453–6485. doi: 10.1007/s00018-021-03903-w. [DOI] [PMC free article] [PubMed] [Google Scholar]
- Reddy K.L., Zullo J.M., Bertolino E., Singh H. Transcriptional repression mediated by repositioning of genes to the nuclear lamina. Nature. 2008;452:243–247. doi: 10.1038/nature06727. [DOI] [PubMed] [Google Scholar]
- Robson M.I., de Las Heras J.I., Czapiewski R., Lê Thành P., Booth D.G., Kelly D.A., Webb S., Kerr A.R.W., Schirmer E.C. Tissue-specific gene repositioning by muscle nuclear membrane proteins enhances repression of critical developmental genes during myogenesis. Mol. Cell. 2016;62:834–847. doi: 10.1016/j.molcel.2016.04.035. [DOI] [PMC free article] [PubMed] [Google Scholar]
- Robson M.I., de Las Heras J.I., Czapiewski R., Sivakumar A., Kerr A.R.W., Schirmer E.C. Constrained release of lamina-associated enhancers and genes from the nuclear envelope during T-cell activation facilitates their association in chromosome compartments. Genome Res. 2017;27:1126–1138. doi: 10.1101/gr.212308.116. [DOI] [PMC free article] [PubMed] [Google Scholar]
- Robson M.I., Ringel A.R., Mundlos S. Regulatory landscaping: how enhancer-promoter communication is sculpted in 3D. Mol. Cell. 2019;74:1110–1122. doi: 10.1016/j.molcel.2019.05.032. [DOI] [PubMed] [Google Scholar]
- Robson M.I., Schirmer E.C. The application of DamID to identify peripheral gene sequences in differentiated and primary cells. Methods Mol. Biol. 2016;1411:359–386. doi: 10.1007/978-1-4939-3530-7_23. [DOI] [PubMed] [Google Scholar]
- Rosencrance C.D., Ammouri H.N., Yu Q., Ge T., Rendleman E.J., Marshall S.A., Eagen K.P. Chromatin hyperacetylation impacts chromosome folding by forming a nuclear subcompartment. Mol. Cell. 2020;78:112–126.e12. doi: 10.1016/j.molcel.2020.03.018. [DOI] [PMC free article] [PubMed] [Google Scholar]
- Sadeqzadeh E., de Bock C.E., Thorne R.F. Sleeping giants: emerging roles for the fat cadherins in health and disease. Med. Res. Rev. 2014;34:190–221. doi: 10.1002/med.21286. [DOI] [PubMed] [Google Scholar]
- Sanborn A.L., Rao S.S., Huang S.C., Durand N.C., Huntley M.H., Jewett A.I., Bochkov I.D., Chinnappan D., Cutkosky A., Li J., et al. Chromatin extrusion explains key features of loop and domain formation in wild-type and engineered genomes. Proc. Natl. Acad. Sci. USA. 2015;112:E6456–E6465. doi: 10.1073/pnas.1518552112. [DOI] [PMC free article] [PubMed] [Google Scholar]
- Schermelleh L., Carlton P.M., Haase S., Shao L., Winoto L., Kner P., Burke B., Cardoso M.C., Agard D.A., Gustafsson M.G., et al. Subdiffraction multicolor imaging of the nuclear periphery with 3D structured illumination microscopy. Science. 2008;320:1332–1336. doi: 10.1126/science.1156947. [DOI] [PMC free article] [PubMed] [Google Scholar]
- Schmidl C., Rendeiro A.F., Sheffield N.C., Bock C. ChIPmentation: fast, robust, low-input ChIP-seq for histones and transcription factors. Nat. Methods. 2015;12:963–965. doi: 10.1038/nmeth.3542. [DOI] [PMC free article] [PubMed] [Google Scholar]
- Shen Y., Yue F., McCleary D.F., Ye Z., Edsall L., Kuan S., Wagner U., Dixon J., Lee L., Lobanenkov V.V., et al. A map of the cis-regulatory sequences in the mouse genome. Nature. 2012;488:116–120. doi: 10.1038/nature11243. [DOI] [PMC free article] [PubMed] [Google Scholar]
- Shin H., Shi Y., Dai C., Tjong H., Gong K., Alber F., Zhou X.J. TopDom: an efficient and deterministic method for identifying topological domains in genomes. Nucleic Acids Res. 2016;44:e70. doi: 10.1093/nar/gkv1505. [DOI] [PMC free article] [PubMed] [Google Scholar]
- Sima J., Chakraborty A., Dileep V., Michalski M., Klein K.N., Holcomb N.P., Turner J.L., Paulsen M.T., Rivera-Mulia J.C., Trevilla-Garcia C., et al. Identifying cis elements for spatiotemporal control of mammalian DNA replication. Cell. 2019;176:816–830.e18. doi: 10.1016/j.cell.2018.11.036. [DOI] [PMC free article] [PubMed] [Google Scholar]
- Soshnikova N., Duboule D. Epigenetic temporal control of mouse Hox genes in vivo. Science. 2009;324:1320–1323. doi: 10.1126/science.1171468. [DOI] [PubMed] [Google Scholar]
- Spielmann M., Lupiáñez D.G., Mundlos S. Structural variation in the 3D genome. Nat. Rev. Genet. 2018;19:453–467. doi: 10.1038/s41576-018-0007-0. [DOI] [PubMed] [Google Scholar]
- Sun D., Xi Y., Rodriguez B., Park H.J., Tong P., Meong M., Goodell M.A., Li W. MOABS: model based analysis of bisulfite sequencing data. Genome Biol. 2014;15:R38. doi: 10.1186/gb-2014-15-2-r38. [DOI] [PMC free article] [PubMed] [Google Scholar]
- Symmons O., Uslu V.V., Tsujimura T., Ruf S., Nassari S., Schwarzer W., Ettwiller L., Spitz F. Functional and topological characteristics of mammalian regulatory domains. Genome Res. 2014;24:390–400. doi: 10.1101/gr.163519.113. [DOI] [PMC free article] [PubMed] [Google Scholar]
- Szabo Q., Donjon A., Jerković I., Papadopoulos G.L., Cheutin T., Bonev B., Nora E.P., Bruneau B.G., Bantignies F., Cavalli G. Regulation of single-cell genome organization into TADs and chromatin nanodomains. Nat. Genet. 2020;52:1151–1157. doi: 10.1038/s41588-020-00716-8. [DOI] [PMC free article] [PubMed] [Google Scholar]
- Szabo Q., Jost D., Chang J.M., Cattoni D.I., Papadopoulos G.L., Bonev B., Sexton T., Gurgo J., Jacquier C., Nollmann M., et al. TADs are 3D structural units of higher-order chromosome organization in Drosophila. Sci. Adv. 2018;4:eaar8082. doi: 10.1126/sciadv.aar8082. [DOI] [PMC free article] [PubMed] [Google Scholar]
- Takebayashi S., Dileep V., Ryba T., Dennis J.H., Gilbert D.M. Chromatin-interaction compartment switch at developmentally regulated chromosomal domains reveals an unusual principle of chromatin folding. Proc. Natl. Acad. Sci. USA. 2012;109:12574–12579. doi: 10.1073/pnas.1207185109. [DOI] [PMC free article] [PubMed] [Google Scholar]
- Therizols P., Illingworth R.S., Courilleau C., Boyle S., Wood A.J., Bickmore W.A. Chromatin decondensation is sufficient to alter nuclear organization in embryonic stem cells. Science. 2014;346:1238–1242. doi: 10.1126/science.1259587. [DOI] [PMC free article] [PubMed] [Google Scholar]
- van Arensbergen J., van Steensel B., Bussemaker H.J. In search of the determinants of enhancer-promoter interaction specificity. Trends Cell Biol. 2014;24:695–702. doi: 10.1016/j.tcb.2014.07.004. [DOI] [PMC free article] [PubMed] [Google Scholar]
- van Schaik T., Vos M., Peric-Hupkes D., Hn Celie P., van Steensel B. Cell cycle dynamics of lamina-associated DNA. EMBO Rep. 2020;21:e50636. doi: 10.15252/embr.202050636. [DOI] [PMC free article] [PubMed] [Google Scholar]
- van Steensel B., Belmont A.S. Lamina-associated domains: links with chromosome architecture, heterochromatin, and gene repression. Cell. 2017;169:780–791. doi: 10.1016/j.cell.2017.04.022. [DOI] [PMC free article] [PubMed] [Google Scholar]
- Vogel M.J., Peric-Hupkes D., van Steensel B. Detection of in vivo protein-DNA interactions using DamID in mammalian cells. Nat. Protoc. 2007;2:1467–1478. doi: 10.1038/nprot.2007.148. [DOI] [PubMed] [Google Scholar]
- Weinberg D.N., Rosenbaum P., Chen X., Barrows D., Horth C., Marunde M.R., Popova I.K., Gillespie Z.B., Keogh M.-C., Lu C., et al. Two competing mechanisms of DNMT3A recruitment regulate the dynamics of de novo DNA methylation at PRC1-targeted CpG islands. Nat. Genet. 2021;53:794–800. doi: 10.1038/s41588-021-00856-5. [DOI] [PMC free article] [PubMed] [Google Scholar]
- Wingett S., Ewels P., Furlan-Magaril M., Nagano T., Schoenfelder S., Fraser P., Andrews S. HiCUP: pipeline for mapping and processing Hi-C data. F1000Res. 2015;4:1310. doi: 10.12688/f1000research.7334.1. [DOI] [PMC free article] [PubMed] [Google Scholar]
- Wittkopp P.J., Kalay G. Cis-regulatory elements: molecular mechanisms and evolutionary processes underlying divergence. Nat. Rev. Genet. 2011;13:59–69. doi: 10.1038/nrg3095. [DOI] [PubMed] [Google Scholar]
- Wu H.J., Landshammer A., Stamenova E.K., Bolondi A., Kretzmer H., Meissner A., Michor F. Topological isolation of developmental regulators in mammalian genomes. Nat. Commun. 2021;12:4897. doi: 10.1038/s41467-021-24951-7. [DOI] [PMC free article] [PubMed] [Google Scholar]
- Xi Y., Li W. BSMAP: whole genome bisulfite sequence MAPping program. BMC Bioinformatics. 2009;10:232. doi: 10.1186/1471-2105-10-232. [DOI] [PMC free article] [PubMed] [Google Scholar]
- Xie L., Dong P., Qi Y., Hsieh T.-H.S., English B.P., Jung S., Chen X., De Marzio M., Casellas R., Chang H.Y., et al. BRD2 compartmentalizes the accessible genome. Nat. Genet. 2022;54:481–491. doi: 10.1038/s41588-022-01044-9. [DOI] [PMC free article] [PubMed] [Google Scholar]
- Yagi M., Kabata M., Tanaka A., Ukai T., Ohta S., Nakabayashi K., Shimizu M., Hata K., Meissner A., Yamamoto T., et al. Identification of distinct loci for de novo DNA methylation by DNMT3A and DNMT3B during mammalian development. Nat. Commun. 2020;11:3199. doi: 10.1038/s41467-020-16989-w. [DOI] [PMC free article] [PubMed] [Google Scholar]
- Yang H., Luan Y., Liu T., Lee H.J., Fang L., Wang Y., Wang X., Zhang B., Jin Q., Ang K.C., et al. A map of cis-regulatory elements and 3D genome structures in zebrafish. Nature. 2020;588:337–343. doi: 10.1038/s41586-020-2962-9. [DOI] [PMC free article] [PubMed] [Google Scholar]
- Yin Y., Fan H., Zhou B., Hu Y., Fan G., Wang J., Zhou F., Nie W., Zhang C., Liu L., et al. Molecular mechanisms and topological consequences of drastic chromosomal rearrangements of muntjac deer. Nat. Commun. 2021;12:6858. doi: 10.1038/s41467-021-27091-0. [DOI] [PMC free article] [PubMed] [Google Scholar]
- Zabidi M.A., Arnold C.D., Schernhuber K., Pagani M., Rath M., Frank O., Stark A. Enhancer-core-promoter specificity separates developmental and housekeeping gene regulation. Nature. 2015;518:556–559. doi: 10.1038/nature13994. [DOI] [PMC free article] [PubMed] [Google Scholar]
- Zehnder T., Benner P., Vingron M. Predicting enhancers in mammalian genomes using supervised hidden Markov models. BMC Bioinformatics. 2019;20:157. doi: 10.1186/s12859-019-2708-6. [DOI] [PMC free article] [PubMed] [Google Scholar]
- Zhan Y., Mariani L., Barozzi I., Schulz E.G., Blüthgen N., Stadler M., Tiana G., Giorgetti L. Reciprocal insulation analysis of Hi-C data shows that TADs represent a functionally but not structurally privileged scale in the hierarchical folding of chromosomes. Genome Res. 2017;27:479–490. doi: 10.1101/gr.212803.116. [DOI] [PMC free article] [PubMed] [Google Scholar]
- Zhang X., Pavlicev M., Jones H.N., Muglia L.J. Eutherian-specific gene TRIML2 attenuates inflammation in the evolution of placentation. Mol. Biol. Evol. 2020;37:507–523. doi: 10.1093/molbev/msz238. [DOI] [PMC free article] [PubMed] [Google Scholar]
- Zhang Y., Jurkowska R., Soeroes S., Rajavelu A., Dhayalan A., Bock I., Rathert P., Brandt O., Reinhardt R., Fischle W., et al. Chromatin methylation activity of Dnmt3a and Dnmt3a/3L is guided by interaction of vthe ADD domain with the histone H3 tail. Nucleic Acids Res. 2010;38:4246–4253. doi: 10.1093/nar/gkq147. [DOI] [PMC free article] [PubMed] [Google Scholar]
- Zhang Y., Li T., Preissl S., Amaral M.L., Grinstein J.D., Farah E.N., Destici E., Qiu Y., Hu R., Lee A.Y., et al. Transcriptionally active HERV-H retrotransposons demarcate topologically associating domains in human pluripotent stem cells. Nat. Genet. 2019;51:1380–1388. doi: 10.1038/s41588-019-0479-7. [DOI] [PMC free article] [PubMed] [Google Scholar]
- Zuin J., Roth G., Zhan Y., Cramard J., Redolfi J., Piskadlo E., Mach P., Kryzhanovska M., Tihanyi G., Kohler H., et al. Nonlinear control of transcription through enhancer–promoter interactions. Nature. 2022;604:571–577. doi: 10.1038/s41586-022-04570-y. [DOI] [PMC free article] [PubMed] [Google Scholar]
Associated Data
This section collects any data citations, data availability statements, or supplementary materials included in this article.
Supplementary Materials
Breakpoint genotyping primers are used to detect deletions (del), site specific integration (ssi) or specific KI-construct (kic).
Data Availability Statement
-
•
All data reported in this paper will be shared by the lead contact upon request. This paper analyzes existing, publicly available data whose accession numbers are listed in the key resources table. Sequencing data generated in this study are available at the NCBI Gene Expression Omnibus, GEO: GSE185775.
-
•
This paper does not report original code.
-
•
Any additional information required to reanalyze the data reported in this work paper is available from the lead contact upon request.