Background:
A urinary tract infection (UTI) is one of the most common types of infections affecting the urinary tract. When bacteria enter the bladder or kidney and multiply in the urine, a URI can occur. The urethra is shorter in women than in men, which makes it easier for bacteria to reach the bladder or kidneys and cause infection. A comparison of the research differences between Urology and Nephrology (UN) authors regarding UTI pertaining to the 4 areas (i.e., Chronic Kidney Disease, Hemodialysis, Peritoneal Dialysis, and Renal Transplantation [CHPR]) is thus necessary. We propose and verify 2 hypotheses: CHPR-related articles on UTI have equal journal impact factors (JIFs) in research achievements (RAs) and UN authors have similar research features (RFs).
Methods:
Based on keywords associated with UTI and CHPR in titles, subject areas, and abstracts since 2013, we obtained 1284 abstracts and their associated metadata (e.g., citations, authors, research institutes, departments, countries of origin) from the Web of Science core collection. There were 1030 corresponding and first (co-first) authors with hT-JIF-indices (i.e., JIF was computed using hT-index rather than citations as usual). The following 5 visualizations were used to present the author’s RA: radar, Sankey, time-to-event, impact beam plot, and choropleth map. The forest plot was used to distinguish RFs by observing the proportional counts of keyword plus in Web of Science core collection between UN authors.
Results:
It was observed that CHPR-related articles had unequal JIFs (χ2 = 13.08, P = .004, df = 3, n = 1030) and UN departments had different RFs (Q = 53.24, df = 29, P = .004). In terms of countries, institutes, departments, and authors, the United States (hT-JIF = 38.30), Mayo Clinic (12.9), Nephrology (19.14), and Diana Karpman (10.34) from Sweden had the highest hT-JIF index.
Conclusion:
With the aid of visualizations, the hT-JIF-index and keyword plus were demonstrated to assess RAs and distinguish RFs between UN authors. A replication of this study under other topics and in other disciplines is recommended in the future, rather than limiting it to UN authors only, as we did in this study.
Keywords: bibliometric analysis, hemodialysis, hT-index, impact beam plot, journal impact factor, peritoneal dialysis, research achievement, research feature
Key points
-
•
The novel hT-JIF index was introduced and proposed for this bibliometric analysis of CHPR pertaining UTI articles using visualizations.
-
•
Radar plots with the hT-JIF index were used to visualize the RAs based on the co-first authors, which is rare in bibliometric studies.
-
•
A time-to-event analysis and forest plot were used in this study to verify the 2 hypotheses. There is a lack of literature demonstrating the effectiveness of the method in detail about verifying the hypotheses as did in this study.
-
•
Supplemental Digital Files contain instructions for conducting this study for readers wishing to replicate it independently.
1. Introduction
Infections of the urinary tract (UTIs) occur when bacteria from the skin or rectum enter the urethra and infect the urinary tract.[1] Bladder infection (cystitis) is the most common type of infection of the urinary tract. Kidney infection (pyelonephritis) is another type of UTI. There are fewer of them, but they are more serious than bladder infections.[2] UTIs treated by Urology and Nephrology (UN) physicians are required to be known.
In some cases, pyelonephritis is not caused by UTIs which are not treated promptly. Several factors contribute to the development of pyelonephritis, and it may occur without a history of cystitis. Nonetheless, when a UTI is not treated promptly, the bacteria can travel up to the kidneys and cause pyelonephritis. Pyelonephritis is an infection of the kidney that produces urine. Fever and back pain may result as a result of this condition.[3] It is estimated that 80% to 90% of UTIs are caused by specialized Escherichia coli (E coli) strains referred to as uropathogenic E coli. Althrough Enterobacteriaceae are bacteria that can be found in the digestive tract, they can be isolated from a variety of sources, and UTIs are not always caused by bacteria in the intestinal. However, if these bacteria live in the intestines, they may occasionally enter the urinary tract system. Other types of bacteria, which are less common, can also cause urinary tract infections.[4]
1.1. Patients at high risk of developing UTI in the 4 groups
Chronic kidney disease (CKD) is defined as damage to the kidneys that lasts at least 3 months or more and results in a decrease in the glomerular filtration rate below 60 mL/min/1.73 m2, regardless of the cause.[5] Some chronic diseases, such as diabetes mellitus and hypertension, as well as some primary renal disorders, such as glomerulonephritis, eventually develop CKD as a result of their long-term complications.[6] The estimated prevalence of CKD worldwide is 13.4% (11.7%–15.1%), and the estimated number of patients with end-stage kidney disease (ESKD) requiring renal replacement therapy ranges from 4.902 to 7.083 million in China.[7] End-stage renal disease (ESRD) is defined as when a person’s kidneys cease to function on a permanent basis, requiring long-term dialysis or kidney transplantation to maintain life.[8]
Despite the lack of available data for developing countries, it is estimated that 70% of patients with ESRD (stage 5 CKD) will be in developing countries by 2030, which will increase the burden on health care systems’ budgets.[6,9]
As the population ages, the incidence of ESRD increases every year. The mortality rate remains high despite the continuous development of medical standards.[10] During the early stages of CKD, medical doctors will try to slow or control the causes of the patient’s kidney disease. It is important to note that treatment options vary according to the cause. However, damage to the kidneys may continue to worsen even when an underlying condition, such as diabetes mellitus or high blood pressure, has been controlled. There’s no cure for CKD, but treatment can help relieve the symptoms and stop it getting worse. The treatment will depend on the stage of patients’ CKD, such as lifestyle changes—to help patients stay as healthy as possible, medicine—to control associated problems (e.g., high blood pressure and high cholesterol).[11,12]
In the treatment of ESRD, a variety of renal replacement therapies are commonly used, including hemodialysis, peritoneal dialysis, and renal transplantation.[13] The treatment may result in an increase in life expectancy, but it must be maintained for an extended period of time, which has a substantial impact on the patient physically and psychologically.[14] In addition, there is a high risk of developing UTI and/or sepsis (urosepsis) in patients with CKD, hemodialysis, peritoneal dialysis, and renal transplantation (CHPR for short).[15] However, little is known about research achievements (RAs) in CHPR-related articles on UTI, as well as research features (RFs) among UN authors.
1.2. Journal impact factor of articles on CHPR related to UTI
The Journal Impact Factor (JIF) is an index annually published by The Journal Citation Reports.[16] It was proposed by Eugene Garfield in 1955 to compare investigators’ and journals’ research influence on its time.[17] Original research and review articles are the only article types that meet the definition of citable articles according to the Institute of Scientific Information.[18,19] Web of Science (Thomson Reuters Inc.) is a citation service accessible through an indexing database and search engine on the Web of Science core collection (WoSCC).[20–24] Factors associated with the JIF for UN journals were investigated.[16] The JIF might be used to compare RAs in CHPR-related articles on UTI instead of the traditional citations that appear in articles on a regular basis.
Because UTI most commonly occurs in kidneys and bladders, we proposed 2 hypotheses:
The RAs in CHPR-related articles on UTI based on JIFs are equal.
The RFs between UN authors based on article keywords in WoSCC are similar.
1.3. Challenges faced in comparing the 2 issues
There are several challenges that need to be overcome in order to validate the 2 hypotheses, such as appropriate bibliometric metrics to measure the RAs are required to determine; statistical methods to examine differences in RAs of CHPR are lacking in dealing with missing data in JIF; RFs defined using medical subject headings (MeSH terms)[25–27] are still not uncovered using the keyword plus in WoSCC in literature; and the visualization used to differentiate RFs between 2 journal authors not found in past research.
Fortunately, the hT-index (also known as the Tapered h-index)[28,29] takes into account all citations with descending weights when evaluating the RAs and generalizes the h-index.[30] The hT-index more closely related to the h-index than other bibliometric indices (e.g., x-/g-index[31,32]) has been verified.[33]
Time-to-event analysis, also known as survival analysis, refers to a set of methods for analyzing the length of time until a well-defined endpoint occurs.[34] It is unique to survival data that not all subjects (e.g., CHPR articles in this study) experience the event (e.g., having JIF denoted by 1 for the event) by the end of the observation period (e.g., JIF observed in this study) so that the exact survival times (denoted by JIF) for some articles are unknown (i.e., JIF = 0 censored with nonevent in time-to-event analysis).[35,36] In addition, data are usually skewed, which limits the usefulness of analysis methods that assume a normal distribution. Thus, nonparametric and semiparametric methods, specifically the Kaplan−Meier estimator, log-rank test, and Cox proportional hazards model, can be applied to the ongoing series of time-to-event JIF data in CHPR articles.
By using social network analysis (SNA)[37–39] to replace MeSH terms[25–27] with keyword plus, the RFs between UN authors can be compared using forest plots.[25,36]
1.4. Aims of this study
The purpose of this study is to verify the 2 hypotheses: CHPR-related articles on UTI have equal JIFs in RAs and UN authors have similar RFs.
2. Methods
2.1. Data source
By searching the WoSCC with keywords involving CHPR-related articles on UTI (see Supplemental Digital Content 1, http://links.lww.com/MD/H561) with articles and review articles only since 2013, we obtained 1284 abstracts and their corresponding metadata (e.g., citations, country of origin, research institutes, authors placed in the first and corresponding positions, and JIFs of The Journal Citation Reports in 2022[16]).
The data deposited in Supplemental Digital Content 2, http://links.lww.com/MD/H562 are publicly available on the WoSCC’s website. Therefore, ethical approval was not needed.
2.2. First goal: CHPR articles on UTI with JIFs in RAs
2.2.1. Computation of the ht-JIF index.
The citations were replaced with JIFs in computing the hT-JIF index for each article using Equation 1.
| (1) |
= 0, JIF = 0 (e.g., Emerging Sources Citation Index in WoSCC)
where i is within 1 to JIF. For example, an article with JIF = 6 has hT-JIF = 1.88 (=1 + 1/3 + 1/5 + 1/7 + 1/9 + 1/11). The algorithm of hT computation is at the link.[40]
2.2.2. Time-to-event analysis applied to compare RAs in CHPR.
Statistical analyses were performed using MedCalc for Windows, version 19.4 (MedCalc Software, Ostend, Belgium). Data were arranged in 3 sequential columns, as shown in Equation 2.
| (2) |
By using Microsoft Excel, JIFs are integers using the round (JIF + 1, 0) function if JIF > 0 and IF (JIF = 0, 0, 1) in the columns of JIR and event, respectively, where the censored event is indicated by 0 in column 2.
Time-to-event analysis was performed (see Supplemental Digital Content 3, http://links.lww.com/MD/H563). Hazard ratios with 95% confidence intervals (CIs) were used to examine the difference between groups if the log-rank test was significant when the Type I error was set at α = 0.05.
2.3. Statistical description
2.3.1. Computation of the ht-JIF index in many articles.
The hT-JIF index is derived from Equations 3 to 5 if the number of articles is greater than 1.[33]
| (3) |
| (4) |
| (5) |
The starting weight in an article is determined by Equation 3, where j = 1. For example, an article with JIF = 6 has hT-JIF = 1.88 (=1 + 1/3 + 1/5 + 1/7 + 1/9 + 1/11), as computed by Equation 1.
The weights of ten papers, for instance, with ten JIFs each, can be computed in Table 1 following Equations 4 and 5. In papers 1 to 10, the hT indices monotonically increase [2.13, 3.59, 4.79, 5.81, 6.71, 7.51, 8.25, 8.82, 9.51, 10.00], suggesting that the h-core articles are identical to those in the hT core and the contribution of the hT core is not changed in the hT core Durfee square.[28,29]
Table 1.
Weights allocated to the 10 articles with 10 JIFs each (hT = 10 in this case).
| Weight | JIF | +hT | hT | |||||||||
|---|---|---|---|---|---|---|---|---|---|---|---|---|
| Article | 1 | 2 | 3 | 4 | 5 | 6 | 7 | 8 | 9 | 10 | ||
| 1 | 1 | 0.33 | 0.2 | 0.14 | 0.11 | 0.09 | 0.08 | 0.07 | 0.06 | 0.05 | 2.13 | 2.13 |
| 2 | 0.33 | 0.33 | 0.2 | 0.14 | 0.11 | 0.09 | 0.08 | 0.07 | 0.06 | 0.05 | 1.46 | 3.59 |
| 3 | 0.2 | 0.2 | 0.2 | 0.14 | 0.11 | 0.09 | 0.08 | 0.07 | 0.06 | 0.05 | 1.2 | 4.79 |
| 4 | 0.14 | 0.14 | 0.14 | 0.14 | 0.11 | 0.09 | 0.08 | 0.07 | 0.06 | 0.05 | 1.02 | 5.81 |
| 5 | 0.11 | 0.11 | 0.11 | 0.11 | 0.11 | 0.09 | 0.08 | 0.07 | 0.06 | 0.05 | 0.9 | 6.71 |
| 6 | 0.09 | 0.09 | 0.09 | 0.09 | 0.09 | 0.09 | 0.08 | 0.07 | 0.06 | 0.05 | 0.8 | 7.51 |
| 7 | 0.08 | 0.08 | 0.08 | 0.08 | 0.08 | 0.08 | 0.08 | 0.07 | 0.06 | 0.05 | 0.74 | 8.25 |
| 8 | 0.07 | 0.07 | 0.07 | 0.07 | 0.07 | 0.07 | 0.07 | 0.07 | 0.06 | 0.05 | 0.67 | 8.92 |
| 9 | 0.06 | 0.06 | 0.06 | 0.06 | 0.06 | 0.06 | 0.06 | 0.06 | 0.06 | 0.05 | 0.59 | 9.51 |
| 10 | 0.05 | 0.05 | 0.05 | 0.05 | 0.05 | 0.05 | 0.05 | 0.05 | 0.05 | 0.05 | 0.5 | 10 |
| hT | 10 | |||||||||||
+ means the summation on rows.
JIF = journal impact factor.
2.3.2. Draw radar plots with ht-JIF-indices for entities.
Four types of article-related entities were included; namely, counties, research institutes, departments, and authors, to compare their RAs using the hT-JIF index and draw them on radar plots.
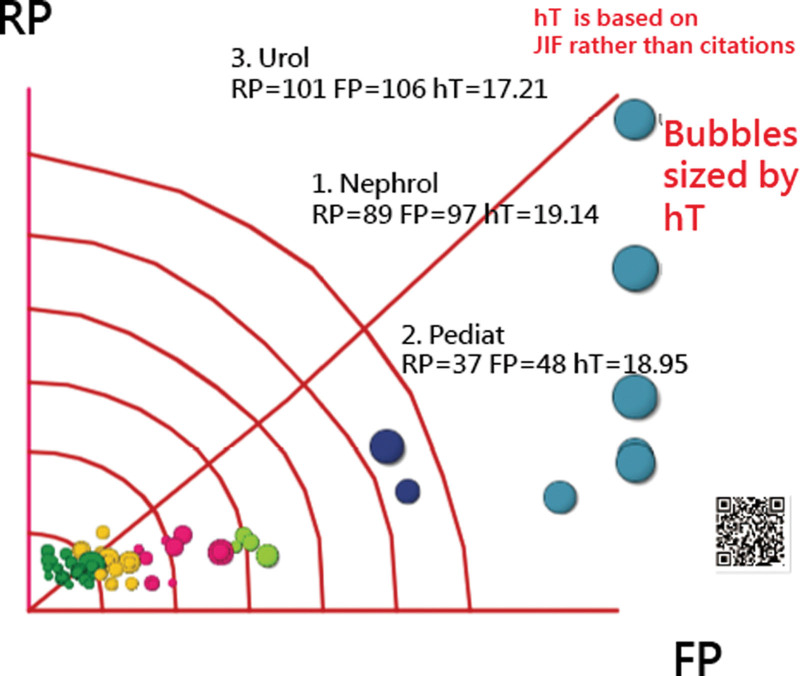
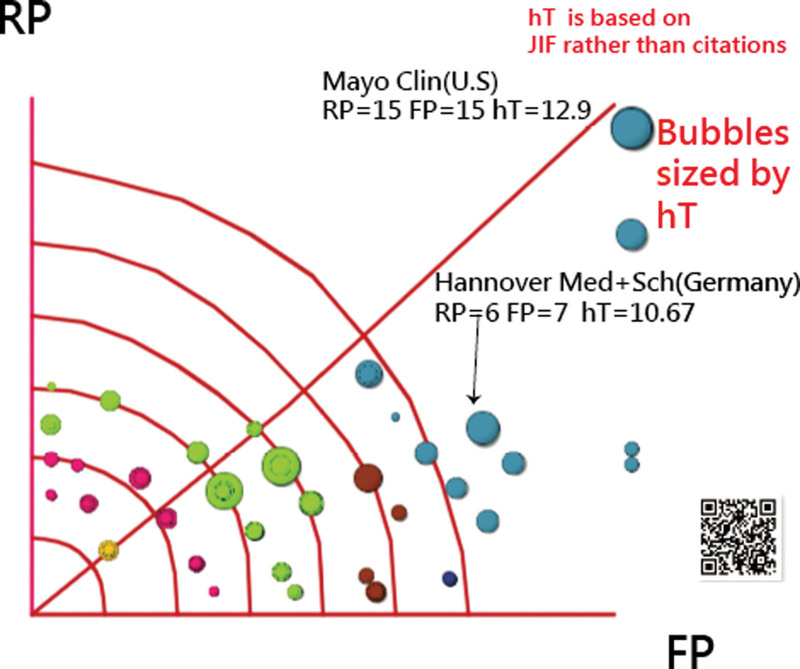
The Y-index[41,42] was proposed to evaluate the RAs based on the number of publications in the positions of corresponding and first (co-first) authors (denoted by J = FP and RP). Unfortunately, previous studies have not illustrated the way in which the radar diagram can be drawn based on the Y-index (=as the radius in the first quadrant).[41,42] The RAs should not be measured solely by publications (e.g., the Y-index). To select the entities that contributed most to the CHPR-related articles on UTI in this study, the hT-JIF index can be used by taking into account both publications and JIFs denoted by bubble size on the radar plot.[43]
A choropleth map[44] was used to compare the RA across countries/regions. In particular, the RAs in the US states and provinces/metropolitan cities in China were compared with those in other countries/regions based on equal research populations.
2.4. Second goal: RFs in UN authors
2.4.1. Data arrangement.
The RFs in UN departments were selected and compared by using the keyword plus in WoSCC through the following steps:
Step 1: Cluster analysis was performed using SNA[37–39] and Pajek software[45] for the keyword plus in UN departments and drawing them on Sankey diagrams.[46,47]
Step 2: A comparison of differences in RFs was made on the forest plot.[27,37,47]
2.4.2. Computation of parameters in a forest plot.
The forest plot presents the degree to which data from multiple studies (e.g., keyword plus in this study) observing the same effect overlap with one another.[48] The results that fail to overlap (or fit) well are given the term heterogeneity of the data, which are deemed less conclusive. Otherwise, the data are said to be homogeneous and more conclusive. The heterogeneity is indicated by the I2 statistics[49]; see Equations 6 to 11 below.
| (6) |
| (7) |
| (8) |
| (9) |
| (10) |
| (11) |
| (12) |
| (13) |
| (14) |
| (15) |
where k is the number of keywords plus. The P value yielded by the function in MS Excel [i.e., Chidist (T2, df)] is identical to the approach using analysis of variance.[23,46] The df is the degree of freedom (i.e., k − 1), n denotes the sample size (i.e., the even counts and the total observations) in the 2 groups,[50] and derived from Equation 10. The Vari is the within-study variance in study i.
The computation of odds ratios and their CIs are addressed in Equations 16 to 20, where the even and noneven numbers for 2 groups (i.e., UN departments in this study) were set as {n1e, n1n} and {n2e, n2n}. Accordingly, the odds ratio is computed by the formula (n1e × n2n)/(n2e × n1n)[47] in Equation 16, and the 95% CI equal to Odds +/- 1.96 × SEi, see Equation 20.
| (16) |
| (17) |
| (18) |
| (19) |
| (20) |
If all odds ratios in a series of studies were compared, a heterogeneity of less than 50% was deemed low based on I2 in Equation 6 and indicates a greater degree of similarity between study data (e.g., keywords) than an I2 value above 50%, which indicates more dissimilarity.[27,51–53]
2.5. Articles with higher JIFs in UN departments
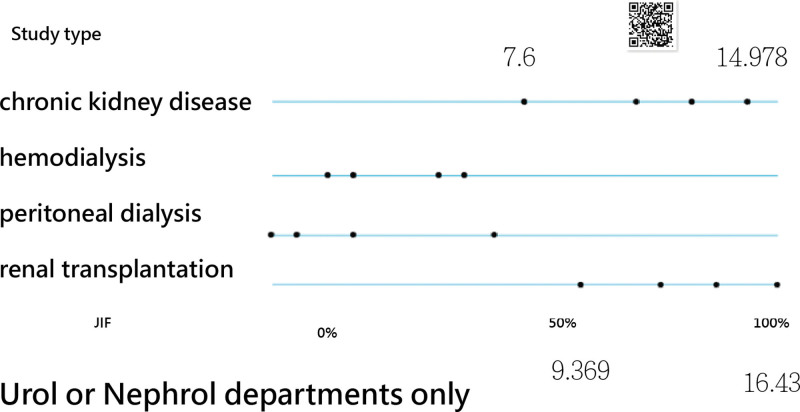
CHPR articles on UTIs with higher JIFs in UN departments were displayed on an impact beam plot (IBP).[54,55] The top JIF articles denoted by each dot were displayed on the IBP, from the left to the right side, by study type with normalized JIF from 0 to 100 (i.e., using the MSExcel function of PercentRank (array, x, 1) × 100). The IPB dashboard was shown on Google Maps. The article is immediately linked to PubMed once the dot is clicked on the dashboard.
2.6. Statistics and tools
A forest plot was used to compare the odds ratios. The significance level for type I error was set at 0.05.
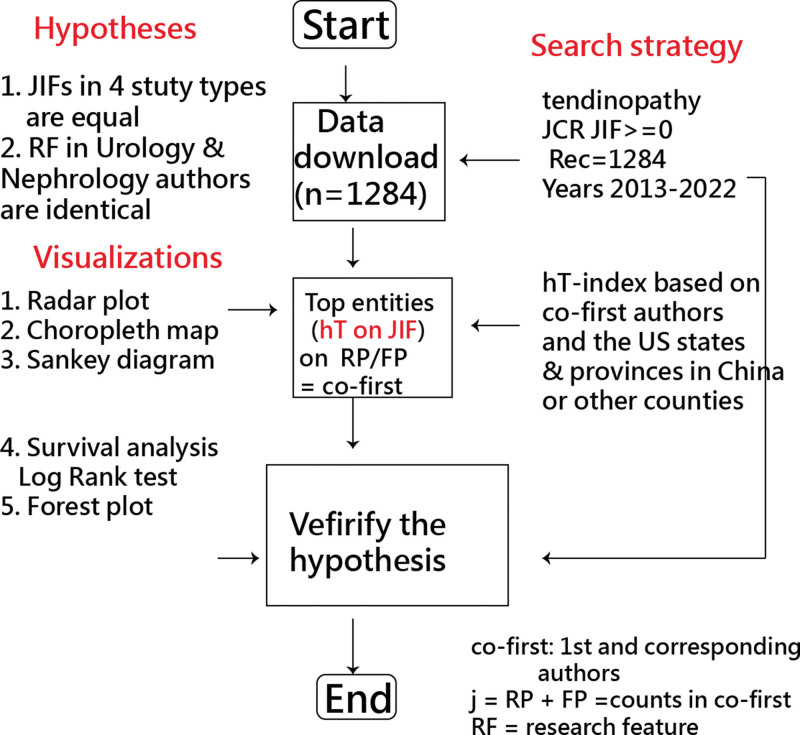
The following 4 visualizations were used to present the author’s RA: radar, Sankey, time-to-event, and choropleth map. The forest plot was used to distinguish RFs by observing the proportional counts of keyword plus in WoSCC between UN authors. Google Maps was used to plot both choropleth maps and radar diagrams. The study flowchart is shown in Figure 1.
Figure 1.
Study flowchart.
3. Results
3.1. First goal: CHPR articles on UTI with JIFs in RAs
We obtained 1284 abstracts and their associated metadata (e.g., citations, authors, research institutes, departments, countries of origin) from the WoSCC since 2013 (Table 2). There were 1030 corresponding and first (co-first) authors with hT-JIF-indices (i.e., JIF was computed using hT-index rather than citations as usual).
Table 2.
Distribution of publications for the 4 study types over the years.
| Study type | 2013 | 2014 | 2015 | 2016 | 2017 | 2018 | 2019 | 2020 | 2021 | 2022 | n |
|---|---|---|---|---|---|---|---|---|---|---|---|
| Chronic kidney disease | 38 | 24 | 33 | 49 | 59 | 65 | 88 | 66 | 99 | 42 | 563 |
| Hemodialysis | 8 | 9 | 8 | 5 | 11 | 15 | 12 | 12 | 12 | 9 | 101 |
| Peritoneal dialysis | 7 | 4 | 5 | 2 | 4 | 3 | 2 | 7 | 3 | 3 | 40 |
| Renal transplantation | 54 | 50 | 44 | 61 | 72 | 84 | 63 | 63 | 67 | 22 | 580 |
| n | 107 | 87 | 90 | 117 | 146 | 167 | 165 | 148 | 181 | 76 | 1284 |
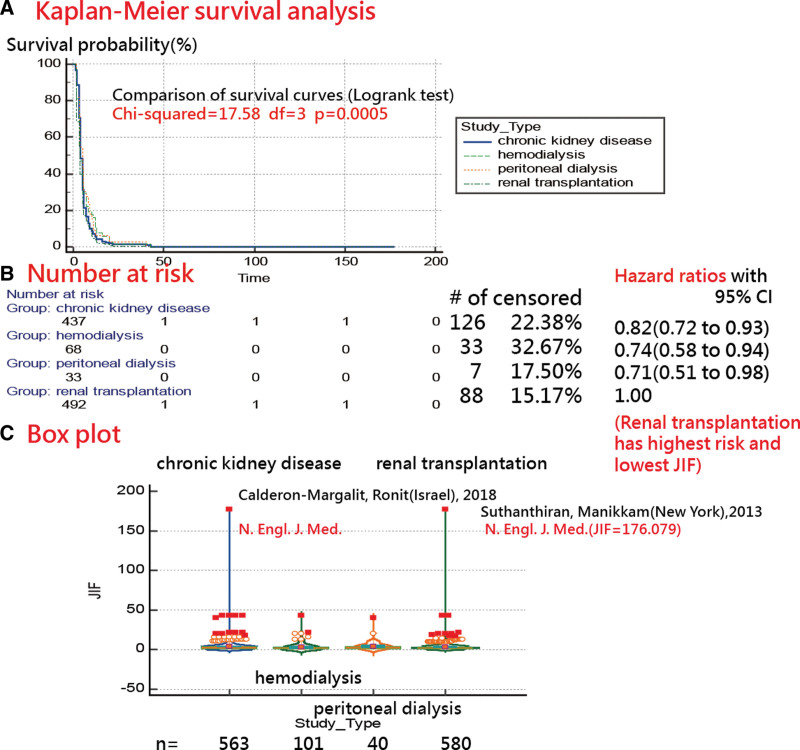
As shown in Figure 2, CHPR-related articles had unequal JIFs (χ2 = 13.08, P = .004, df = 3, n = 1030). As a result of its highest hazard ratios and 95% confidence intervals, the study type of renal transplantation has the lowest JIF among CHPRs. There was no support for the first hypothesis that CHPR-related articles relating to UTI had equal JIFs in RA.
Figure 2.
Time-to-event analysis of CHPR articles on UTI with JIFs in Ras. CHPR = Chronic Kidney Disease, Hemodialysis, Peritoneal Dialysis, and Renal Transplantation, JIF = journal impact factor, RA = research achievement, UTI = urinary tract infection.
3.2. Statistical description
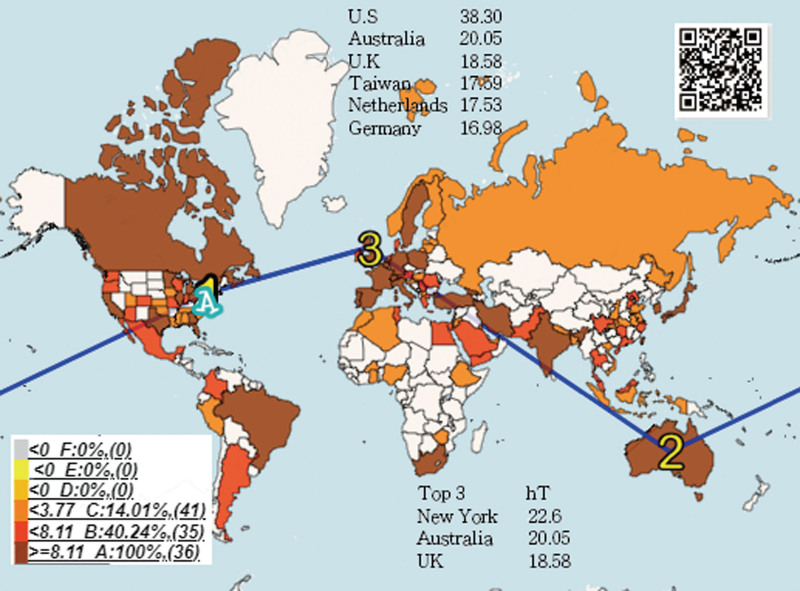
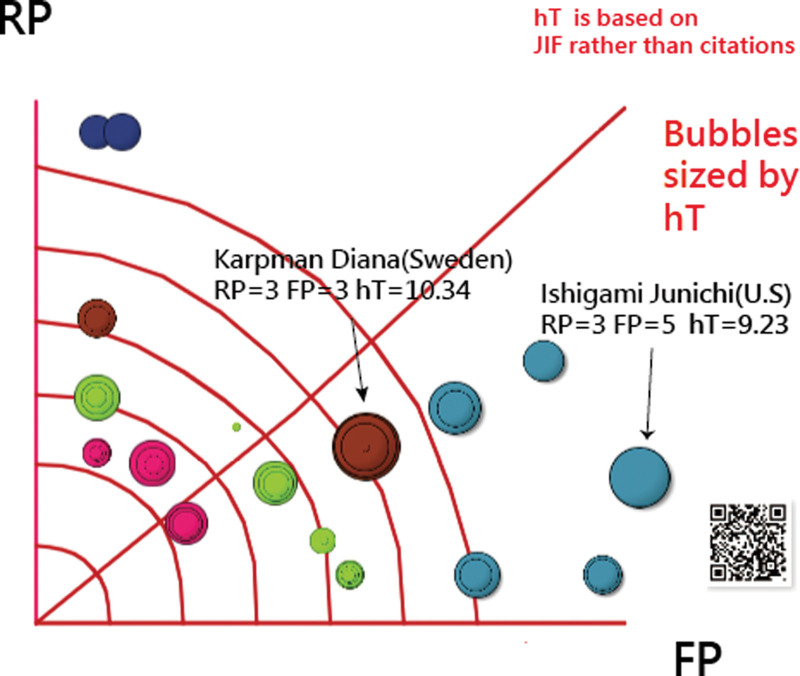
In terms of countries, institutes, departments, and authors, the United States (38.30), Mayo Clinic (12.9), Nephrology (19.14), and Diana Karpman (10.34) from Sweden had the highest hT-JIF index; see Figures 3 to 6. It is worth noting that New York ranks top in hT-JIF indices, followed by Australia and the UK, when the US states and provinces/metropolitan cities in China were involved in comparison (Fig. 3).
Figure 3.
Geographical distribution of hT-JIF indices in countries/regions. JIF = journal impact factor.
Figure 6.
Comparison of the hT-JIF index among authors on a radar plot. JIF = journal impact factor.
3.3. Second goal: RFs in UN authors
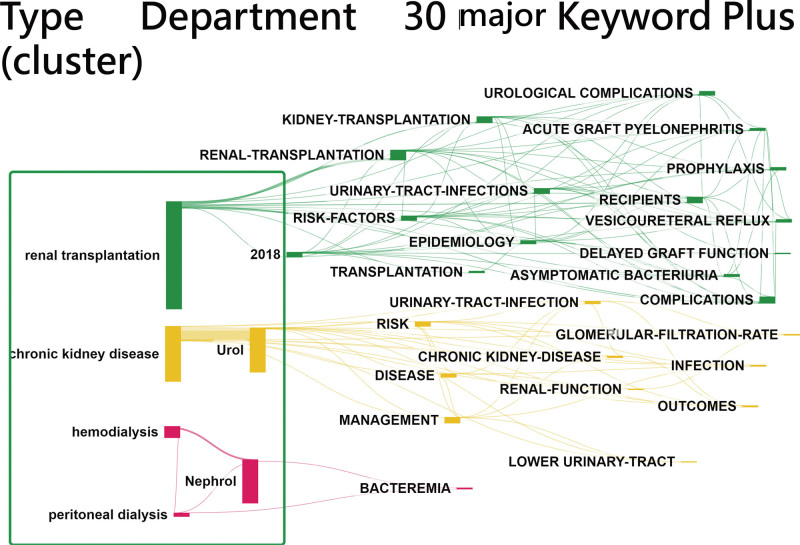
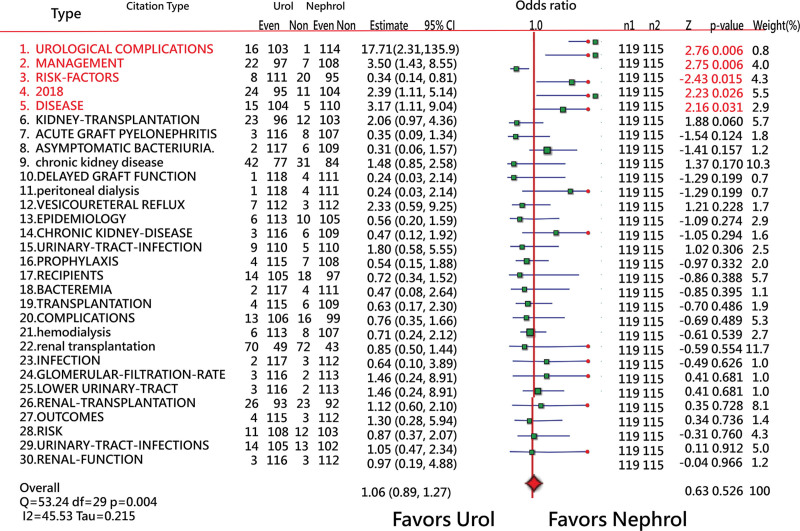
In Figure 7, 3 major clusters (renal transplantation, CKD, and nephrology) are separated by color, and 30 major keywords are displayed. The wider lines between keywords indicate the frequency of relationships between them. A larger block indicates that there are more keywords observed in SNA. As illustrated in Figure 8, UN departments had different RFs (Q = 53.24, df = 29, P = .004). The I2 (=45.53% <50%) indicates a greater degree of similarity between keywords.[27,51–53] However, there is no evidence supporting the second hypothesis that UN authors have similar RFs.
Figure 7.
Three clusters were separated using SNA for keyword plus. SNA = social network analysis.
Figure 8.
Comparison of 30 major keywords in proportional counts in UN departments. UN = Urology and Nephrology.
3.4. Articles with higher JIFs in UN departments
Figure 9 shows CHPR articles on UTIs with higher JIFs in UN departments. The article published in 2013 with the highest JIF (16.43) was written by Heyns CF from South Africa.[56] The 2 articles[57,58] with the highest JIF shown in Figure 2 (bottom) were not written by UN authors. Readers are invited to scan the QR code in Figure 9 and click on the dot of interest to read the article on PubMed.
Figure 9.
CHPR articles on UTI with higher JIFs in UN departments on the IBP. CHPR = Chronic Kidney Disease, Hemodialysis, Peritoneal Dialysis, and Renal Transplantation, IBP = impact beam plot, JIF = journal impact factor, UN = Urology and Nephrology, UTI = urinary tract infection.
Figure 5.
Comparison of the hT-JIF index among departments on a radar plot. JIF = journal impact factor.
3.5. Online dashboards shown on google maps
All the QR codes in Figures are linked to the dashboards. Readers are suggested to examine the displayed dashboards on Google Maps.
4. Discussion
We observed that CHPR-related articles had unequal JIFs (χ2 = 13.08, P = .004, df = 3, n = 1030) and UN departments had different RFs (Q = 53.24, df = 29, P = .004). In terms of countries, institutes, departments, and authors, the United States (hT-JIF = 38.30), Mayo Clinic (12.9), Nephrology (19.14), and Diana Karpman (10.34) from Sweden had the highest hT-JIF index.
4.1. Additional information
A growing number of patients worldwide suffer from CKD, which is associated with an increased risk of progression to ESKD.[15] The risk of developing infections (e.g., UTI) and/or sepsis (urosepsis) is high among patients with CKD stage 2 to 5, patients receiving chronic dialysis treatment (hemodialysis or peritoneal dialysis), and patients with kidney allograft dysfunction. However, little information is available regarding how many of these patients suffer from urinary tract infections.
The prevalence of CKD worldwide is estimated at 13.4% (11.7%–15.1%), and the estimated number of patients with ESKD needing renal replacement therapy in China is between 4.902 and 7.083 million.[7] The incidence of infections associated with CKD is less than one per 5000 people per year,[59–61] but frequent UTI episodes may increase the risk of developing ESKD.[61] It is higher in infants and young children than in adults but still moderate at approximately 1%.[62] A number of clinical risk factors and comorbidities other than UTI are suspected of contributing to the development of ESKD. Predisposing factors for UTI development in CKD patients include sex, age, genetic disposition, diabetes mellitus, obstructive nephropathy, arteriolosclerosis (microvascular calcification, ischemic nephropathy), nephrolithiasis, cast nephropathy, immunodeficiency syndromes, and immunosuppressive therapy.[59,63] No bibliometric analysis has been undertaken to determine whether CHPR-related articles on UTI have unequal JIFs between RAs, and UN authors have slightly different RFs, as we did in this study.
To measure research output, most institutions surveyed still rely on simple, easily quantifiable metrics, such as the JIF or publication count.[64–66] In Taiwan’s medical schools, the JIF has an unrivaled role in determining the faculty’s achievement evaluation and promotion. A major component of the evaluation is the CJA (category of article, journal quality, and author order) assessment.[67] Hence, we measured the RAs of authors with CHPR articles on UTI using the hT-JIF index.
Thirty-six percent of the 7618 papers on peritoneal dialysis published in 887 journals were written by American authors (6991 articles and 627 reviews),[68] and the United States was the most productive country (n = 51) among the top 100 influential papers on peritoneal dialysis.[69] In HD/PD articles, the United States had the highest hT index (=37.15) compared to many other countries. These results are consistent with our findings regarding the dominance of the United States in articles regarding CHPR-related UTI since 2013 (hT-JIF = 38.30).[33]
4.2. High JIF articles regarding CHPR-related to UTI
An article that discusses CHPR-related UTIs with PMID = 24166342, entitled Urological aspects of HIV and AIDS, was published in 2013 in Nat. Rev. Urol. and written by Urology authors in University Stellenbosch in South Africa, has a few citations in WoSCC (=5).
An article with PMID = 24166342,[57] entitled History of Childhood Kidney Disease and Risk of Adult End-Stage Renal Disease, written by Ronit Calderon-Margalit (Israel) and published in N Engl J Med. in 2018, has 75 citations in WoSCC.
Manikkam Suthanthiran (U.S.) also published a study, Urinary-cell mRNA profile and acute cellular rejection in kidney allografts, in N Engl J Med. in 2013, which has 225 citations in WoSCC.
4.3. Implications and changes
There are several distinctive features of the study. First, the hT-JIF index with decimal places can be used to complement the hT-/h-index[28–30] to enhance the discrimination power for identifying RAs and ranking within a group.[70]
Second, time-to-event analysis[34] is unique because not all subjects (e.g., CHPR articles in this study) have experienced the event (e.g., having a JIF of 1 for the event) by the end of the observed JIF, so the exact JIF for some articles remains unknown during analysis.[35,36] Additionally, data are usually skewed, limiting the usefulness of methods that assume a normal distribution. Thus, the Kaplan−Meier estimator and log-rank test can be adapted to CHPR articles that contain time-to-event JIF data.
Third, IBPs[54,55] allow authors to examine articles in a completely new manner, particularly with links to PubMed. In addition, Supplemental Digital File 2, http://links.lww.com/MD/H562 describes how to draw the IBP on Google Maps.
Additionally, the study provides 3 visual representations, including a choropleth map based on the hT-JIF index, a forest plot to identify the odds ratio in pair comparisons, and a Sankey diagram showing differences in RFs among the 2 UD authors.
It is more complex to calculate the hT index in combination with the JIF than the h index, but this issue can be resolved by a dedicated software program. The hT-index computation is demonstrated on the link,[40] which provides readers with the programming codes for understanding how the hT-index is calculated within a second. Thus, the hT-JIF index can be supplemented with a coordinate in Figures 4 to 6, such as p (FP, RP) with another bubble size. A dedicated software program can be used to overcome the potential problem of computation time by identifying the author RAs.
Figure 4.
Comparison of the hT-JIF index among research institutes on a radar plot. JIF = journal impact factor.
4.4. Limitations and suggestions
There are a number of issues that need to be addressed in detail in further research. As a first concern, only articles pertaining to CHPR-related UTI are included. It is recommended that future studies include a wider range of articles related to UTIs than their RAs and RFs.
The second point is that although the Y-index[41,42] and hT-index[28,29,32] have been considered to be fair measures of RA contributions, it is assumed that the co-first authors contribute equally to the articles. If authorship does not follow the rule as designed, the results regarding the authors who contributed the most to articles regarding CHPR-related UTI will be biased.
Third, it takes some time to calculate the hT index using the sum of weights in the Ferrers tableau (that is, all papers cited or JIF received in the list). The advancement in hardware has made this task trivial, comparable to computing other bibliometric metrics (e.g., h-/x-/g-indices[30–32]) using a dedicated software program, as shown in reference.[40]
Fourth, an hT-JIF index was proposed in this study instead of citations as usual; however, the RA is determined by many other factors (e.g., multiply CJA[67]) that need to be considered when calculating the hT index (e.g., using citations to compute the hT index[67]).
Fifth, according to Figure 3, only countries/regions with higher hT-JIF indices are compared. Readers may also be interested in the list of countries and regions with the Y-index[41,42] shown on the radar plot. Using the radar plot to display this type of influential country/region should be involved in a future study (see how to draw the radar plot in Supplemental Digital File 3, http://links.lww.com/MD/H563).
Finally, even though the hT-JIF index is considered useful and applicable, it should be used with caution when comparing the differences between groups since it does not always follow a normal distribution. It was recommended that readers use the bootstrapping method[71–73] or the time-to-event analysis when comparing RAs between groups, particularly with 95% confidence intervals.
5. Conclusion
In this study, we used the radar plot with the hT-JIF-index based on the number of publications in co-first authors to demonstrate that the hT-JIF-index generalized the h-index on citations for assessing author contributions in quality and quantity from all listed articles. It is important to take into account the hT-JIF-index and the IBP in future relevant bibliometric analyses of academic disciplines or specific research topics, rather than focusing only on articles related to CHPR-related UTI, as we did in this study.
Acknowledgments
We thank Enago (www.enago.tw) for the English language review of this manuscript.
Authors’ contributions
KK, HY and WCK provided the concept and designed this study. CY and WCK interpreted the data. WC monitored the process and the manuscript. TW and HY drafted the manuscript. All authors read the manuscript and approved the final manuscript.
Conceptualization: Keng-Kok Tan, Chen-Yu Wang, Hsien-Yi Wang.
Data curation: Wei-Chih Kan.
Investigation: Willy Chou.
Methodology: Tsair-Wei Chien.
Supplementary Material
Abbreviations:
- CHPR =
- chronic kidney disease, hemodialysis, peritoneal dialysis, and renal transplantation
- CKD =
- chronic kidney disease
- ESKD =
- end-stage kidney disease
- ESRD =
- end-stage renal disease
- IBP =
- impact beam plot
- JIF =
- journal impact factor
- RA =
- research achievement
- RF =
- research feature
- SNA =
- social network analysis
- UN =
- Urology and Nephrology
- UTI =
- urinary tract infection
- WoSCC =
- Web of Science core collection
Ethics approval and consent to participate.
The authors have no funding and conflicts of interest to disclose.
The datasets generated during and/or analyzed during the current study are publicly available.
Supplemental Digital Content is available for this article.
How to cite this article: Tan K-K, Chien T-W, Kan W-C, Wang C-Y, Chou W, Wang H-Y. Research features between Urology and Nephrology authors in articles regarding UTI related to CKD, HD, PD, and renal transplantation. Medicine 2022;101:41(e31052).
Contributor Information
Keng-Kok Tan, Email: kengkoktan@hotmail.com.
Tsair-Wei Chien, Email: smile@mail.chimei.org.tw.
Wei-Chih Kan, Email: rockiekan@ntu.edu.tw.
Chen-Yu Wang, Email: hsienyiwang@gmail.com.
Willy Chou, Email: ufan0101@ms22.hinet.net.
References
- [1].Zhang Q, Shi B, Wu L. Characteristics and risk factors for urinary tract infection in patients with HBV-related acute-on-chronic liver failure: a retrospective study. Medicine (Baltim). 2022;101:e29913. [DOI] [PMC free article] [PubMed] [Google Scholar]
- [2].Flores-Mireles AL, Walker JN, Caparon M, et al. Urinary tract infections: epidemiology, mechanisms of infection and treatment options. Nat Rev Microbiol. 2015;13:269–84. [DOI] [PMC free article] [PubMed] [Google Scholar]
- [3].Shields J, Maxwell AP. Acute pyelonephritis can have serious complications. Practitioner. 2010;254:19–2. [PubMed] [Google Scholar]
- [4].Wu CW, Wei CC, Lin CL, et al. Risk factors for vesicoureteral reflux and urinary tract infections in children with imperforate anus: a population-based case−control study in Taiwan. Medicine (Baltim). 2021;100:e27499. [DOI] [PMC free article] [PubMed] [Google Scholar]
- [5].Orantes CM, Herrera R, Almaguer M, et al. Chronic kidney disease and associated risk factors in the Bajo Lempa region of El Salvador: Nefrolempa study, 2009. MEDICC Rev. 2011;13:14–22. [DOI] [PubMed] [Google Scholar]
- [6].Pearson ER, McCrimmon RJ. Davidson’s Principles and Practice of Medicine. 22nd edn. Vol. 21. Amsterdam, Netherlands: Elsevier, 2014. Diabetes mellitus; p. 827. [Google Scholar]
- [7].Lv JC, Zhang LX. Prevalence and disease burden of chronic kidney disease. Adv Exp Med Biol. 2019;1165:3–15. [DOI] [PubMed] [Google Scholar]
- [8].Zhang L, Guo Y, Ming H. Effects of hemodialysis, peritoneal dialysis, and renal transplantation on the quality of life of patients with end-stage renal disease. Rev Assoc Med Bras (1992). 2020;66:1229–34. [DOI] [PubMed] [Google Scholar]
- [9].Lukkanalikitkul E, Kongpetch S, Chotmongkol W, et al. Optimization of the chronic kidney disease-peritoneal dialysis app to improve care for patients on peritoneal dialysis in Northeast Thailand: user-centered design study. JMIR Form Res. 2022;6:e37291. [DOI] [PMC free article] [PubMed] [Google Scholar]
- [10].Ku E, Glidden DV, Johansen KL, et al. Association between strict blood pressure control during chronic kidney disease and lower mortality after onset of end-stage renal disease. Kidney Int. 2015;87:1055–60. [DOI] [PMC free article] [PubMed] [Google Scholar]
- [11].NHS. Treatment: chronic kidney disease. Available at: https://www.nhs.uk/conditions/kidney-disease/treatment/ [access date August 31, 2022].
- [12].CLINIC. Chronic kidney disease. Available at: https://www.mayoclinic.org/diseases-conditions/chronic-kidney-disease/diagnosis-treatment/drc-20354527 [access date August 31, 2022].
- [13].Robinson BM, Akizawa T, Jager KJ, et al. Factors affecting outcomes in patients reaching end-stage kidney disease worldwide: differences in access to renal replacement therapy, modality use, and hemodialysis practices. Lancet. 2016;388:294–306. [DOI] [PMC free article] [PubMed] [Google Scholar]
- [14].Vidal E, van Stralen KJ, Chesnaye NC, et al. ; ESPN/ERA-EDTA Registry. Infants requiring maintenance dialysis: outcomes of hemodialysis and peritoneal dialysis. Am J Kidney Dis. 2017;69:617–25. [DOI] [PubMed] [Google Scholar]
- [15].Scherberich JE, Fünfstück R, Naber KG. Urinary tract infections in patients with renal insufficiency and dialysis – epidemiology, pathogenesis, clinical symptoms, diagnosis and treatment. GMS Infect Dis. 2021;9:Doc07. [DOI] [PMC free article] [PubMed] [Google Scholar]
- [16].Sewell JM, Adejoro OO, Fleck JR, et al. Factors associated with the Journal Impact Factor (JIF) for Urology and Nephrology Journals. Int Braz J Urol. 2015;41:1058–66. [DOI] [PMC free article] [PubMed] [Google Scholar]
- [17].Garfield E. Citation indices for science; a new dimension in documentation through association of ideas. Science. 1955;122:108–11. [DOI] [PubMed] [Google Scholar]
- [18].Dong P, Loh M, Mondry A. The “impact factor” revisited. Biomed Digit Libr. 2005;2:7–7. [DOI] [PMC free article] [PubMed] [Google Scholar]
- [19].Garfield E. The history and meaning of the journal impact factor. JAMA. 2006;295:90–3. [DOI] [PubMed] [Google Scholar]
- [20].REUTERS T Web of Science. Available at: http://thomsonreuters.com/products_services/science/science_products/a-z/web_of_science/ [access date October 5, 2022].
- [21].REUTERS T WEB OF KNOWLEDGE. Available at: http://thomsonreuters.com/content/science/pdf/Web_of_Knowledge_factsheet.pdf [access date October 5, 2022].
- [22].REUTERS T JCR Application. Available at: http://admin-apps.webofknowledge.com/JCR/JCR?SID=2Fh7PL7E2ib6An63l1%40 [access date October 5, 2022].
- [23].REUTERS T Journal Citation Reports. Available at: http://admin-apps.webofknowledge.com/JCR/help/h_jcrabout.htm [access date October 5, 2022].
- [24].REUTERS T Web of Knowledge Application. Available at: http://apps.webofknowledge.com/WOS_GeneralSearch_input.do?product=WOS&search_mode=GeneralSearch&SID=4Dcc@2o4hp63JNJn1mB&preferencesSaved= [access date October 5, 2022].
- [25].Lin JK, Chien TW, Yeh YT, et al. Using sentiment analysis to identify similarities and differences in research topics and medical subject headings (MeSH terms) between Medicine (Baltimore) and the Journal of the Formosan Medical Association (JFMA) in 2020: A bibliometric study. Medicine (Baltim). 2022;101:e29029. [DOI] [PMC free article] [PubMed] [Google Scholar]
- [26].Chou PH, Yeh YT, Kan WC, et al. Using Kano diagrams to display the most cited article types, affiliated countries, authors and MeSH terms on spinal surgery in the past 12 years. Eur J Med Res. 2021;26:22. [DOI] [PMC free article] [PubMed] [Google Scholar]
- [27].Yan YH, Chien TW. The use of forest plot to identify article similarity and differences in characteristics between journals using medical subject headings terms: a protocol for bibliometric study. Medicine (Baltim). 2021;100:e24610. [DOI] [PMC free article] [PubMed] [Google Scholar]
- [28].Anderson TR, Hankin RKS, Killworth PD. Beyond the Durfee square: Enhancing the h-index to score total publication output. Scientometrics. 2008;76:577–88. [Google Scholar]
- [29].Hua PH, Wan JK, Wu JH. A perfect hirsch-type index? Experiences using the tapered h-Index (hT). Chin J Sci Tech Period. 2010;21:33–7. [Google Scholar]
- [30].Hirsch JE. An index to quantify an individual’s scientific research output. Proc Natl Acad Sci USA. 2005;102:16569–72. [DOI] [PMC free article] [PubMed] [Google Scholar]
- [31].Fenner T, Harris M, Levene M, et al. A novel bibliometric index with a simple geometric interpretation. PLoS One. 2018;13:e0200098. [DOI] [PMC free article] [PubMed] [Google Scholar]
- [32].Egghe L. Theory and practice of the g-index. Scientometrics. 2006;69:131–52. [Google Scholar]
- [33].Wang HY, Chien TW, Kan WC, et al. Authors who contributed most to the fields of hemodialysis and peritoneal dialysis since 2011 using the hT-index: bibliometric analysis. Medicine (Baltimore). 2022;101:e30375. [DOI] [PMC free article] [PubMed] [Google Scholar]
- [34].Schober P, Vetter TR. Survival analysis and interpretation of time-to-event data: the tortoise and the hare. Anesth Analg. 2018;127:792–8. [DOI] [PMC free article] [PubMed] [Google Scholar]
- [35].Lee KW, Chien TW, Yeh YT, et al. An online time-to-event dashboard comparing the effective control of COVID-19 among continents using the inflection point on an ogive curve: observational study. Medicine (Baltim). 2021;100:e24749. [DOI] [PMC free article] [PubMed] [Google Scholar]
- [36].Pollock BD, Storlie CB, Tande AJ, et al. Real-world incidence of breakthrough coronavirus disease 2019 hospitalization after vaccination vs natural infection in a large, local, empaneled primary care population using time-to-event analysis. Clin Infect Dis. 2022;75:1239–41. [DOI] [PMC free article] [PubMed] [Google Scholar]
- [37].Yie KY, Chien TW, Yeh YT, et al. Using social network analysis to identify spatiotemporal spread patterns of COVID-19 around the world: online dashboard development. Int J Environ Res Public Health. 2021;18:2461. [DOI] [PMC free article] [PubMed] [Google Scholar]
- [38].Wu JW, Chien TW, Tsai YC, et al. Using the forest plot to compare citation achievements in bibliographic and meta-analysis studies since 2011 using data on PubMed central: a retrospective study. Medicine (Baltim). 2022;101:e29213. [DOI] [PMC free article] [PubMed] [Google Scholar]
- [39].Liu SY, Chien TW, Yang TY, et al. A bibliometric analysis on dengue outbreaks in tropical and sub-tropical climates worldwide since 1950. Int J Environ Res Public Health. 2021;18:3197. [DOI] [PMC free article] [PubMed] [Google Scholar]
- [40].Chien TW. How to compute the hT-index online. Available at: http://www.healthup.org.tw/kpiall/htindexurl.asp [access date July 20, 2022].
- [41].Ho YS. Top-cited articles in chemical engineering in science citation index expanded: a bibliometric analysis. Chin J Chem Eng. 2012;20:478–88. [Google Scholar]
- [42].Ho YA. bibliometric analysis of highly cited articles in materials science. Current Sci. 2014;107:1565–72. [Google Scholar]
- [43].Castagna C, Consorti G, Turinetto M, et al. Osteopathic models integration radar plot: a proposed framework for osteopathic diagnostic clinical reasoning. J Chiropr Humanit. 2021;28:49–59. [DOI] [PMC free article] [PubMed] [Google Scholar]
- [44].Chien TW, Wang HY, Hsu CF, et al. Choropleth map legend design for visualizing the most influential areas in article citation disparities: a bibliometric study. Medicine (Baltim). 2019;98:e17527. [DOI] [PMC free article] [PubMed] [Google Scholar]
- [45].de Nooy W, Mrvar A, Batagelj V. Exploratory Social Network Analysis with Pajek: Revised and Expanded. 2nd edn. New York, NY: Cambridge University Press, 2011. [Google Scholar]
- [46].Liu PC, Lu Y, Lin HH, et al. Classification and citation analysis of the 100 top-cited articles on adult spinal deformity since 2011: a bibliometric analysis. J Chin Med Assoc. 2022;85:401–8. [DOI] [PubMed] [Google Scholar]
- [47].Kuo YC, Chien TW, Kuo SC, et al. Predicting article citations using data of 100 top-cited publications in the journal Medicine since 2011: a bibliometric analysis. Medicine (Baltim). 2020;99:e22885. [DOI] [PMC free article] [PubMed] [Google Scholar]
- [48].Chen CJ, Wang LC, Kuo HT, et al. Significant effects of late evening snack on liver functions in patients with liver cirrhosis: a meta-analysis of randomized controlled trials. J Gastroenterol Hepatol. 2019;34:1143–52. [DOI] [PubMed] [Google Scholar]
- [49].Shim SR, Kim SJ. Intervention meta-analysis: application and practice using R software. Epidemiol Health. 2019;41:e2019008. [DOI] [PMC free article] [PubMed] [Google Scholar]
- [50].Higgins JPT, Thompson SG, Deeks JJ, et al. Measuring inconsistency in meta-analyses. Br Med J. 2003;327:557–60. [DOI] [PMC free article] [PubMed] [Google Scholar]
- [51].Fleiss JL, Gross AJ. Meta-analysis in epidemiology, with special reference to studies of the association between exposure to environmental tobacco smoke and lung cancer: a critique. J Clin Epidemiol. 1991;44:127–39. [DOI] [PubMed] [Google Scholar]
- [52].DerSimonian R, Laird N. Meta-analysis in clinical trials. Control Clin Trials. 1986;7:177–88. [DOI] [PubMed] [Google Scholar]
- [53].Ades AE, Higgins JPT. The interpretation of random-effects meta-analysis in decision models. Med Decis Making. 2005;25:646–54. [DOI] [PubMed] [Google Scholar]
- [54].WOS. Author impact beam plots in web of science author records. Available at: https://www.youtube.com/watch?v=dcXgx5wxUp4 [access date October 4, 2022].
- [55].Clarivate. New WOS February 25 release notes. Available at: https://clarivate.com/webofsciencegroup/release-notes/wos/new-wos-February-25-release-notes/ [access date July 24, 2022].
- [56].Heyns CF, Smit SG, van der Merwe A, et al. Urological aspects of HIV and AIDS. Nat Rev Urol. 2013;10:713–22. [DOI] [PubMed] [Google Scholar]
- [57].Calderon-Margalit R, Golan E, Twig G, et al. History of childhood kidney disease and risk of adult end-stage renal disease. N Engl J Med. 2018;378:428–38. [DOI] [PubMed] [Google Scholar]
- [58].Suthanthiran M, Schwartz JE, Ding R, et al. Urinary-cell mRNA profile and acute cellular rejection in kidney allografts. N Engl J Med. 2013;369:20–31. [DOI] [PMC free article] [PubMed] [Google Scholar]
- [59].Smith JW. Prognosis in pyelonephritis: promise or progress? Am J Med Sci. 1989;297:53–62. [DOI] [PubMed] [Google Scholar]
- [60].Kunin CM. Does kidney infection cause renal failure? Annu Rev Med. 1985;36:165–76. [DOI] [PubMed] [Google Scholar]
- [61].Kuo IC, Lee JJ, Hwang DY, et al. Pyuria, urinary tract infection and renal outcome in patients with chronic kidney disease stage 3-5. Sci Rep. 2020;10:19460. [DOI] [PMC free article] [PubMed] [Google Scholar]
- [62].Sreenarasimhaiah S, Hellerstein S. Urinary tract infections per se do not cause end-stage kidney disease. Pediatr Nephrol. 1998;12:210–3. [DOI] [PubMed] [Google Scholar]
- [63].Ringoir S, Vanholder R. Phagocytic function in the uremic patient. Contrib Nephrol. 1992;100:15–24. [DOI] [PubMed] [Google Scholar]
- [64].Rice DB, Raffoul H, Ioannidis JPA, et al. Academic criteria for promotion and tenure in biomedical sciences faculties: cross sectional analysis of international sample of universities. BMJ. 2020;369:m2081. [DOI] [PMC free article] [PubMed] [Google Scholar]
- [65].Seglen PO. Why the impact factor of journals should not be used for evaluating research. BMJ. 1997;314:498–502. [DOI] [PMC free article] [PubMed] [Google Scholar]
- [66].McKiernan EC, Schimanski LA, Munoz Nieves C, et al. Use of the Journal Impact Factor in academic review, promotion, and tenure evaluations. Elife. 2019;8:e47338. [DOI] [PMC free article] [PubMed] [Google Scholar]
- [67].Yeh JT, Shulruf B, Lee HC, et al. Faculty appointment and promotion in Taiwan’s medical schools, a systematic analysis. BMC Med Educ. 2022;22:356. [DOI] [PMC free article] [PubMed] [Google Scholar]
- [68].Chen TW, Chou LF, Chen TJ. World trend of peritoneal dialysis publications. Perit Dial Int. 2007;27:173–8. [PubMed] [Google Scholar]
- [69].Yuan X, Li H, Zhou L, et al. A bibliometric analysis of the 100 most influential papers on peritoneal dialysis. Medicine (Baltim). 2020;99:e23115. [DOI] [PMC free article] [PubMed] [Google Scholar]
- [70].Huang MH, Chi PS. A comparative analysis of the application of h-index, g-index, and a-index in institutional-level research evaluation. J Library Inform Studi. 2010;8:1–10. [Google Scholar]
- [71].Efron B. Bootstrap methods: another look at the jackknife. Ann Stat. 1979;7:1–26. [Google Scholar]
- [72].Kung SC, Chien TW, Yeh YT, et al. Using the bootstrapping method to verify whether hospital physicians have different h-indices regarding individual research achievement: a bibliometric analysis. Medicine (Baltim). 2020;99:e21552. [DOI] [PMC free article] [PubMed] [Google Scholar]
- [73].Kuo SC, Yeh YT, Kan WC, et al. The use of bootstrapping method to compare research achievements for ophthalmology authors in the US since. Scientometrics. 2020;126:509–20. [Google Scholar]
Associated Data
This section collects any data citations, data availability statements, or supplementary materials included in this article.


