Abstract
How do individuals know their social rank? Most social species self-organize into dominance hierarchies1,2 which decreases aggression and conserves energy3–5. We have only begun to learn how the brain represents social rank6–9 and guides behavior based on this representation. The medial prefrontal cortex (mPFC) is involved in social dominance in rodents7,8 and humans10,11. Yet precisely how the mPFC encodes relative social rank and which circuits mediate this computation is not known. We developed a social competition assay in which mice compete for rewards, as well as a computer vision tool (AlphaTracker) to track multiple, unmarked animals. A hidden Markov model combined with generalized linear models (HMM-GLM) was able to decode social competition behavior from mPFC ensemble activity. Population dynamics in the mPFC were predictive of social rank and competitive success. Finally, we demonstrate that mPFC cells that project to the lateral hypothalamus promote dominance behavior during reward competition. Thus, we reveal a cortico-hypothalamic circuit by which mPFC exerts top-down modulation of social dominance.
The medial prefrontal cortex (mPFC) is best known for its role in higher cognitive functions, with theoretical emphasis on mPFC integration of sensory and limbic information to flexibly guide behavior based on task rules12. Notably, mPFC circuitry has also been implicated in social cognition, social memory, and dominance7,8,11,13,14. We hypothesized that mPFC neurons encode social rank and are part of top-down circuits to guide behavior based on social rank15.
We designed a novel reward competition assay wherein mice that were linearly-ranked among their cagemates competed for a liquid reward delivered during a tone. This task design optimized rigorous statistical examination of ethologically-relevant behaviors in a trial structure (Fig. 1a). We considered relative social ranks within each competing pair, enabling a within-subject comparison for intermediate-ranked animals. After individually learning that the tone predicted reward delivery (Extended Data Fig. 1a), mice competed for rewards with a cagemate. Dominant mice, as defined by the tube test8, obtained more rewards, spent more time at the reward port, and were more successful at displacing competitors (Fig. 1b–c and Extended Data Fig. 1).
Figure 1: Novel social dominance assay and deep learning tool for tracking multiple animals.
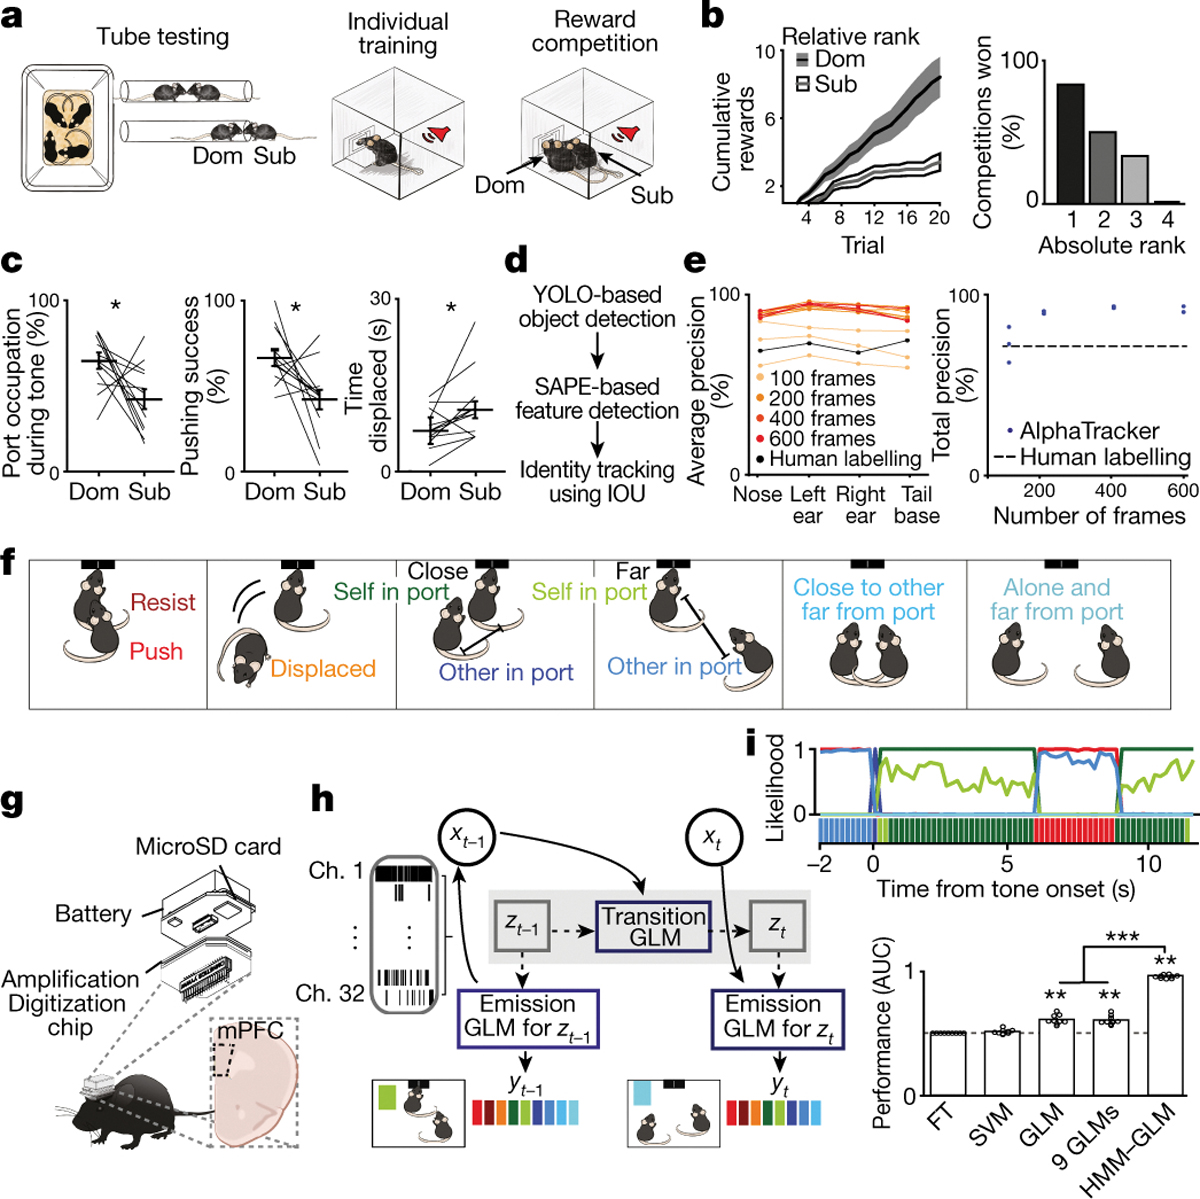
a, Reward competition behavioral paradigm schematic. b, Mice with higher relative ranks (dominant; Dom) collected more rewards than relative subordinates (Sub) when competing in dyads (n=12 dyads; Sign rank test on total rewards, p=0.008). Left, cumulative rewards across trials. Right, percent competitions won by absolute rank (n=6 competitions per rank). c, Port occupation, pushing success (pushing that resulted in displacement of competitor), and time displaced from port was higher for relative dominants (n=12 dyads; Sign rank test, occupation p=0.04; pushing success p=0.02; displaced p=0.016). d, Architecture of AlphaTracker which combines two convolutional neural networks and intersection over union for identity tracking. e, AlphaTracker precision for tracking two unmarked, near-identical mice is higher than human precision separated by body parts (left) or total (right; average precision across body parts; n=3 sub-sampled replicates). f, Left, social competition behavioral labels used for decoder models. g, Wireless device to record neural activity from mPFC (n=965 trials from 32 sessions from 13 mice). Image modified from SpikeGadgets. h, Architecture of the HMM-GLM to model the relationship between neural activity and behavioral states. i, Top, example trial with real behavioral labels and prediction for HMM-GLM 6-state model (colors from Fig. 1f). Bottom, performance across models based on area under the receiver operating curve (AUC; n=9 behaviors; Kruskal Wallis test p=6.7×10⁻⁸; model vs chance sign test p=0.004 for 6 state HMM-GLM, 9 GLMs and GLM; Wilcoxon rank sum HMM-GLM vs GLM p=4×10⁻⁵, HMM-GLM vs 9 GLMs p=4×10⁻⁵, GLM vs 9 GLMs p=0.54). HMM-GLM: hidden Markov model and generalized linear model; FT: frequency of behaviors table; SVM: support vector machine. Data are presented as mean values +/− SEM.
To automatically track the behavior of multiple, unmarked mice we developed a new deep-learning computer vision tool AlphaTracker. AlphaTracker combines two neural networks, one to create a bounding box for each subject, another for pose estimation to detect multiple, unmarked animals (Fig. 1d–e). AlphaTracker also applies an additional algorithm to track animal identity across frames considering animal positions from the previous frame (Fig. 1e; see methods). AlphaTracker performance surpasses human accuracy when tracking 2 or 4 mice (Extended Data Fig. 2) and includes unsupervised clustering of high-dimensional tracking output data to aid in the identification of novel behavioral motifs (Extended Data Fig. 3 and Supplementary Video 1).
mPFC neurons encode competition behavior
To investigate whether mPFC neurons encode competition behaviors, we used wireless head-mounted devices to record cellular-resolution activity during the social competition (Fig. 1f–g, Extended Data Figs. 4 and 5a–g). After AlphaTracker facilitated identification of 9 different behavioral labels (Fig. 1f and Extended Data Fig. 5h–i), we asked whether the mPFC predicted specific behavioral outputs. Given the ability of mPFC neurons to be selective for different stimulus features under different contexts16, we posited that mPFC neural activity could be dynamic, that representations may be hierarchical, and influenced by internal hidden states. We turned to an unsupervised method to identify hidden states by combining a hidden Markov model (HMM) with generalized linear models (GLMs)17,18 and adapted it to use mPFC neural activity to predict behavior. In our HMM-GLM, one set of multinomial GLMs predicts the transition probabilities between hidden states, additionally, each hidden state is paired with another multinomial GLM that describes the relationship between neural activity and behavior (Fig. 1h).
An HMM-GLM model with 6 hidden states decoded behavioral labels from neural activity with superior cross-validated performance to static models (Fig. 1i, Extended Data Fig. 5j and Supplementary Video 2). The model performed equally well when training for one relative rank and testing on the other (Extended Data Fig. 5k–l), suggesting that mPFC encoding of social competition behavior is generalizable across relative ranks. Given this finding, we wanted to consider whether there is a stable and simple encoding of rank in mPFC neural representations, and whether these variables could themselves predict behavior.
mPFC reflects rank and winning
We next investigated whether mPFC neural activity could be used to decode relative social rank, and if the neural representation of relative social rank is triggered by discrete task-relevant events (cued competition trials or port entries) or stably represented throughout the task. To visualize population activity, we plotted the population activity vector for task-relevant events (Extended Data Fig. 6a and Supplementary Video 3) in a lower dimensional firing rate space using principal component analysis (PCA). Neural trajectories during the cue and port entries of the self or other (competitor) for win or lose trials occupied segregated neural activity subspaces even before the cue onset, suggesting separable brain states preceding each trial (Fig. 2a and Extended Data Fig. 6), consistent with primate studies19. Relative subordinates had longer neural trajectories compared to relative dominants (Fig. 2b and Extended Data Fig. 6b–f). Indeed, our analyses revealed larger firing rate variance, but not faster firing rate changes, for relative subordinate mice (Fig. 2b and Extended Data Fig. 6c). Importantly, we ruled out the possible contributions of potential confounds (e.g. subject location, distance to reward port, and identity) to the differences in neural trajectories across ranks (Extended Data Fig. 7).
Figure 2: Social rank and competitive success is decoded by mPFC population dynamics.
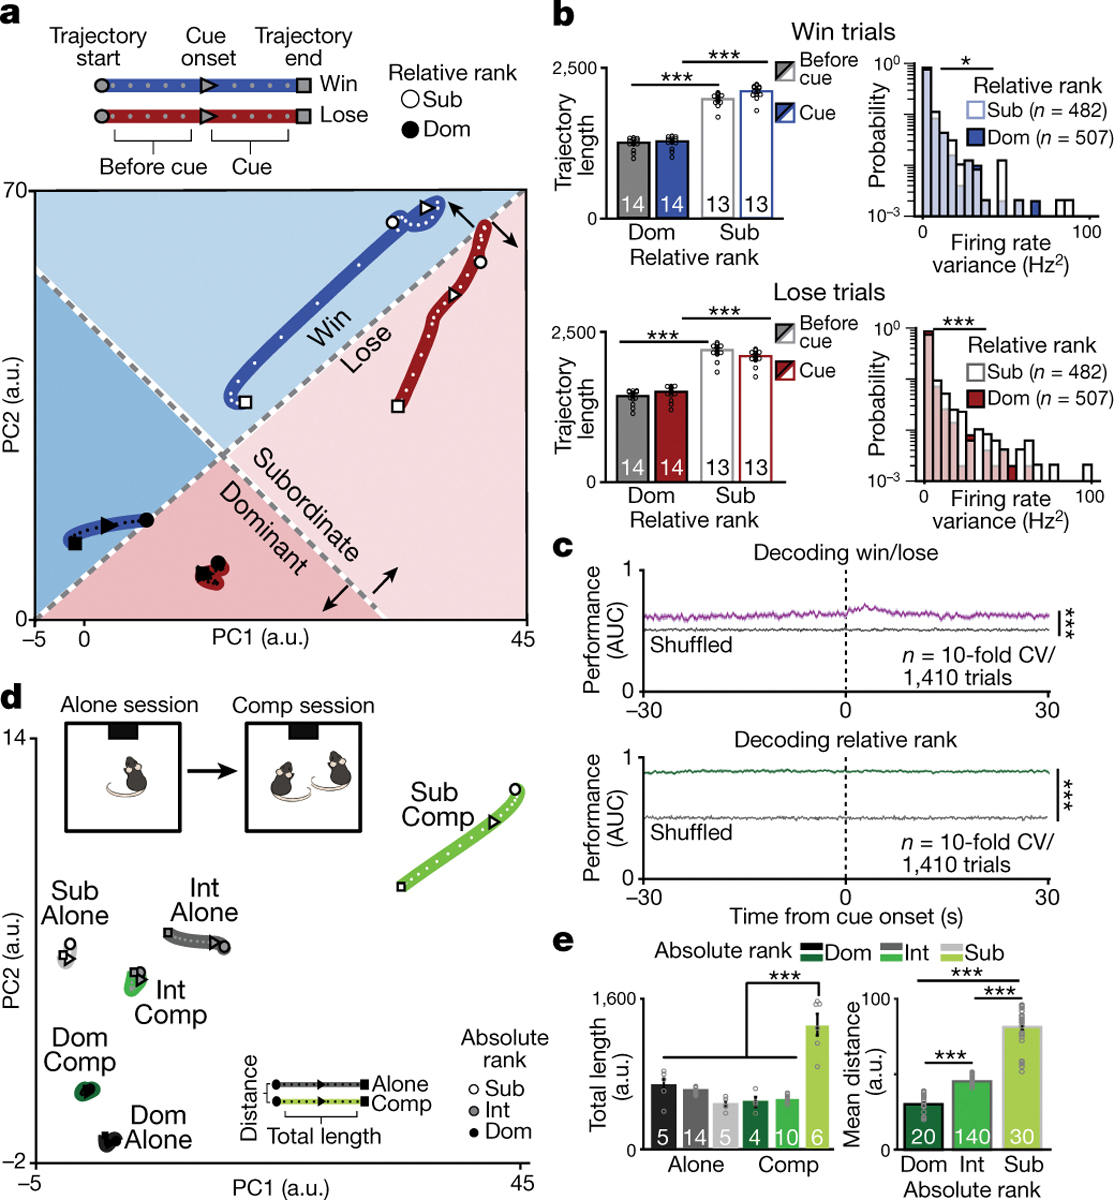
a, Neural trajectories of mPFC firing rate differ by relative rank during the tone presentation for win and lose trials in a lower dimensional common principal component (PC) sub-space (trajectories include a total of 20 mice, 27 sessions dominants: n=507 cells; subordinates: n=490 cells). b, Neural trajectory lengths for win (top left; 2-way RM-ANOVA effects of relative rank F(1,25)=1090,p=2×10⁻¹⁶ and interaction,F(1,25)=1660,p=3×10⁻¹⁴) and lose (bottom left; 2-way RM-ANOVA effect of relative rank F(1,25)=883,p=9×10⁻¹⁶ and interaction, F(1,25)=2995,p=9×10⁻¹⁶) trials. Firing rate variance is higher for relative subordinates (right bottom; number of neurons indicated in plots; win trials: KS test p=0.01, Wilcoxon rank-sum p=0.19; lose trials KS test p=5×10⁻⁷, Wilcoxon rank-sum p=2×10⁻⁹). c, SVM performance is higher than chance for decoding competitive success and relative rank (area under the receiving operating curve: AUC; gray: shuffled data performance; Wilcoxon rank-sum: competitive success p=2×10⁻⁴, relative rank p=2×10⁻⁴; Competitive success vs relative rank p=2×10⁻⁴). d, Neural trajectories of mPFC population firing rate by absolute rank (dominant (Dom)= rank 1; intermediates (Int)=ranks 2&3; subordinate (Sub)= rank 4) when performing the reward task alone vs in competition in a lower dimensional common PC sub-space (neurons in alone session: Dom=111, Int=259, Sub=140; competition: Dom=309, Int=359, sub=330). e, Left, trajectory during the tone is higher for subordinates during competition (2-way ANOVA main effect of rank F(2,38)=30.4, p=1×10⁻⁸, task F(1,38)=26.1, p=9×10⁻⁶ and interaction F(2,38)=70.1, p=1×10⁻¹³). Right, distance between alone and competition tone trajectories increases with rank (n reflects all possible combinations of alone vs competition trajectories;1-way ANOVA main effect of rank F(2,187)=536, p=3×10−78). Post-hoc comparisons are Bonferroni-corrected t-tests, **p<0.01, ***p<0.001. 2-way ANOVAs were for rank and event (baseline vs event) or rank and trial-type and sample size indicated in plots. Data are presented as mean +/− SEM.
mPFC predicts future wins
To directly test the hypothesis that mPFC encodes relative rank and competitive success at the population level, we trained an SVM classifier to decode these binary states from single-trial data (Extended Data Fig. 8a). An SVM was able to decode both competitive success and relative rank – even prior to cue onset (Fig. 2c and Extended Data Fig. 8b–e), consistent with the notion that state differences in mPFC correlate with future winning7. Social rank was more accurately decoded than competition outcome from mPFC neural activity (Fig. 2c), perhaps reflecting the relative stability of rank versus competitive success. While our data are consistent with the idea of a “winning effect” or a “losing streak”,7,20 the decoding accuracy across the trial was consistently above chance. Remarkably, PFC neural activity could predict whether the next trial would be a win or a loss ~30 seconds before the competition trial began, providing cellular evidence supporting the psychological concept of “a winning mindset.”
Notably, we can decode the absolute social rank of individuals from mPFC activity, even when alone (Extended Data Fig. 8f–h). To visualize differences between tone responses to the reward while alone vs in competition we plotted the neural trajectories across tasks in the same PCA subspace (Fig. 2d). Subordinate mice (rank 4) had larger changes induced by competition with longer tone trajectory lengths during competition (Fig. 2e). In contrast, dominants (rank 1) showed the smallest differences between the alone and competition state. To confirm that population dynamics differed between receiving the reward alone vs winning, we recorded the same neurons while animals performed the reward task alone vs in competition and found that an SVM could decode trial type from mPFC population dynamics (Extended Data Fig. 8i–j). Importantly, relative rank could be predicted in intermediate ranking animals (Extended Data Fig 8e). However, we cannot rule out the possibility that the representation may reflect social identity and the associated social history with that individual rather than relative rank alone, indeed it is yet unclear whether the brain is capable of separably representing rank and identity. Altogether, these data demonstrate that the mPFC has a dynamic, but consistent, representation of social rank and competitive success despite having multiple, rank-independent hidden states for encoding behavior during social competition.
Rank-dependent mPFC representations
Given that the mPFC encodes social rank and competitive success, we posited that specific ensembles of cells might encode distinct task relevant events in a rank-dependent manner to provide a distributed representation of social rank and competitive success. To investigate whether social rank is represented within the mPFC at the single-cell level, we analyzed the firing rate of individual mPFC neurons during discrete reward competition events. mPFC single units showed diverse responses to the tone for win or lose trials and to port entries performed by self or the other (i.e. competitor) that differed by social rank (Fig. 3a; Extended Data Fig. 9a). We quantified the ensemble sizes and magnitude of responses to the task-relevant events while animals were alone vs in social competition (Fig. 3b–d and Extended Data Fig. 9b–d). During competition, but not while alone, relative dominants had more cells that were responsive to self port entries while subordinates had larger responses to win trials and port entries of the other (Fig. 3b–d and Extended Data Fig. 9b–d). Furthermore, the mPFC neurons of relative subordinates displayed larger phasic responses in response to task events, consistent with the longer neural trajectories observed (Fig 2).
Figure 3: Relative dominants have more reward seeking behavior cells while subordinates have larger responses to competitor behavior.
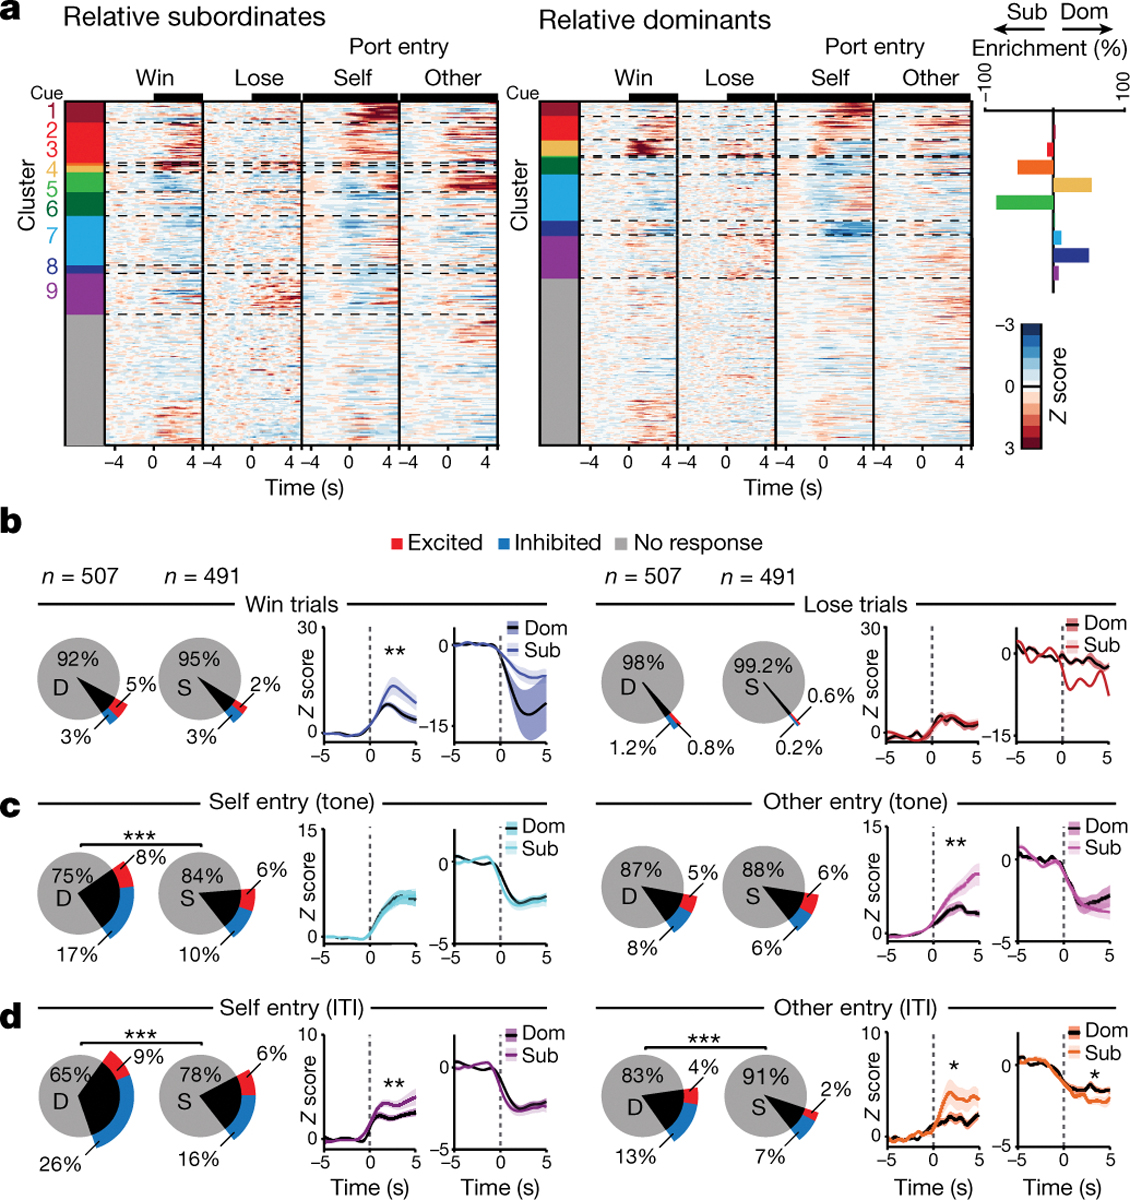
a, Left, heatmaps for mPFC firing rate responses to task-relevant events during the reward competition. Colors indicate clusters obtained by hierarchical clustering. Cells included in heatmap have a Z-score greater than 2 or less than −1 (Dom n=326; Sub n=306); clusters with a non-responsive population average were labeled gray. Right, difference between relative dominant (Dom) and subordinate (Sub) cells (% enrichment) across functional clusters. b, Left, response magnitude for mPFC cells during win trials differed across relative ranks (dominant D; subordinate S; Fisher’s exact test, total responsive cells per group p=0.30; Wilcoxon rank-sum across groups: excited p=0.01; inhibited p=0.06). Right, number of responsive cells and response magnitude for lose trials did not differ by relative rank (Fisher’s exact test, total responsive per group p=0.17; Wilcoxon rank-sum: excited p=0.62; inhibited p=0.28). c, Left, number of mPFC self tone port entry responsive cells was higher for relative dominants (Fisher’s exact test, total responsive cells per group p=0.0003; Wilcoxon rank-sum: excitation p=0.28 and inhibition p=0.99). Right, there was no difference in number of other tone port entry responsive cells, while the excitation magnitude was higher for relative subordinates (Fisher’s exact test, total responsive cells per group p=0.84; Wilcoxon rank-sum: excitation p=0.006, inhibition p=0.11). d, Left, relative dominants had more mPFC responsive cells to self port entries during the ITI while relative subordinates had larger excitation magnitude (Fisher’s exact test, p=9.8×10⁻⁶; Wilcoxon rank-sum: excitation p=0.006 and inhibition p=0.28). Right, relative dominants had more responsive mPFC cells to other port entries during ITI while subordinates had larger magnitudes (Fisher’s exact test, p=0.00019; Wilcoxon rank-sum: excitation p=0.015 and inhibition p=0.04). Recordings were collected from 20 mice; sample indicated in plots is cells. Data are presented as mean +/− SEM.
mPFC-LH neurons modulate dominance
Given the functional diversity of neural responses from individual mPFC neurons, we next wanted to investigate how information was routed out of the mPFC during social competition to downstream subcortical targets.
The lateral hypothalamus (LH) is comprised of a diversity of cell types and has been shown to drive hypersocial behavior and social investigation21, and to modulate social defensive behaviors22,23. Further, the LH plays a critical role in energy balance homeostasis24 – demonstrating the capacity to serve as a homeostatic control center25. Based on the conceptual framework for social homeostasis, after social information is detected and evaluated in a rank-dependent manner, it would be sent to a control center for comparison to a social homeostatic set point15,26.
We also investigated the mPFC projection to the basolateral amygdala (BLA) because recent evidence suggests that BLA firing rates correlate with the social rank of conspecific faces in non-human primates27 and the BLA is an important point of convergence for socially-derived information28 to be associated with emotional valence28–30.
To identify mPFC cells that project monosynaptically to the LH or BLA, we used an intersectional viral strategy to express ChrimsonR in each projection, validated with ex vivo recordings (Fig. 4a and Extended Data Fig. 10a–b). We then wirelessly-recorded mPFC neural activity while animals were alone or competing and delivered red light pulses at the end of the competition session to photoidentify mPFC-LH or mPFC-BLA neurons. We found that mPFC-LH neurons had stronger excitation to reward delivery than mPFC-BLA neurons during reward competition, but not when performing the task alone (Fig. 4b and Extended Data Fig. 10c).
Figure 4: mPFC-LH pathway encodes social competition and modulates social dominance behavior.
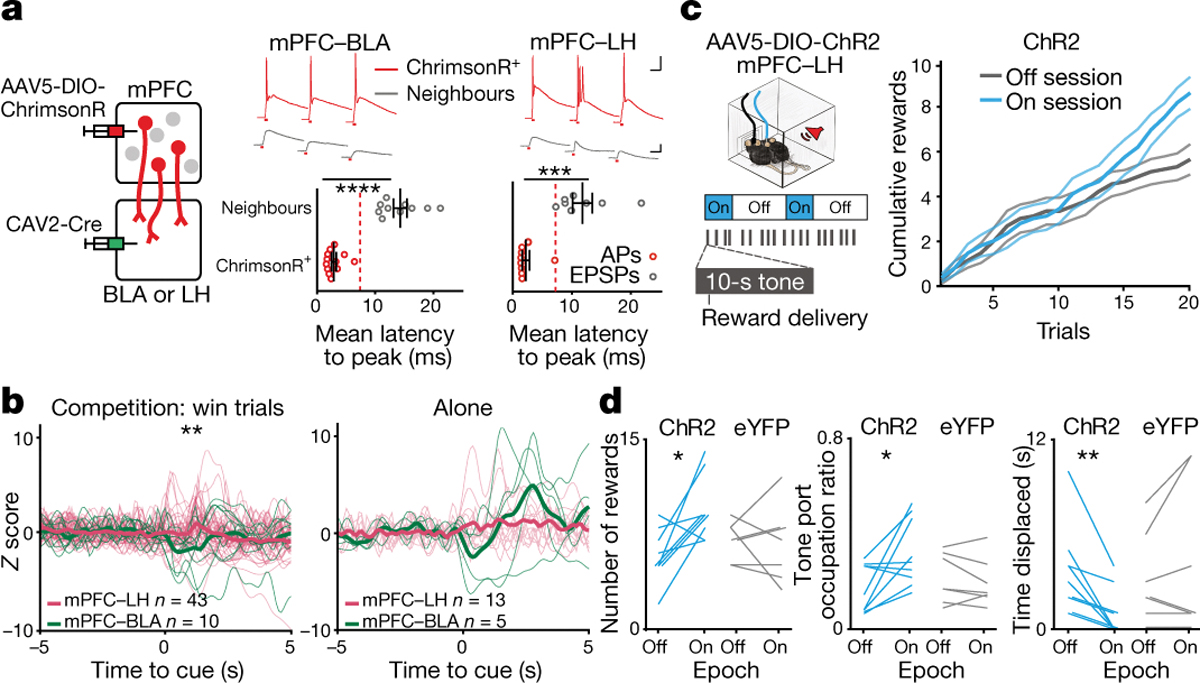
a, Left, viral strategy to stimulate projectors. Top, mPFC projector cells (ChrimsonR+; red) and neighbor cells (gray) responding to pulses of red light. Top scale 40 ms and 20 mV, bottom scale 40 ms and 4 mV. Bottom, average photo-latency of action potentials (AP) or excitatory postsynaptic potentials (EPSPs) for mPFC-BLA (left plot) and mPFC-LH (right plot) ChrimsonR+ cells compared to neighboring cells (mPFC-BLA ChrimsonR+ n=12 vs neighbors n=10; t-test, ****p<0.0001; mPFC-LH ChrimsonR+ n=9 vs neighbors n=8; t-test, ****p<0.0001). Dash lines indicate photoresponse latency threshold used for phototagging projector. b, Firing rate of mPFC-LH is higher than mPFC-BLA during the reward delivery (0–2 s) in win trials (mPFC-BLA n=10 neurons, mPFC-LH n=42 neurons, Wilcoxon rank-sum p=0.015). Firing rate for projector populations during tones for the reward task alone (alone data: mPFC-BLA n=5 neurons, mPFC-LH n=13 neurons, Wilcoxon rank-sum p=0.50; alone vs comp mean Z-score during tone; mPFC-LH p= 0.0189, mPFC-BLA p=0.43). Thicker lines represent the mean. c, Left, during reward competition light OFF or light ON sessions in which light was delivered in epochs (5 min light epoch of four 5 ms light pulses at 100 Hz every 200 ms). Right, cumulative rewards obtained by ChR2 mice in the light OFF vs light ON session (n=9 mice). Data are presented as mean values +/− SEM. d, mPFC-LH cell stimulation increased the number of trials won (Left; ChR2 n=9, eYFP n=7; 2-way RM ANOVA interaction of virus and light F(1,14)=5.22, p=0.03; Bonferroni corrected t-test ChR2 p=0.01), time spent occupying the reward port (Middle; ChR2 n=9, eYFP n=7; 2-way RM ANOVA interaction of virus and light F(1, 14)=6.73, p=0.02; Bonferroni corrected t-test, ChR2 p=0.02) and decreased time spent being displaced (Right; ChR2 n=9 paired t-test, p=0.005; eYFP n=7 paired t-test, p=0.28).
Given the selective unmasking of a robust mPFC-LH response to the reward-predictive tone only in the context of social competition (Fig. 4b), we hypothesized that mPFC-LH neurons could modulate reward-related social competition. To directly test the hypothesis that mPFC-LH neurons have a causal relationships with social dominance-related behavior, we expressed either Channelrhodopsin-2 (ChR2) or eYFP in mPFC-LH neurons and implanted an optic fiber in the mPFC (Fig. 4c and Extended Data Fig. 10d). ChR2-expressing mice won more rewards during the entire competition, had greater reward port occupation, and spent less time being displaced when they received optical stimulation (Fig. 4d). Importantly, stimulating mPFC-LH neurons did not affect reward-seeking behavior while performing the reward competition assay alone, feeding in the home cage, anxiety, sociability, place preference or general effort (Extended Data Fig. 10e–k).
Conclusion
Taken together, these data demonstrate that the mPFC neural activity predicts future competitive success, can be decoded to predict both relative and absolute social rank, and uses cortico-hypothalamic circuits to guide social competition behavior. Development of an ethologically-relevant social competition task that incorporates a trial structure allowed us to reveal how related variables updated on different timescales might be parsed and represented separately. Indeed, social rank and competitive success representations occupied orthogonal activity spaces (Fig. 2a), which we speculate is an adaptive strategy that the PFC can use to parse related variables updated on different timescales.
Importantly, the way that mPFC ensembles encode behavior is dynamic, which suggests a model in which internal states influence how mPFC modulates behavior, consistent with a role in flexibly guiding behavior. Our data demonstrate that cortico-hypothalamic circuits carry social rank information which could potentially modulate the many different neuropeptide and hormone expressing subpopulations in the hypothalamus to achieve behavioral modulation. Indeed, we speculate that the mPFC serves as a rank identification node that works in concert with the ACC to function as a “detector” to extract signals from social agents and that downstream projections to the hypothalamus may function as the detector node output to a social homeostatic “control center,” within a purported social homeostatic circuit15.
This study not only unveils a number of technological advances that together provide a platform for the investigation of social hierarchies, but also begins to integrate evidence that together support the notion that there is a neural circuit for social homeostasis.
Extended Data
Extended Data Figure 1: Additional behavioral metrics during reward competition in unimplanted mice.
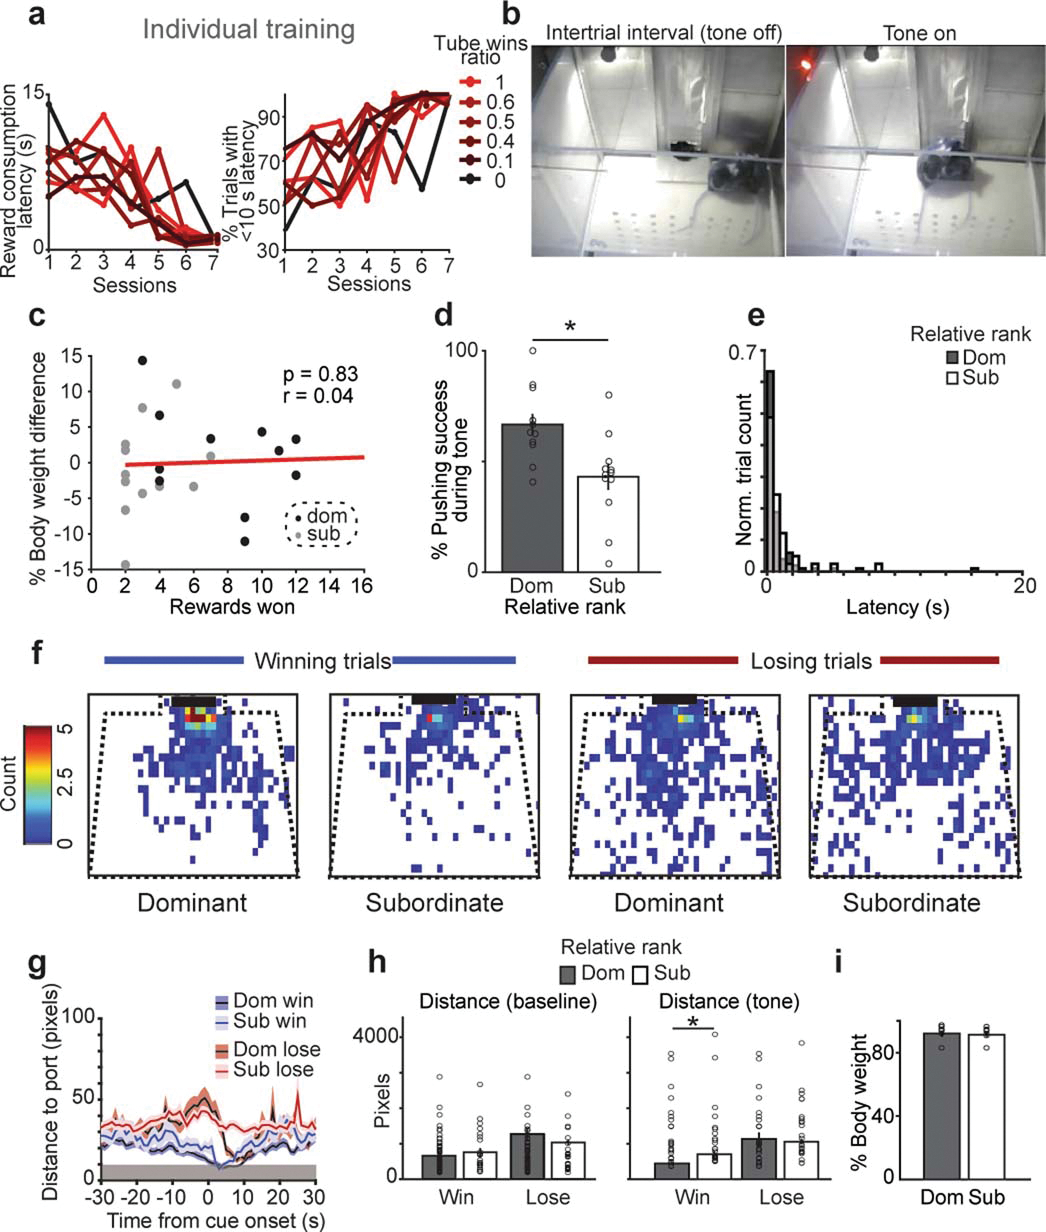
a, Mice learned the tone reward association at the same rate across social ranks. Left, latency to reward consumption following tone onset decreased over sessions. Right, the percent of trials with a reward consumption latency of less than 10 seconds increased over sessions (n=8 mice). Data are plotted as a function of social rank as measured by wins in the tube test. b, Example frames from reward competition assay showing intertrial interval time and during the tone period. c, Body weight difference between competitors does not correlate with rewards won (n=12 dyads from 8 mice, Pearson’s correlation, p=0.83). d, Relative dominant mice have higher pushing success during the tone (n=12 per group, paired t-test p=0.025). e, Latency to pick up the reward across trials for relative dominants vs subordinates (dom=101, sub=41, Two-sample Kolmogorov-Smirnov test p=0.29). f, Area occupied by dominants or subordinates in the 10 seconds prior to the tone onset for win vs lose trials (n=12 dyads). g, Distance to reward port across time by trial type and relative rank (trials n: dom win=68, dom lose=24, sub win=24, sub lose=68 from 12 dyads; early baseline −30 to −20 s prior to cue there is no effect of trial nor relative rank; 2-way ANOVA using the mean distance from −5 s to cue onset: main effect of trial type F(1,180)=44.4, p=3×10⁻¹⁰, rank p=0.94, interaction p=0.09; 2-way ANOVA using the mean distance from 5 seconds prior to tone until 10 seconds post tone: main effect of trial type F(1,180)=68, p=2.5×10⁻¹⁴, rank p=0.071, interaction p=0.79). Gray rectangle indicates contact range for the reward port. h, Total distance traveled immediately before the tone and during the tone period (baseline:10 seconds prior to tone; tone: 10 seconds of the tone) across trial types for relative dominant and subordinate mice (dom win=68, dom lose=24, sub win=24, sub lose=68 from 12 dyads; Wilcoxon rank-sum, baseline win p=0.79, baseline lose p=0.59, tone win p=0.028, tone lose p=0.86). Gray zone indicates contact with port. i, Percent body weight during food restriction did not differ across relative dominant and subordinate mice competing in reward competition (n=12 dyads, paired t-test, p=0.23).
Extended Data Figure 2: AlphaTracker tracking metrics.
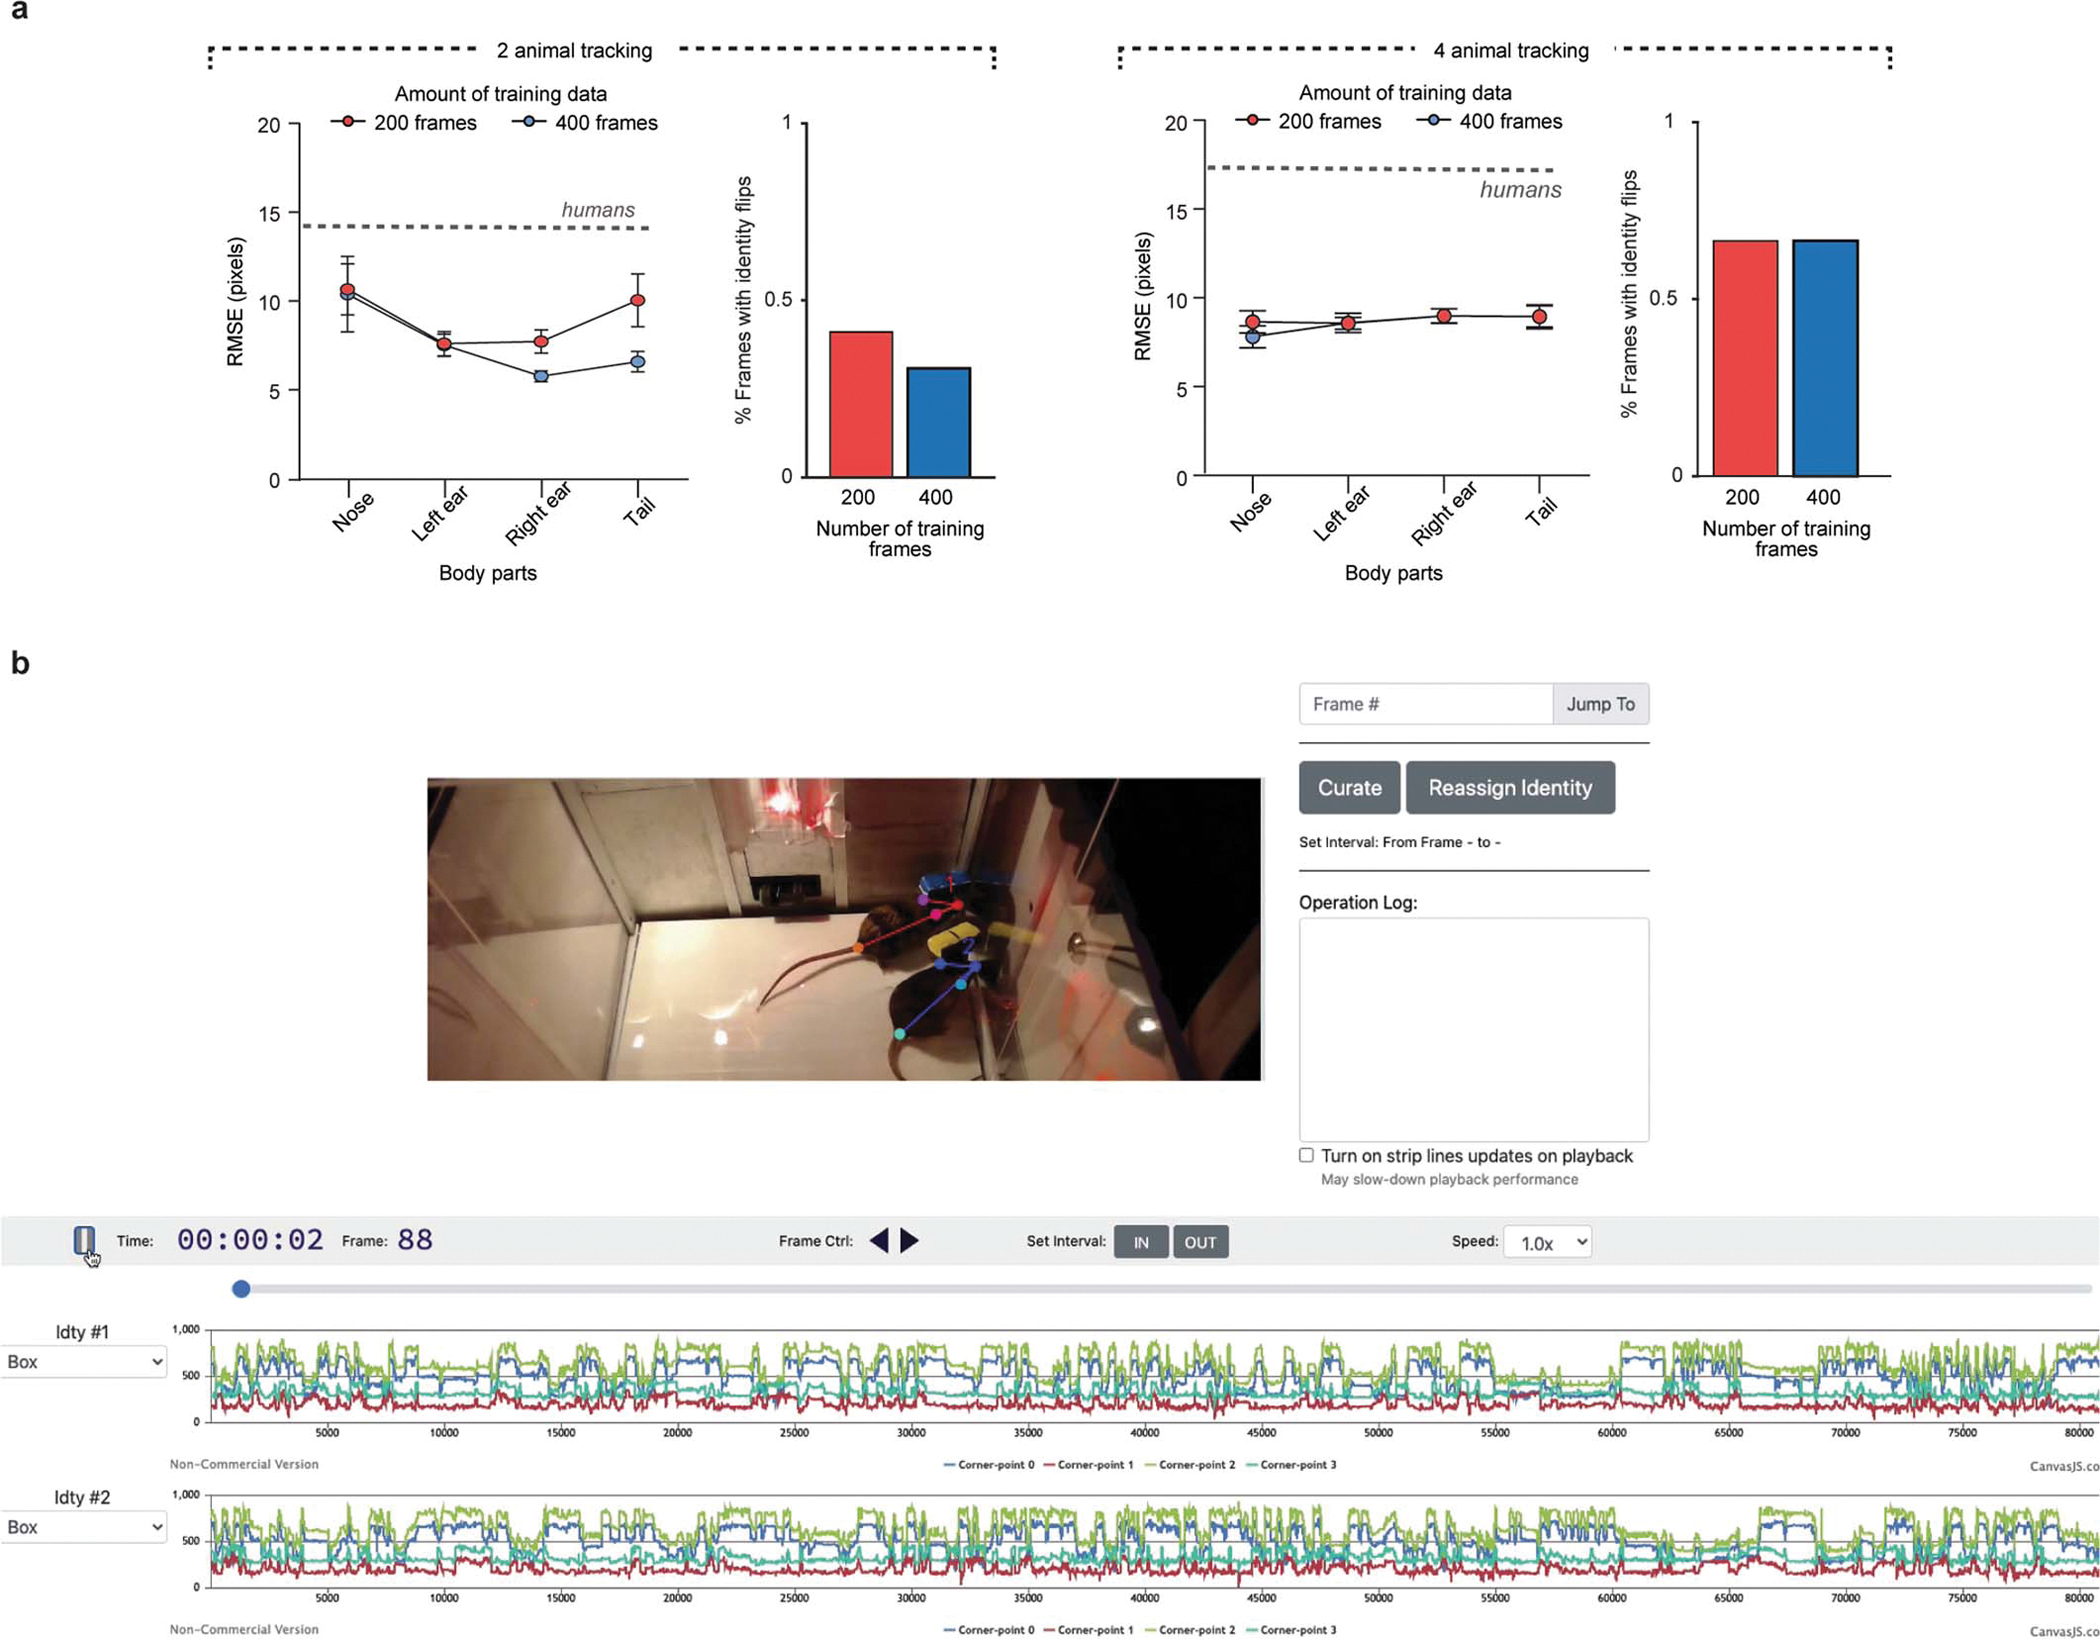
a, Root mean square error (RMSE) and identity error rate of AlphaTracker when tracking different body parts in videos with high resolution (1920×1080 pixels). Left plots have training and tracking done on 2 unmarked mice videos and right plots have training and tracking done on 4 unmarked mice videos. For both datasets two humans annotated the data and the RMSE between humans is indicated with the dashed line. For identity error rate 2 mouse tracking done with 9737 frame video and 4 mouse tracking done with 6020 frame video. b, Screenshot of user interface (UI) to fix errors made by AlphaTracker tracking. In addition, this UI can be used for exploring the clustering data.
Extended Data Figure 3: AlphaTracker unsupervised clustering results.
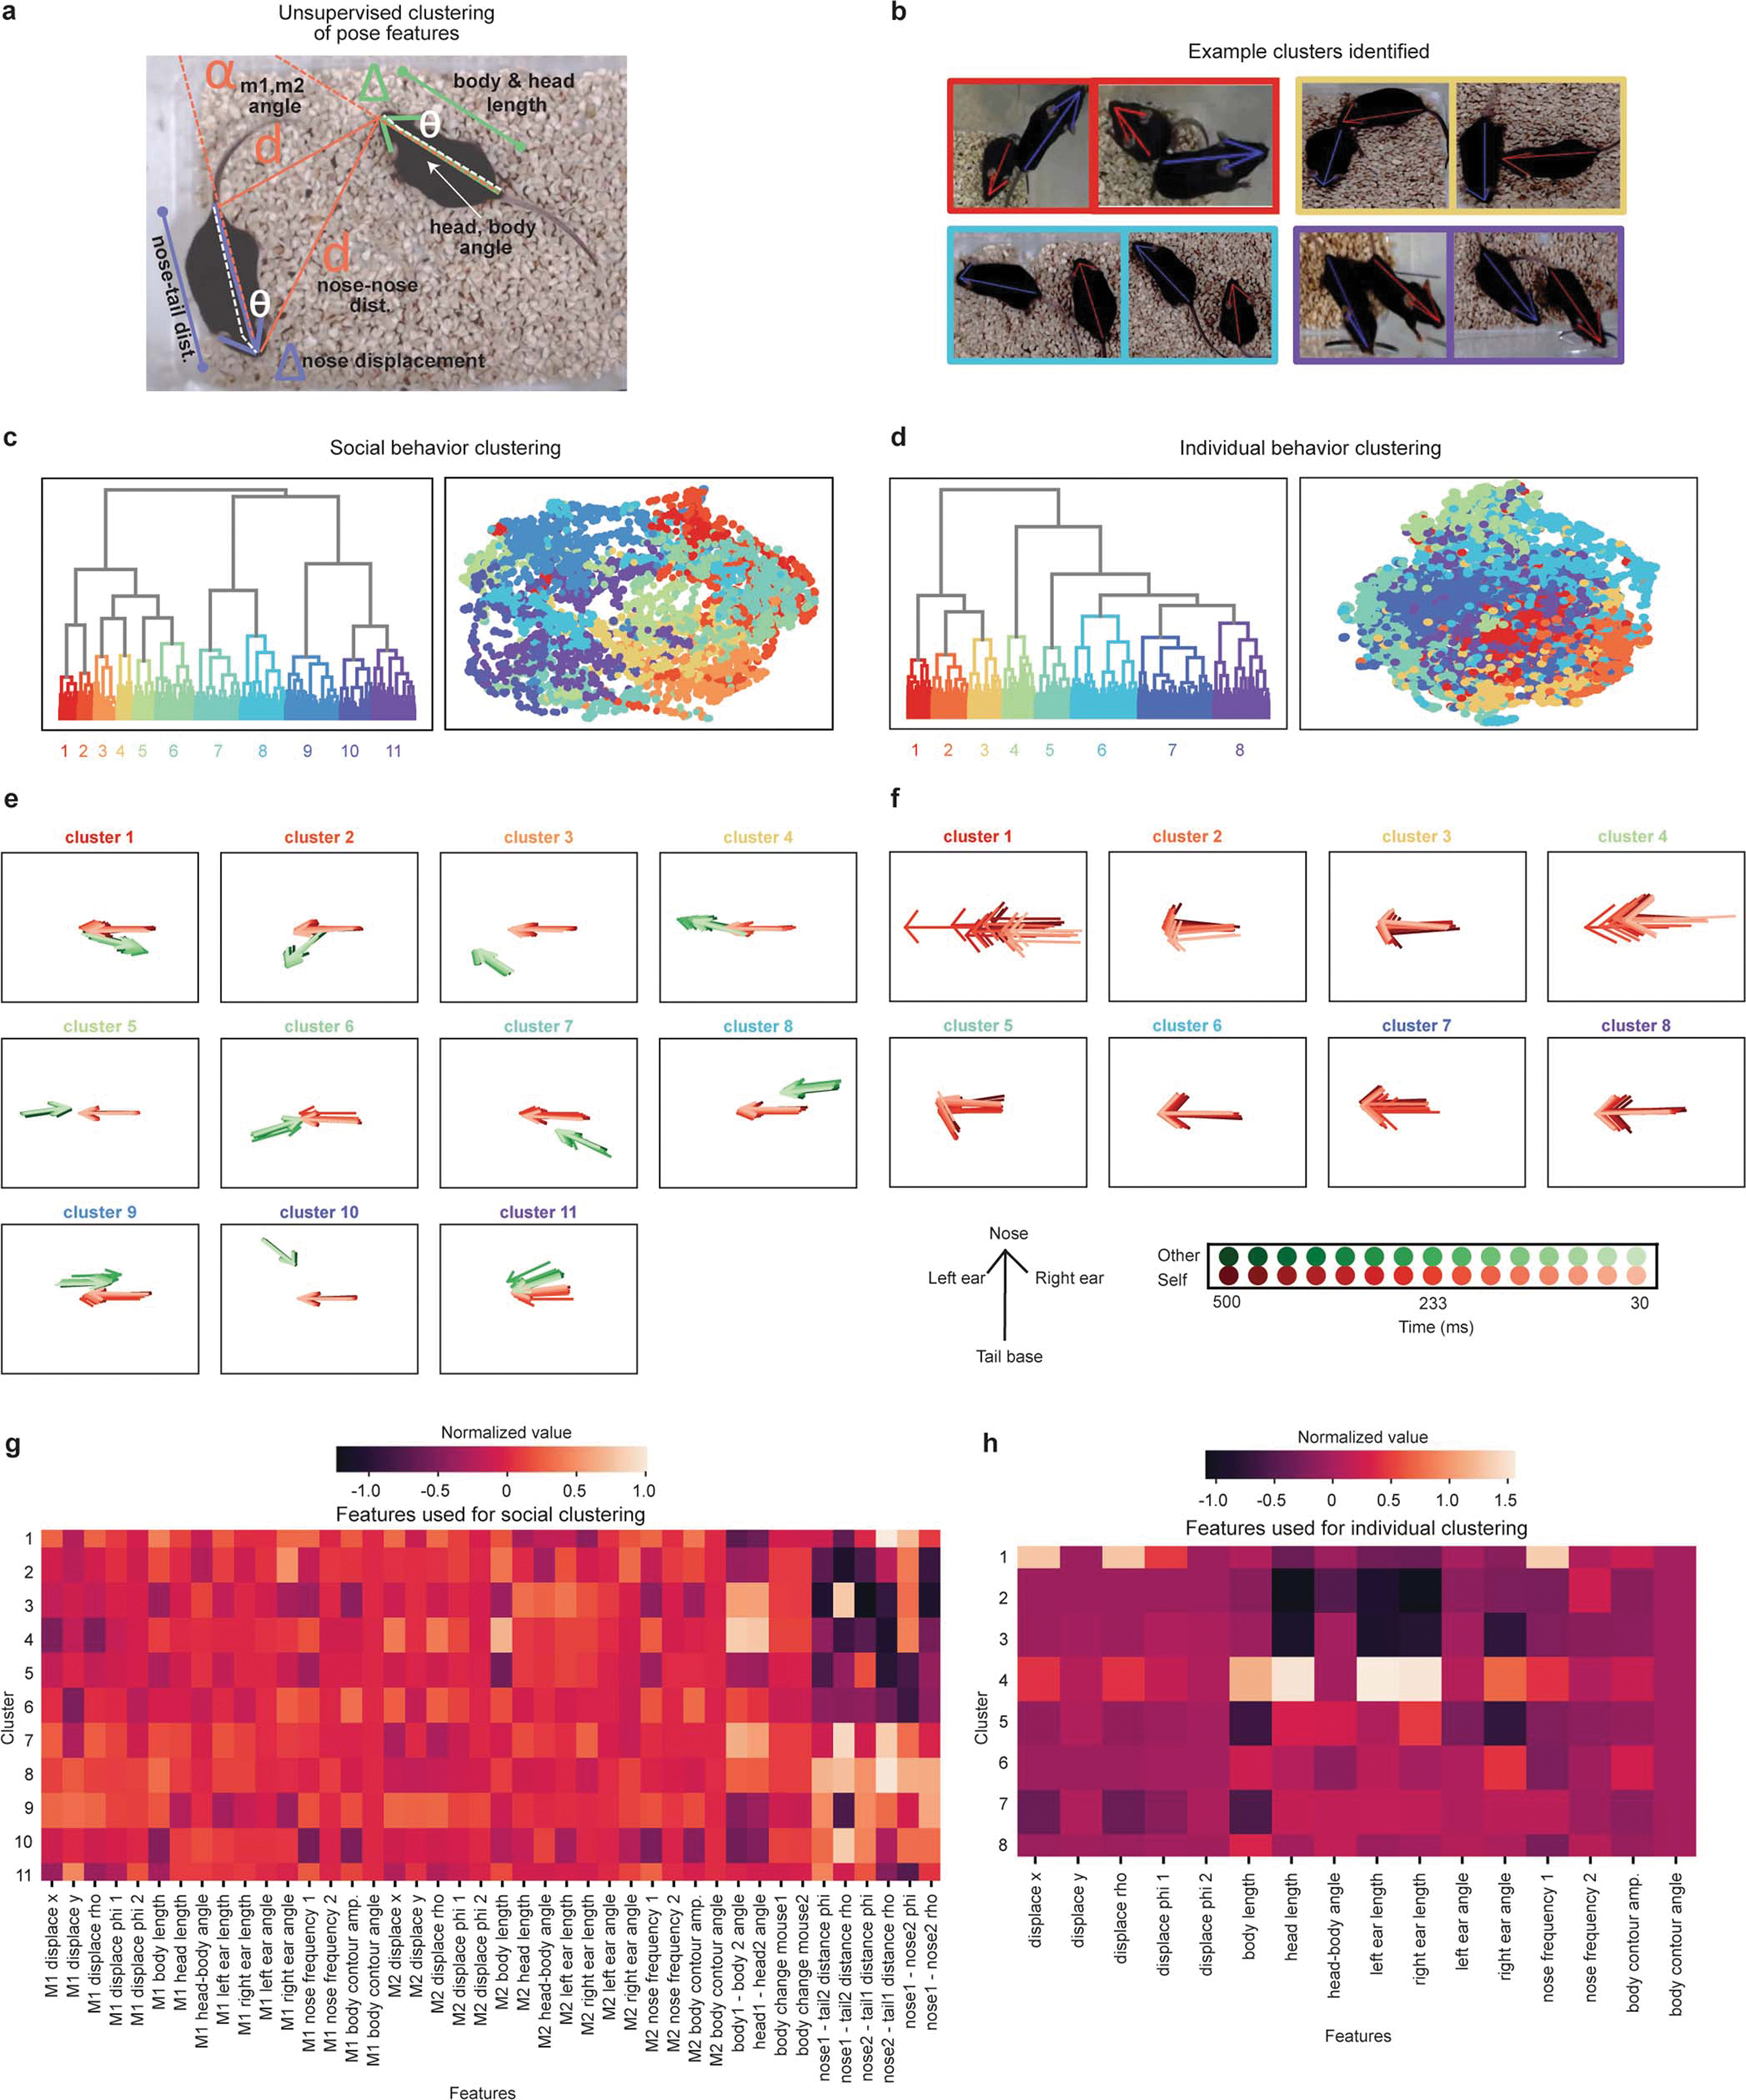
a, Diagram depicting features used for AlphaTracker’s unsupervised clustering of the tracking datapoints. The features include head length, body length, body-head angle, displacement of the nose, distance between mice, angle between mice. b, Example frames from clips belonging to a specific cluster (cluster ID indicated with the color outline in c). c, Dendrogram and UMAP plot showing all video clips color coded by cluster ID for social behavior clustering. The mean cluster outputs are shown in (e) and features used are shown in (g). d, Dendrogram and UMAP plot showing all video clips color coded by cluster ID for individual behavior clustering. The mean cluster outputs for this clustering are shown in (f) and features used are shown in (h). e, Average normalized skeleton for nose, ears and tail base across clusters for the social behavior clustering across 500 ms of video clip time. Red arrow indicates self skeleton and green indicates the other skeleton. Each arrow represents 33.3 ms of data (1 frame). f, Average normalized skeleton for nose, ears and tail base across clusters for the individual behavior clustering across 500 ms of video clip time. Each arrow represents 33.3 ms of data (1 frame). Legend in bottom applies to panels e-f. g, Heatmap of normalized values for the self and other features used for social behavior clustering. h, Heatmap of normalized values for the self features used for individual behavior clustering.
Extended Data Figure 4: Histological validation of electrode placements.
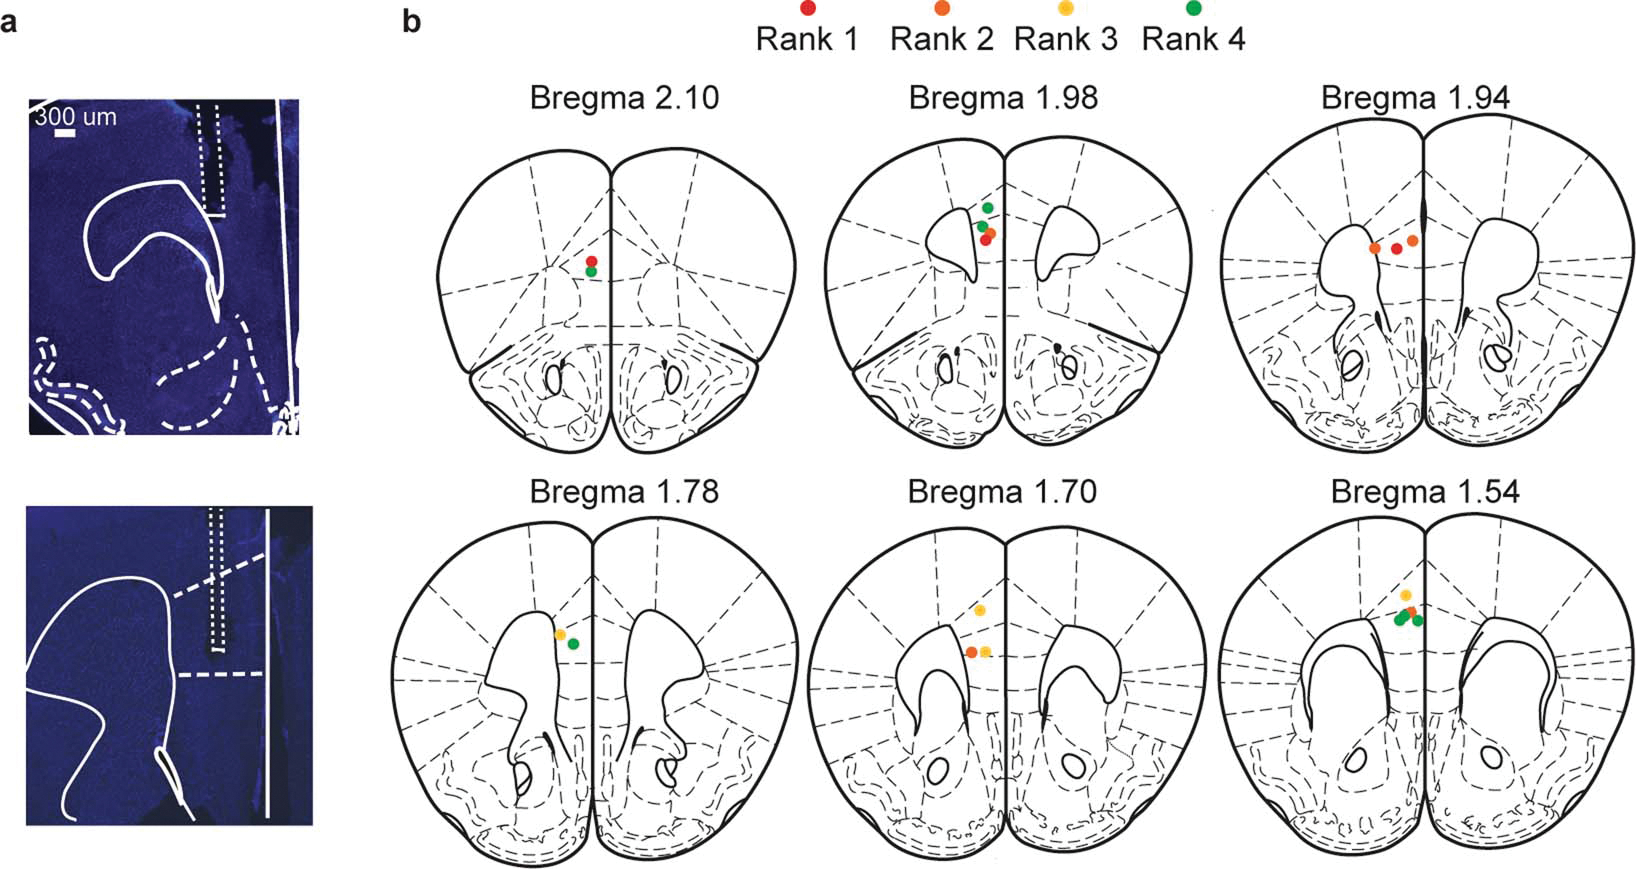
a, Representative images showing electrode track and lesions of mPFC electrode wires. b, Location of center for electrode lesions for all mice color coded by absolute rank across animals.
Extended Data Figure 5: Behavior in competition with logger and HMM-GLM model controls.
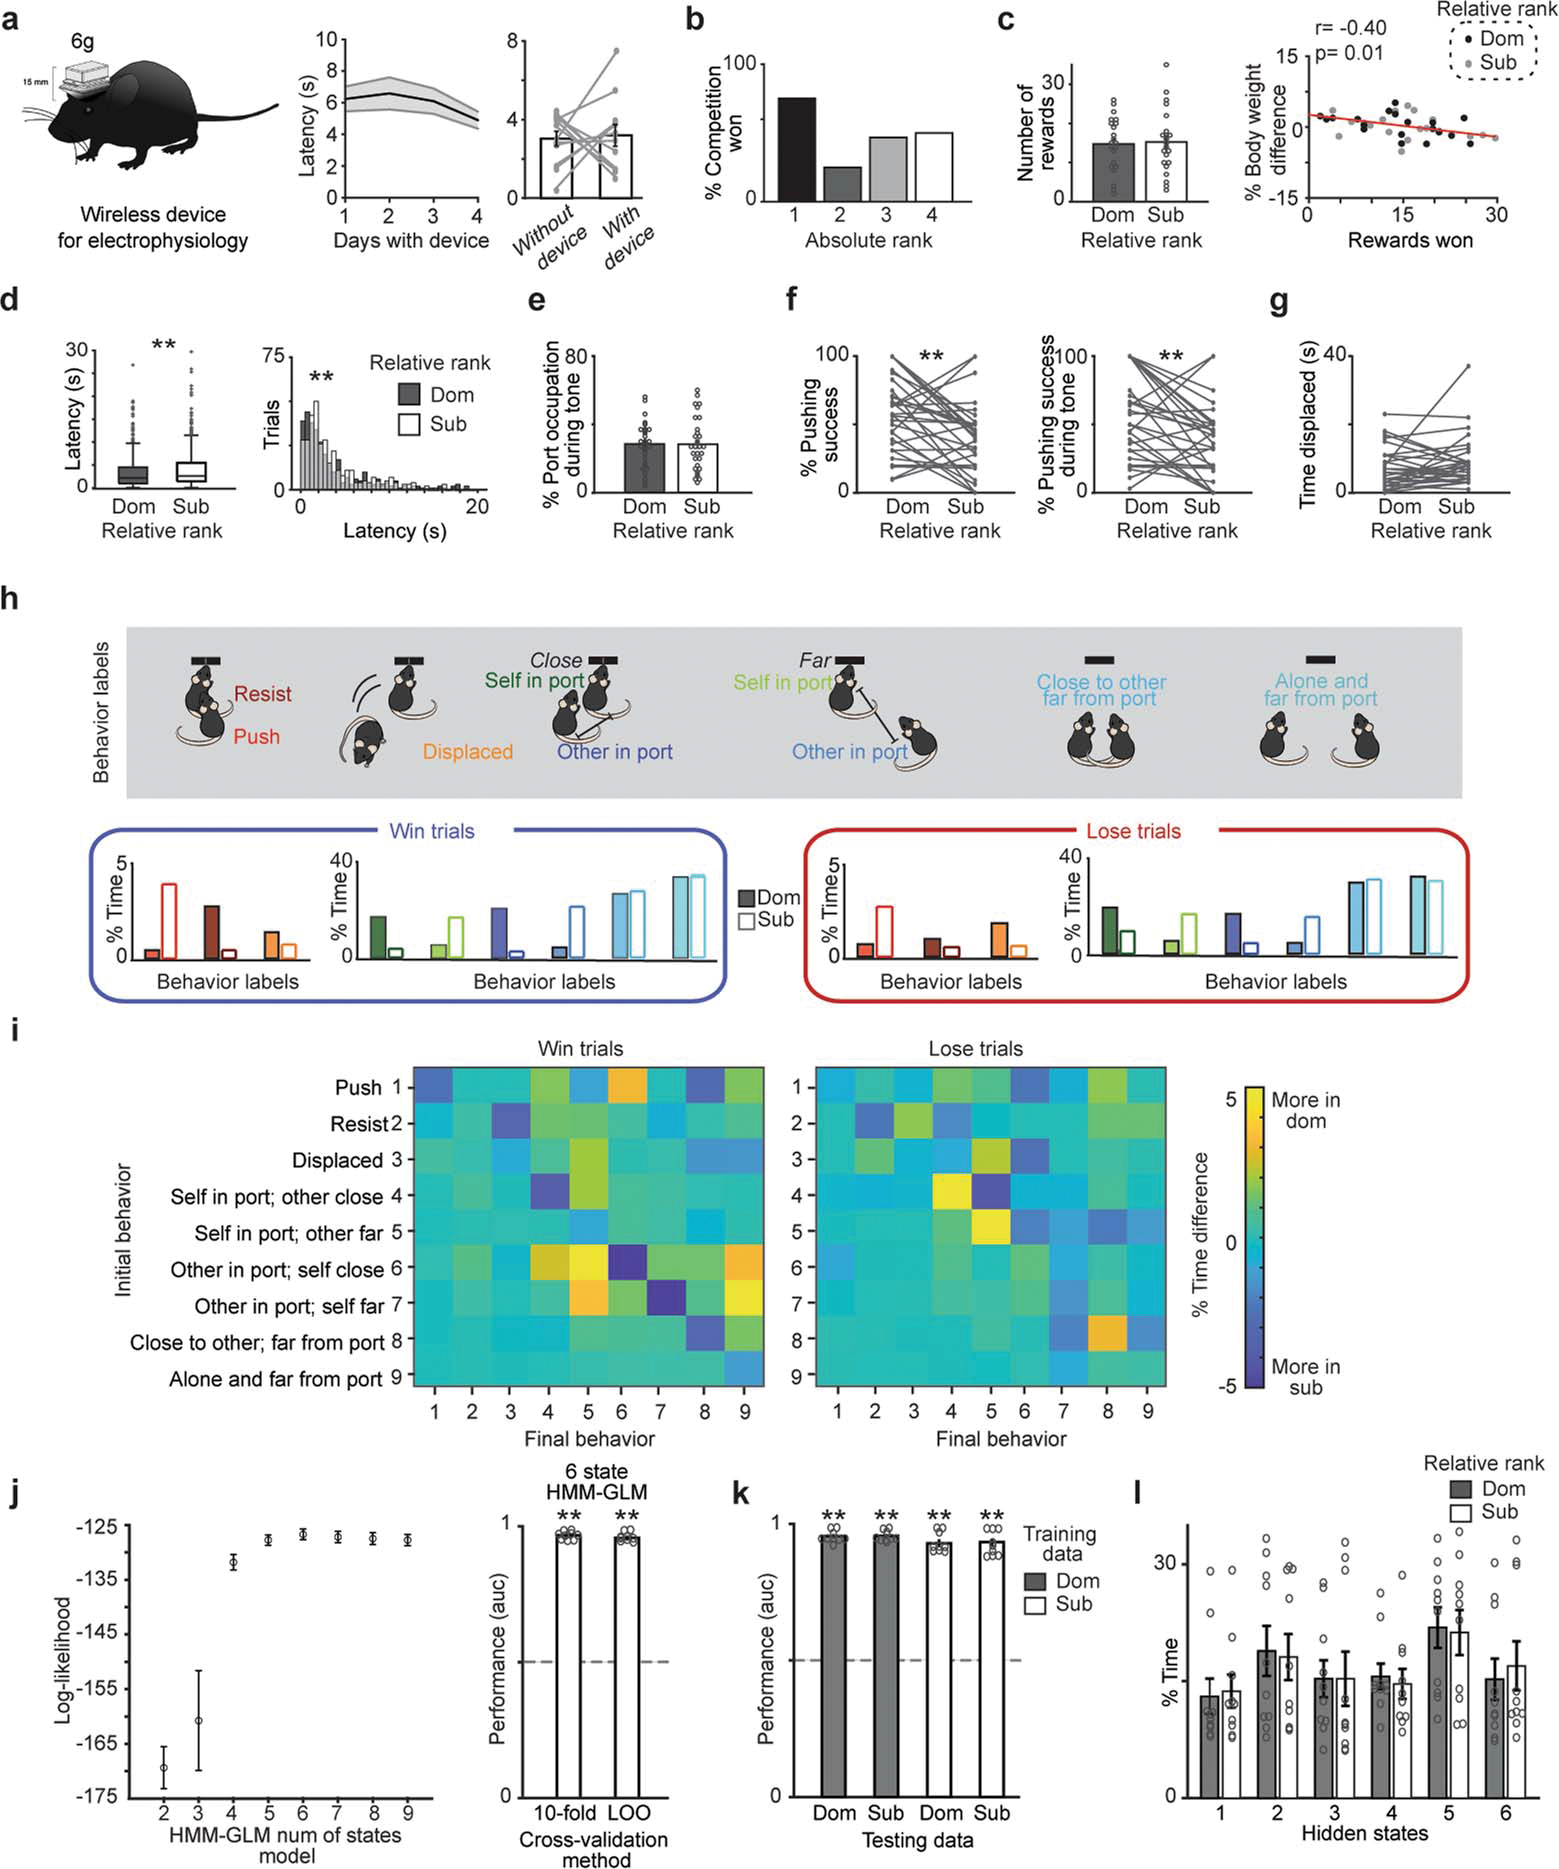
a, Left, diagram of wireless electrophysiology recording device used for mPFC recordings. Image modified from SpikeGadgets’ MiniLogger product illustration. Middle, latency to collect reward over four days of training (n=16 mice). Right, latency to collect reward while performing reward task alone was not affected by wearing the logger (n=12 mice; paired t-test, p=0.83). b, Percent competitions won by absolute rank is highest for rank 1 mice in dataset used for mPFC recordings (number of competitions per rank 1 n=12; rank 2 n=12; rank 3 n=15; rank 4 n=14). c, Left, number of rewards obtained by relative dominants (dom) and subordinates (sub) during the reward competitions between animals wearing loggers (n=22 mice per group; paired t-test, p=0.86). Right, % body weight difference between competitors significantly correlates with rewards won (sub n=19 dom n=20, Pearson’s correlation, *p=0.01). For correlation only mice with same day weight measurements were used. d, Subordinates had longer latencies to pick up the reward during win trials (center line, median; box limits, upper and lower quartiles; whiskers, 1.5x interquartile range; points, outliers). Left, latency per group. Right, histogram of the distribution of latencies across all trials (dom trials n=326, sub trials n=358, Wilcoxon rank-sum, p=0.012; Two-sample Kolmogorov-Smirnov test, dom vs sub trials p=0.015; One way RM-ANOVA F(1,24)=2.06, p=0.002). e, Percent port occupancy during tone across relative rank (n=31 sessions, paired t-test p=.90). f, Relative dominants were more successful displacing subordinates from the reward port throughout the competition (left; n=32 sessions, paired t-test, p=0.002) and during the tone time (right; n=31 sessions, paired t-test, p=0.005). g, Total time being displaced from reward port by relative rank in dataset used for mPFC recordings (n=31 sessions; paired t-test p=0.15). h, Percent time (normalized by total time per behavior) for 9 behaviors analyzed for win and lose trials separated by relative social rank. i, Percent time difference between relative dominant and subordinates for behavioral transitions during win trials (left) vs lose trials (right). j, Left, model selection for HMM-GLM state number using 10-fold cross-validation method results in a 6 state model being optimal. Error bars indicate standard error across the 10 cross-validations. Right, HMM-GLM 6 state model performance predicts behavioral label regardless of training method utilized (AUC n=9, one per each behavior label; Sign test of model performance vs chance p=0.004 for both methods). k, HMM-GLM 6 state model predicted behavioral label regardless of which dataset was used for training or testing (n=9 behavior labels using 482 trials for dom vs 478 trials for sub; Sign test performance vs 0.5 (chance) p=0.004 for all tests). l, Distribution of percent time spent in each hidden state by relative rank group (n=10 cross-validations using 482 trials for dom vs 478 trials for sub from 14 mice).
Extended Data Figure 6: Additional data for mPFC population dynamics during social competition.
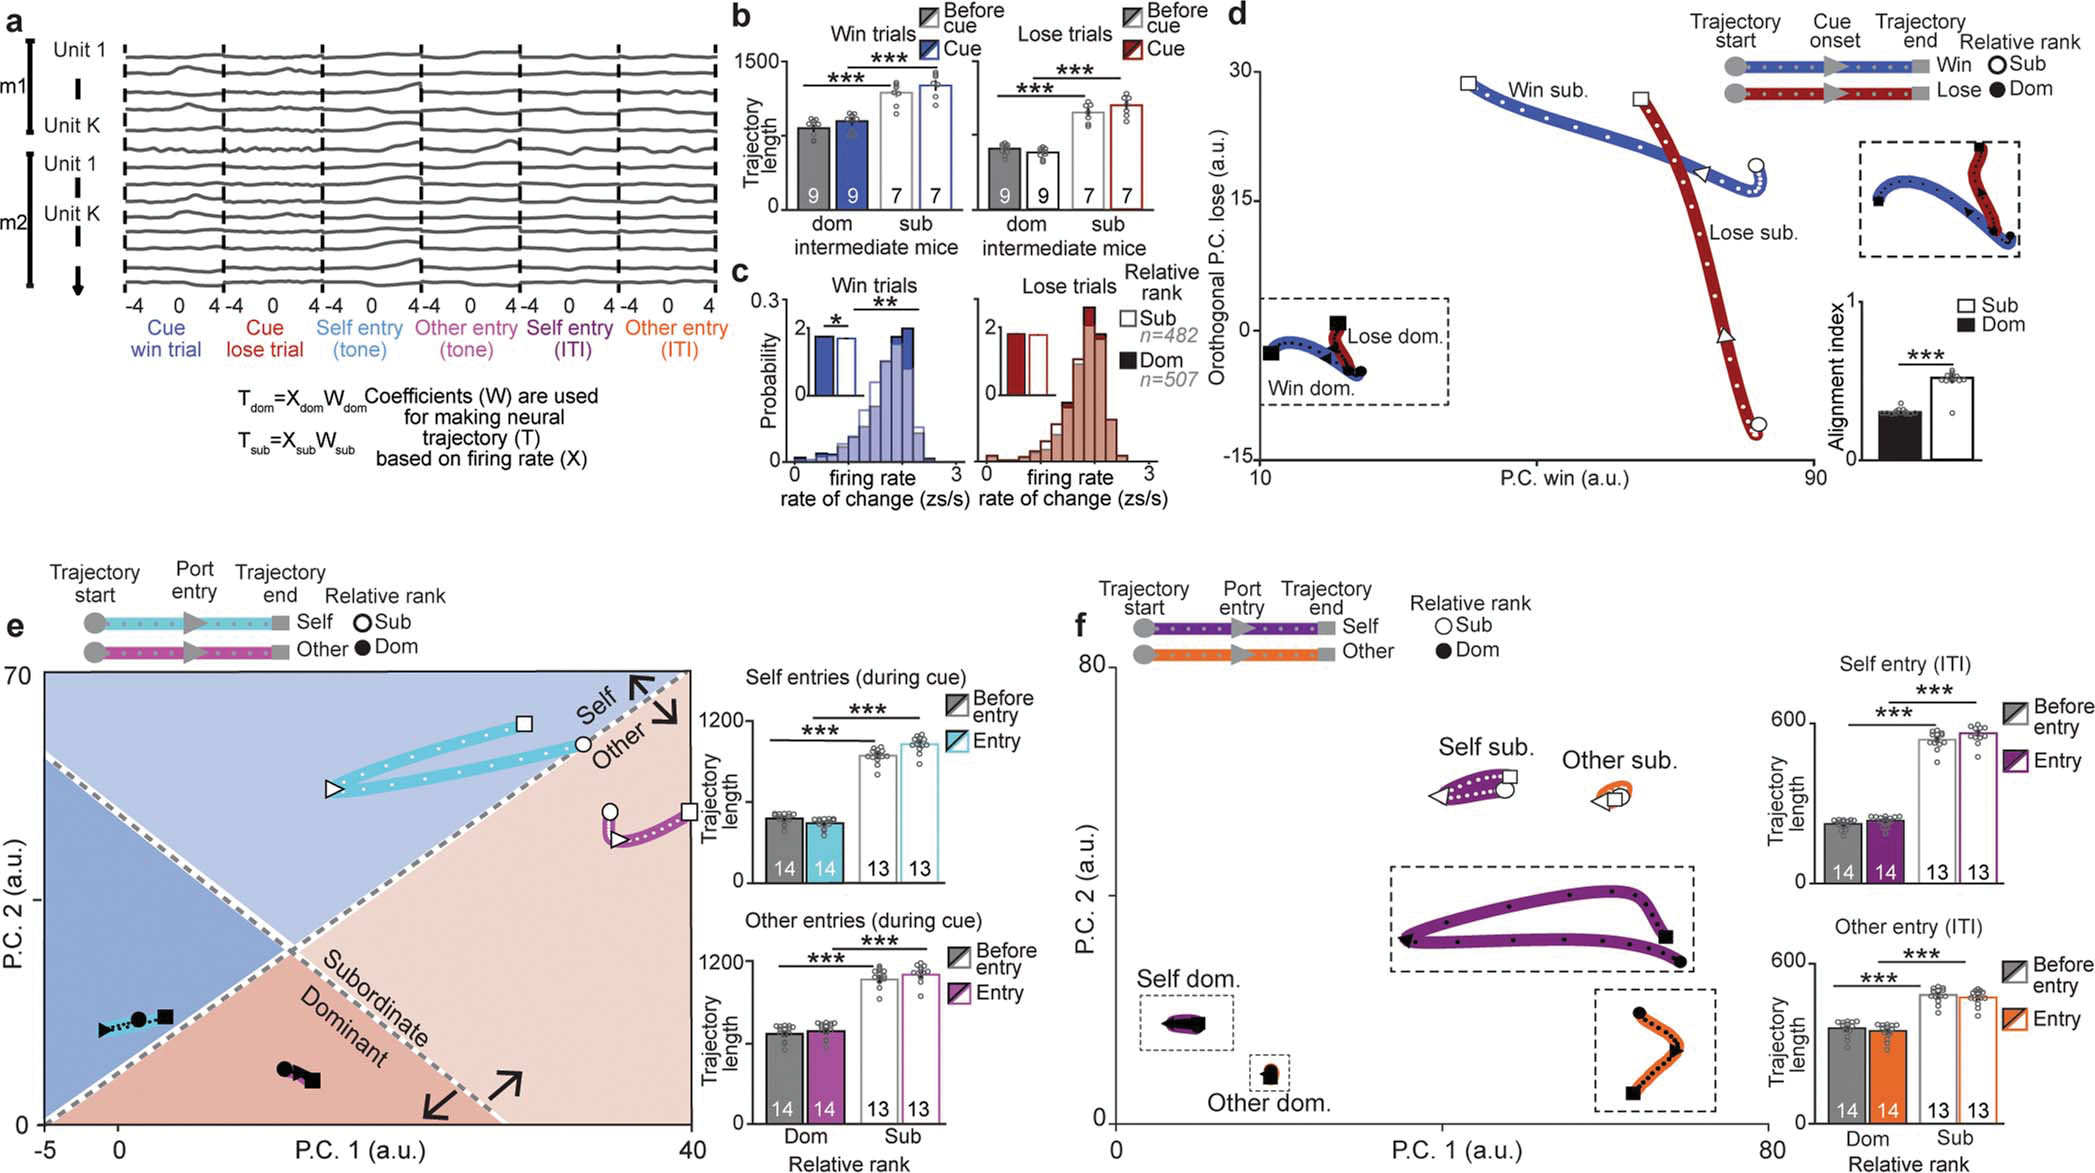
a, Data arrangement across all animals (m1=mouse 1, m2=mouse 2) for the dimensionality reduction to a common subspace for the six task-relevant events. Neural trajectories were created for dominant and subordinate data using mean firing rate per event and the principal component analysis coefficients. b, Neural trajectory lengths (using principal components that captured 90% of variance) for win and lose trials are highest for relative subordinates in intermediate (ranks 2 or 3) mice (n indicated on plots; win 2-way RM-ANOVA main effects of relative rank F(1,14)=165, p=2×10⁻⁶; lose 2-way RM-ANOVA effect of relative rank F(1,14)=262, p=6×10⁻⁷). c, Firing rate rate of change is higher for relative dominants only in win trials (number of neurons indicated in plots, inset plot has average across groups; win trials rate of change: Kolmogorov-Smirnov (KS) test p=0.009, Wilcoxon rank sum p=0.01; lose trials rate of change: KS test p=0.40, Wilcoxon rank sum p=0.19). d, Neural trajectories for win and lose trials plotted in the first Principal Component (PC) for win and the orthogonal lose subspace show little overlap. Top right, inset of dominant neural trajectories. Bottom right, alignment of win and lose trajectories was significantly lower for dominant mice (n=13 per group; Wilcoxon rank-sum, p=1.5×10⁻⁵). e, Left, neural trajectories of mPFC population firing rate differ by relative rank for port entries that occur during the tone period in a lower dimensional common principal component (PC) sub-space (trajectories are the average across leave one out iterations leaving out one mouse at a time, total neurons recorded from dominants: n=507 and subordinates: n=490 units from 20 mice). Self entry events are aligned to port entries of the subject mouse while other entry events are aligned to the competitor’s port entries. Right, trajectory lengths (using PCs that captured 90% of variance) for self entry (top) and other entry (bottom) during the tone are higher for relative subordinates (self entry 2-way RM-ANOVA effect of relative rank F(1,25)=452, p=5×10⁻¹⁴ and interaction of relative rank and event F(1,25)=5950, p=1×10⁻¹⁷; other entry 2-way ANOVA effect of relative rank F(1,25)=728, p=3×10⁻¹⁵ and interaction of relative rank and event F(1,25)=90, p=5×10⁻⁷). f, Left, Neural trajectories of mPFC population firing rate for port entries that occur during inter-trial interval (ITI) projected into the first two principal components of the common behavioral subspace. Insets show closer look to the dominant trajectories. Right, neural trajectory lengths for self entry (top) and other entry (bottom) during the ITI (n=14 relative dom mice, n=13 relative sub mice; self entry: 2-way RM-ANOVA main effect of rank F(1,25)=77.7, p=1×10⁻⁹; other entry: 2-way RM-ANOVA main effect of rank F(1,25)=110, p=2×10⁻¹⁰. Self entry events are aligned to port entries of the subject mouse while other entry events are aligned to the competitor’s port entries. ITI port entries refer to port entries that occurred outside of the tone period.
Extended Data Figure 7: mPFC population dynamics during social competition are not driven by location or mouse identity.
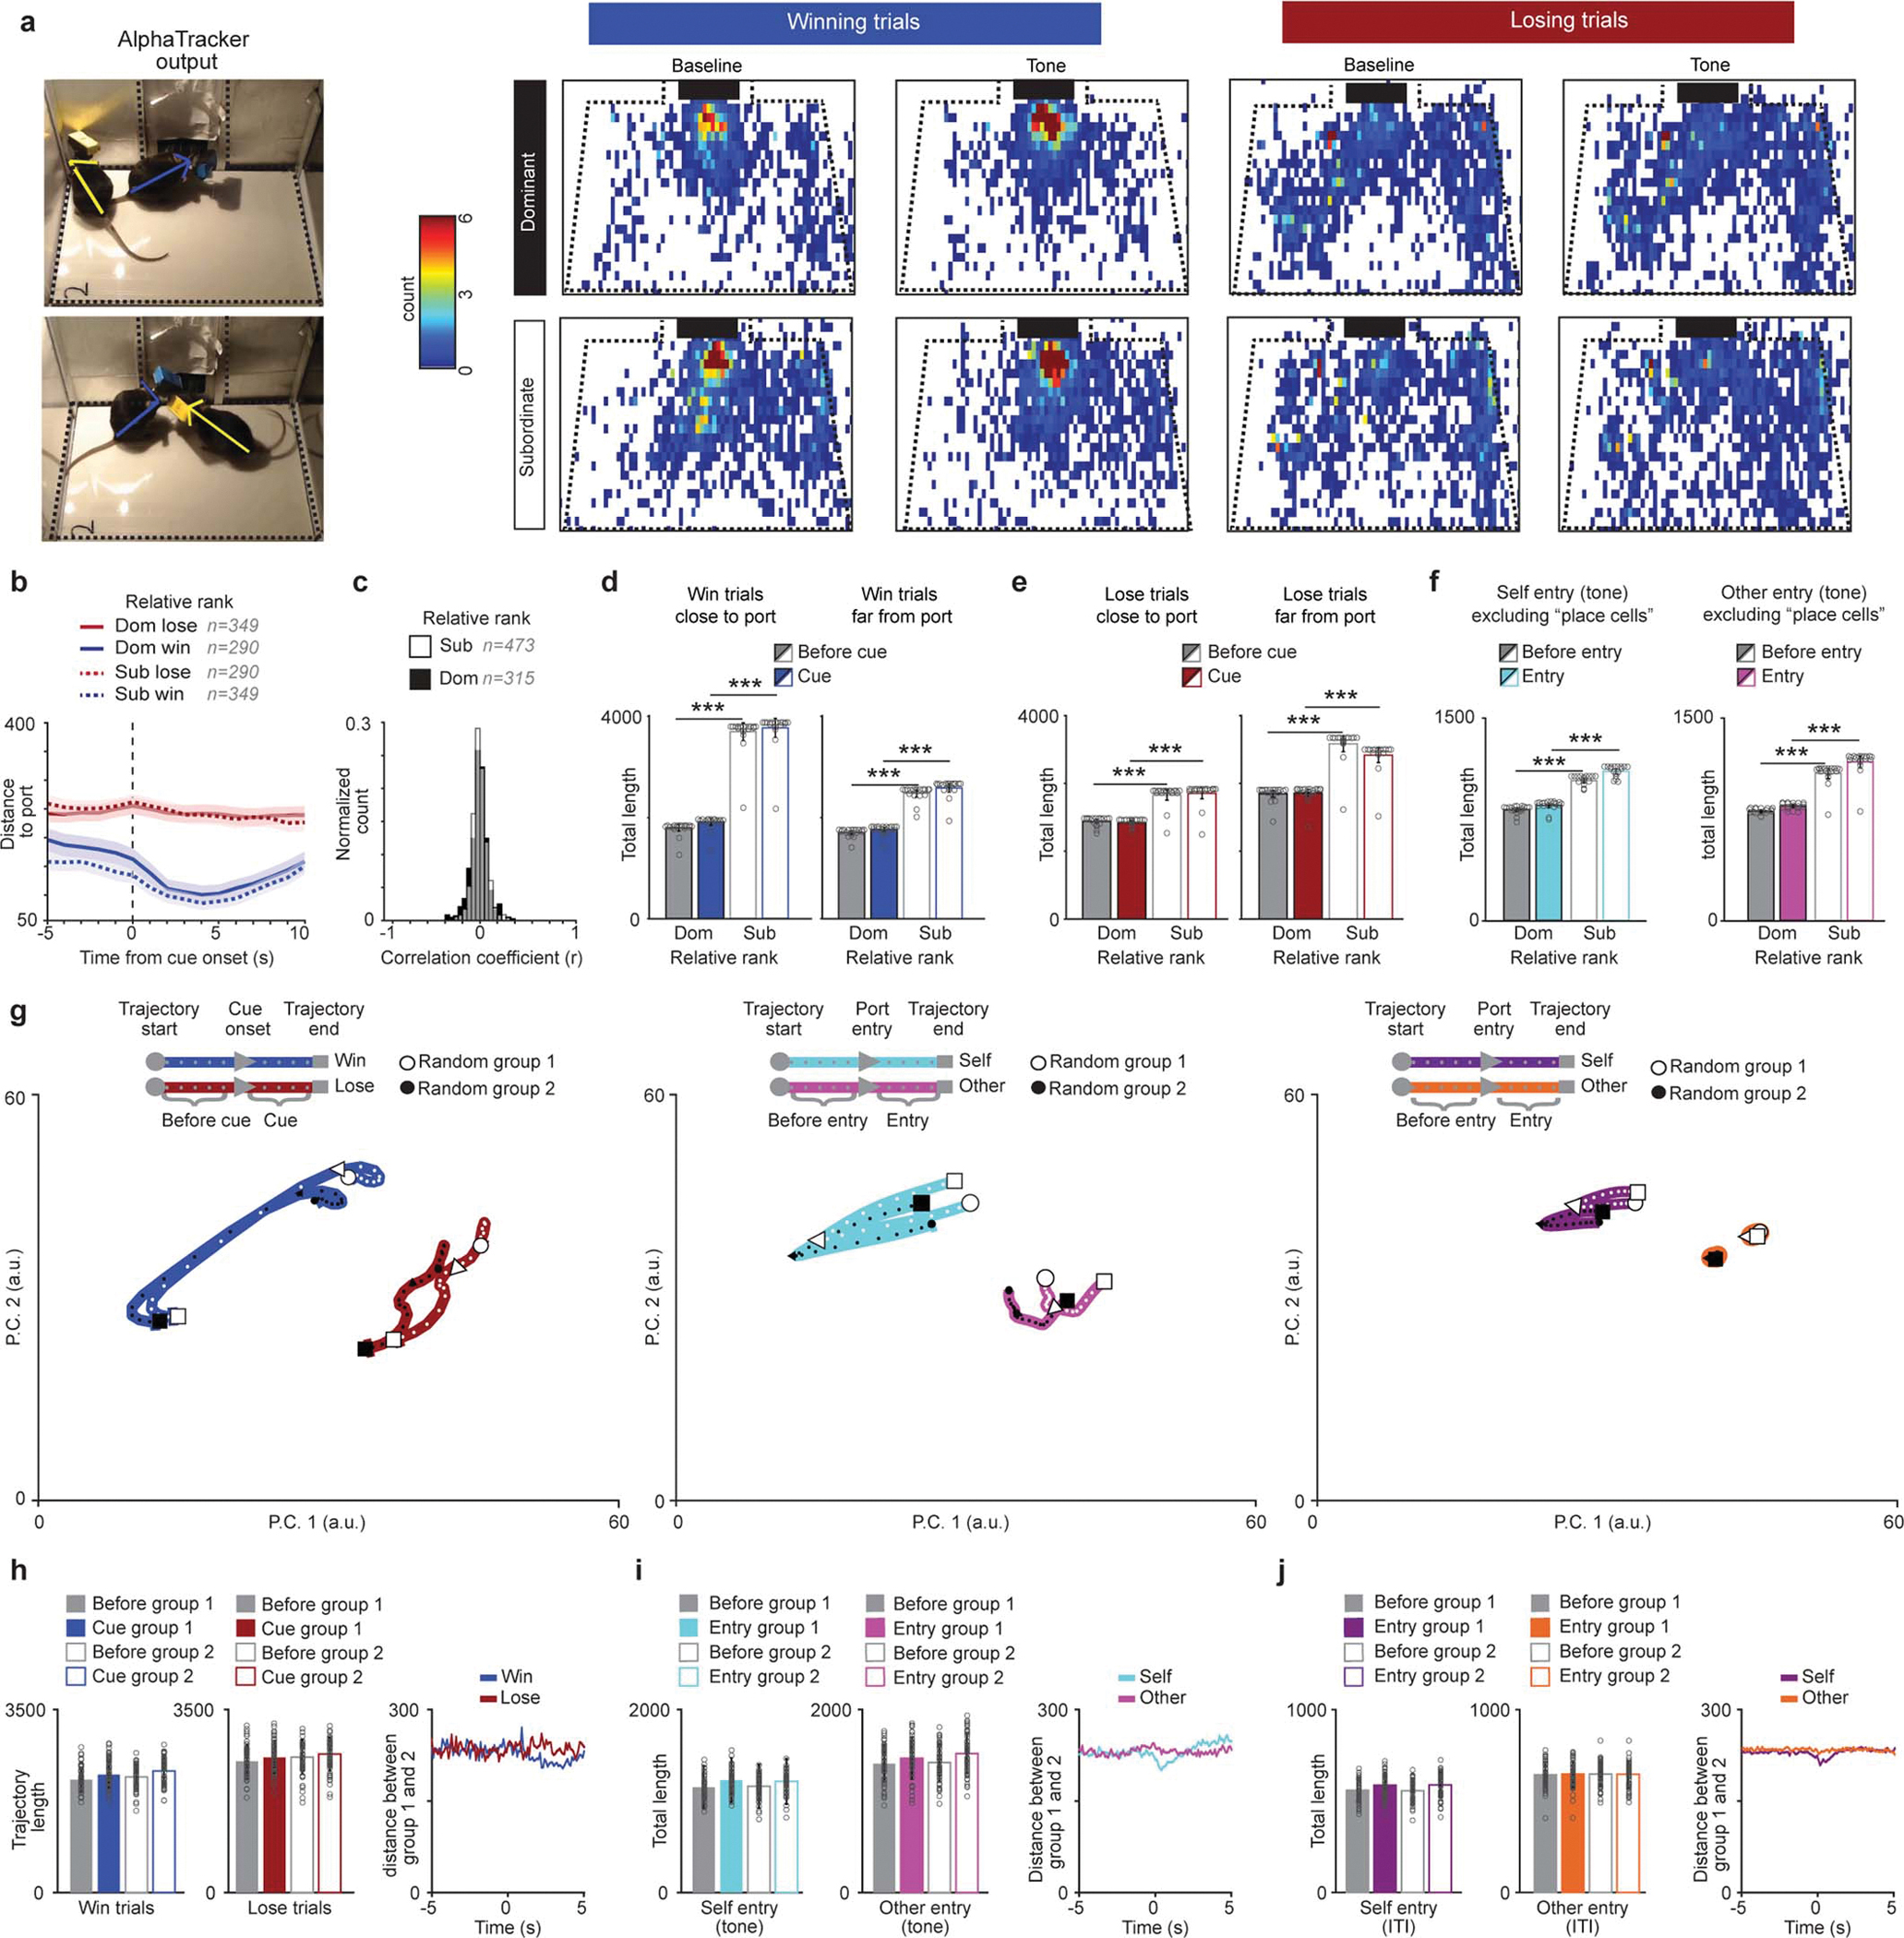
a, Average occupation in different parts of the chamber for win vs lose trials for the five seconds prior to tone vs first five seconds of tone. Black squares represent the reward port location. b, Distance to reward port differed by trial-type but not by rank (trials: dom win=290, dom lose=349, sub win=349, sub lose=290; 2-way ANOVA, main effect of trial-type F(1,1274)=353, p=8.8×10−70, rank p=0.098 and interaction p=0.066). c, Distribution of the correlation coefficients for firing rate and distance to port for the population of mPFC single units did not differ by rank (dom=321, sub=479; KS test, p=0.48). d, To determine if distance to reward port affected the population dynamics during win and lose trials a subset of data with matched video conditions was split by distance to reward port. Neural trajectory lengths were higher for relative subordinates during win trials in which mice were close or far to the reward port during tone onset (dom n=19 sessions, sub n=18 sessions; win close to port: 2-way RM-ANOVA main effect of rank F(1,35)=738, p=5×10⁻²¹; win far from port: 2-way RM-ANOVA main effect of rank F(1,35)=588, p=3×10⁻²⁰). e, Neural trajectory lengths were higher for relative subordinates during lose trials in which mice were close or far from reward port during tone onset (dom n=19 sessions, sub n=18 sessions; lose close to port: 2-way RM-ANOVA main effect of rank F(1,35)=588, p=3×10⁻²⁰; lose far from port: 2-way RM-ANOVA main effect of rank F(1,35)=46.7, p=5×10⁻¹¹). f, To determine if reward port “place cells” contributed to neural trajectory rank differences we calculated the neural trajectory lengths without cells that were correlated to distance to port in a subset of data with equivalent video settings (video resolution and camera angle). Left, neural trajectories for self entry during the tone are highest for relative subordinates without the distance correlated cells (dom n=18 sessions, sub n=18 sessions; 2-way RM-ANOVA main effect of rank F(1,34)=94.4, p=1×10⁻¹³). Right, neural trajectories are highest for relative subordinates without the distance correlated cells (dom n=18 sessions, sub n=18 sessions; excluding correlated cells: 2-way RM-ANOVA main effect of rank F(1,34)=100, p=1×10⁻¹³). g, Neural trajectories of mPFC population activity for two randomly selected halves of the data for (left) win and lose trials, (middle) port entries during the tone and (right) ITI port entries (data from 49 recording sessions from 20 mice). All trajectories reflect the mean trajectories across 50 bootstrapping iterations. h, Left, trajectory lengths for win and lose trials when data is divided randomly show no effect of group indicating that the effect of rank is not due to chance (n=50; win: 2-way ANOVA, event F(1,196)=8.41, p=0.004, group p=0.62; lose: event p=0.13, group p=0.65). Right, mean trajectory distances between groups for win and lose trials. i, Left, trajectory lengths for port entries during the tone when data is divided randomly show no effect of group (n=50; self entry: 2-way ANOVA, event F(1,196)=14.2, p=0.0002, group p=0.97; other entry: F(1,196)=6.76, p=0.01, group p=0.31). Right, mean trajectory distances between groups for self entry and other entry during the tone. j, Left, trajectory lengths for ITI port entries when data is divided randomly show no effect of group (n=50; self entry: 2-way ANOVA, event F(1,196)=10.3, p=0.001, group p=0.93; other entry: event p=0.96, group p=0.87). Right, mean trajectory distances between groups for self entry and other entry during the ITI.
Extended Data Figure 8: Decoding performance for relative and absolute social rank, and competitive success with different datasets.
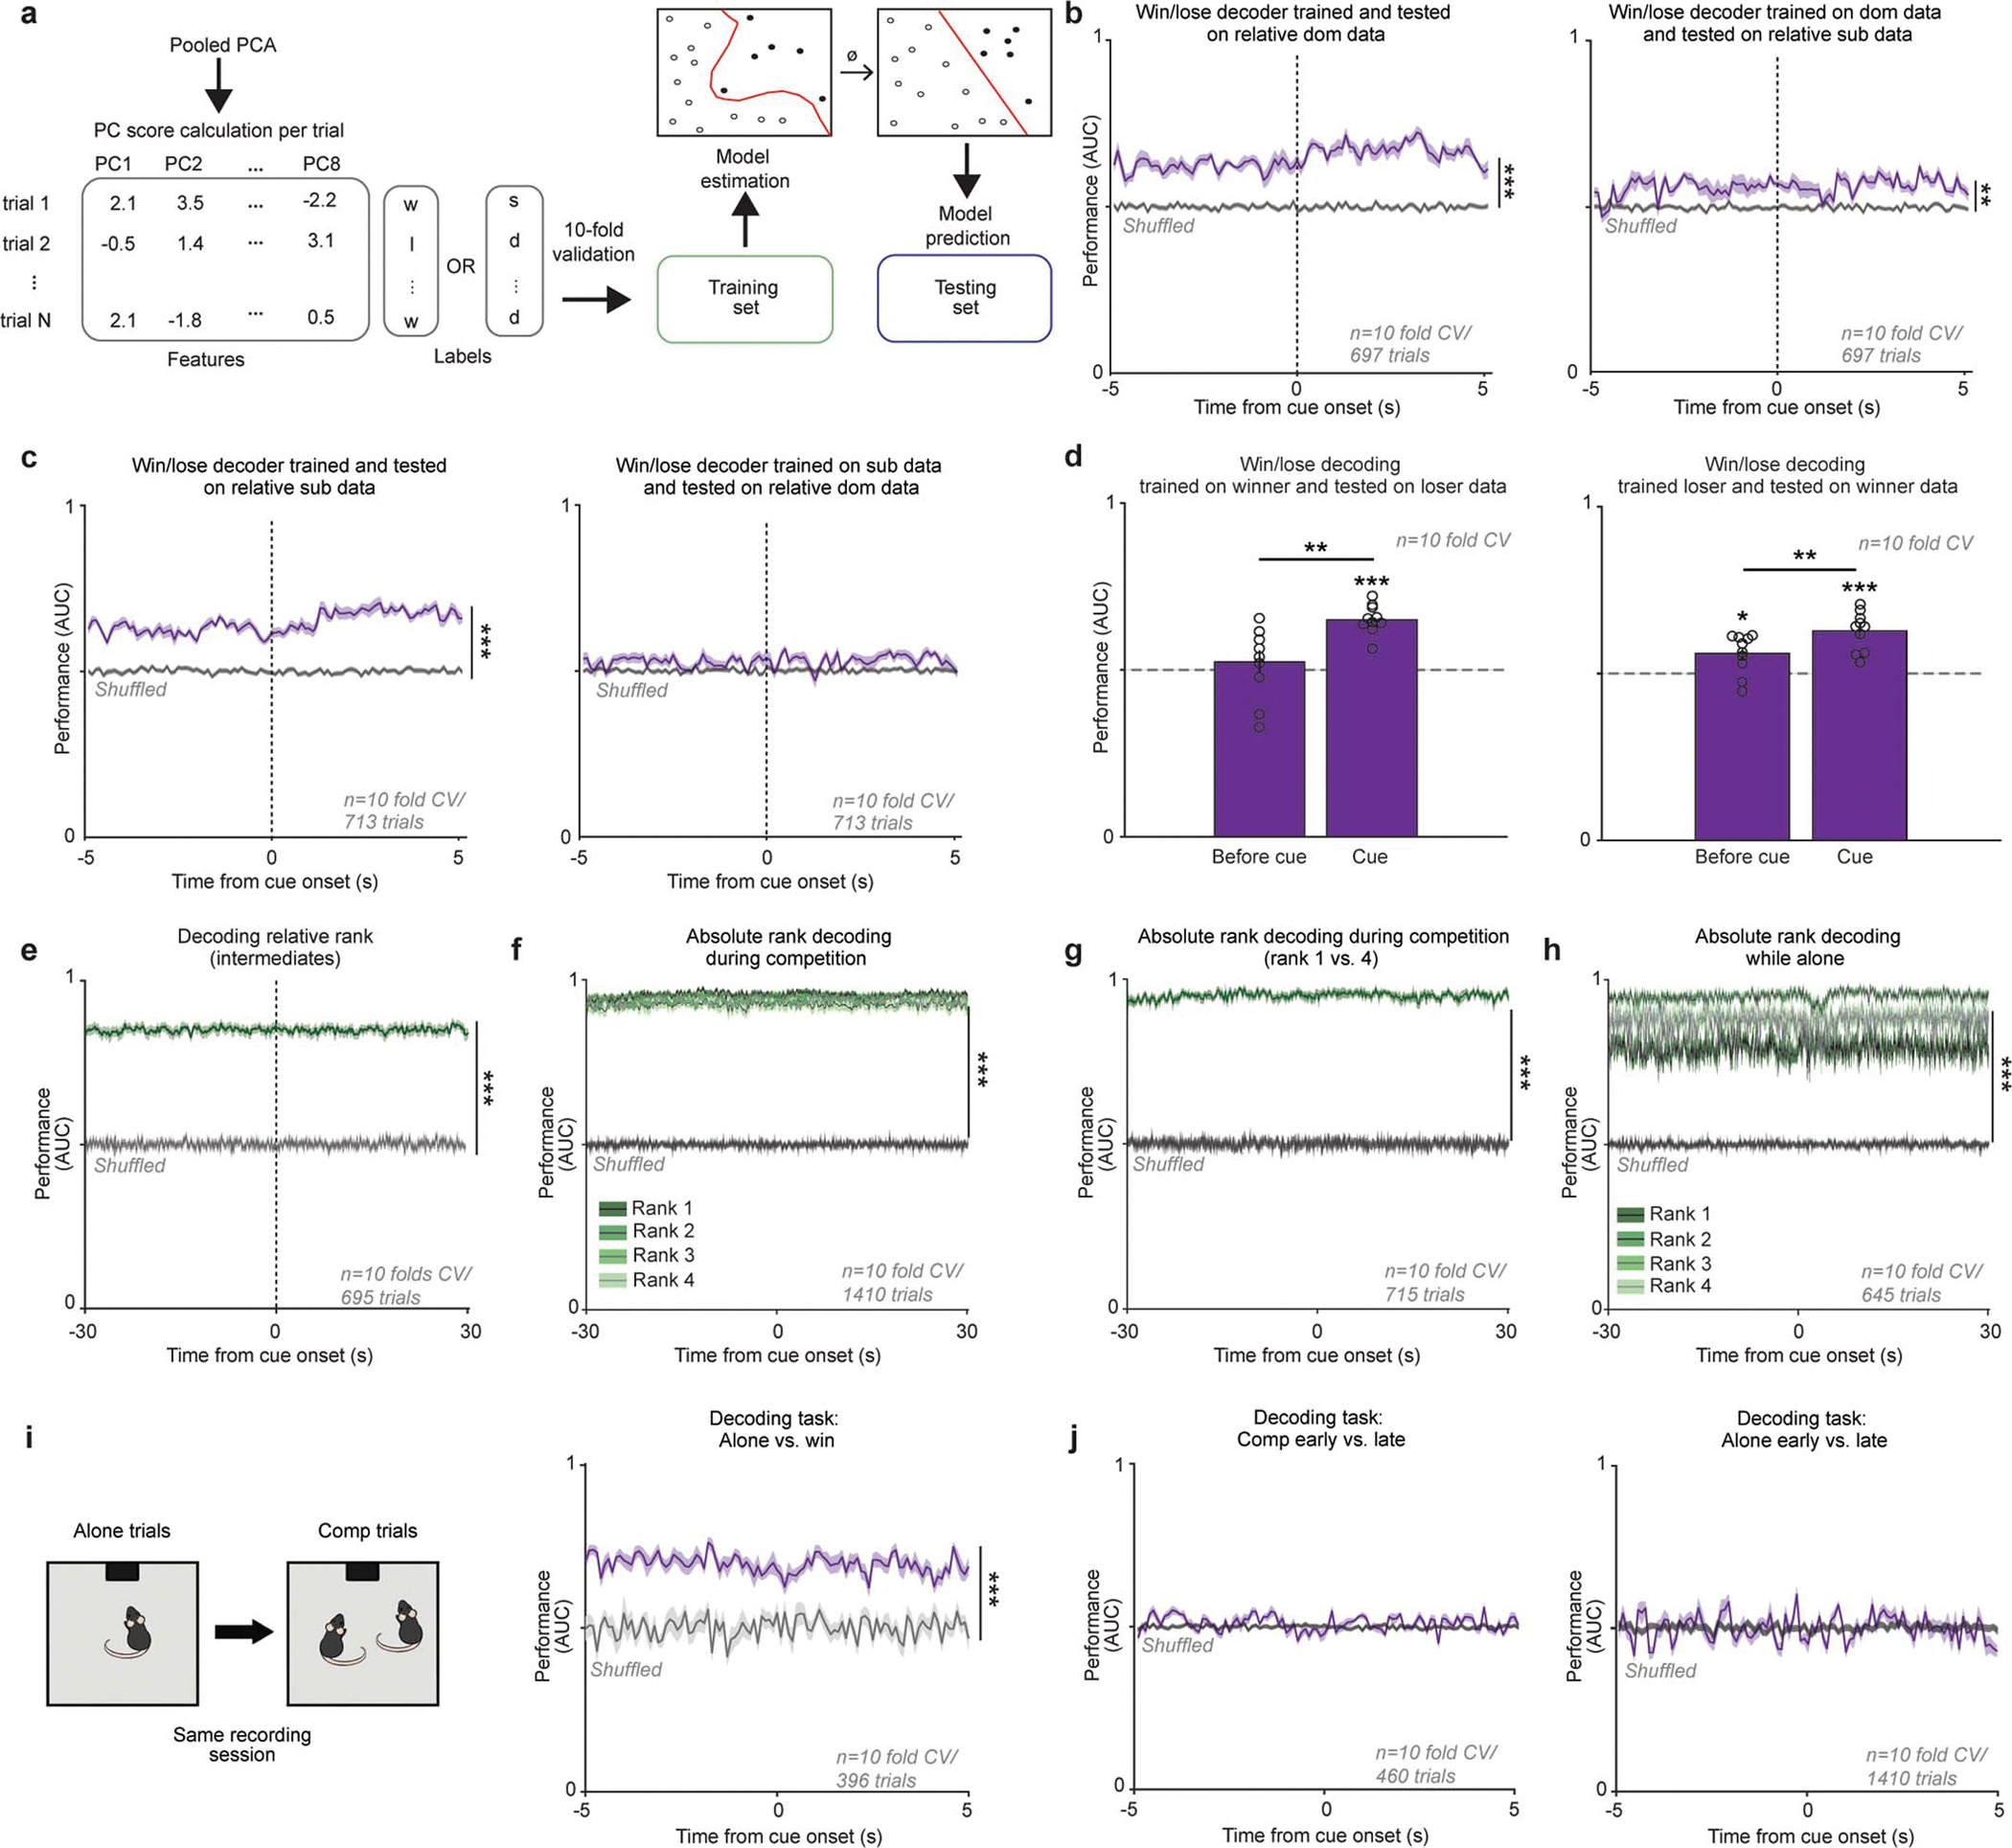
a, Support Vector Machine (SVM) data pipeline to decode rank or competition outcome based on single trial population mPFC data in the common behavioral subspace. b, mPFC population encoding of win/lose in relative dominants generalizes to relative subordinates. Decoding performance (area under the receiving operating curve; AUC) when (left) training and testing on relative dominant data or (right) training on dominant and tested on relative subordinate data was higher than chance (shuffled performance indicated in gray). (Wilcoxon rank sum, dom/dom p=0.0002, dom/sub p=0.003). c, mPFC population encoding of win/lose in relative subordinates does not generalize to relative dominants. Decoding performance (area under the receiving operating curve; AUC) when (left) training and testing on relative subordinate data was higher than chance but not when (right) testing on relative dominant data (shuffled performance indicated in gray). (Wilcoxon rank sum, sub/sub p=0.0002, sub/dom p=0.14). d, Decoder performance for classifying competition outcome using training data from winner data (e.g. mouse won majority of trials) and testing data from loser data (e.g. mouse lost majority of trials) and using training data from loser data and testing data from winner data (Wilcoxon rank sum: left, baseline vs shuffle p=0.10, left, cue vs shuffle p=0.0002, right, baseline vs shuffle p=0.02, right, cue vs shuffle p=0.0002; Wilcoxon sign rank: loser base vs cue p=0.002, winner base vs cue p=0.004). All error bars indicate standard error from 10-fold cross-validation. e, SVM performance for decoding relative rank specifically for intermediate (ranks 2 or 3) mice; mean AUC vs shuffled AUC Wilcoxon rank sum: p=0.0002). f, Absolute rank can be decoded from mPFC population activity during social competition. One model was trained per absolute rank (mean performance across ranks vs shuffled data; Wilcoxon rank sum p=0.0002). g, Absolute rank can be decoded for rank 1 and 4 animals from mPFC population activity during social competition. One model was trained to discriminate rank 1 trials from rank 4 (mean performance across ranks vs shuffled data: Wilcoxon rank sum p=0.0002). h, Absolute rank can be decoded from mPFC population activity in mice performing reward task alone. One model was trained per absolute rank (mean performance across ranks vs shuffled data; Wilcoxon rank sum p=0.0002). i, Left, experimental design. In 15 mice the same neurons were recorded during alone trials and followed by competition trials. Right, mPFC population activity can decode between alone tone presentations and win trials during the competition trials (shuffle performance indicated by gray line; mean AUC vs shuffled AUC Wilcoxon rank sum p=0.0002). j, mPFC population activity is not sufficient to decode early vs late trials within task (alone mean AUC vs shuffle AUC Wilcoxon sum rank p=0.47; comp mean AUC vs shuffle AUC Wilcoxon sum rank p=0.47).
Extended Data Figure 9: Additional data for mPFC single unit responses to task-relevant events during social competition.
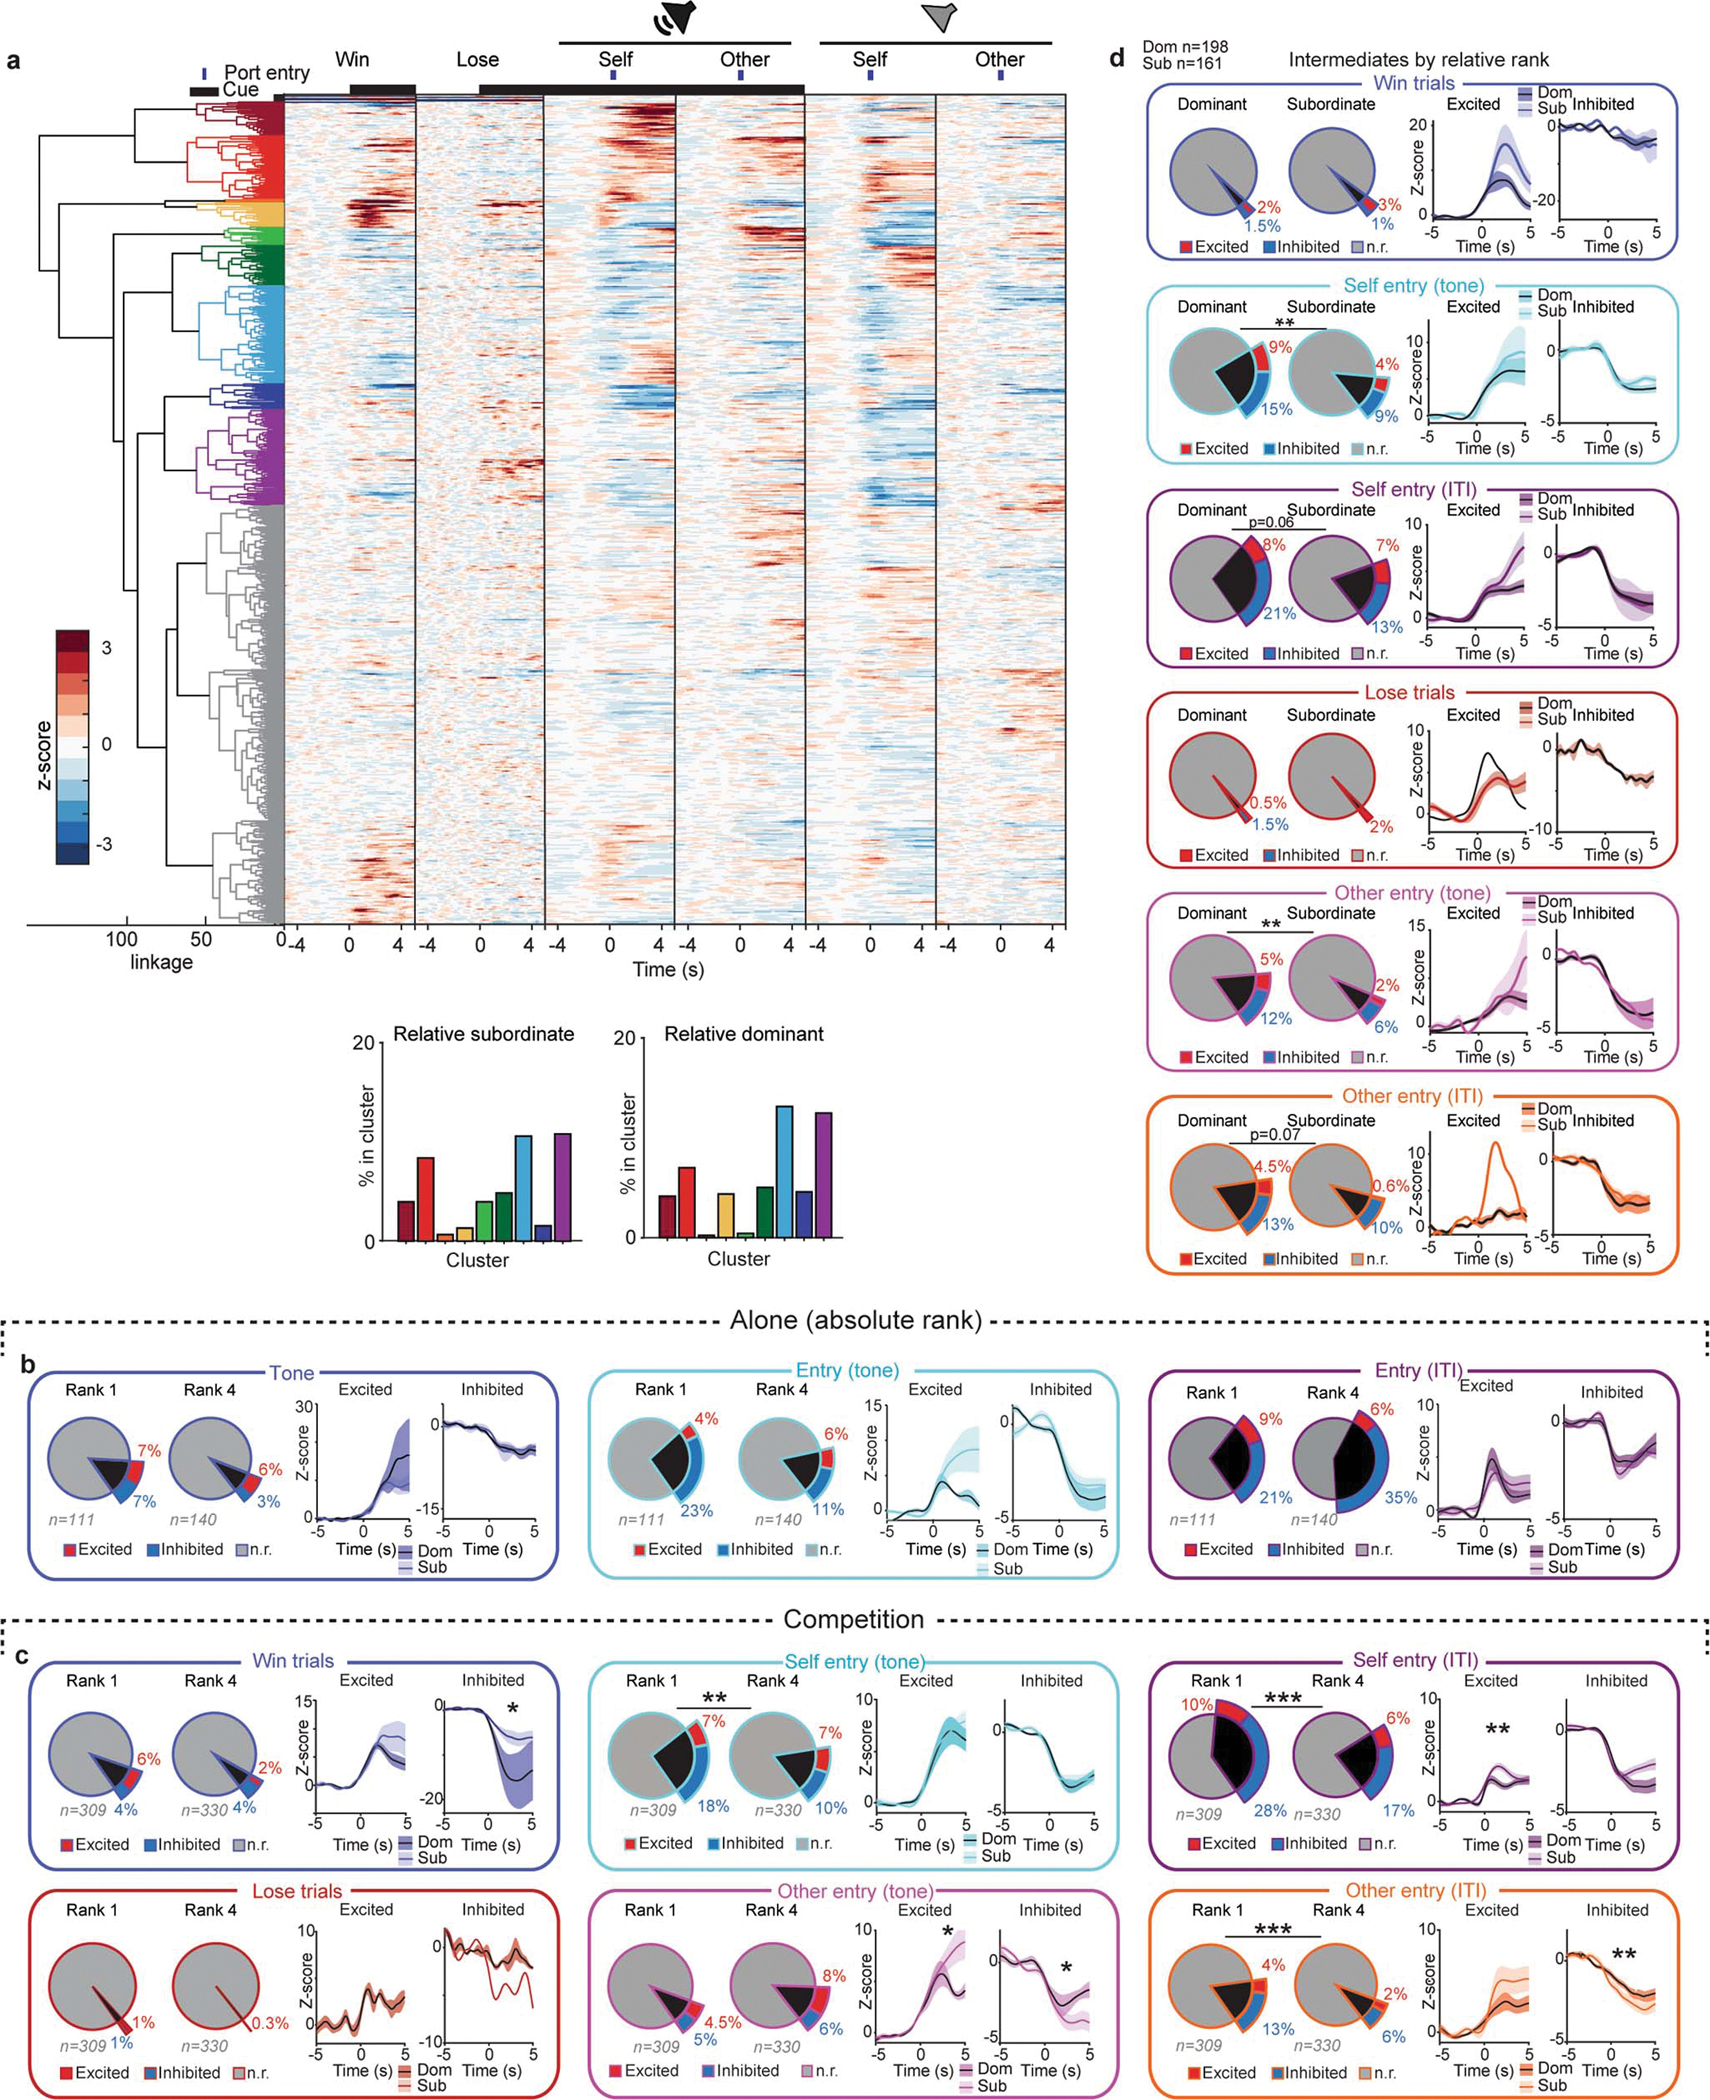
a, Top, Dendrogram for functional clusters and heatmap of mean firing rate for all the neurons included in the hierarchical clustering (n=913 cells). Gray cells in the dendrogram indicate cells in functional clusters that did not meet criteria of mean z-score being higher than 2 or lower than −1 for at least one event. Bottom, distribution of mPFC cells across functional clusters in relative subordinates and relative dominants. b, Left, mPFC tone responsive cells when mice perform the reward task alone. Number of responsive cells and response magnitude to the tone does not differ between rank 1 and rank 4 mice (rank 1 exc=8 rank 1 inh=8 rank 4 exc= 8 rank 4 inh=4; Fisher’s exact test, total responsive per group p=0.16; Wilcoxon rank sum across groups: exc p=0.87, inh p=1.0). Middle, mPFC tone port entries responsive cells when mice perform the reward task alone. Number of responsive cells and response magnitude to port entries during tone does not differ across dom (rank 1) vs sub (rank 4) mice (dom exc=5 dom inh=25 sub exc=9 sub inh=16; Fisher’s exact test, total responsive per group p=0.09; Wilcoxon rank sum across groups: exc p=0.23, inh p=0.62). Right, mPFC inter trial interval (ITI) port entries responsive cells when mice perform the reward task alone. Number of responsive cells and response magnitude to port entries during ITI does not differ between rank 1 and rank 4 mice (rank 1 exc=10, rank 1 inh=23 rank 4 exc=9 rank 4 inh=49; Fisher’s exact test, total responsive per group p=0.06; Wilcoxon rank sum across groups: exc p=0.84, inh p=0.17). c, Total responsive cells and response magnitude to task-relevant event during social competition for absolute rank 1 vs rank 4 (win trials: dom exc=20, dom inh=11, sub exc=7, sub inh=14, Fisher’s exact test p=0.11, Wilcoxon rank sum exc p=0.23, inh p=0.03; lose trials: dom exc=3 dom inh=3, sub exc=0, sub inh=1, Fisher’s exact test p=0.12, Wilcoxon rank sum inh p=0.50; self entries tone: dom exc=23, dom inh=57, sub exc=24, sub inh=32, Fisher’s exact test p=0.006, Wilcoxon rank sum exc p=0.42, inh p=0.77; other entries tone: dom exc=14, dom inh 16, sub exc=27, sub inh=19, Fisher’s exact test p=0.11, Wilcoxon rank sum exc p=0.049, inh p=0.04; self entries ITI dom exc=31, dom inh=89, sub exc=21, sub inh=56, Fisher’s exact test p=2×10⁻⁵, Wilcoxon rank sum exc p=0.01, inh p=0.41; other entries ITI dom exc=13, dom inh=41, sub exc=8, sub inh=21, Fisher’s exact test p=0.001, Wilcoxon rank sum exc p=0.11, inh p=0.008). d, Total responsive cells and response magnitude to task-relevant event during social competition for intermediate rank mice (ranks 2 and 3) by relative rank (win trials: dom exc=4, dom inh=3, sub exc=5, sub inh=2, Fisher’s exact test p=0.76, Wilcoxon rank sum exc p=0.11, inh p=0.80; lose trials: dom exc=1 dom inh=3, sub exc=3, sub inh=0, Fisher’s exact test p=1, Wilcoxon rank sum exc p=1; self entries tone: dom exc=17, dom inh=30, sub exc=7, sub inh=14, Fisher’s exact test p=0.01, Wilcoxon rank sum exc p=0.89, inh p=0.57; other entries tone: dom exc=10, dom inh 23, sub exc=3, sub inh=10, Fisher’s exact test p=0.01, Wilcoxon rank sum exc p=0.46, inh p=0.79; self entries ITI dom exc=15, dom inh=42, sub exc=11, sub inh=21, Fisher’s exact test p=0.06, Wilcoxon rank sum exc p=0.11, inh p=0.44; other entries ITI dom exc=9, dom inh=26, sub exc=1, sub inh=16, Fisher’s exact test p=0.07, Wilcoxon rank sum exc p=0.20, inh p=0.90).
Extended Data Figure 10: mPFC-LH photostimulation does not affect other motivated behaviors.
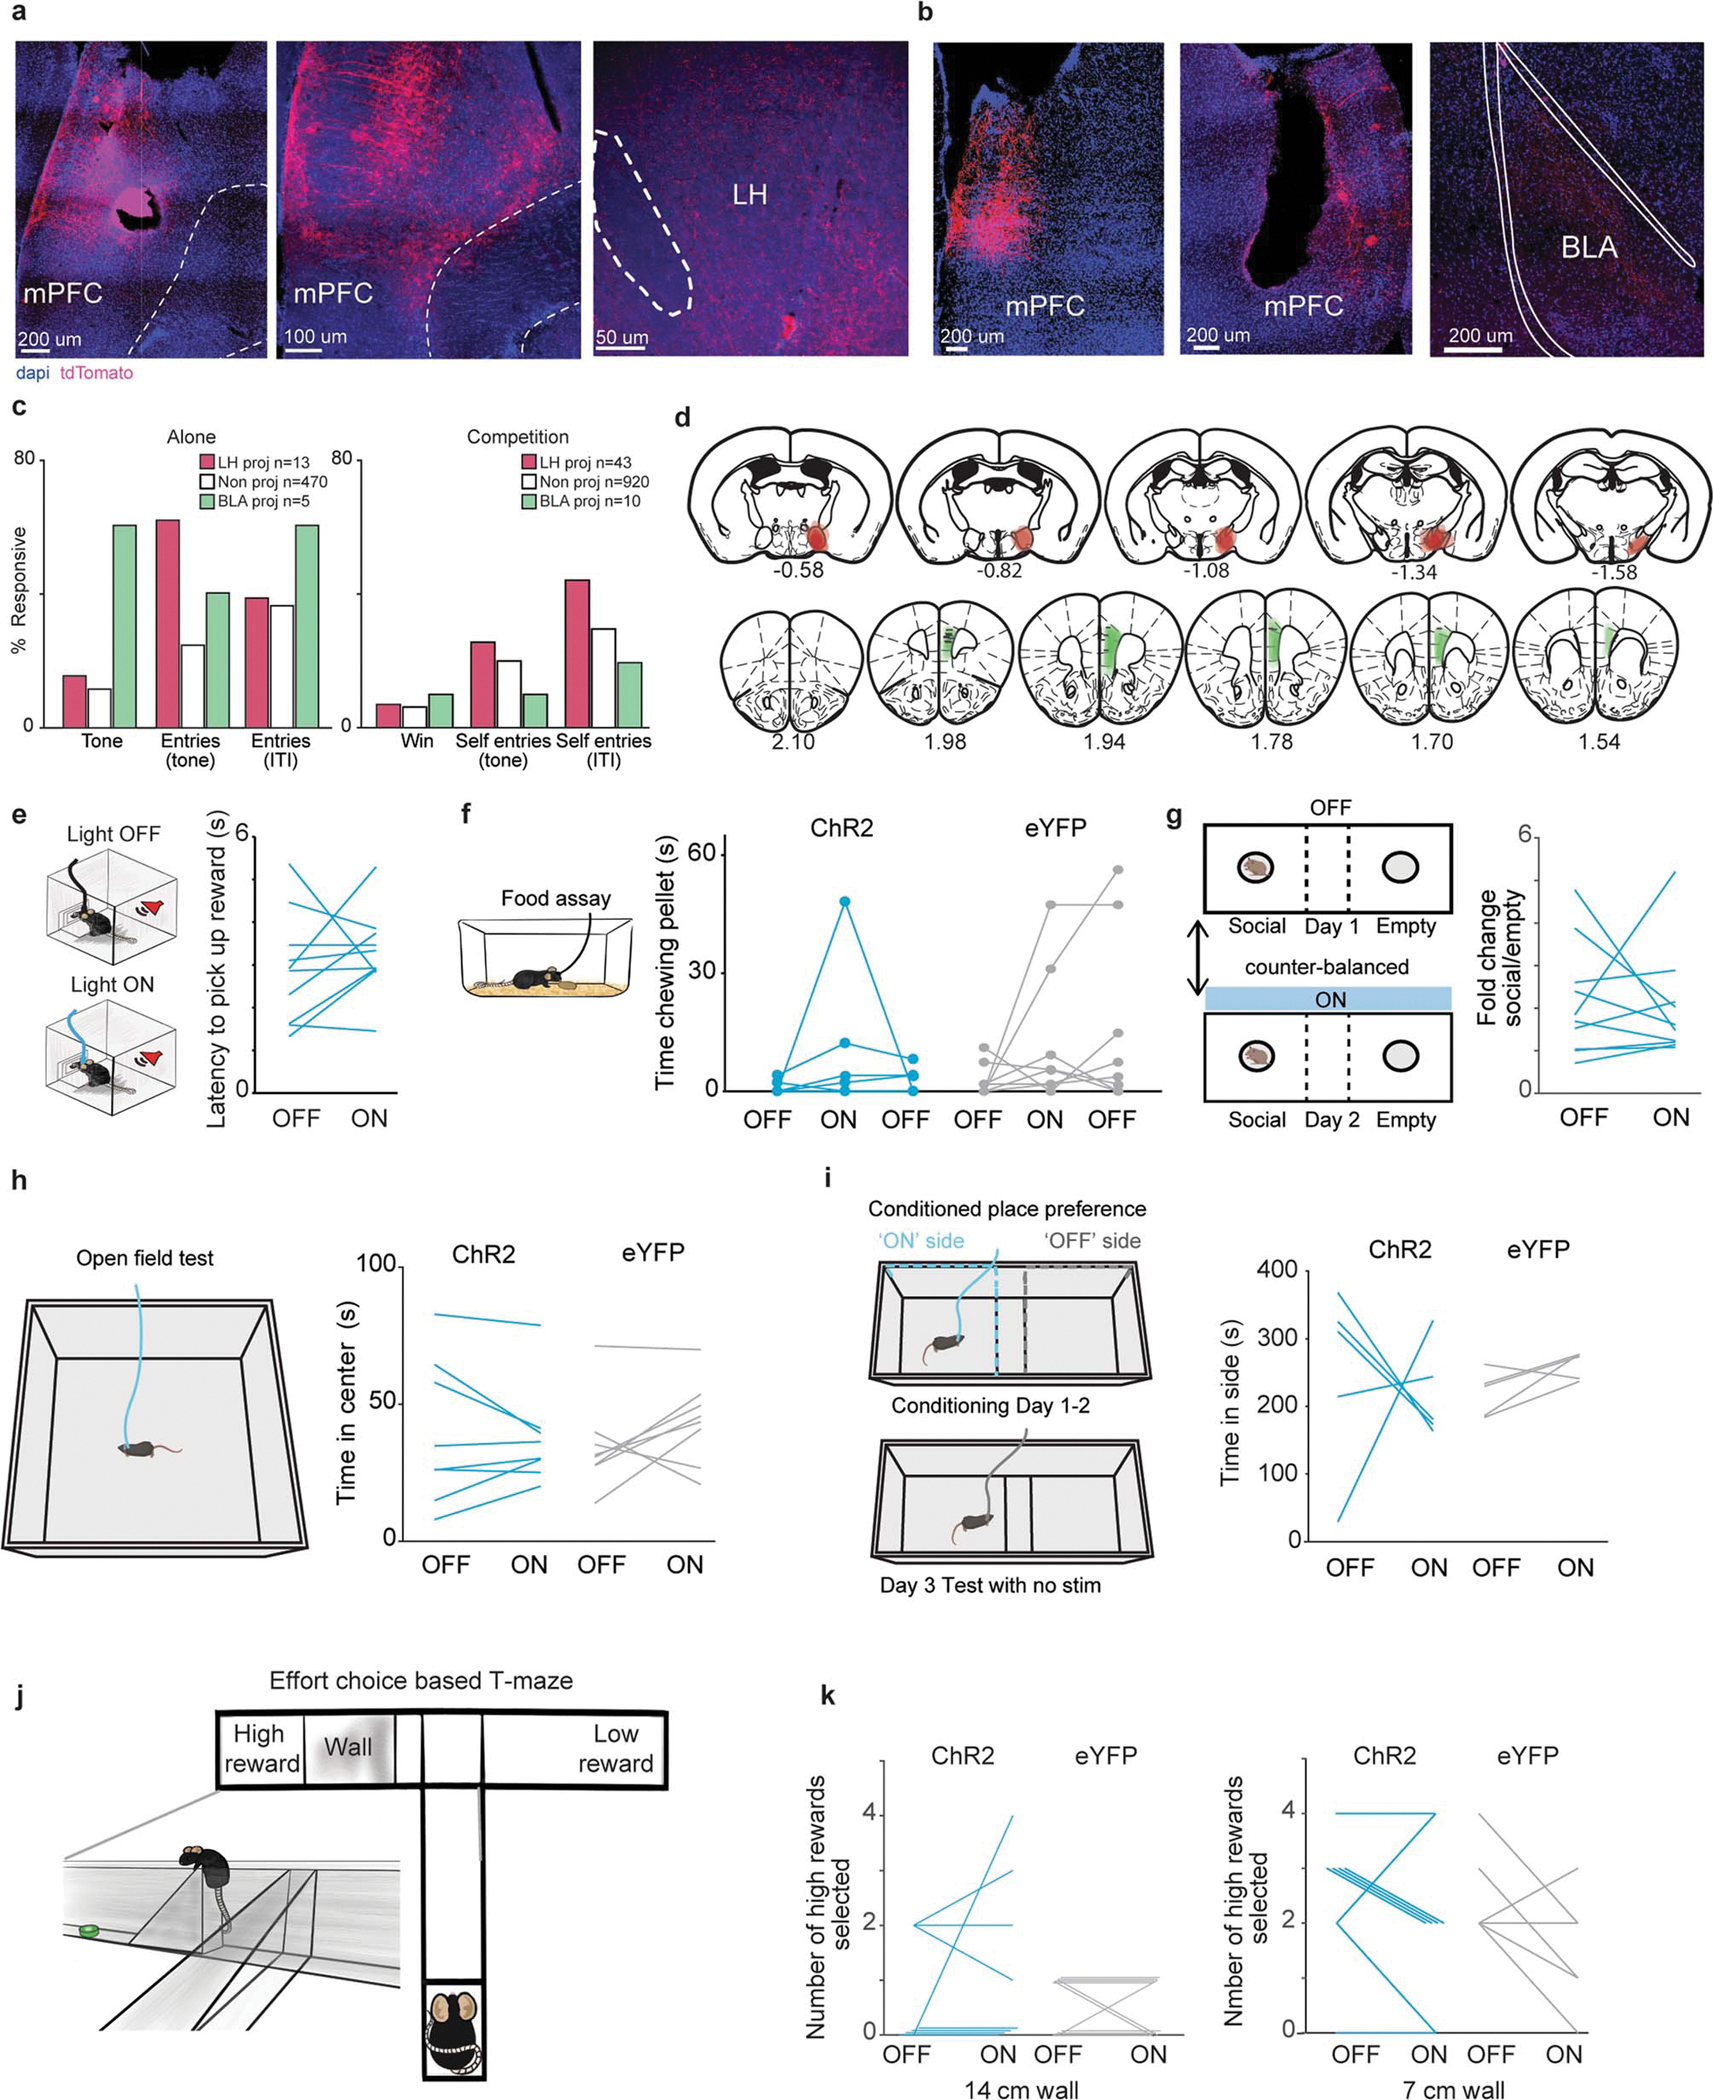
a, Representative images showing electrode lesions and mPFC-LH cells and LH axon terminals. b, Representative images showing electrode lesions and mPFC-BLA cells and BLA axon terminals. c, Responsive cells to tones and port entries while performing the reward task alone vs in social competition (alone: tone mPFC-LH n=2/13, mPFC-BLA n=3/5, non-phototagged n=54/470; entries during tone: mPFC-LH n=8/13, mPFC-BLA n=2/5, non-phototagged n=115/470; entries during ITI: mPFC-LH n=5/13, mPFC-BLA n=3/5, non-phototagged n=170/470; competition win trials: mPFC-LH n=3/43, mPFC-BLA n=1/10, non-phototagged n=62/920; self entries during tone mPFC-LH: n=11/43, mPFC-BLA n=1/10, non-phototagged n=193/920; self entries during ITI: mPFC-LH n=19/43, mPFC-BLA n=2/10, non-phototagged n=271/920, Fisher’s exact test non-photo vs LH p=0.011). d, Summary of mPFC optical fiber location (indicated with horizontal gray lines), mPFC viral expression and LH CAV2-Cre injection sites across mice for experiments shown below and in Figure 4. Distance to bregma is indicated under each brain slice. Top row shows LH injection and bottom row shows mPFC injection and fiber. e, mPFC-LH photostimulation in ChR2 mice did not change latency to pick reward while performing reward task alone (n=10; paired t-test, p=0.42). f, mPFC-LH photostimulation did not increase chow eating in the homecage (eYFP n=8, ChR2 n=7; 2-way RM ANOVA no significant effect of light, virus or interaction). g, mPFC-LH photostimulation in ChR2 mice did not change time spent in social chamber in the 3-chamber social interaction assay (n=10; paired t-test, p=0.79). h, mPFC-LH photostimulation did not change anxiety-like behavior in the open field (ChR2 n=8, eYFP n=8; 2-way repeated measures (RM) ANOVA no significant effect of light, virus or interaction). i, mPFC-LH photostimulation did not evoke conditioned placed preference or aversion (ChR2 n=5, eYFP n=5; 2-way RM ANOVA no significant effect of light, virus or interaction). j, Effort based T-maze allows mice to choose between a low reward low effort arm or a high reward high effort arm in which they must climb a wall to obtain the reward. k, mPFC-LH photostimulation did not increase high effort choice in the effort T-maze (ChR2 n=8, eYFP n=9; 2-way RM ANOVA no significant effect of light, virus or interaction for both 14 and 7 cm walls).
Supplementary Material
Acknowledgements:
We thank Craig Wildes, Radames Revilla Orellano, Sunny Luo and Crystal Chang for technical support. Adam Calhoun and Mala Murthy for useful feedback on our HMM-GLM model. We thank Ziv Williams and William Lee for comments on our manuscript. K.M.T. is an HHMI Investigator and the Wylie Vale Professor at the Salk Institute for Biological Studies, and this work was supported by funding from the JPB Foundation, Dolby Family Fund, R01-MH115920 (NIMH), and Pioneer Award DP1-AT009925 (NCCIH). N.P.C. was supported by the Simons Center for the Social Brain, Ford Foundation, L’Oreal For Women In Science, Burroughs Wellcome Fund and K99 MH124435–01. C.L was supported by AI Institute, SJTU, Shanghai Qi Zhi Institute, Meta Technology Group.
Footnotes
Competing interest statement:
The authors declare no competing interests.
Additional information:
Requests for additional information or materials should be made to K.M.T and C.L.
Code availability statement:
Code for AlphaTracker can be found here: https://tyelab.org/tools/ and code for the HMM-GLM model can be found here: https://github.com/Tyelab/HMMGLM
Data availability statement:
Data will be made available upon reasonable request to authors.
References:
- 1.Chiao JY Neural basis of social status hierarchy across species. Curr. Opin. Neurobiol. 20, 803–809 (2010). [DOI] [PubMed] [Google Scholar]
- 2.Wang F, Kessels HW & Hu H The mouse that roared: neural mechanisms of social hierarchy. Trends Neurosci. 37, 674–682 (2014). [DOI] [PubMed] [Google Scholar]
- 3.Bernstein IS Dominance: The baby and the bathwater. Behav. Brain Sci. 4, 419–457 (1981). [Google Scholar]
- 4.Dewsbury DA Dominance Rank, Copulatory Behavior, and Differential Reproduction. Q. Rev. Biol. 57, 135–159 (1982). [DOI] [PubMed] [Google Scholar]
- 5.Karamihalev S, Brivio E, Flachskamm C, Stoffel R, Schmidt MV & Chen A Social dominance mediates behavioral adaptation to chronic stress in a sex-specific manner. eLife 9, e58723 (2020). [DOI] [PMC free article] [PubMed] [Google Scholar]
- 6.Hou XH, Hyun M, Taranda J, Huang KW, Todd E, Feng D, Atwater E, Croney D, Zeidel ML, Osten P & Sabatini BL Central Control Circuit for Context-Dependent Micturition. Cell 167, 73–86.e12 (2016). [DOI] [PMC free article] [PubMed] [Google Scholar]
- 7.Zhou T, Zhu H, Fan Z, Wang F, Chen Y, Liang H, Yang Z, Zhang L, Lin L, Zhan Y, Wang Z & Hu H History of winning remodels thalamo-PFC circuit to reinforce social dominance. Science 357, 162–168 (2017). [DOI] [PubMed] [Google Scholar]
- 8.Wang F, Zhu J, Zhu H, Zhang Q, Lin Z & Hu H Bidirectional control of social hierarchy by synaptic efficacy in medial prefrontal cortex. Science 334, 693–697 (2011). [DOI] [PubMed] [Google Scholar]
- 9.So N, Franks B, Lim S & Curley JP A Social Network Approach Reveals Associations between Mouse Social Dominance and Brain Gene Expression. PLOS ONE 10, e0134509 (2015). [DOI] [PMC free article] [PubMed] [Google Scholar]
- 10.Zink CF, Tong Y, Chen Q, Bassett DS, Stein JL & Meyer-Lindenberg A Know your place: neural processing of social hierarchy in humans. Neuron 58, 273–283 (2008). [DOI] [PMC free article] [PubMed] [Google Scholar]
- 11.Ligneul R, Obeso I, Ruff CC & Dreher J-C Dynamical Representation of Dominance Relationships in the Human Rostromedial Prefrontal Cortex. Curr. Biol. 26, 3107–3115 (2016). [DOI] [PubMed] [Google Scholar]
- 12.Miller EK & Cohen JD An integrative theory of prefrontal cortex function. Annu. Rev. Neurosci. 24, 167–202 (2001). [DOI] [PubMed] [Google Scholar]
- 13.Murugan M, Jang HJ, Park M, Miller EM, Cox J, Taliaferro JP, Parker NF, Bhave V, Hur H, Liang Y, Nectow AR, Pillow JW & Witten IB Combined Social and Spatial Coding in a Descending Projection from the Prefrontal Cortex. Cell 171, 1663–1677.e16 (2017). [DOI] [PMC free article] [PubMed] [Google Scholar]
- 14.Levy DR, Tamir T, Kaufman M, Parabucki A, Weissbrod A, Schneidman E & Yizhar O Dynamics of social representation in the mouse prefrontal cortex. Nat. Neurosci. 22, 2013–2022 (2019). [DOI] [PubMed] [Google Scholar]
- 15.Lee CR, Chen A & Tye KM The neural circuitry of social homeostasis: Consequences of acute versus chronic social isolation. Cell 184, 1500–1516 (2021). [DOI] [PMC free article] [PubMed] [Google Scholar]
- 16.Rigotti M, Barak O, Warden MR, Wang X-J, Daw ND, Miller EK & Fusi S The importance of mixed selectivity in complex cognitive tasks. Nature 497, 585–590 (2013). [DOI] [PMC free article] [PubMed] [Google Scholar]
- 17.Escola S, Fontanini A, Katz D & Paninski L Hidden Markov models for the stimulus-response relationships of multistate neural systems. Neural Comput. 23, 1071–1132 (2011). [DOI] [PubMed] [Google Scholar]
- 18.Calhoun AJ, Pillow JW & Murthy M Unsupervised identification of the internal states that shape natural behavior. Nat. Neurosci. 22, 2040–2049 (2019). [DOI] [PMC free article] [PubMed] [Google Scholar]
- 19.Piva M, Velnoskey K, Jia R, Nair A, Levy I & Chang SW The dorsomedial prefrontal cortex computes task-invariant relative subjective value for self and other. eLife 8, e44939 (2019). [DOI] [PMC free article] [PubMed] [Google Scholar]
- 20.Dugatkin LA Winner and loser effects and the structure of dominance hierarchies. Behav. Ecol. 8, 583–587 (1997). [Google Scholar]
- 21.Nieh EH, Vander Weele CM, Matthews GA, Presbrey KN, Wichmann R, Leppla CA, Izadmehr EM & Tye KM Inhibitory Input from the Lateral Hypothalamus to the Ventral Tegmental Area Disinhibits Dopamine Neurons and Promotes Behavioral Activation. Neuron 90, 1286–1298 (2016). [DOI] [PMC free article] [PubMed] [Google Scholar]
- 22.Rangel MJ, Baldo MVC, Canteras NS & Hahn JD Evidence of a Role for the Lateral Hypothalamic Area Juxtadorsomedial Region (LHAjd) in Defensive Behaviors Associated with Social Defeat. Front. Syst. Neurosci. 10, 92 (2016). [DOI] [PMC free article] [PubMed] [Google Scholar]
- 23.Li Y, Zeng J, Zhang J, Yue C, Zhong W, Liu Z, Feng Q & Luo M Hypothalamic Circuits for Predation and Evasion. 20. [DOI] [PubMed] [Google Scholar]
- 24.Burton MJ, Rolls ET & Mora F Effects of hunger on the responses of neurons in the lateral hypothalamus to the sight and taste of food. Exp. Neurol. 51, 668–677 (1976). [DOI] [PubMed] [Google Scholar]
- 25.Cannon WB Organization for Physiological Homeostasis. Physiol. Rev. 9, 399–431 (1929). [Google Scholar]
- 26.Matthews GA & Tye KM Neural mechanisms of social homeostasis. Ann. N. Y. Acad. Sci. 1457, 5–25 (2019). [DOI] [PMC free article] [PubMed] [Google Scholar]
- 27.Munuera J, Rigotti M & Salzman CD Shared neural coding for social hierarchy and reward value in primate amygdala. Nat. Neurosci. 21, 415–423 (2018). [DOI] [PMC free article] [PubMed] [Google Scholar]
- 28.Allsop SA, Wichmann R, Mills F, Burgos-Robles A, Chang C-J, Felix-Ortiz AC, Vienne A, Beyeler A, Izadmehr EM, Glober G, Cum MI, Stergiadou J, Anandalingam KK, Farris K, Namburi P, Leppla CA, Weddington JC, Nieh EH, Smith AC, Ba D, Brown EN & Tye KM Corticoamygdala Transfer of Socially Derived Information Gates Observational Learning. Cell 173, 1329–1342.e18 (2018). [DOI] [PMC free article] [PubMed] [Google Scholar]
- 29.Felix-Ortiz AC, Burgos-Robles A, Bhagat ND, Leppla CA & Tye KM Bidirectional modulation of anxiety-related and social behaviors by amygdala projections to the medial prefrontal cortex. Neuroscience 321, 197–209 (2016). [DOI] [PMC free article] [PubMed] [Google Scholar]
- 30.Janak PH & Tye KM From circuits to behaviour in the amygdala. Nature 517, 284–292 (2015). [DOI] [PMC free article] [PubMed] [Google Scholar]
Associated Data
This section collects any data citations, data availability statements, or supplementary materials included in this article.
Supplementary Materials
Data Availability Statement
Data will be made available upon reasonable request to authors.


