Abstract
Pseudomonas aeruginosa (P. aeruginosa) is one of the common immortal pathogens that cause intense chronic infections in low-immunity patients, significantly evading the immune system and suppressing the respiratory system. This work reports on the synthesis of prominent members of the carbon family, carbon quantum dots (CQDs), from a natural carbon precursor, Citrus medica (C. medica) fruit, and their inhibiting property against P. aeruginosa. CQDs synthesized by the conventional hydrothermal method with an average particle size of 4.5 nm exhibit renowned antimicrobial properties. To enhance the properties of the CQDs, nitrogen was doped using ammonium hydroxide as a nitrogen source, and absorption and fluorescence studies and the elemental composition of CQDs were also reported. CQDs potentially inhibited the growth of bacteria at the lowest concentration level of 1.25% (v/v). Similarly, CQDs moderately inhibited biofilm formation at the concentration level of 0.07% (v/v) for both clinical and control strains of P. aeruginosa. A fluorescence microscopy study revealed that the treated strain shows a moderately reduced biofilm formation when compared to the control strain of P. aeruginosa PAO1.
1. Introduction
Many bacteria have evolved strong counteractions to most commercially available antibiotics during the past few decades. Antibiotic resistance has dramatically increased because of genetic mutation due to the use of high dosages of antibiotics combined with the transmission of bacteria from person to person, an issue that is worsening.1−3 Compared to the new antibiotics on the horizon, older antibiotics are less effective and may not be strong enough to combat all newly resistant germs. Much of today’s research is focused on generating new antimicrobial medications or agents, with one potential strategy based on materials science to remove such microorganisms.4,5 Nanomaterials, particularly those with a diameter of less than 10 nm of zero dimension, have the potential to enrich the antibacterial activities of currently available chemical agents.
Carbon nanomaterial less than 10 nm in diameter is known as carbon dots (CDs). Carbon quantum dots (CQDs) have become a massive appellation in nanomaterials, accidentally discovered during the separation of multiwalled carbon nanotubes (MWCNTs) under the influence of an electric field.6 On account of their excellent physical, chemical, structural, and optical properties, CQDs are used in various applications such as photocatalysts in wastewater treatment,7 electrode materials in supercapacitors,8 biosensors,9 live-cell imaging,10−12 toxic metal ion sensing,13 drug delivery,14 and optoelectronics.15 CQDs also exhibit antimicrobial activity and act as an anticancer agent.16 With the use of different carbon sources as precursors, CQDs are synthesized by a wide variety of methods such as hydrothermal,17 microwave,18 laser ablation,19 and chemical oxidation.20 Apart from the different techniques, the synthesis approach also plays a vital role. Instead of utilizing chemical compounds, the green synthesis approach provides the advantages of biocompatibility and low toxicity since it deals with the body’s fundamental building blocks for biological applications. Green synthesis of nanoparticles has grown in popularity in recent years because it is easy and cost-effective. Also, the nanoparticles created have high stability, reduced time consumption, and nontoxic byproducts; they are environmentally benign and can be readily scaled up for large-scale synthesis. Going green with a traditional hydrothermal method makes it more favorable in the development of nanostructures while using both top-down and bottom-up techniques. In the various fields where green synthesis has been active, such as sensing, fluorescent cell imaging, drug administration, and cancer theragnostic, this is accomplished by the fine-tuning of structural, optical, and morphological features to attain specific applications. CQDs have been prepared by natural precursors using juices from Phyllanthus acidus,9 lemons,8 and vegetables;21 leaves from Mexican mint;22 betel leaf;23 biowastes;24 and milk products.25 Many literature studies have reported that preparing carbon dots from fruit juice has the advantage of providing more hydroxyl groups. The surface of the CDs can be easily modified by doping the nitrogen, which enhances the fluorescence emission. Citrus family fruits are mostly acidic, containing high carboxyl groups and providing more yield than other fruits.
Our work shows the preparation of CDs using Citrus medica (C. medica) fruit juice as the main source of carbon precursors. To increase the surface functionality and luminescent property and to bring the pH value to neutral, ammonium hydroxide is used as a nitrogen precursor. C. medica fruit is readily available, is of low cost, and is available at a surplus in nature. The juice of the fruit is edible and has medicinal value in treating rheumatic pain. Here CQDs are synthesized by a facile, one-step hydrothermal method.
2. Results and Discussion
2.1. Characterization of CQDs
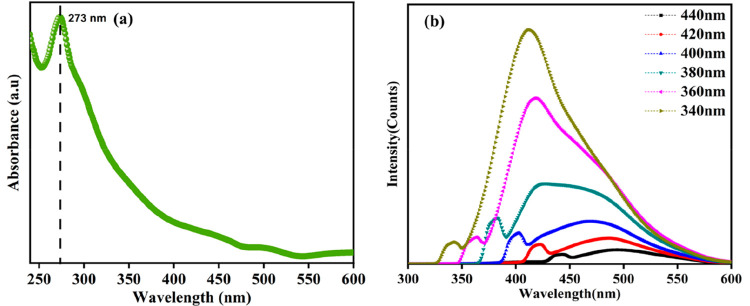
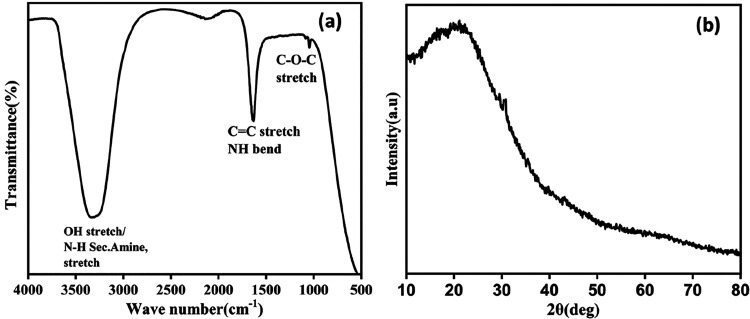
Synthesized CDs show fluorescence emission, which is purely dependent on excitation, and this was revealed by the characterization with UV–visible absorption and fluorescence spectroscopies shown in Figure 1. Figure 1a shows the absorption peak at 273 nm related to the π–π transition of C=C, and it extends because of the n−π* transition of C=O originating from the organic moieties and acids.26 A well-built emission spectrum was observed at different excitations ranging from 340 to 440 nm. Maximum fluorescence was achieved at 340 nm, and the corresponding maximum intensity occurs at a wavelength of 412 nm.27 The relative quantum yield of synthesized CQDs is 16.2%, and the calculation is reported in the Supporting Information.28 Variations in the emission spectra have clearly shown that the surface of the CDs has different functional groups, which was characterized and confirmed by Fourier transform infrared (FTIR) spectra. Figure 2a shows the surface functional groups present in the synthesized material. The broad peak at 3300 cm–1 represents the asymmetric stretching of hydroxyl and secondary amine groups.29 The narrow and sharp band at 1635 cm–1 reveals the bending vibration of amide and double bond stretching of carbon.30 A considerable peak at 1040 cm–1 confirms the presence of epoxy groups.31 FTIR results reveal the CQDs are hydrophilic, possessing more stability and good dispersibility in water due to the surface enriched functional groups. The XRD image of CQDs in Figure 2b confirms the presence of carbon particles of very small size; the broad peak around 20° declares there may be a chance that the CQDs have a graphitic nature.17 High resolution transmission electron microscopy (HRTEM) images truly confirm the formation of CQDs; the particle size ranges from 2 to 7 nm as shown in Figure 3a,b. The average particle size of the CQDs is 4.5 nm, and the selected area electron diffraction (SAED) pattern certifies the partially crystalline nature. The interplanar distance was calculated as 0.21 nm, which belongs to the (100) plane of graphite. This confirms the CQDs are graphitic in nature as shown in Figure 3c,d.32,33 X-ray diffraction (XRD) only detects long-range order, so the few nanometers diameter of the CQDs is insufficient to produce detectable X-ray diffraction confirmed by the HRTEM.
Figure 1.
(a) UV absorption spectra. (b) Emission spectra at various excitations in deionized water.
Figure 2.
(a) FTIR spectrum. (b) XRD pattern of CQDs.
Figure 3.
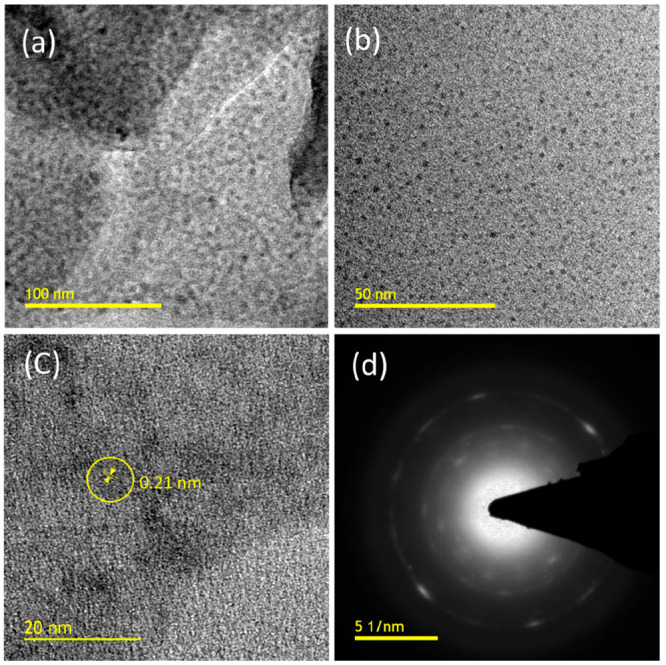
HRTEM images of CQDs at different magnifications: (a) 100, (b) 50, and (c) 20 nm. (d) SAED pattern.
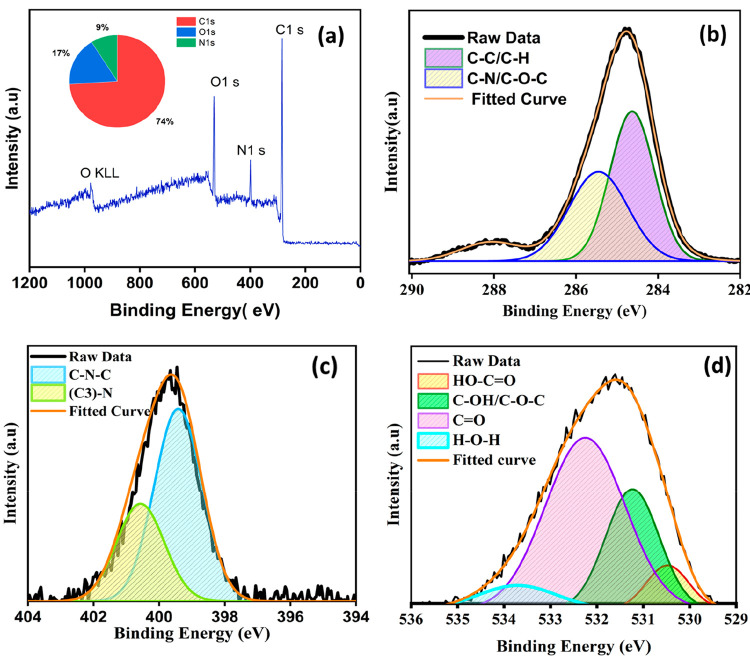
Figure 4 reveals the elemental composition of the carbon quantum dots with the doping of nonmetallic heteroatoms. The synthesized sample has an atomic proportion of 74.2% carbon, 17.3% oxygen, and 8.5% nitrogen, according to the X-ray photoelectron spectroscopy (XPS) spectra (shown as the inset in Figure 4a). This demonstrates that nitrogen was successfully incorporated into the CDs. According to the XPS spectra, C 1s has a peak at 285 eV, N 1s has a peak at 399 eV, and O 1s has a peak at 531 eV. The deconvolution of the spectra of the C 1s peak into three components with energies of 284.6, 285.4, and 288 eV, respectively, corresponds to the chemical environments C=C/C–N, C–OH, and C=O. The pyridinic nitrogen (C–N–C) and graphitic nitrogen ((C3)–N) have components at 399.3 and 400.5 eV, respectively, in the deconvoluted spectra of N 1s. HO—C=O has a peak at 530.4 eV, C–OH/C–O–C has a peak at 531.2 eV, C=O has a peak at 532.3 eV, and H–O–H has a peak at 533.7 eV in the spectra of O 1s.34−36 As a result of our XPS findings, the material CQDs have a high surface stability and are enriched with carbon, as well as a significant amount of nitrogen and oxygen. The fluorescence property is enhanced by heteroatom doping, making CQDs suitable for biological and biosensor applications. In the consideration of biological applications, it is preferable to understand the surface charge of the CQDs.
Figure 4.
XPS spectra: (a) full XPS spectrum; (b–d) deconvoluted (b) C 1s, (c) N 1s, and (d) O 1s spectra.
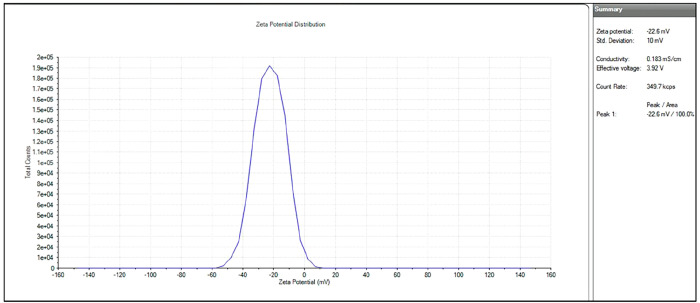
Zeta (ζ) potential characterization was performed to determine the attraction and repulsion between the particles and the surface electronic charge of the synthesized material. Because of the abundance of negatively charged hydroxyl groups, the CQDs have a negative surface potential of −22.6 mV as shown in Figure 5 and are extremely soluble in water. On the basis of the above findings, it is clear that they have good stability, have enriched surface functional groups, and are suitable for biological applications. On the basis of the fluorescence, the green synthesized, nitrogen doped zero-dimensional carbon quantum dots will be a useful element for antimicrobial and antibiofilm activities.
Figure 5.
Surface potential of nitrogen doped CQDs using a ζ potential analyzer.
Before proceeding with an application, it is prudent to assess the photostability of the fluorescent substance. As a result, the synthesized CQDs were exposed to 365 nm UV light continuously for 3 h, and the emission property was seen at 412 nm with 340 nm excitation at 15 min intervals. The normalized intensity fluctuates from 0.988 to 0.992, indicating reasonable stability. This emission spectrum is depicted in Figure S1 together with photographs. Therefore, the irradiation procedure was maintained for 24 h, and the intensity remained in the range specified in Figure S2.37
2.2. Antibacterial Activity of Carbon Dots against Pseudomonas aeruginosa
The inhibition of bacterial growth was evaluated by determining the minimum inhibitory concentration (MIC) against the clinical isolates of P. aeruginosa and the control strain of P. aeruginosa PAO1 using the broth microdilution method at concentrations ranging from 10 to 0.01% (v/v). The naturally derived CDs potentially inhibited the growth of the bacteria (control strain and clinical isolate of P. aeruginosa). As shown in Table ST1, the MIC of the naturally derived CDs was found to be 1.25% (v/v) for both clinical and control strains of P. aeruginosa. Clinical isolates of P. aeruginosa (SDC-01 and SDC-04) were highly resistant to all tested antibiotics, and the remaining clinical isolates of P. aeruginosa (SDC-02, SDC-03, and SDC-05) were sensitive to selected antibiotics (Table ST2). Further, the naturally derived CDs (sub-MIC concentration level) were screened for antibiofilm activity. At the sub-MIC concentrations, the CDs did not inhibit the growth of bacteria, but the naturally derived CDs moderately inhibited the biofilm production in a dose-dependent manner. A previous report suggested that pomegranate peel based CDs inhibited the growth of P. aeruginosa.31
2.3. Antibiofilm Activity and Fluorescence Microscopy
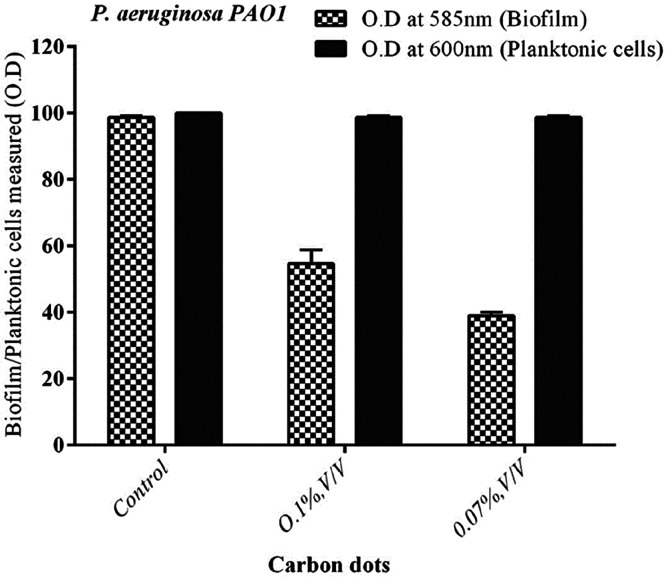
The naturally derived CDs inhibited P. aeruginosa biofilm at different concentration levels (Figure 6A). In quantification analysis, the control strain (without carbon dots) of P. aeruginosa produced biofilm (100%; Figure 6B). However, the CDs reduced the P. aeruginosa biofilm production (56 and 40%, respectively) at the lowest concentration levels of 0.1 and 0.07% (v/v), respectively (Figure 6B). Similarly, with the control strain of P. aeruginosa PAO1, biofilm was reduced moderately at the lowest concentration level (Figure 7). The effect of planktonic cell growth was quantified for both the treated and control strains of P. aeruginosa; there was no reduction (bacterial inhibition) at the 600 nm value of planktonic cells, which leads to the conclusion that the CDs did not inhibit bacterial growth in P. aeruginosa (Figure 6B). In a fluorescence microscopic study, a significant reduction in biofilm formation was observed in the naturally derived CD treated biofilm on the surface of a glass coverslip (Figure 8B). Similarly, the control (untreated strain) shows a group of aggregated bacterial cells on the surface of a glass coverslip (Figure 8A).
Figure 6.
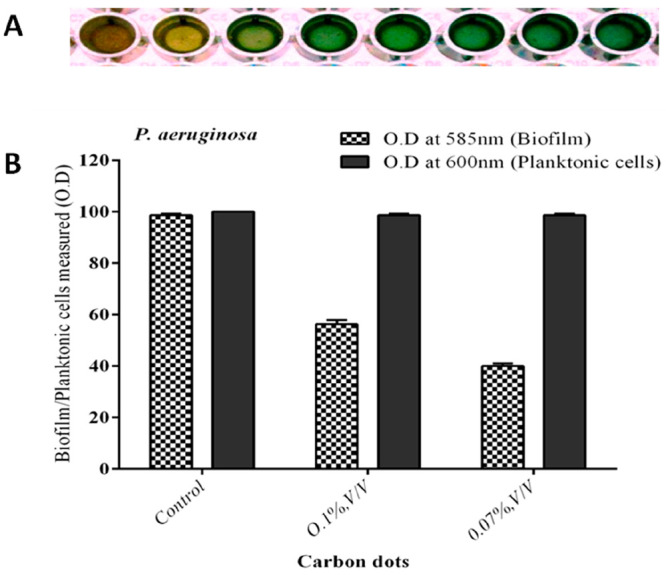
Biofilm inhibition assay and planktonic cell growth. (A) Carbon dots inhibited the biofilm at the lowest concentration level. (B) Inhibition of biofilm production in clinical isolate of P. aeruginosa.
Figure 7.
Inhibition of biofilm formation in P. aeruginosa PAO1. Percentage of inhibition of biofilm formation by P. aeruginosa by crystal violet staining assay.
Figure 8.
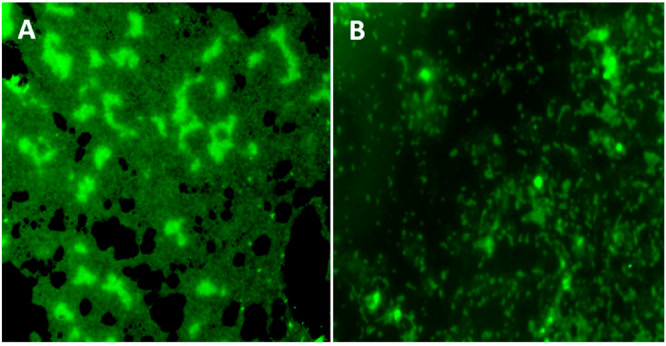
Biofilm formed by P. aeruginosa PAO1 observed through a fluorescence microscope. (A) A thick biofilm was observed in the untreated control. (B) Moderate reduction of biofilm formation in P. aeruginosa was observed under the fluorescence microscope.
3. Conclusion
CQDs are synthesized from C. medica juice by a one-pot hydrothermal method. Synthesized CQDs will be a promising new platform for microbial agents that are not only effective in reducing the threat of resistant microorganisms but also are benign and nontoxic. We have demonstrated the antimicrobial and antibiofilm sensing activities of CQDs against the antibiotic resistant clinical isolate of P. aeruginosa and the control strain of P. aeruginosa (PAO1), and we have found them to have potential antimicrobial and moderate antibiofilm activities at the very lowest concentration against the resistant clinical strains of P. aeruginosa. These findings suggest that the active functional groups on the surface of nitrogen doped CDs from C. medica fruit could be used as effective antimicrobial agents against P. aeruginosa clinical strains that are resistant to antibiotics.
4. Materials and Methods
4.1. Materials
Fresh C. medica fruit was collected from a local garden in Thiruvarur (Tamil Nadu, India). Ammonium hydroxide was purchased from Sigma-Aldrich.
4.2. Synthesis of CDs
The fresh juice of C. medica (without pulp) was taken, and nitrogen was doped until the pH reached neutral. Further, the mixture was sonicated for a few minutes and placed in a Teflon-coated autoclave for the hydrothermal process. The reactor was heated at 240 °C for 5 h. After the heating reaction, the material was allowed to cool to normal room temperature. The solution was centrifuged at 8000 rpm for 15 min, and the supernatant was filtered through a 0.22 μm membrane filter. The filtered content was stored in a refrigerator for further use.
4.3. Bacterial Strain and Culture Conditions
The P. aeruginosa PAO1 was gifted by Dr. Bushi Siddhardha, Pondicherry University, Puducherry, India. Clinical isolates of P. aeruginosa were procured from Theni Medical College and Hospitals, Theni, India. P. aeruginosa PAO1 and clinical isolates of P. aeruginosa were routinely cultured aerobically in Luria–Bertani (LB) broth, and the cultures were incubated at 30 °C for 24 h. The cultures were incubated at 37 °C for 24 h in a rotary shaker (100 rpm).
4.4. Characterization
4.4.1. Ultraviolet–Visible Absorption Spectroscopy
The compound’s UV absorption and transmittance spectra were recorded (wavelength 200–700 nm) with a UV–visible spectrophotometer (Cary-60, Agilent Technologies).
4.4.2. Photoluminescence Spectroscopy
The exact wavelength for emission between 300 and 700 nm was determined by luminescence spectroscopy (FP-8200, JASCO) with the same dilution as in UV spectroscopy.
4.4.3. ζ Potential Analyzer
The same liquid sample was used to investigate the surface electronic charge by using the dynamic light scattering property, which was carried out at 25 °C with a Zeta Sizer (Malvern PAN ANALYTICAL).
4.4.4. Powder X-ray Diffraction (PXRD)
The liquid sample was coated as a thin film by a drop-casting method to record diffraction spectra with a scan step size of 0.08 using monochromatized Cu Kα at 40 kV and a θ value ranging from 10 to 90° (PAN ANALYTICAL)
4.4.5. Fourier Transform Infrared Spectroscopy (FTIR)
To analyze the functional groups, the liquid sample was placed in the designated area and the spectra were recorded in transmission mode between 400 and 4000 cm–1 (PerkinElmer).
4.4.6. High-Resolution Transmission Electron Microscopy (HRTEM)
The CD liquid sample that had been dispersed in double distilled water (DDW) was dropped onto copper grids, and the water was allowed evaporate at room temperature. HRTEM images were captured at a voltage of 200 kV (TECNAI G2 F30 S-TWIN).
4.4.7. X-ray Photoelectron Spectroscopy (XPS)
The solution was dropped onto the copper grid, and XPS was performed with the nonmonochromatic Al Kα line as the primary excitation. The spectra were deconvoluted with the use of Casa XPS software (Thermo Scientific).
4.5. Antibiotic Susceptibility Test Assessed by Kirby–Bauer Method
Clinical isolates of P. aeruginosa and P. aeruginosa PAO1 were grown in nutrient broth (Himedia, India), and the tubes were incubated at 37 °C in an orbital shaker incubator. The optical density (OD) was adjusted to 0.5 McFarland standard. Each isolate was swabbed on Mueller–Hinton agar (MHA) plates (Himedia, India), and antibiotic disks (Himedia, India) were placed on the centers of the agar plates. The plates were incubated at 37 °C for 24 h. After incubation, the zone of inhibition was measured with the standard scale (Himedia, India) and the results were analyzed by standard deviation.
4.6. Agar Diffusion Method
A 24 h old culture of P. aeruginosa PAO1 was subcultured in nutrient broth (NB) and incubated at 37 °C for 24 h in a nutrient broth with a turbidity of 0.5 adjusted with a spectrophotometer. MHA plates were prepared, and the bacterial culture was swabbed on the surface of the MHA. The wells were made with a sterilized cork borer. A different concentration of CD solution was loaded into each well, and the plates were incubated at 37 °C for 24 h. The zone of inhibition that developed around the wells in all the plates was examined.
4.7. Minimum Inhibitory Concentration (MIC)
A tube dilution method was adopted to understand the MIC of the potent P. aeruginosa PAO1. CD solution was diluted in 10% DMSO to obtain various concentrations ranging from 5 to 100 μL of test solutions. Inoculation of 0.05 mL of bacterial culture was done by the addition of 5 mL of sterile Mueller–Hinton broth. To all the test tubes 1 mL of carbon dot PP solution was added and incubated for 24 h in order to observe any development of turbidity. The minimal concentration that could inhibit complete growth was considered to be the MIC.
4.8. Crystal Violet Staining of Biofilm Assay
We performed the crystal violet staining biofilm assay described by Venkatramanan et al.38
4.9. Fluorescence Microscopy
P. aeruginosa was grown in LB for 18 h at 37 °C in a shaker incubator. An 18 mm glass coverslip was kept in a sterile Petri dish. The desired concentration of CDs (% v/v) was mixed with LB broth and poured into the clean Petri dish containing a coverslip. A control plate without CDs was included. The overnight bacterial culture was loaded into a Petri dish, and the plates were incubated at 37 °C for 24 h. After 24 h of incubation, the coverslip was carefully removed from the broth and washed with sterile distilled water. Further, the coverslip was air-dried and stained with 0.1% acridine orange for 2.5 min. The biofilm formation on the test and control coverslip was observed under a fluorescence microscope (excitation at 490 nm; emission at 525 nm).
Acknowledgments
The authors are very thankful to the Central University of Tamil Nadu, India, and Saveetha Dental College and Hospital, Saveetha Institute of Medical and Technical Sciences (SIMATS), for providing an infrastructural and institutional research facility for this project. The authors would also like to express their gratitude to Universiti Kebangsaan Malaysia Incentive Grant (GP-2021-K023395).
Glossary
Abbreviations
- CDs
carbon dots
- CQDs
carbon quantum dots
- HRTEM
high resolution transmission electron microscopy
- LB
Luria–Bertani broth
- NB
nutrient broth
- PL
photoluminescence
- PXRD
powder X-ray diffraction
- SAED
selected area diffraction pattern
- UV
ultraviolet
- XPS
X-ray photoelectron spectroscopy
Supporting Information Available
The Supporting Information is available free of charge at https://pubs.acs.org/doi/10.1021/acsomega.2c03465.
Minimum inhibitory concentration of naturally derived carbon dots against clinical isolates of P. aeruginosa and control strain of P. aeruginosa PAO1; antibiogram pattern of P. aeruginosa; photostability of CQDs; measurement of fluorescent quantum yield (PDF)
Author Contributions
Conceptualization, literature survey, formal analysis, software, and writing—original draft were performed by Nithya Selvaraju. Conceptualization, investigations, funding acquisition, data analysis, writing—review and editing, were executed by Pitchaipillai Sankar Ganesh. Data curation, validation, and project administration were done by Veeramurali Palrasu. Resources, supervision, and funding acquisition were performed by Gunasekaran Venugopal. Data validation, review and editing, and funding acquisition were done by Vanitha Mariappan.
The authors declare no competing financial interest.
Notes
The data sets generated during and/or analyzed during the current study are not publicly available because we are working on other applications, but they are available from the corresponding author on reasonable request.
Supplementary Material
References
- Andersson D. I.; Hughes D. Antibiotic Resistance and Its Cost: Is It Possible to Reverse Resistance?. Nat. Rev. Microbiol. 2010, 8, 260–271. 10.1038/nrmicro2319. [DOI] [PubMed] [Google Scholar]
- Rizzello L.; Pompa P. P. Nanosilver-Based Antibacterial Drugs and Devices: Mechanisms, Methodological Drawbacks, and Guidelines. Chem. Soc. Rev. 2014, 43, 1501–1518. 10.1039/C3CS60218D. [DOI] [PubMed] [Google Scholar]
- Blecher K.; Nasir A.; Friedman A. The Growing Role of Nanotechnology in Combating Infectious Disease. Virulence 2011, 2, 395–401. 10.4161/viru.2.5.17035. [DOI] [PubMed] [Google Scholar]
- Perelshtein I.; Lipovsky A.; Perkas N.; Gedanken A.; Moschini E.; Mantecca P. The Influence of the Crystalline Nature of Nano-Metal Oxides on Their Antibacterial and Toxicity Properties. Nano Res. 2015, 8 (2), 695–707. 10.1007/s12274-014-0553-5. [DOI] [Google Scholar]
- Malka E.; Perelshtein I.; Lipovsky A.; Shalom Y.; Naparstek L.; Perkas N.; Patick T.; Lubart R.; Nitzan Y.; Banin E.; Gedanken A. Eradication of Multi-Drug Resistant Bacteria by a Novel Zn-Doped CuO Nanocomposite. Small 2013, 9 (23), 4069–4076. 10.1002/smll.201301081. [DOI] [PubMed] [Google Scholar]
- Thakur M.; Pandey S.; Mewada A.; Patil V.; Khade M.; Goshi E.; Sharon M. Antibiotic Conjugated Fluorescent Carbon Dots as a Theranostic Agent for Controlled Drug Release, Bioimaging, and Enhanced Antimicrobial Activity. J. Drug Delivery 2014, 2014, 282193. 10.1155/2014/282193. [DOI] [PMC free article] [PubMed] [Google Scholar]
- Zhang H.; Ming H.; Lian S.; Huang H.; Li H.; Zhang L.; Liu Y.; Kang Z.; Lee S. T. Fe2O3/Carbon Quantum Dots Complex Photocatalysts and Their Enhanced Photocatalytic Activity under Visible Light. Dalt. Trans. 2011, 40 (41), 10822–10825. 10.1039/c1dt11147g. [DOI] [PubMed] [Google Scholar]
- Sahoo S.; Satpati A. K.; Sahoo P. K.; Naik P. D. Incorporation of Carbon Quantum Dots for Improvement of Supercapacitor Performance of Nickel Sulfide. ACS Omega 2018, 3 (12), 17936–17946. 10.1021/acsomega.8b01238. [DOI] [PMC free article] [PubMed] [Google Scholar]
- Atchudan R.; Edison T. N. J. I.; Aseer K. R.; Perumal S.; Karthik N.; Lee Y. R. Highly Fluorescent Nitrogen-Doped Carbon Dots Derived from Phyllanthus Acidus Utilized as a Fluorescent Probe for Label-Free Selective Detection of Fe3+ Ions, Live Cell Imaging and Fluorescent Ink. Biosens. Bioelectron. 2018, 99, 303–311. 10.1016/j.bios.2017.07.076. [DOI] [PubMed] [Google Scholar]
- Du F.; Li J.; Hua Y.; Zhang M.; Zhou Z.; Yuan J.; Wang J.; Peng W.; Zhang L.; Xia S.; Wang D.; Yang S.; Xu W.; Gong A.; Shao Q. Multicolor Nitrogen-Doped Carbon Dots for Live Cell Imaging. J. Biomed. Nanotechnol. 2015, 11 (5), 780–788. 10.1166/jbn.2015.2008. [DOI] [PubMed] [Google Scholar]
- Kailasa S. K.; Ha S.; Baek S. H.; Phan L. M. T.; Kim S.; Kwak K.; Park T. J. Tuning of Carbon Dots Emission Color for Sensing of Fe3+ Ion and Bioimaging Applications. Mater. Sci. Eng., C 2019, 98, 834–842. 10.1016/j.msec.2019.01.002. [DOI] [PubMed] [Google Scholar]
- Kailasa S. K.; Koduru J. R. Perspectives of Magnetic Nature Carbon Dots in Analytical Chemistry: From Separation to Detection and Bioimaging. Trends Environ. Anal. Chem. 2022, 33, e00153 10.1016/j.teac.2021.e00153. [DOI] [Google Scholar]
- Yahaya Pudza M.; Zainal Abidin Z.; Abdul Rashid S.; Md Yasin F.; Noor A. S. M.; Issa M. A. Eco-Friendly Sustainable Fluorescent Carbon Dots for the Adsorption of Heavy Metal Ions in Aqueous Environment. Nanomaterials 2020, 10 (2), 315. 10.3390/nano10020315. [DOI] [PMC free article] [PubMed] [Google Scholar]
- Kumar V. B.; Natan M.; Jacobi G.; Porat Z.; Banin E.; Gedanken A. Ga@c-Dots as an Antibacterial Agent for the Eradication of Pseudomonas Aeruginosa. Int. J. Nanomed. 2017, 12, 725–730. 10.2147/IJN.S116150. [DOI] [PMC free article] [PubMed] [Google Scholar]
- Yuan T.; Meng T.; He P.; Shi Y.; Li Y.; Li X.; Fan L.; Yang S. Carbon Quantum Dots: An Emerging Material for Optoelectronic Applications. J. Mater. Chem. C 2019, 7, 6820–6835. 10.1039/C9TC01730E. [DOI] [Google Scholar]
- Boobalan T.; Sethupathi M.; Sengottuvelan N.; Kumar P.; et al. Mushroom-Derived Carbon Dots for Toxic Metal Ion Detection and as Antibacterial and Anticancer Agents Polycyclic Aromatic Hydrocarbons (PAHs) Biodegradation: Role of Lignolytic Enzymes View Project.. ACS Appl. Nano Mater. 2020, 3, 5910–5919. 10.1021/acsanm.0c01058. [DOI] [Google Scholar]
- Li J.; Ma S.; Xiao X.; Zhao D. The One-Step Preparation of Green-Emissioned Carbon Dots through Hydrothermal Route and Its Application. J. Nanomater. 2019, 2019, 8628354. 10.1155/2019/8628354. [DOI] [Google Scholar]
- Edison T. N. J. I.; Atchudan R.; Sethuraman M. G.; Shim J. J.; Lee Y. R. Microwave Assisted Green Synthesis of Fluorescent N-Doped Carbon Dots: Cytotoxicity and Bio-Imaging Applications. J. Photochem. Photobiol. B Biol. 2016, 161, 154–161. 10.1016/j.jphotobiol.2016.05.017. [DOI] [PubMed] [Google Scholar]
- Cui L.; Ren X.; Wang J.; Sun M. Synthesis of Homogeneous Carbon Quantum Dots by Ultrafast Dual-Beam Pulsed Laser Ablation for Bioimaging. Mater. Today Nano 2020, 12, 100091. 10.1016/j.mtnano.2020.100091. [DOI] [Google Scholar]
- Zhou J.; Booker C.; Li R.; Zhou X.; Sham T. K.; Sun X.; Ding Z. An Electrochemical Avenue to Blue Luminescent Nanocrystals from Multiwalled Carbon Nanotubes (MWCNTs). J. Am. Chem. Soc. 2007, 129 (4), 744–745. 10.1021/ja0669070. [DOI] [PubMed] [Google Scholar]
- Nair A.; Haponiuk J. T.; Thomas S.; Gopi S. Natural Carbon-Based Quantum Dots and Their Applications in Drug Delivery: A Review. Biomed. Pharmacother. 2020, 132, 110834. 10.1016/j.biopha.2020.110834. [DOI] [PMC free article] [PubMed] [Google Scholar]
- Architha N.; Ragupathi M.; Shobana C.; Selvankumar T.; Kumar P.; Lee Y. S.; Selvan R. K. Microwave-Assisted Green Synthesis of Fluorescent Carbon Quantum Dots from Mexican Mint Extract for Fe3+ Detection and Bio-Imaging Applications. Environ. Res. 2021, 199, 111263. 10.1016/j.envres.2021.111263. [DOI] [PubMed] [Google Scholar]
- Atchudan R.; Edison T. N. J. I.; Perumal S.; Vinodh R.; Lee Y. R. Betel-Derived Nitrogen-Doped Multicolor Carbon Dots for Environmental and Biological Applications. J. Mol. Liq. 2019, 296, 111817. 10.1016/j.molliq.2019.111817. [DOI] [Google Scholar]
- de Yro P. N. A.; Quaichon G. M. O.; Cruz R. A. T.; Emolaga C. S.; Que M. C. O.; Magdaluyo E. R. Jr.; Basilia B. A. Hydrothermal Synthesis of Carbon Quantum Dots from Biowaste for Bio-Imaging. AIP Conf. Proc. 2019, 2083, 020007. 10.1063/1.5094310. [DOI] [Google Scholar]
- Wang D.; Zhu L.; McCleese C.; Burda C.; Chen J. F.; Dai L. Fluorescent Carbon Dots from Milk by Microwave Cooking. RSC Adv. 2016, 6 (47), 41516–41521. 10.1039/C6RA06120F. [DOI] [Google Scholar]
- Li J.; Tang K.; Yu J.; Wang H.; Tu M.; Wang X. Nitrogen and Chlorine Co-Doped Carbon Dots as Probe for Sensing and Imaging in Biological Samples. R. Soc. Open Sci. 2019, 6, 181557. 10.1098/rsos.181557. [DOI] [PMC free article] [PubMed] [Google Scholar]
- Atchudan R.; Edison T. N. J. I.; Perumal S.; Muthuchamy N.; Lee Y. R. Hydrophilic Nitrogen-Doped Carbon Dots from Biowaste Using Dwarf Banana Peel for Environmental and Biological Applications. Fuel 2020, 275, 117821. 10.1016/j.fuel.2020.117821. [DOI] [Google Scholar]
- Atchudan R.; Edison T. N. J. I.; Sethuraman M. G.; Lee Y. R. Efficient Synthesis of Highly Fluorescent Nitrogen-Doped Carbon Dots for Cell Imaging Using Unripe Fruit Extract of Prunus Mume. Appl. Surf. Sci. 2016, 384, 432–441. 10.1016/j.apsusc.2016.05.054. [DOI] [Google Scholar]
- Krishnaiah P.; Atchudan R.; Perumal S.; Salama E. S.; Lee Y. R.; Jeon B. H. Utilization of Waste Biomass of Poa Pratensis for Green Synthesis of N-Doped Carbon Dots and Its Application in Detection of Mn2+ and Fe3+. Chemosphere 2022, 286, 131764. 10.1016/j.chemosphere.2021.131764. [DOI] [PubMed] [Google Scholar]
- Das T.; Saikia B. K.; Dekaboruah H. P.; Bordoloi M.; Neog D.; Bora J. J.; Lahkar J.; Narzary B.; Roy S.; Ramaiah D. Blue-Fluorescent and Biocompatible Carbon Dots Derived from Abundant Low-Quality Coals. J. Photochem. Photobiol. B Biol. 2019, 195, 1–11. 10.1016/j.jphotobiol.2019.04.004. [DOI] [PubMed] [Google Scholar]
- Khan W. U.; Wang D.; Zhang W.; Tang Z.; Ma X.; Ding X.; Du S.; Wang Y. High Quantum Yield Green-Emitting Carbon Dots for Fe(III) Detection, Biocompatible Fluorescent Ink and Cellular Imaging. Sci. Rep. 2017, 7 (1), 1–9. 10.1038/s41598-017-15054-9. [DOI] [PMC free article] [PubMed] [Google Scholar]
- Ding H.; Cheng L. W.; Ma Y. Y.; Kong J. L.; Xiong H. M. Luminescent Carbon Quantum Dots and Their Application in Cell Imaging. New J. Chem. 2013, 37 (8), 2515–2520. 10.1039/c3nj00366c. [DOI] [Google Scholar]
- Bajpai S. K.; D’Souza A.; Suhail B. Blue Light-Emitting Carbon Dots (CDs) from a Milk Protein and Their Interaction with Spinacia oleracea Leaf Cells. Int. Nano Lett. 2019, 9 (3), 203–212. 10.1007/s40089-019-0271-9. [DOI] [Google Scholar]
- Dager A.; Uchida T.; Maekawa T.; Tachibana M. Synthesis and Characterization of Mono-Disperse Carbon Quantum Dots from Fennel Seeds: Photoluminescence Analysis Using Machine Learning. Sci. Rep. 2019, 9, 14004. 10.1038/s41598-019-50397-5. [DOI] [PMC free article] [PubMed] [Google Scholar]
- Guan Q.; Su R.; Zhang M.; Li W.; Wang D.; Xu M.; Fei L.; Xu Q.; Zhang R. Highly fluorescent dual-emission red carbon dots and their applications in optoelectronic devices and water detection. New J. Chem. 2019, 43, 3050–3058. 10.1039/C8NJ06074F. [DOI] [Google Scholar]
- Niu Q.; Gao K.; Lin Z.; Wu W. Amine-capped carbon dots as a nanosensor for sensitive and selective detection of picric acid in aqueous solution via electrostatic interaction. Anal. Methods 2013, 5, 6228–6233. 10.1039/c3ay41275j. [DOI] [Google Scholar]
- Guo Y.; Zhang L.; Cao F.; Leng Y. Thermal Treatment of Hair for the Synthesis of Sustainable Carbon Quantum Dots and the Applications for Sensing Hg2+. Sci. Rep. 2016, 6, 35795. 10.1038/srep35795. [DOI] [PMC free article] [PubMed] [Google Scholar]
- Venkatramanan M.; Ganesh P. S.; Senthil R.; Akshay J.; Veera Ravi A.; Langeswaran K.; Vadivelu J.; Nagarajan S.; Rajendran K.; Shankar E. M. Inhibition of Quorum Sensing and Biofilm Formation in Chromobacterium violaceum by Fruit Extracts of Passiflora edulis. ACS Omega 2020, 5 (40), 25605–25616. 10.1021/acsomega.0c02483. [DOI] [PMC free article] [PubMed] [Google Scholar]
Associated Data
This section collects any data citations, data availability statements, or supplementary materials included in this article.


