SUMMARY
Diffuse large B-cell lymphoma (DLBCL) is the most common B-cell non-Hodgkin lymphoma and remains incurable in ~40% of patients. Coding-genome sequencing efforts identified several genes/pathways altered in this disease, including new potential therapeutic targets1–5. However, the non-coding genome of DLBCL remains largely unexplored. Here we show that active super-enhancers (SEs) are highly and specifically hypermutated in 92% of DLBCL samples, display signatures of activation-induced cytidine deaminase (AID) activity, and are linked to genes encoding B-cell developmental regulators and oncogenes. As evidence of oncogenic relevance, we show that the hypermutated SEs linked to the BCL6, BCL2, and CXCR4 proto-oncogenes prevent the binding and transcriptional downregulation of the corresponding target gene by transcriptional repressors, including BLIMP1 (BCL6) and the steroid-receptor NR3C1 (BCL2 and CXCR4). Genetic correction of selected mutations restored repressor DNA-binding, downregulated target gene expression, and led to the counter-selection of cells harboring corrected alleles, indicating oncogenic dependency on the SE mutations. This pervasive SE mutational mechanism reveals a novel major set of genetic lesions deregulating gene expression, which expands the involvement of known oncogenes in DLBCL pathogenesis and identifies new deregulated gene targets of therapeutic relevance.
INTRODUCTION
Diffuse large B-cell lymphoma (DLBCL), the most common B-cell non-Hodgkin lymphoma, remains a significant clinical challenge, as ~ 40% of patients are not cured by available immuno-chemotherapeutic regimens6. Gene-expression profiling has identified two major subgroups of DLBCL, reflecting their derivation from different stages of B-cell physiology: the germinal-center B-cell-like (GCB)-DLBCL, and the prognostically less favorable activated B-cell-like (ABC)-DLBCL, with approximately 20% of cases remaining unclassified7,8. These subtypes are associated with distinct genetic lesions1,2,9,10 and differential response to chemotherapy6,11, indicating the involvement of separate oncogenic pathways. Further refinement to the DLBCL classification was provided by the identification of several genetic subgroups based on the presence of co-occurring genetic alterations4,5,12,13. While the association of individual DLBCL subtypes with clinical outcome suggests the clinical relevance of this new taxonomy, not all patients can be classified, and these schema are based on the analysis of coding regions, which represent only 2–3% of the genome. Thus, further genetic complexity of pathogenetic relevance may reside in the non-coding regulatory portion of the genome.
Emerging evidence indicates that non-coding regions, particularly those involved in transcriptional regulation, can be recurrently mutated, leading to functional consequences that contribute to tumorigenesis14–16. In DLBCL, the 3’ untranslated region of the NFKBIZ gene was recently identified as a recurrent mechanism of oncogene deregulation and NF-κB activation in ABC-DLBCL10. Moreover, >50% of DLBCL cases display evidence of aberrant somatic hypermutation (ASHM) in the 5’ sequences of actively transcribed genes as the result of the abnormal activity of activation-induced cytidine deaminase (AID) 17, the enzyme responsible for somatic hypermutation of the immunoglobulin (IG) variable region genes during the germinal center (GC) reaction18. More recent evidence indicated that noncoding regions, including super-enhancers (SEs), may be subjected to mutational activity in DLBCL9,19–21. Despite these initial observations, the extent of such mutational activity, its targets, and its potential functional consequences remain largely unexplored.
Here we investigated genome-wide whether active enhancers (Es) and SEs are affected by functionally relevant recurrent mutations in DLBCL. The results reveal active SEs as the major target of a pervasive AID-mediated hyper-mutagenesis in the majority of these tumors. We identify highly recurrent hotspots linked to important transcriptional regulators and/or proto-oncogenes involved in GC biology and malignant transformation. As a proof of concept for the functional and pathologic relevance of SE hypermutation, we show that specific recurrent SE mutations linked to proto-oncogenes lead to their escape from transcriptional regulation, and are necessary for the maintenance of the transformed phenotype.
RESULTS
Active SEs are hypermutated in DLBCL
We first performed a genome-wide identification of active E/SEs by chromatin immunoprecipitation and sequencing (ChIP-seq) analysis of H3K27Ac in 29 cell lines representative of the major DLBCL cell-of-origin (COO) subtypes (20 GCB-DLBCL and 9 ABC-DLBCL) and in two independent pools of normal GC B cells purified from human tonsils, using the ROSE algorithm22 (Extended Data Fig. 1 and Methods). We identified a total of 35,697 classic Es and 3,775 SEs, of which ~97% were also detected in primary DLBCL cases23. Their histone modification pattern (H3K4me1+H3K4me3-H3K27me3-) (Extended Data Figs. 2,3) and significant transcriptional activity on ribosomal-depleted RNA-seq, including divergent transcription24,25 (Extended Data Fig. 4) confirmed they are active E/SEs. Unsupervised hierarchical clustering of H3K27Ac data from the 29 DLBCL cell lines, based on the 3,775 active SEs, recapitulates in part the original COO classification by separating GCB- from ABC-DLBCL (Fig. 1a). These data indicate that E/SE activity reflects the phenotypic heterogeneity of these tumors.
Figure 1: SEs are hypermutated in DLBCL.
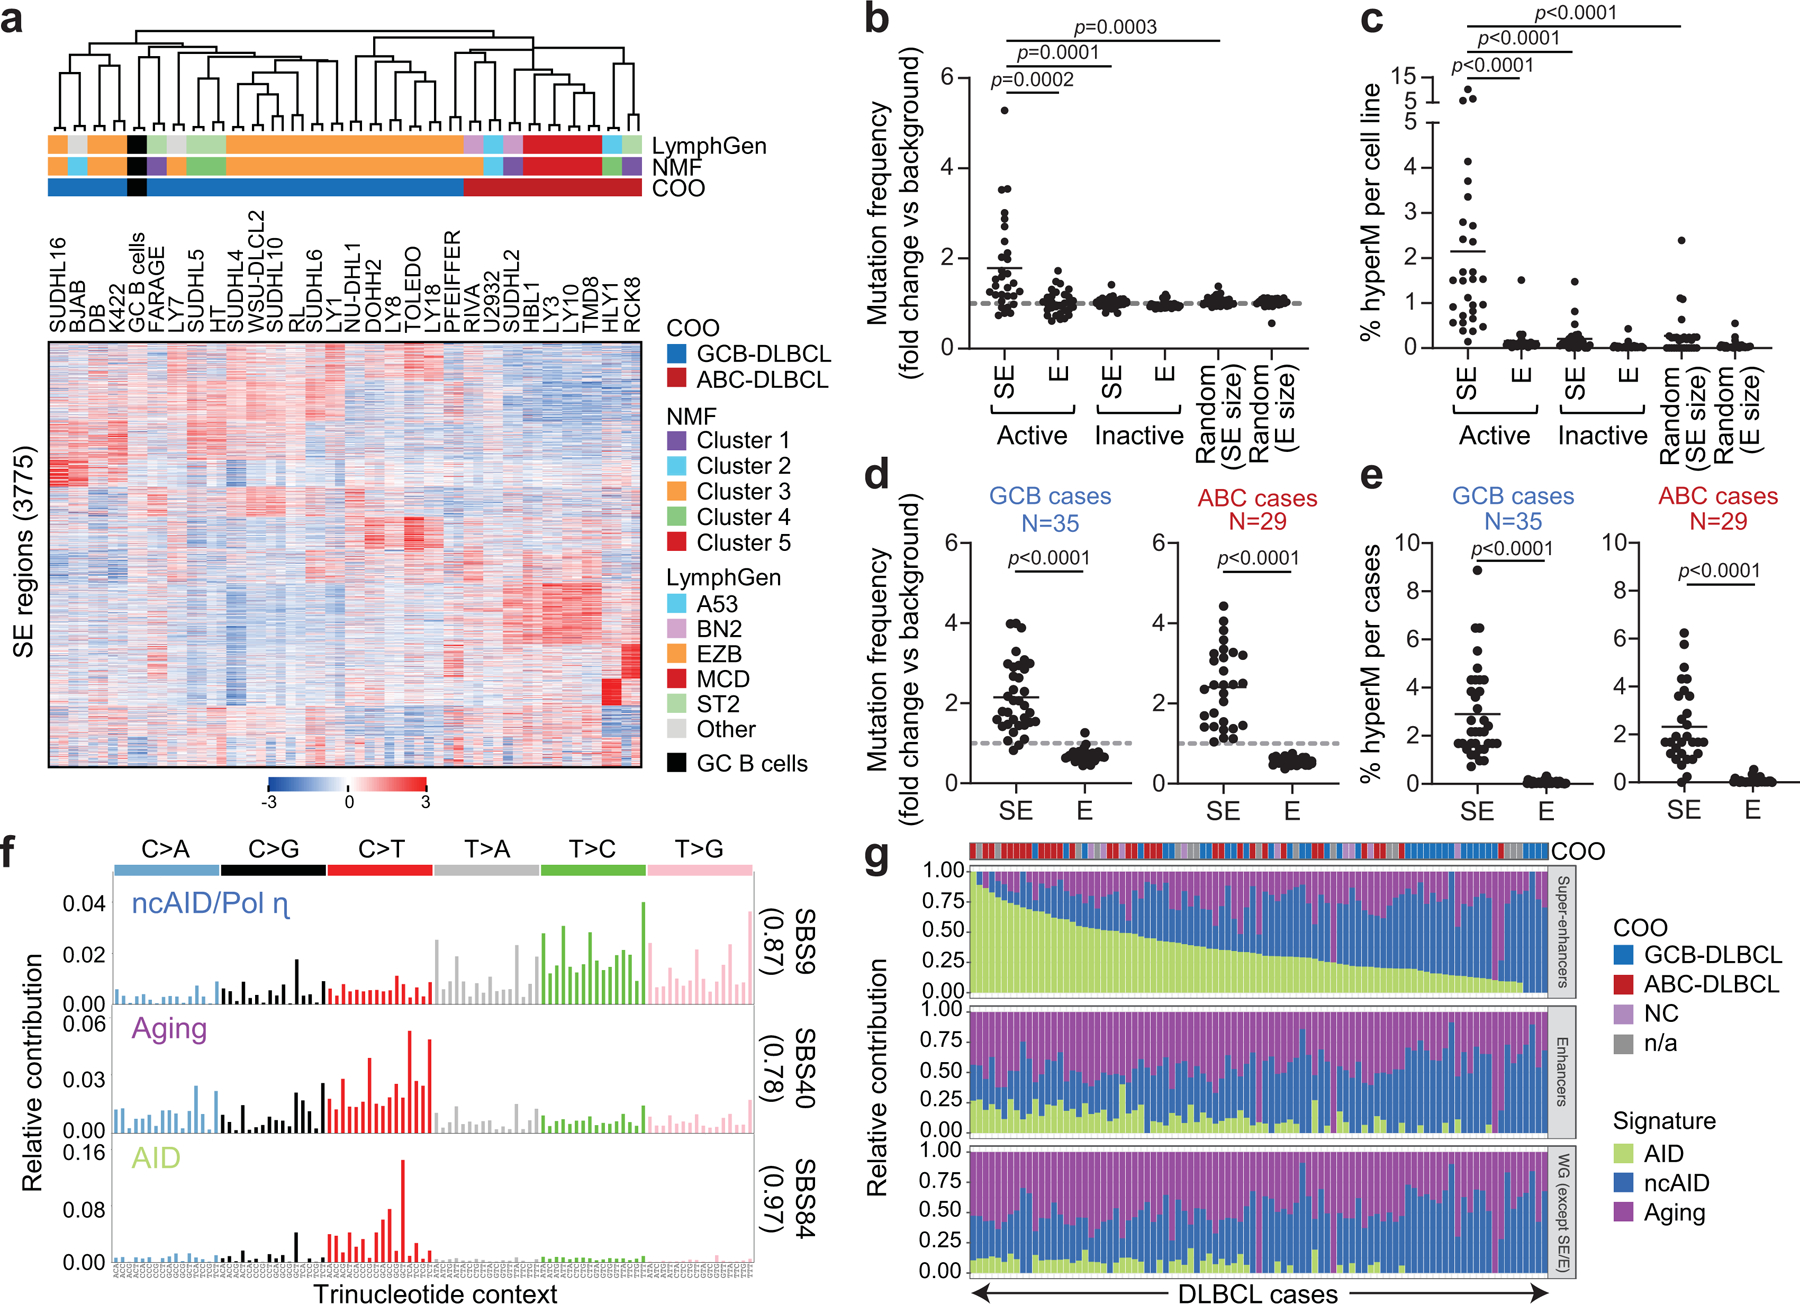
a. Unsupervised hierarchical clustering of H3K27Ac ChIP-seq data from 29 DLBCL cell lines (in duplicate) and 2 purified GC B cell pools across 3,775 differentially enriched SEs. The COO, LymphGen and NMF4 consensus clustering classifications are shown on the top. Note the separation of GCB- and ABC-DLBCLs, with the exception of 6 GCB-DLBCL cell lines displaying intermediate H3K27Ac signature. b. Mutation frequency of active E/SEs in 29 DLBCL cell lines, as compared to inactive E/SEs and size-matched control regions. Each dot represents one cell line and data are expressed as fold changes vs. the background mutation frequency, calculated in the same sample on the “rest of the genome” excluding the IG loci (see Methods). c. Sample-based percentage of hypermutated regions in DLBCL cell lines (i.e. regions harboring ≥3 mutations with intermutation distance ≤1kb, and significantly higher mutation frequency compared to background). d, e. Mutation frequency (d) and percentage of hypermutated E/SEs (e) in GCB- and ABC-DLBCL primary samples. Data are shown for E/SEs shared between tumors and GC B cells (see Extended Data Fig. 6 for all tested regions and unclassified DLBCL). P-values in b-e were calculated by two-sided Wilcoxon rank-sum test after BH correction. f. De novo mutational signatures identified in the SEs of DLBCL primary cases. In brackets, cosine similarity with COSMIC mutational signatures28. g. Relative contribution of the signatures identified in panel (f) to SEs, Es, and the rest of the genome (WG) in individual DLBCL primary cases. The preferential enrichment of the canonical AID signature in SEs and the cumulative activity of the three signatures across the 93 DLBCL cases is reported in Extended Data Fig. 9. ND, not determined.
We next interrogated the active E/SE genomic regions (on average 7,102 Es and 500 SEs per sample) for mutation status by examining whole genome sequencing (WGS) data obtained from the same 29 DLBCL cell lines (Extended Data Fig. 1 and Methods). Regions with features of active SEs, and to a much lesser extent those involved in E activity, were highly enriched in somatic mutations when compared to: i) inactive E/SEs within the same cell line (i.e. regions identified as active E/SEs in other cell lines, but lacking evidence of H3K27Ac and thus of E/SE activity); ii) the rest of the genome, not including the IG loci; and iii) randomly selected genomic regions of comparable size, excluding the IG loci (q<0.001, Wilcoxon rank-sum test, after Benjamini-Hochberg (BH) correction) (Fig. 1b and Methods).
Within each cell line, ~ 2% of the active SEs (range: 0.1 to 10.3%) were affected by somatic hypermutation (SHM), defined by the detection of ≥3 mutations with intermutation distance ≤1 kb within the region, and a significantly higher mutation frequency compared to the background mutation rate in the rest of the genome (q<0.05, Chi-squared test with BH correction) (Fig. 1c and Supplementary Table 1). In contrast, a small fraction of classic Es was hypermutated in a few cell lines (average: 0.15%; range 0.01–1.5%; q<0.001, Wilcoxon rank-sum test, after BH correction). Interestingly, E/SEs were hypermutated independent of whether they were intragenic or intergenic, although mutation frequencies were significantly higher in E/SEs encompassing a transcription start site (TSS) (Extended Data Fig. 5a). In contrast, no significant mutational activity was detected at classical active promoters (i.e. promoters not embedded in E/SEs, which were generally undistinguishable from background) (Extended Data Fig. 5b). Thus, SEs are the key element attracting hypermutation in these regions.
The results obtained in cell lines were confirmed in 93 primary DLBCL cases (with matched constitutional DNA) using the union list of all E/SEs identified across cell lines and normal GC B cells (Extended Data Fig. 1 and Methods). We note that this calculation underestimates the actual E/SEs mutational load, since only a subset of the E/SE union is expected to be active in each sample. Nevertheless, this analysis confirmed that SE regions display a significantly higher mutational load compared to classic Es or to the mutational background in the same sample (Fig. 1d, Extended Data Fig. 3 and 5c,d, and Methods). Notably, 99% of primary cases harbored at least two hypermutated SEs (92% if excluding those linked to the IG loci), comprising those shared with GC B cells and “de-novo” SEs not active in normal GC B cells (Fig. 1e, Extended Data Fig. 6, and Supplementary Table 2). Analysis of the core E/SEs in 108 Burkitt lymphoma (BL) cases and 126 chronic lymphocytic leukemia (CLL) cases (56 IGHV-mutated and 70 IGHV-unmutated) revealed the presence of mutational activity in tumors originating from GC-experienced cells, but to much lower extent, while IGHV-unmutated CLL were undistinguishable from background (Extended Data Fig. 7).
To obtain an independent validation for the preferential SE targeting of SHM, we performed an unbiased search for recurrent mutational hotspots, independent of functional E/SE status, in the 93 DLBCL WGS data using FishHook26. Of the 164 significantly mutated 1-kb regions, 87% (143) overlapped with the functionally defined SEs and 86% (141) had been classified as recurrently hypermutated by our ChIP-seq based approach (Extended Data Fig. 8 and Supplementary Table 3). Thus, SEs are preferentially targeted by SHM and represent the major mutational target in virtually all DLBCLs.
Mutations in SEs display AID hallmarks
To investigate the mechanism involved in SE hypermutation, we interrogated the list of SE-associated single-basepair substitutions for de novo mutational signatures, using Palimpsest27, followed by comparison against the COSMIC mutational signature database28. We identified 3 predominant signatures corresponding to canonical AID activity (SBS84), non-canonical AID (SBS9), and aging (SBS40) (Fig. 1f and Extended Data Fig. 9a). When these 3 signatures were interrogated in Es or the rest of the genome, the contribution of the canonical AID signature was significantly and preferentially enriched in SE regions (q<0.0001, Wilcoxon rank-sum test after BH correction) (Fig. 1g and Extended Data Fig. 9b). Accordingly, SE mutations showed preferential targeting of the known AID sequence recognition motif RGYW/WRCY29, confirming AID-mediated SHM as the underlying mechanism (Extended Data Fig. 9c,d). Taken together, these results strongly suggest that SE hypermutation is mainly caused by AID activity in DLBCL.
Recurrently mutated SEs are linked to known oncogenes
In order to identify genes whose transcription may be affected by SE hypermutation, we assigned SEs to candidate target genes based on three criteria: i) genomic proximity; ii) expression (by RNA-seq) in DLBCL cell lines; and iii) mapping within the same topologically-associated domain (TAD), as determined by Hi-C from GC B cells. In addition to SEs linked to the IG loci, we obtained a list of 76 non-IG candidate protein-coding genes whose linked SEs are recurrently hypermutated in DLBCL (≥3 primary cases) (Fig. 2a, Supplementary Table 2). These genes were significantly enriched for B-cell specific transcription factors (TF) and proto-oncogenes previously implicated in GC physiology and/or pathology (Fig. 2b, Supplementary Table 2), including the BCL6, BCL2, CXCR4 and PAX5 proto-oncogenes. A subset of SEs (n=14) were preferentially hypermutated in GCB- or ABC-DLBCL, including those linked to BCL7A, which encodes a subunit of the SWI/SNF chromatin remodeling complex30 (hypermutated in 54% of GCB-DLBCLs vs. 17% of ABC-DLBCLs; p=0.002), CIITA, encoding a TF regulating MHC-II expression31 (26% of GCB-DLBCL vs. none of ABC-DLBCL, p=0.003), and RHEX, encoding a signal transducer of the EPO–EPOR-JAK2 signaling pathway32 (hypermutated in 21% of ABC-DLBCL, but not in GCB-DLBCL, p=0.006). Collectively, these data indicate that SEs involved in SHM are linked to genes and related pathways of potential relevance to the pathogenesis of both GCB- and ABC-DLBCL subtypes.
Figure 2: Recurrently mutated SEs are linked to known B-cell oncogenes.
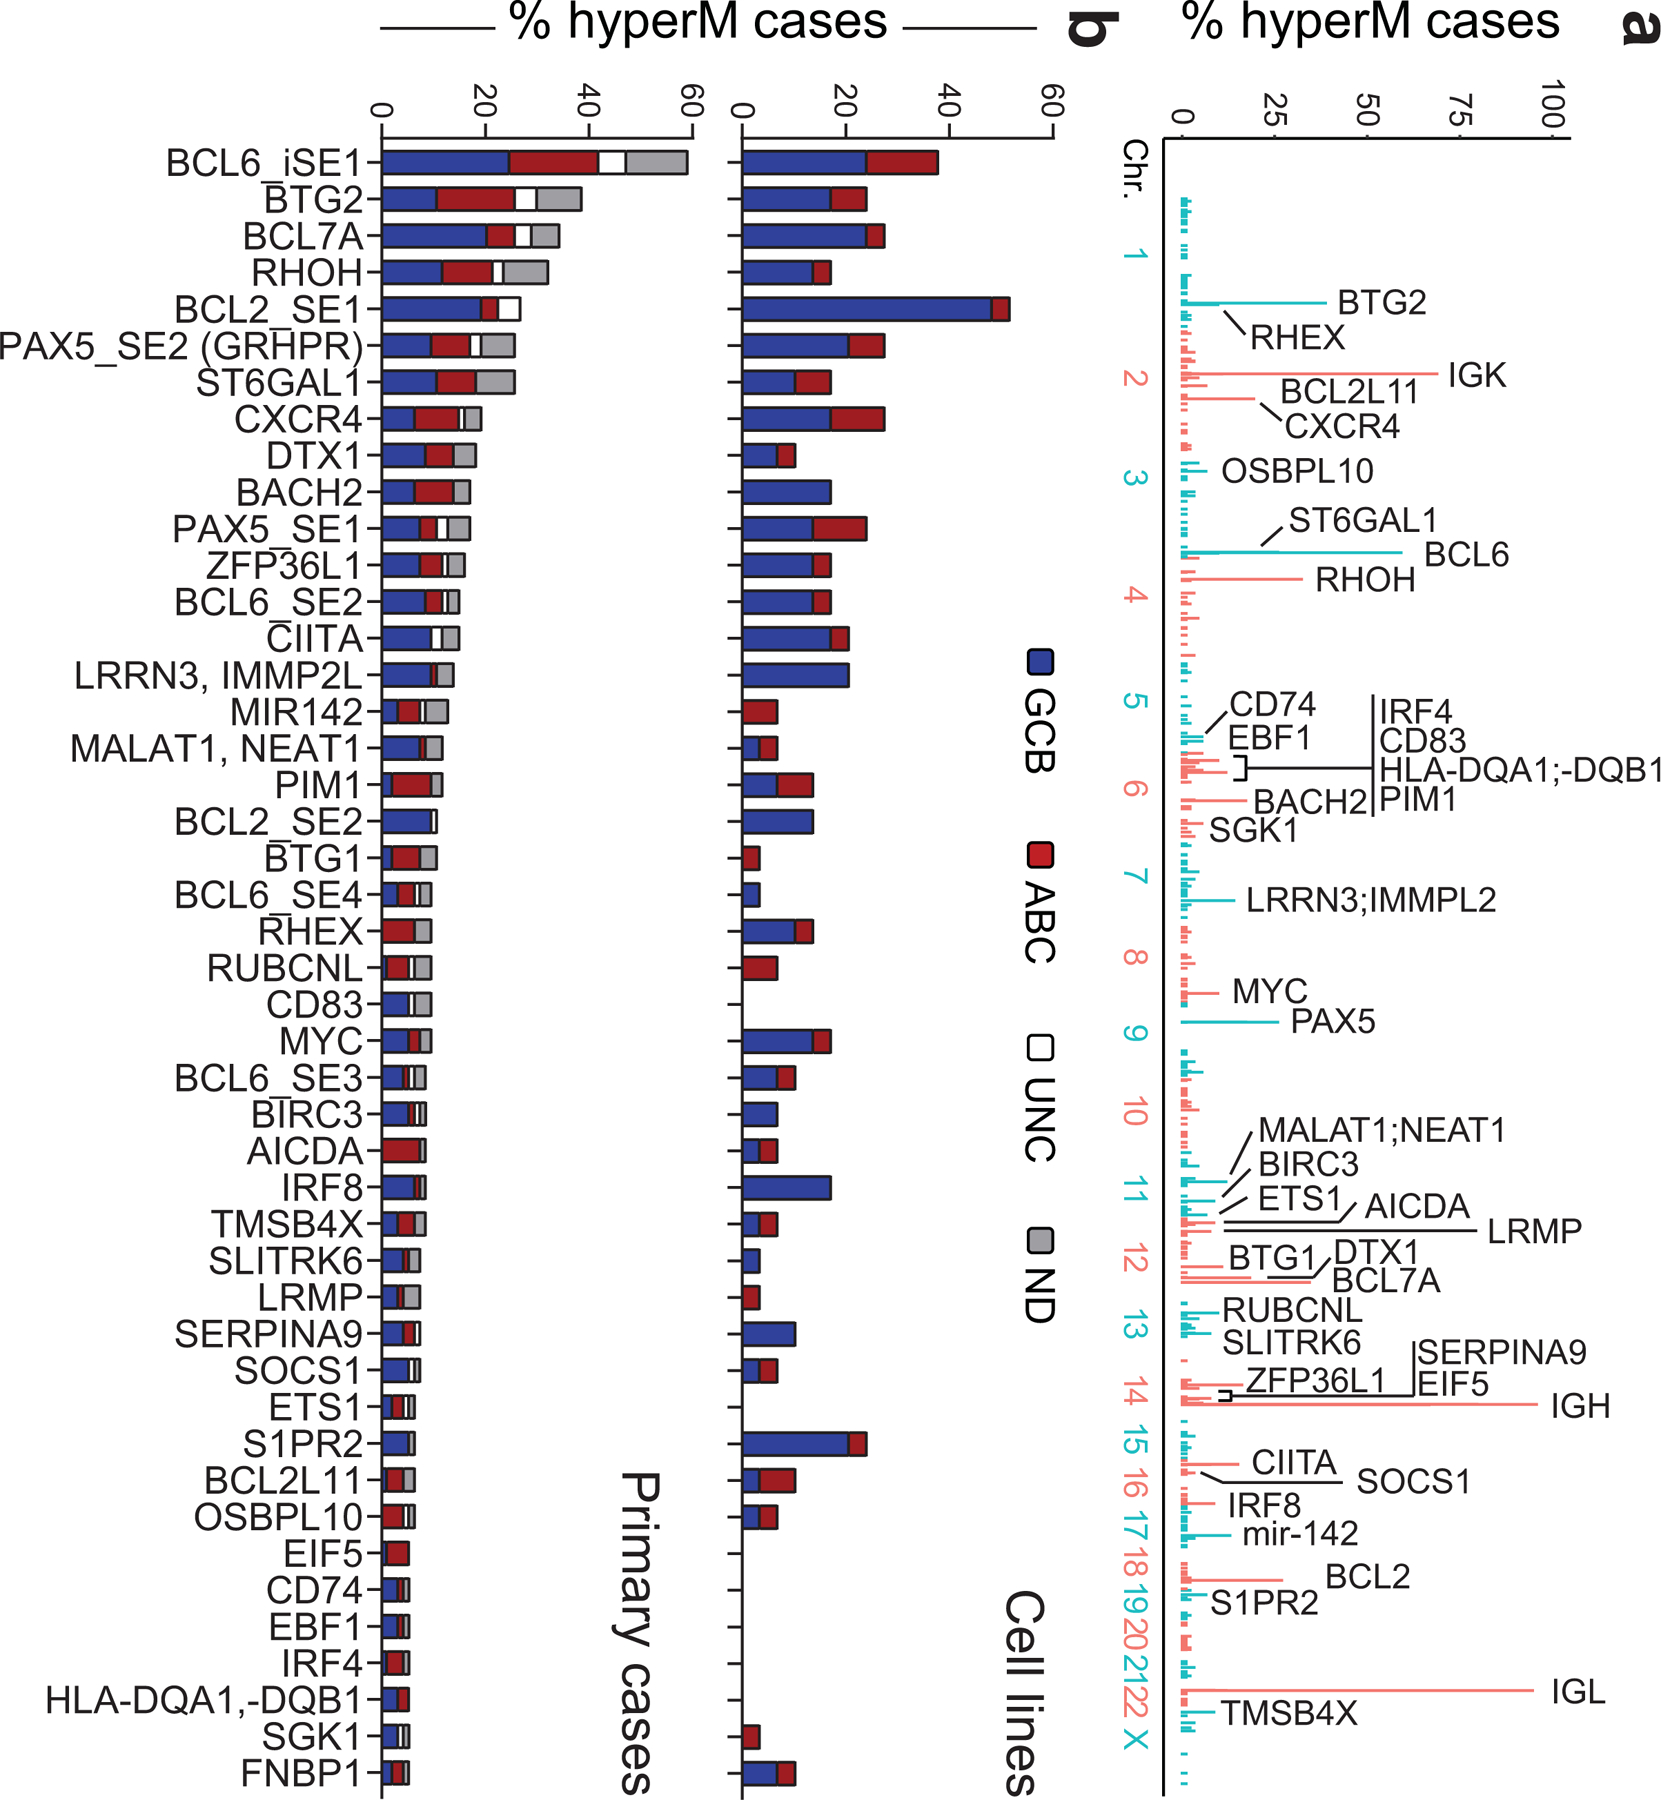
a. Genome-wide distribution of the hypermutated SEs and their candidate target genes. The plot illustrates the percentage of hypermutated regions across the 3,775 SEs, distributed along the 23 human chromosomes, with blue and red indicating alternate chromosomes. The assigned candidate target gene (n=43) is provided for the top 60 SEs (all mutated in at least 5 cases). See also Extended Data Fig. 8 for comparison with the results of the FishHook analysis. b. Percentage of DLBCL primary cases harboring mutations in 57 SEs (outside the IG loci) found involved in at least 4 cases. Bars are color-coded to indicate the COO class of the affected samples. UNC, unclassified; ND, not determined.
A mutational hotspot in the BCL6 intragenic SE
To determine whether SE-SHM has functional consequences, we focused on highly recurrently hypermutated SEs that are linked to genes of clear significance for DLBCL pathogenesis. The BCL6 gene, which encodes for a transcriptional repressor required for GC development and involved in DLBCL-associated oncogenic chromosomal translocations33, emerged as the most common target of SE-SHM, with 4 distinct SEs being hypermutated in more than 5 cases (Fig. 2b and Supplementary Table 2). An intragenic SE (iSE) that extends across the first intron was hypermutated in 59% of primary cases (55/93) and 38% of cell lines (11/29). Notably, 58% of these cases (32/55) were devoid of BCL6 rearrangements, consistent with an independent genesis of the mutations.
We then scanned the BCL6-iSE for the presence of recurrently mutated hotspots that could pinpoint potentially functional variants, by evaluating overlapping 20bp intervals with a 1bp sliding window. We identified the sequence stretch corresponding to position +776–795 from the TSS (Fig. 3a, bottom) as hypermutated in 29% of primary DLBCL cases and 24% of cell lines, with over half of the mutated samples (59%; 16/27) lacking BCL6 translocations. Two independent DLBCL cohorts (150 cases analyzed by WGS34 and 169 cases analyzed by targeted Sanger sequencing2) confirmed this hotspot in 30% of the samples (97/319, 73 of which were devoid of BCL6 translocations) (Supplementary Table 4). In particular, the nucleotides at positions 776, 779, and 780 were mutated in 4.9%, 3.4%, and 10.2% of all cases analyzed, including discovery and validation cohorts (n= 20, 14, and 42 of 412). Most notably, these three positions were found mutated at extremely low frequency in normal memory B cells (0.1%, 0.08%, and 0.47%, respectively; p< 1.87e-13) (Fig. 3a, shadowed area), suggesting tumor-specific selection of these events. Supporting this conclusion, the same binding site was found mutated in ~6% of follicular lymphoma (FL) cases, but extremely rarely in IGHV-mutated CLL (1.4%), and it was never observed in 1,592 non-lymphoid malignancies (Extended Data Fig. 10 and Supplementary Table 5), indicating a specific and strong selection for DLBCL.
Figure 3: Hotspot mutations in the BCL6-iSE are required for survival and deregulate BCL6 expression.
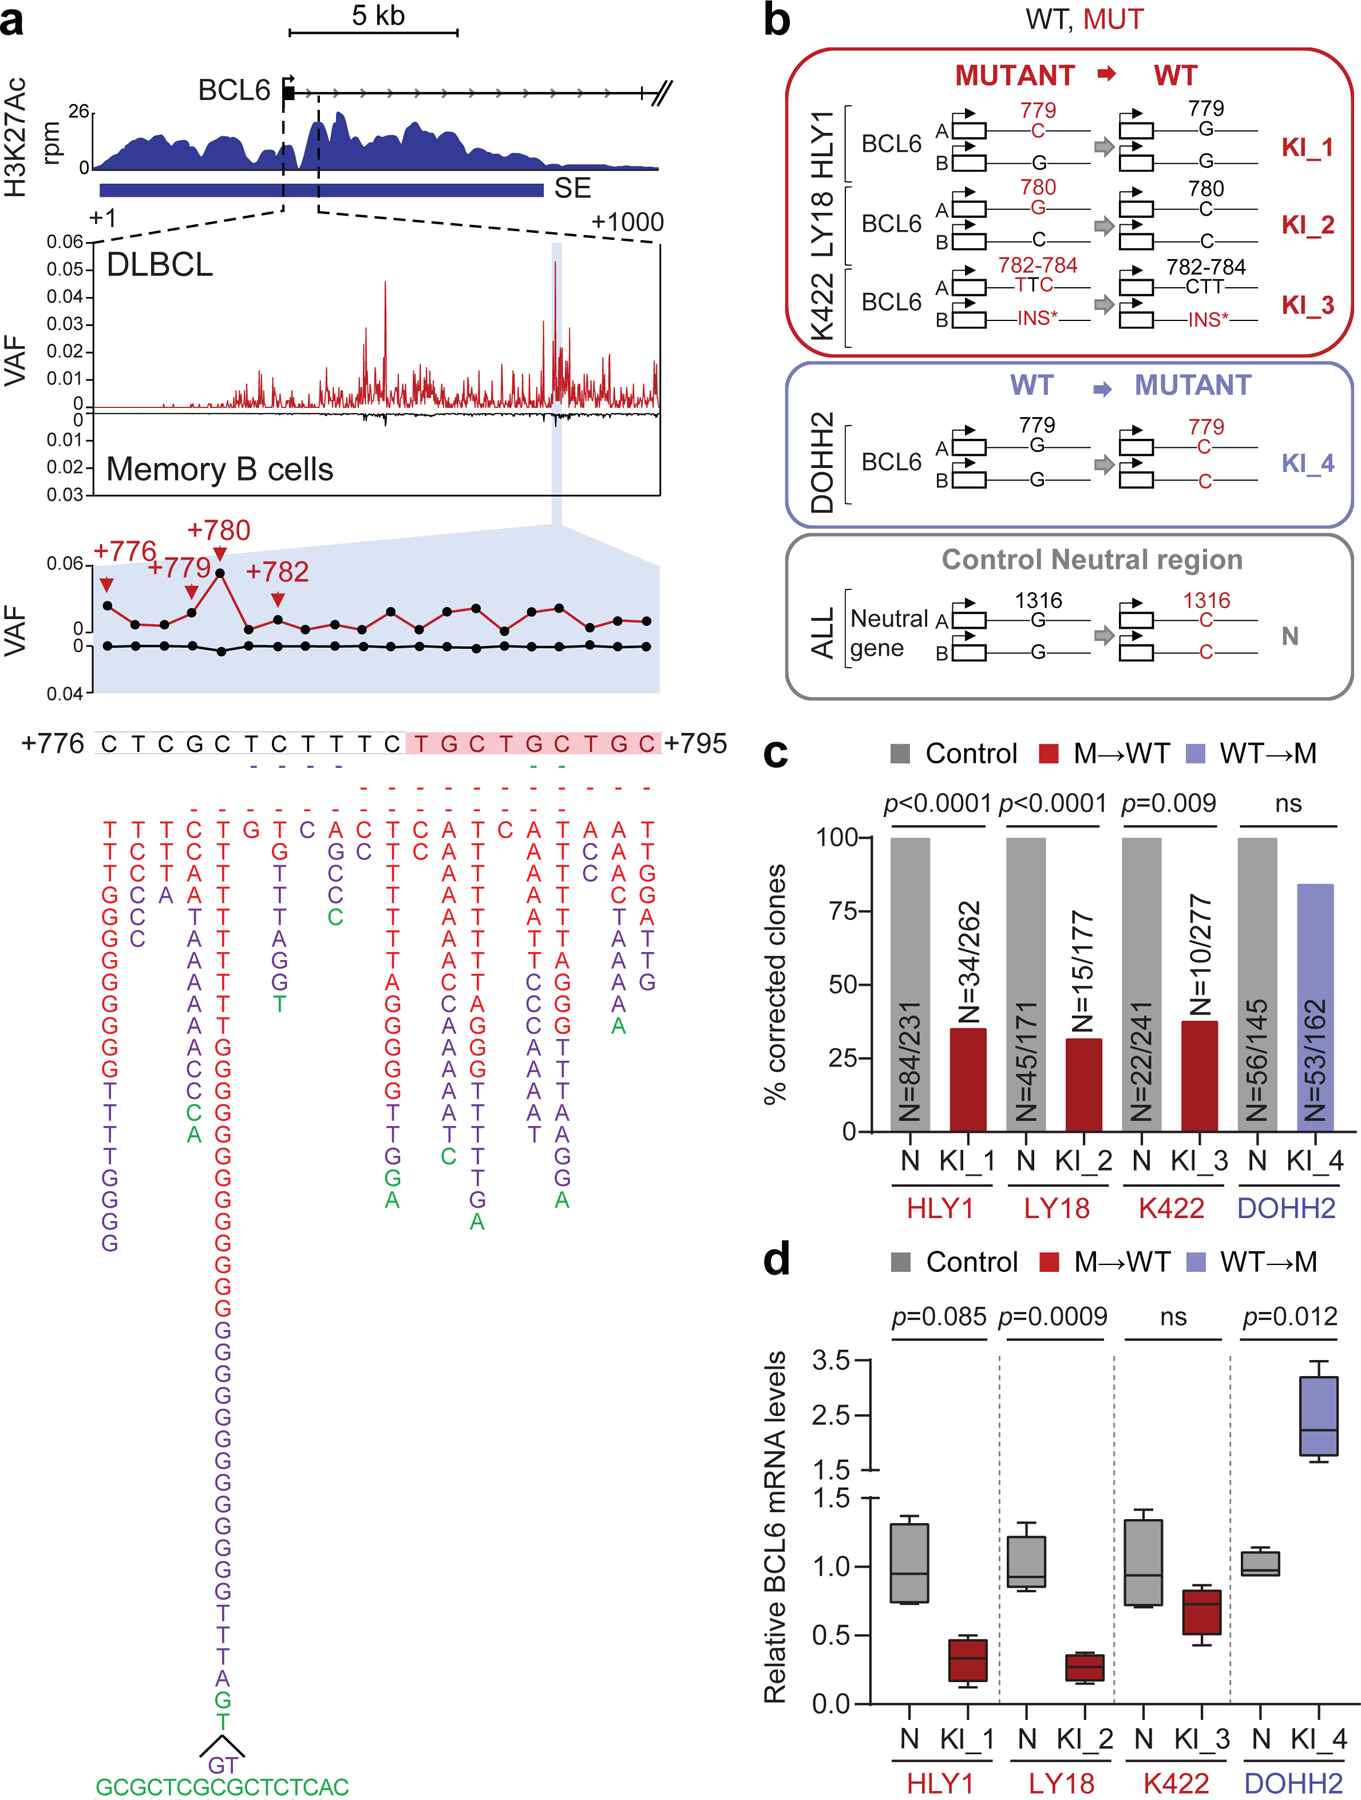
a. H3K27Ac ChIP-seq track at the BCL6-iSE locus in the representative LY1 cell line (top). The variant allele frequency (VAF) of the highlighted region is given for 412 primary DLBCL cases (red plot) vs. normal memory B cells (black; n≈50,000 alleles from 10 donors) in the middle panel. The bottom panel illustrates a magnified view of the mutational hotspot (position +776–795 from the TSS; GenBank Accession No. AY189709) at single nucleotide resolution, with the SNVs identified in DLBCL biopsies (red, WGS data; purple, Sanger sequencing data) and cell lines (green) aligned below; dotted line, small deletion; shadowed sequence, AID recognition motif. b. Design of the CRISPR-Cas9 editing experiment. sgRNAs and template DNA oligoes were designed to correct the indicated mutations in 3 cell lines (red), introduce the G779C mutation in the BCL6-negative DOHH2 cell line (blue), and introduce a G1316C intronic mutation in the PPP1R12C neutral gene in all cell lines (grey). c. Normalized percentage of corrected clones recovered in 2 independent CRISPR-Cas9 experiments. In each cell line, the percentage of properly mutated clones in the neutral region was arbitrarily set as 100%, and absolute numbers are given inside the bars (two-tailed Fisher’s exact test). d. Relative BCL6 mRNA levels in isogenic clones obtained from the indicated cell lines, color coded as in b (n=4 each; unpaired two-tailed t-test). In each cell line, the mean value of the unmanipulated clones is set as 1.
BCL6-iSE mutations are required for DLBCL fitness
To determine whether mutations in the +776–795 BCL6-iSE hotspot have functional consequences, we first identified 3 DLBCL cell lines carrying point mutations in this sequence (HLY1, LY18, and Karpas-422), and used the CRISPR-Cas9 technology to revert the mutations into the original germline nucleotide. As control for off-target and/or non-specific effects due to the manipulation of this genomic region, we introduced a G779C nucleotide change in the DLBCL cell line DOHH2, which is negative for BCL6 expression and thus presumably insensitive to perturbations of the BCL6 locus; additionally, sgRNAs targeting a neutral region of the genome were used in each of the 4 cell lines to control for their capacity of repair, which can be intrinsically different in distinct cell line models (Fig. 3b). Single cells were plated by limiting dilution (n=600 cells/cell line/sgRNA) and the surviving clones were genotyped by PCR amplification and sequencing.
The results showed that, in all 3 BCL6-iSE-mutated cell lines, the percentage of recovered clones with properly corrected SE mutations (Fig. 3c red bars) was significantly lower compared to the fraction of clones carrying an edited neutral region, arbitrarily set as 100% (HLY1: 34%, p<0.0001; LY18: 20%, p<0.0001; and Karpas-422: 41%, p=0.009; Fisher’s exact test), while the difference was not significant in the BCL6-negative cell line (73%) (Fig. 3c, blue bar). This finding suggests that reverting the BCL6-iSE mutation to a WT allele leads to counterselection of the lymphoma cells, revealing a genetic addiction to these mutations.
In each of the 3 cell lines, a few clones could expand despite having a precisely corrected hotspot mutation. However, these clones displayed reduced proliferation (not shown) and significantly lower levels of BCL6 mRNA and protein expression compared to control unedited clones (n=4) (Fig. 3d and Extended Data Fig. 11a). Allele-specific analysis by Sanger sequencing of RT-PCR products, using a germline SNP segregating with the mutation, documented that the reduced mRNA levels were due to repression of the corrected allele (Extended Data Fig. 11b, see below). Altogether, these data show that BCL6-iSE mutations deregulate the expression of BCL6 and confer an oncogenic addiction in DLBCL.
BCL6-iSE mutations disrupt a BLIMP1 binding site
To gain insights into the mechanism by which BCL6-iSE hotspot mutations deregulate BCL6 expression, we performed an unbiased search for the presence of TF binding site(s) in the +776–795 sequence using two methods: i) in silico motif prediction, and ii) chromatin immunoprecipitation followed by mass spectrometry (reverse ChIP) using nuclear extracts from the HLY1 cell line. After elimination of artefactual candidates not expressed in GC B cells, both methods identified the BLIMP1 transcriptional repressor as the only TF predicted to bind the WT, but not the mutated site (Fig. 4a and not shown). BLIMP1 is a master regulator of plasma cell differentiation35 and a tumor suppressor inactivated in 25% of ABC-DLBCL cases1,36. BLIMP1 expression is suppressed by BCL6 in GC B cells and is upregulated upon GC exit in cells committed to plasma cell differentiation, where it antagonizes BCL6 transcription through a reciprocal regulatory feedback loop37,38.
Figure 4: Recurrent mutations in the BCL6-iSE prevent BLIMP1 binding and transcriptional repression.
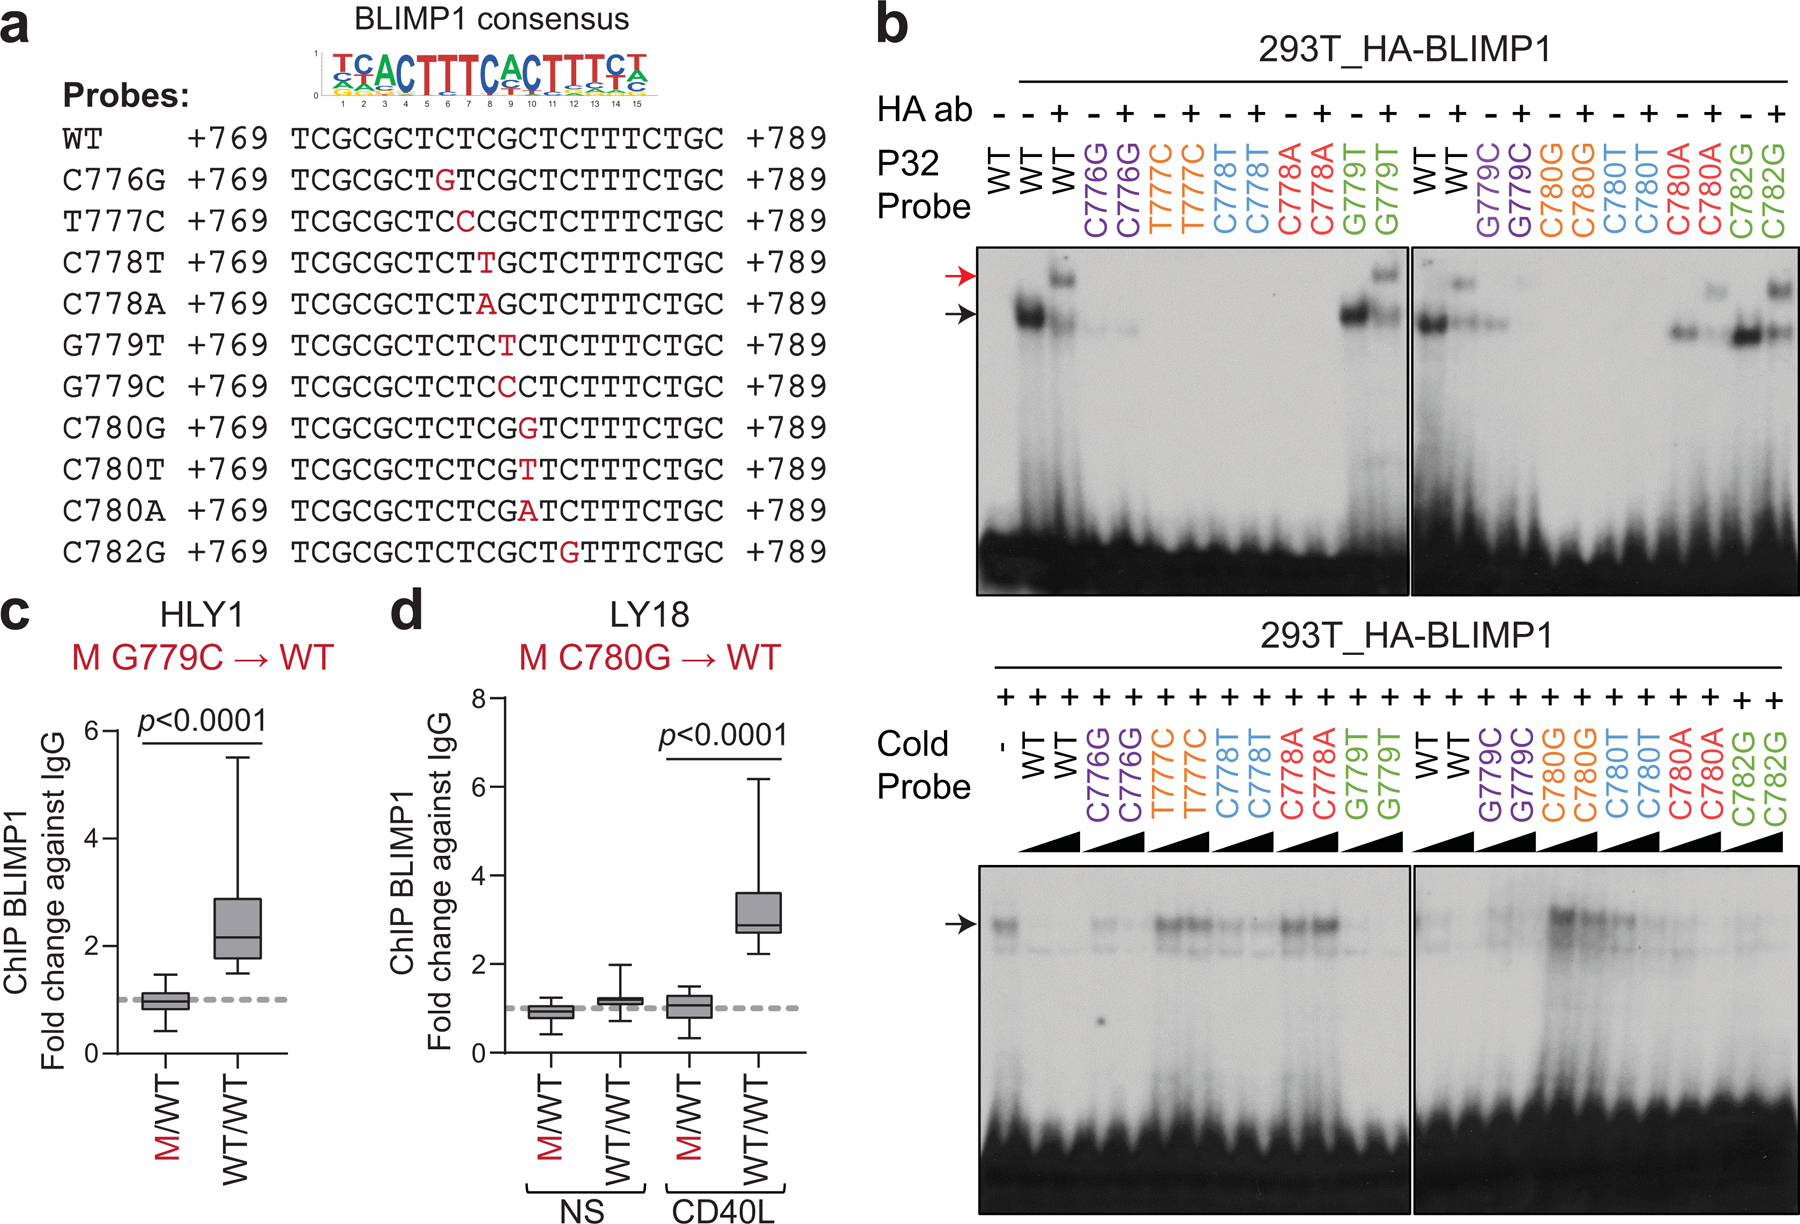
a. Nucleotide sequence of WT and mutant probes encompassing the predicted BLIMP1 consensus binding site in the BCL6-iSE, used for EMSA. b. Top panel: EMSA of nuclear extracts from 293T cells overexpressing HA-BLIMP1 documents binding to the WT BCL6-iSE sequence (black arrow) and supershift by the HA antibody (red arrow); this is lost in 7 of 10 mutant probes tested. In the bottom panel, the same probes, used as cold competition oligos (50X and 100X), fail to compete with the labeled WT probe (one representative gel out of 3 that gave similar results). c. BLIMP1 ChIP-qPCR in control parental (M/WT) and corrected (WT/WT) clones from the HLY1 cell line (n=4 clones each; data pooled from 2 independent experiments; two-tailed unpaired t-test). d. BLIMP1 ChIP-qPCR in parental (M/WT) and corrected (WT/WT) clones from the LY18 cell line (n=4 clones each; data pooled from 2 independent experiments; one-way ANOVA with Bonferroni correction). Experiments were performed in basal conditions (NS) or upon CD40L stimulation, used to induce BLIMP1 expression.
We first showed that BLIMP1 binds the predicted DNA binding site (B1BS) in vitro by electro-mobility shift assay (EMSA) using nuclear extracts from 293T cells transfected with an HA-tagged BLIMP1 expression construct, and a BCL6 B1BS WT probe (Fig. 4a,b, top panel, lanes 1–3). In contrast, 7/10 DLBCL-associated mutant sequences, including the 2 most common hotspot mutations, failed to bind BLIMP1 (Fig. 4a,b, top panel). Reciprocally, the same probes were unable to compete with the WT probe (Fig. 4b, bottom panel; compare lanes 1–3 with lanes 4–11 and 16–21). The remaining 3 mutant probes did not show significant differences, most likely representing passenger mutations associated with the widespread activity of AID.
To validate these results in cells, we then performed BLIMP1 ChIP-qPCR on 2 isogenic DLBCL line pairs (HLY1 and LY18) where the endogenous BCL6-iSE heterozygous mutations G779C and C780G were reverted to WT (n=4 clones each). As shown in Fig. 4c,d, while BLIMP1 binding was undetectable in the parental mutated cells, it was significantly enriched in the genetically-corrected clones (fold change over controls: 2.6 for HLY1, 3.3 for LY18; p<0.0001, two-tailed unpaired t-test and one way ANOVA with Bonferroni correction). Consistent with these results, all cell line models showed an inverse correlation between BLIMP1 binding and BCL6 expression (Extended Data Fig. 11c,d), and all B1BS-mutated cases displayed co-expression of BCL6 and BLIMP1 (not shown). Thus, the BCL6-iSE hotspot is a physiological site for BLIMP1 binding in vivo and this binding is impaired by DLBCL-associated BCL6-iSE SHM, leading to dysregulated BCL6 expression.
In the majority of DLBCL, mutations in the BCL6-B1BS (19% of all cases tested; 80/412) occur independenly of both BCL6 translocations and coding mutations in the PRDM1 gene, which, in turn, rarely co-exist (Extended Data Fig. 11e and Supplementary Table 4), suggesting that they represent alternative mechanisms converging on oncogenic deregulation of BCL6. Of interest, BCL6-B1BS mutations were more common in GCB-DLBCL (16%, vs. 7% ABC-DLBCL; n=16/99 vs. 4/55) and preferentially associated with the ST2 subgroup (41%, 7/17, p=0.003); this is different from BCL6 translocations that mostly associate with ABC and BN2-DLBCL12 (Extended Data Figs. 11f-h and 12). These results suggest that BCL6 B1BS mutations have a functional role at least in part distinct from BCL6 chromosomal translocations (see Discussion).
BCL2-SE mutations abolish NR3C1 binding
The BCL2 SE was hypermutated in about one third of discovery cases (n=25/93). In normal GC B cells, the BCL2 protein is not expressed; consistently, no active E/SE can be detected at this locus (Extended Data Fig. 3), which is also not targeted by physiological SHM39,40. We identified a mutational hotspot predicted to disrupt the binding by the NR3C1 glucocorticoid receptor in 13/93 cases, and confirmed its recurrence in two independent DLBCL cohorts (28/270 cases, 10%, with 3 lacking BCL2 translocations) as well as in 21% of the cell lines (6/29) (Fig. 5a and Supplementary Table 4).
Figure 5: Hotspot mutations in the BCL2 SE prevent NR3C1 binding and transcriptional regulation.
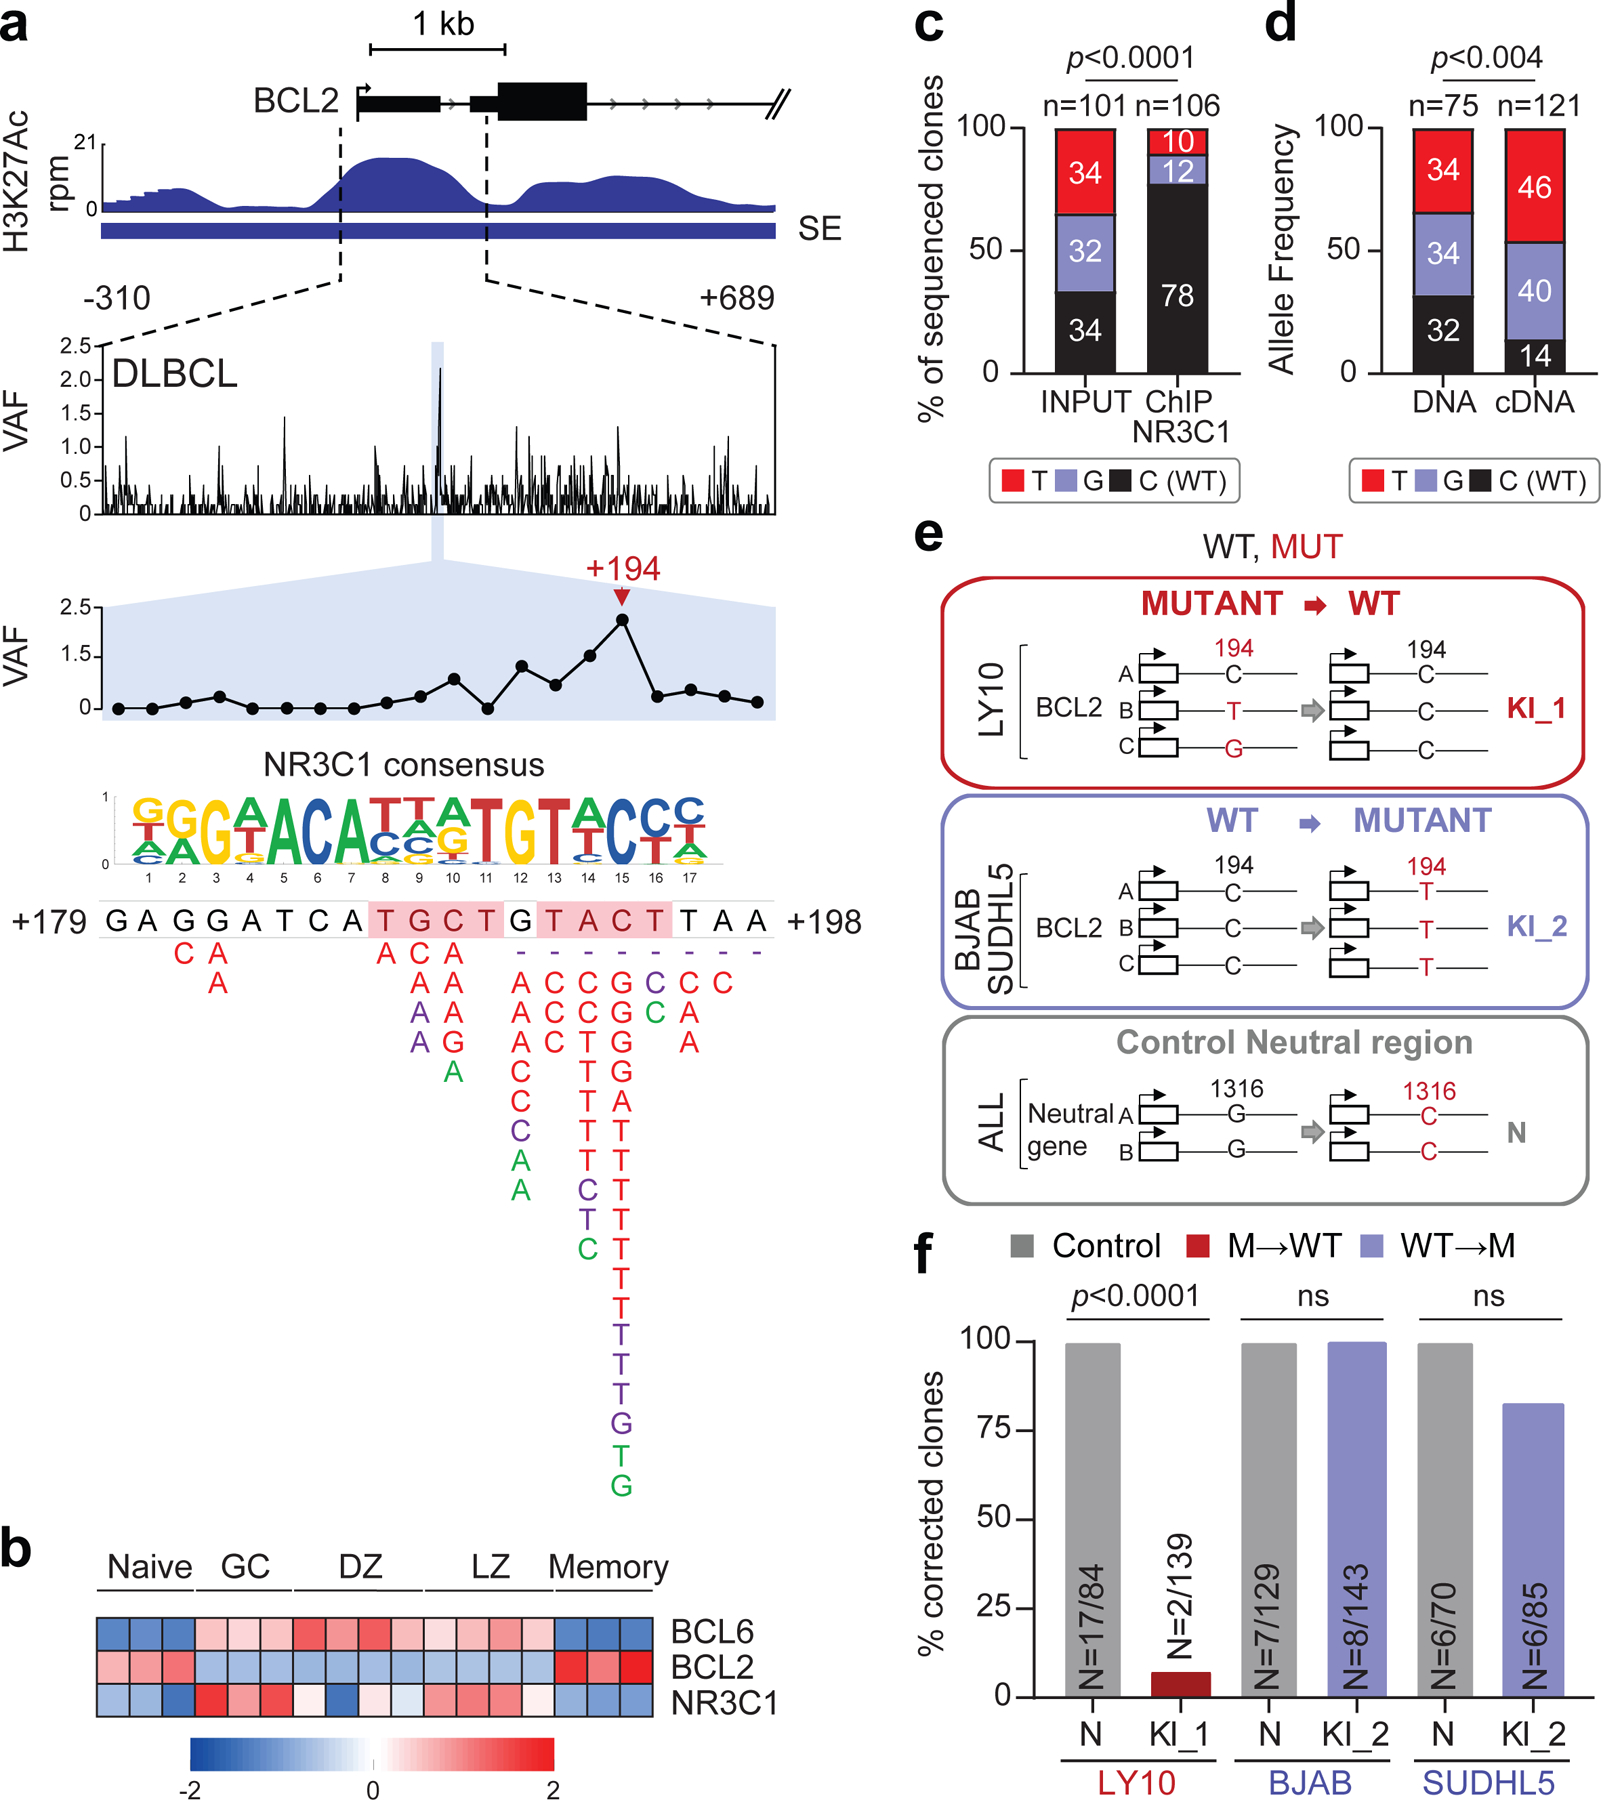
a. H3K27Ac ChIP-seq track of the BCL2 iSE in LY10 (top). The highlighted region is expanded below the track to show VAFs in primary DLBCL cases. The mutational hotspot at position +179–198 (blue shadow) is further magnified, with the predicted NR3C1 consensus binding motif aligned to the reference sequence, and SNVs positioned below (positions according to NCBI NM_000633) (red, WGS data; purple, Sanger sequencing data; green, cell lines; dotted lines, deletions; shadowed sequence, AID recognition motif). b. BCL6, BCL2 and NR3C1 expression in normal B-cell subsets. Data are expressed as log2 TPM, and scale bar indicates the Z-score. c. Allelic quantification of input and NR3C1-IP DNA in LY10, as assessed by PCR amplification and cloning (note that LY10 has 3 BCL2 alleles). The total number of clones sequenced is indicated inside the bars (2 independent experiments). d. Relative proportion of the 3 BCL2 alleles in LY10 DNA and cDNA, as determined by sequencing analysis of cloned PCR products (2 independent experiments). e. Design of the CRISPR-Cas9 experiment utilized to correct the mutations in LY10 (red), introduce the C194T mutation in two BCL2-negative cell lines (blue), and edit the control PPP1R12C gene in all cell lines (grey). f. Normalized percentage of corrected clones recovered in the CRISPR-Cas9 experiments. In each cell line, the percentage of properly mutated clones in the neutral region was set as 100%, and absolute numbers are given inside the bars (one representative experiment out of 2 that gave similar results). P-values in c,d,f were calculated by two-tailed Fisher’s exact test.
NR3C1, a TF that binds to glucocorticoid response elements on the DNA of target genes41, displays an inverse pattern of expression with BCL2 in B-cell acute lymphoblastic leukemia42, and is specifically upregulated in GC B cells, where BCL2 is absent (Fig. 5b), suggesting that it may be involved in the physiological suppression of BCL2 transcription in these cells. Indeed, ChIP-qPCR analysis confirmed that NR3C1 binds to the predicted motif within the BCL2 SE (Extended Data Fig. 13a, top panel). In contrast, a very faint signal was observed in the LY10 cell line, consistent with the presence of two alleles displaying a mutated BCL2-SE (C194T and C194G) and a third wild-type allele (Extended Data Fig. 13a, bottom panel). Cloning and sequencing of the LY10 ChIP-qPCR product revealed an over-representation of the BCL2 WT sequence, suggesting decreased affinity of NR3C1 for the mutated binding site (Fig. 5c and Extended Data Fig. 13b-d). Accordingly, the mutant BCL2 alleles were overexpressed in the same cells (Fig. 5d), supporting a role for NR3C1 as a negative regulator of BCL2. Thus, mutations in the SE may deregulate BCL2 transcription by abrogating NR3C1 binding.
To assess the biological consequences of these mutations, we asked whether CRISPR-Cas9-mediated correction of the C194T/G mutations in LY10 has an impact on cell growth and survival (see Fig. 5e for experimental design). Notably, only 1.4% (2/139) of the recovered clones showed proper correction of the BCL2-SE mutation, a fraction significantly lower than controls (Fig. 5f). Analysis of BCL2 mRNA expression in the 2 escapee clones revealed significantly reduced levels compared to unedited clones (Extended Data Fig. 13e), while introduction of the C194T mutation in BCL2 SE wild-type/BCL2-negative cell lines was sufficient to reactivate BCL2 expression (Extended Data Fig. 13e). Together, these results indicate that mutations in the BCL2 SE lead to deregulated BCL2 expression by allowing escape from NR3C1-mediated negative regulation.
NR3C1-BS mutations (11% of all cases tested; 41/363) were mostly associated with BCL2 translocations, suggesting an additive role in dysregulating BCL2 expression (35/95 translocation-positive vs. 6/267 untranlocated cases; 37% vs. 2.2%) (see Discussion). Moreover, cases with mutated NR3C1-BS in the absence of BCL2 translocations were exclusively found in the ABC (5.4%, 3/55, p=0.011) and MCD (20%, 3/15, p<0.0002) subgroups, in contrast with cases harboring BCL2 translocations, typically found in the GCB and EZB subgroups (31%, 31/99, p<0.0001; and 55%, 36/65, p<0.0001, respectively) (Extended Data Fig. 13g-j). The NR3C1-BS was found mutated in 28% of FL cases, but <1% CLL and none of 1,592 non-lymphoid malignancies tested (Extended Data Fig. 10 and Supplementary Table 5), indicating the highly specific selection for DLBCL and the related FL. Together, these findings uncover a novel mechanism by which tumor cells may sustain the aberrant expression of BCL2 in these two lymphoma types.
CXCR4-SE mutations abolish NR3C1 binding
A third recurrently hypermutated SE is linked to the CXCR4 gene (18/93 discovery cases, 19%). CXCR4 encodes for a G-protein coupled chemokine receptor involved in cell migration within the GC and dark zone (DZ):light zone (LZ) polarization43, and is mutationally activated in 40% of Waldenström macrobulinemia (WM), a post-GC lymphoproliferative disease44. We identified a predicted NR3C1 binding motif targeted by mutations in 7.5% (7/93) cases, 4% (6/150) of cases from the extension cohort34, and 7% of the cell lines (2/29) (Fig. 6a; Supplementary Table 4).
Figure 6: A mutational hotspot in the CXCR4 SE disrupts NR3C1 binding and transcriptional repression.
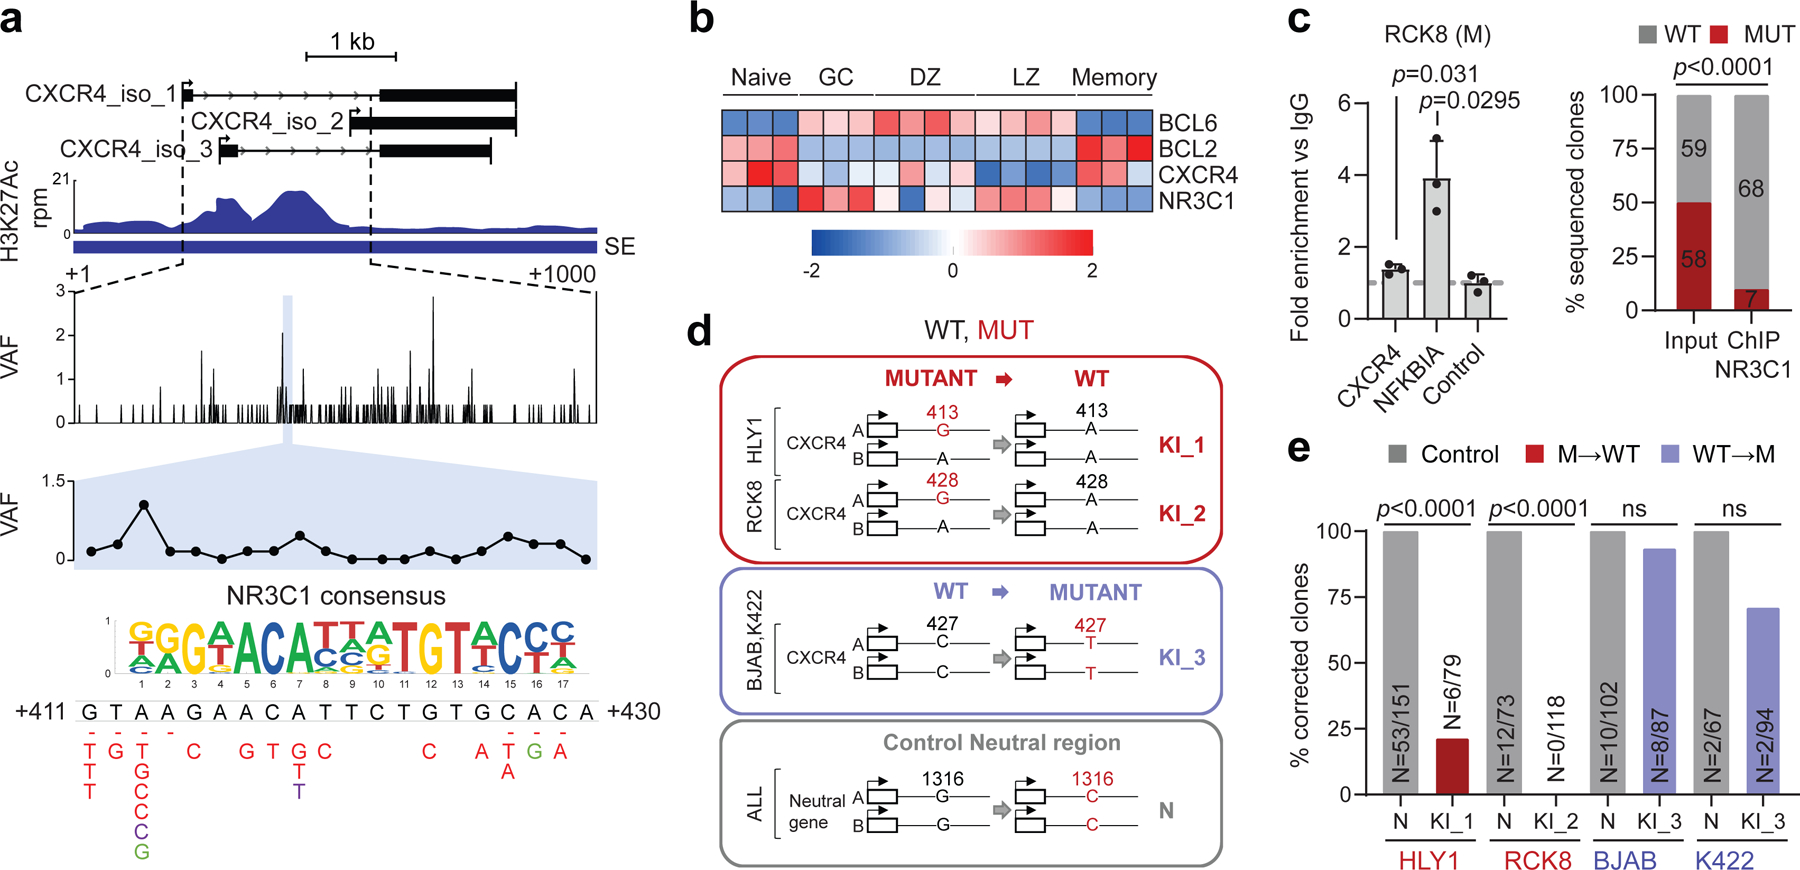
H3K27Ac ChIP-seq track of the CXCR4 iSE in LY10 (top). The hypermutated region is magnified below the track to show the VAF in primary DLBCL cases, and the mutational hotspot corresponding to the predicted NR3C1 consensus binding motif is expanded further (blue shadow; position according to NM_003467). SNVs found in DLBCL are positioned below (red, WGS data; green, cell lines; dotted line, deletion). b. Relative expression of BCL6, BCL2, CXCR4, and NR3C1 in normal B-cell subsets (z-scored log2 TPM). c. NR3C1 ChIP-qPCR (left) and allelic quantification of input and NR3C1-IP DNA (right) in the mutant RCK8 cell line, assessed by PCR amplification and cloning (one representative experiment in triplicate, out of two that gave similar results). d. Design of the CRISPR-Cas9 experiment utilized to correct the CXCR4 hotspot mutations in RCK8 and HLY1. e. Normalized percentage of corrected clones recovered in the CRISPR experiment; the percentage of properly mutated clones in the neutral region is set as 100% and the absolute clone numbers are indicated inside the bars. P-values were calculated by one-way ANOVA with Bonferroni correction (c, right panel), and two-tailed Fisher’s exact test (c, left panel, and e).
Consistent with RNA-seq data from normal B cell subsets, indicating an inverse relationship between NR3C1 and CXCR4 in the GC DZ and LZ (Fig. 6b), ChIP-qPCR demonstrated that NR3C1 binds to the predicted motif within the CXCR4 SE in the wild-type SUDHL16 cell line (Extended Data Fig 14a). In contrast, only the WT allele was pulled down in two SE-mutated, ABC-DLBCL cell lines (RCK8 and HLY1), as documented by cloning and sequencing of ChIP-qPCR products (Fig. 6c; Extended Data Fig. 14b-e). Accordingly, the mutant CXCR4 allele was preferentially expressed in RCK8 (Extended Data Fig. 14f). Together, these data identify NR3C1 as a novel negative regulator of CXCR4, and suggest that mutations in the CXCR4 SE deregulate gene transcription by decreasing its binding affinity for NR3C1.
CRISPR-Cas9 mediated gene editing to correct the CXCR4 A413G and G428A mutations in the RCK8 and HLY1 cell lines led to a significantly smaller fraction of properly corrected clones in both cell lines, as compared to those edited in the neutral region (p< 0.0001, Fisher’s exact test) (Fig. 6d-e). Morevoer, the levels of CXCR4 mRNA expression were markedly reduced in the escapees, compared to unedited clones (Extended Data Fig. 14g, red box vs. grey box, set as 1), due to specific decreased expression of the corrected allele (Extended Data Fig. 14h), while the opposite effect was observed upon introduction of the C194T change in the unmutated cell line BJAB (Extended Data Fig. 14g, blue box vs. grey box, set as 1). Together, these results are consistent with dependency of the mutant cells on the CXCR4-SE mutation, and confirm a direct link between SE mutations in this region and deregulated gene expression through escape from NR3C1-mediated suppression.
With one exception, mutations in the NR3C1 binding site of the CXCR4 SE (overall, 4.8% of cases tested; n=15/315) were observed in the absence of NR3C1 coding mutations (Extended Data Fig. 14i and Supplementary Table 4) and correlated with increased CXCR4 transcript levels (Extended Data Fig. 14j; see also panels 14k,l for distribution in distinct DLBCL classes). This site was also found mutated in 8% of FL cases but not in other cancer types (Extended Data Fig. 10 and Supplementary Table 5), consistent with specific selection for DLBCL and FL. Together with the oncogenic role of CXCR4 in WM, these findings reveal this chemokine receptor as a potential dysregulated oncogenic target in DLBCL.
DISCUSSION
The present study describes a pervasive AID-mediated SHM phenomenon that targets active E/SEs in DLBCL and hijacks the transcriptional control of multiple oncogenes. Prior studies have shown AID-mediated SE hypermutation in mice as well as in the Ramos BL cell line and a few human DLBCL cases19,20. Compared to these studies, our results offer a comprehensive picture of the extent and tumor-specificity of SE-SHM in DLBCL, and provide evidence for the functional consequences and oncogenic role of the phenomenon.
Several conclusions can be drawn from our results. First, while the targeting of SEs by AID can occur in normal GC B cells and leads to hypermutation in few genes45–47, the magnitude of this effect is markedly more pronounced in DLBCL both in terms of number of mutations (>130 fold higher in DLBCL vs. normal memory B cells), type of SEs involved (see SEs hypermutated only in DLBCL and not in normal B cells), and tumor-specific selection of particular mutations. These findings are consistent with previous work showing that the 5’ sequences of a subset of specific loci are physiologically targeted by SHM in human GC B cells (e.g. IG genes, BCL6)45–47, while others are aberrantly hypermutated in DLBCL, including MYC, PAX5, and BCL29,16,39. In mouse GC B cells, inactivation of MMR and BER genes has been shown to lead to aberrant SHM targeting, analogous to that seen in DLBCL40. However, human DLBCL tumors do not commonly carry inactivation of these pathways48, as now confirmed from the analysis of over 2,000 cases in the western population1,3–5,49. Therefore, the mechanism distinguishing physiological versus DLBCL-associated targeting remains unknown.
Given the pervasive nature of the SE SHM phenomenon, its functional consequences will need to be examined for each of the many involved SEs. In the case of the BCL6-iSE, the results confirm previous reports on its hypermutation targeting 45–47 and reveal a clear selection, and a clear addiction to specific tumor-associated mutations that prevent BLIMP1 binding and transcriptional suppression of BCL6, a physiological event in the late stages of the GC reaction 9. This suppression is required for B cells to exit the GC and become memory B cells or plasma cells, while constitutive expression of BCL6 leads to lymphomagenesis in mice50. The abrogation of BLIMP1 binding would be at least in part analogous to chromosomal translocations substituting the BCL6 promoter region with sequences unresponsive to BLIMP1, or to genetic inactivation of the PRDM1 gene itself. The observation that these events are largely mutually exclusive in DLBCL suggests that they represent alternative mechanisms selected for the same functional and oncogenic consequences.
The BCL2 intragenic SE was identified as a second target of hypermutation, consistent with previous reports on the involvement of its first non-coding exon39,9. These mutations prevent the transcriptional repression of BCL2 by the glucocorticoid receptor NR3C1, in line with a previous suggestion based on in silico analysis51, and identify a novel pathway contributing, together with BCL6, to the physiological downregulation of BCL2 in GC B cells, where this protein is normally not expressed39. Since inactivating mutations of NR3C1 and mutations of its binding site in the BCL2-SE are rarely occurring in the same tumor (1/328 cases), one of the main functions of NR3C1 inactivation may in fact be the release of BCL2 transcription. Finally, the frequent occurrence of NR3C1 BS mutations in cases with BCL2 translocations supports the hypothesis that these alterations could be additive in dysregulating BCL2.
The identification of CXCR4 as an additional target of NR3C1-mediated suppression, which is deregulated as a consequence of mutations in its linked SE, has implications for the role of both genes in GC physiology and DLBCL pathogenesis. CXCR4 is a known oncogenic driver in WM44. Our data suggest it may play an analogous role in DLBCL. Consistent with its specific expression in the GC DZ, SE hotspot mutations are prefentially associated with the GCB-DLBCL subtype, where they may prevent LZ-associated downregulation43. Based on the known function of CXCR4 in the GC, we speculate its dysregulated expression may lead to altered GC dynamics and prolonged retention of B cells within the highly mutagenic environment of the DZ. The additional evidence provided here for impaired NR3C1 activity in causing oncogene deregulation strongly suggests a critical and unexpected role of the steroid signaling pathway in GC regulation and DLBCL pathogenesis, with implications for the role of corticosteroid therapy in this disease.
Given the pervasive nature of SE-SHM, the demonstration of its clearly relevant consequences on the BCL6, BCL2 and CXCR4 oncogenes represents only proof-of-concept examples. These examples need to be expanded with specific regard to the three loci (additional BCL6-linked SEs are hypermutated), as well as to the large number of additional hypermutated SEs not investigated here, and linked to biologically and pathogenetically important genes. We anticipate that this new layer of genetic alterations will identify novel mechanisms of dysregulation for known oncogenes, as well as new dysregulated genes and pathways, with implications for precision classification and therapeutic targeting of DLBCL.
METHODS
Cell lines.
The human DLBCL cell lines BJAB, DB, DOHH2, FARAGE, HBL1, HT, Karpas-422, OCI-LY18, OCI-LY1, OCI-LY3, OCI-LY7, OCI-LY8, WSU-DLCL2, RCK8, RIVA, SUDHL10, SUDHL2, SUDHL4, SUDHL5, SUDHL6, SUDHL16, NUDHL1, U2932, TOLEDO, HLY1, TMD8, RL and PFEIFFER, as well as their derivative clones, were grown in Iscove’s modified Dulbecco’s medium (IMDM) supplemented with 10% heat-inactivated fetal calf serum (FCS)(Sigma Aldrich), 100 U/ml penicillin and 100 μg/ml streptomycin. LY10 cells were grown in IMDM supplemented with 20% human plasma, 0.1% β-mercaptoethanol, 100 U/ml penicillin and 100 μg/ml streptomycin. HEK293T cells used for lentiviral particle production were grown in DMEM (Gibco) supplemented with 10% FCS, 100 U/ml penicillin and 100 μg/ml streptomycin. Cells were maintained at 37°C in humidified incubators under 5% CO2. All cell lines tested negative for Mycoplasma contamination and were verified for identity by STR profiling and/or by analysis of known somatic single nucleotide variants (SNVs), detected by WGS.
DLBCL study panels.
The Discovery Panel included 29 DLBCL cell lines and 93 matched tumor/normal samples from patients diagnosed with DLBCL. Of these, 21 cell lines and 20 primary cases were processed at the Institute for Cancer Genetics and sequenced as described in the WGS section. Raw sequencing reads from the remaining 73 tumor/normal pairs were downloaded from the EGA (dataset accession number EGAD00001004142) in the form of fastq files. Data for the remaining 8 cell lines (LY1, NUDHL1, DB, LY7, DOHH2, WSU-DLCL2, SUDHL6, Karpas-422) were downloaded from the NCBI Sequence Read Archive (SRA) using accession number SRP02023752. The Extension Panel included 150 DLBCL cases with WGS data (dataset accession number EGAD00001006087 and dbGaP phs000235.v14.p2)9,34 and 169 primary cases analyzed by targeted Sanger sequencing2,39,53, which were used to validate the hypermutated BCL6, BCL2 and CXCR4 SEs. An overview of the DLBCL study panel is available in Supplementary Table 4. The study was approved by the Institutional Review Boards of Columbia University and Rutgers University as exempt human subject research under regulatory guideline 45 CFR 46.101(b) (secondary research using data or specimens not collected specifically for the study, and including deidentified archived pathological specimens).
Other tumors.
For the analysis of E/SEs in Burkitt lymphoma (BL) and chronic lymphocytic leukemia (CLL), WGS and mutation data were obtained from: Grande et al.54 (n=108 BL cases) and Puente et al.55 (n= 56 IGHV-mutated and 70 IGHV-unmutated CLL cases). WGS and mutation data from an additional large cohort of lymphoid (n=43 DLBCL, 36 FL, 17 BL) and non-lymphoid biopsies (n=1,592 cases across the spectrum of cancer) were downloaded from the International Cancer Genome Consortium (ICGC) data portal in the form of simple somatic mutations, and are available at https://pcawg.xenahubs.net:443. A detailed list of the tumor types interrogated is provided in Supplementary Table 5.
DNA extraction and WGS.
High molecular weight genomic DNA was extracted from 21 cell lines and 20 primary DLBCL biopsies according to standard phenol chloroform or salting out procedures. Matched normal DNA was obtained for all patients from peripheral blood granulocytes, saliva, or bone marrow, using the same protocols. DNA was quantitated by the Quant-iT PicoGreen reagent (Invitrogen) and verified for integrity by gel electrophoresis. WGS was performed at Beijing Genomics Institute (BGI, Hong Kong, China) on the BGISEQ-500 System (paired-end, 2×100 bp) to achieve a >30x mean coverage depth.
WGS data analysis.
For all samples in the Discovery Panel, the Burrows-Wheeler Aligner software (BWA v0.7.12) was used to align reads to the reference genome hg1956. Base quality recalibration and duplicates removal were performed using GATK (v3.7) and Picard tools (v1.92) with default settings. The resulting BAM files were sorted and indexed using Samtools (v0.1.19)57. We obtained on average 1.22 billion passed-filter paired-end reads per sample (range, 0.88–2.74 billion), with a mean coverage depth of 38x (range, 28–85x), and >90% of the genome covered at >20x depth. WGS data from 150 DLBCL cases in the Extension Panel were analyzed as published10,34.
Somatic sequence variant calling.
For primary cases, Strelka2 (v2.9.9)57 was used in its default settings to identify somatic mutations in tumors using their respective paired normal samples. Variants marked ‘PASS’ by Strelka were retained and annotated using SnpSift (v4.3) and the dbSNP database (build 150), prior to additional filtering based on the following criteria: i) variant allele frequency (VAF) ≥5% and total coverage depth ≥10 in the tumor sample; ii) VAF ≤1%, alternative allele depth <2, and total coverage depth ≥20 in the normal sample; iii) not present in any of the 93 normal genomes. This approach ensured the comprehensive detection of true somatic variants (i.e. changes present in tumor DNA and absent in normal DNA), even if annotated in the dbSNP or GnomAD58 database, as these may represent somatic events reflecting the mutagenic activity of AID although coinciding with previously annotated population variants. For the DLBCL cell lines, Strelka2 was used in its default tumor-only mode and variants were retained as somatic if VAF ≥20%, alternate allele depth ≥2, and total coverage depth ≥5. In addition, due to the lack of matched control DNA, we excluded both common (minor allele frequency (MAF) >0.05) and rare (MAF <0.01) variants found in the dbSNP (build 150) and GnomAD databases, as well as variants detected in any of the 93 normal genomes, with the exception of those targeting the BCL6 and BCL2 mutational hotspots documented as somatic in origin in paired tumor/normal primary cases. Mutation calls for the 150 primary cases of the Extension Panel were obtained with Strelka2 as described9,34, applying the filters and criteria defined above. The robustness of the variant calling approach and the somatic origin of selected BCL6 and BCL2 hotspot mutations were independently validated by Sanger-sequencing analysis of 15 representative mutations, which provided a 99% concordance rate. The same criteria were applied to the analysis of BL and CLL.
Copy-number analysis.
CN data for BCL6, BCL2, CXCR4, BLIMP1, and NR3C1 were extracted from WGS data as described in Ref. 9,34 (n=225 tumor/normal pairs) or from Affymetrix SNP6 array data (n=79 pairs) using the pipeline described in detail in Ref. 2, and were previously reported. For the remaining 20 pairs, Sequenza59 was used in its default settings to simultaneously assess tumor content and detect genome-wide somatic CN changes, using WGS data. A previously established pipeline2,53 was then used to manually curate the segmentation profiles, adopting the following cutoffs to call segments of somatic CN changes: CN ≤ 1.7 for heterozygous deletions, CN ≤ 0.9 for homozygous deletions, CN ≥2.3 for CN gains, and CN ≥4 for high CN amplifications.
Detection of gene rearrangements and structural variants.
To detect structural variants (SVs) in the 93 discovery cases and 150 extension cases with available WGS data, the SvABA60 and Manta (v1.6.0) 61 tools were used in their default settings for tumor/normal pairs. SVs detected by both algorithms were considered for downstream analyses. In 69/93 discovery cases and 178/319 extension cases, chromosomal rearrangements of the BCL6 and BCL2 loci were also assessed by FISH analysis using break-apart probes as published34. Cases were considered translocation-positive if the rearrangement was detected by either Manta and/or FISH.
Identification of significantly mutated regions by FishHook.
FishHook26 was used for genome-wide unbiased identification of mutational hotspots in the 93 primary DLBCL cases of the Discovery Panel. In brief, bedtools62 was used to divide the genome into 1kb non-overlapping windows, which were intersected with the list of somatic variants detected in the same cases (n=2,021,231). The resulting matrix was used as input for FishHook, which calculates the mutation enrichment using a Gamma-Poisson regression and assigns false discovery rates (FDR) to the significance level of each window. Regions with FDR<10−6 were considered significantly mutated.
Sanger sequencing of the BCL6-iSE, BCL2-SE and NR3C1 coding exons.
PCR amplification and Sanger sequencing were performed to interrogate an additional cohort of DLBCL primary cases for the presence of mutations in the BCL6-iSE (169 cases), BCL2-SE (120 cases), CXCR4-SE (72 cases), and the NR3C1 coding exons (85 cases). The oligonucleotides used in these experiments are listed in Supplementary Table 6, and PCR conditions are available upon request.
Chromatin Immunoprecipitation and sequencing (ChIP-seq).
ChIP on the 29 cell lines was performed using 5 million cells/sample as previously described63. Briefly, cells were cross-linked with 1% formaldehyde for 10 min at RT, quenched by the addition of glycine to a final concentration of 0.125 M, and frozen in dry ice until final use. The TruChIP High Cell Chromatin Shearing Kit with SDS (Covaris) was used for cell lysis and nuclei isolation, followed by sonication in an S220 Ultrasonicator (Covaris) to a chromatin fragment size distribution of 200–500 bp. Sheared chromatin was incubated overnight with 4µg of anti-H3K27Ac antibodies (Diagenode, cat#C15410196, lot#A1723–0041D; and Active Motif, cat#39133, lot#01613007, in separate reactions for each sample). Immune-complexes were collected with protein A magnetic beads over a 4hr incubation, and washed sequentially at increasing stringency before reverse cross-linking. Following RNAse and proteinase K digestion, DNA fragments were purified using the MiniElute Reaction Clean Up Kit (Qiagen) and quantified by Quant-iT PicoGreen dsDNA Reagent (Life Technologies). Barcoded ChIP-seq libraries were constructed starting from 3 ng of immunoprecipitated or input DNA as reported63, quantified using the KAPA SYBR FAST Universal qPCR Kit (KAPA Biosystems) according to protocols, normalized to 15nM, and pooled for sequencing on an Illumina HiSeq 4000 instrument as paired-end 150 bp reads, obtaining on average 58×106 reads/sample (see also Refs 63,64)63,64. H3K27Ac, H3K4me3, H3K4me1, and H3K27me3 ChIP-Seq data from two independent pools of human GC B cells (CB4 and CB5) were obtained using the same protocol and are available in the GEO database under Accession No. GSE89688.
ChIP-seq analysis.
Sequencing data were processed according to the default Illumina pipeline using Casava V1.8. Raw reads were mapped to the human genome GRCh37 assembly using the Hisat2 aligner, allowing up to two mismatches and the following parameters: hisat2 --add-chrname --score-min C,2 --rdg 100,100 --rfg 100,100 --mp 1,1 --no-softclip --no-spliced-alignment --ignore-quals. To eliminate PCR bias, duplicate reads (reads of identical length mapping to exactly the same genomic locations) were removed with Samtools v1.12 using the rmdup option56. Peaks were identified using ChIPseeqer v2.165, enforcing a minimum fold change of 2 between ChIP and input reads, a minimum peak width of 100 bp, and a minimum distance of 100 bp between peaks. The P value threshold for statistical significance of peaks was set at 10−15 for H3K27Ac, H3K4me1, H3K4me3, and H3K27me363,64, and peaks overlapping with the Encode Blacklist66 or an internal manually curated signal artifact blacklist were discarded. Only peaks (regions) detected in both biological replicates or, for GC B cells, in both GC B cell pools were considered in downstream analyses. The same bioinformatics pipeline was applied to raw H3K27Ac data from 7 primary large cell lymphoma cases (5 DLBCLs, 1 primary mediastinal B cell lymphoma, and 1 B cell lymphoma unclassifiable with features intermediate between BL and DLBCL), available in the GEO database with Accession No GSE6955823.
Defining active E, SEs and promoters.
Chromatin domains decorated by H3K27Ac were defined as classic Es or SEs based on the ROSE algorithm, as published22. In brief, ROSE identifies enhancers as regions of enrichment for H3K27Ac that do not overlap with known gene promoters (±2 kb from TSS), unless within a larger H3K27Ac chromatin domain, after concatenating those located within 12.5 kb distance. The cut-point between Es and SEs was defined on the enrichment profile as the inflection point of the H3K27Ac signal intensity versus the concatenated enhancer rank. H3K27Ac peaks mapping within −2kb and +1kb from a TSS were defined as promoters, unless embedded within an intragenic SE. Promoters, Es and SEs were further validated as active vs. primed/poised based on their enrichment for H3K4me1 (histone mark prominent on active E/SEs), H3K4me3 (histone modification associated with active promoters), and H3K27me3 (enriched at poised promoter/enhancers)67. E/SEs were further distinguished in intergenic (>2kb upstream to TSS), intragenic encompassing a promoter (i.e. embedding a TSS marked by H3K4me3), and intragenic not encompassing a promoter (i.e. intronic/exon regions located >2kb from a TSS and not overlapping with H3K4me3). This analysis was performed on the entire set of shared E/SEs common to normal and malignant GC B cells, which represent the ones harboring the highest mutation frequency (Fig. 1 and Extended Data Fig. 6), and is displayed in Extended Data Fig. 5, with promoter regions as a reference.
Unsupervised hierarchical clustering of super-enhancers in DLBCL cell lines.
SE regions identified in the 29 DLBCL cell lines and 2 GC B cell samples (n=3,775) were hierarchically clustered to display the relationship between the enrichment in H3K27Ac and individual samples. To this end, ChIP-Seq read counts were normalized using the variance stabilizing transformation function available in the DEseq2 R package68, and k-means clustering (k=12) was used to find signal patterns between regions, while hierarchical clustering based on Pearson correlation was used to determine patterns between samples. These data are displayed in two-dimensional clustered heatmaps in Fig. 1a.
Defining hypermutated E/SEs.
To assess whether E/SEs were preferentially targeted by mutations in DLBCL, mutation frequencies were calculated separately for each sample, as the number of somatic variants detected per Mb within every genomic domain, including active E/SEs, inactive E/SEs, control randomly selected regions, and the “rest of the genome” (background mutation frequency). The latter corresponds to the size of the human reference hg19, after exclusion of i) the IG loci, which are hypermutated in physiological conditions (chr14:106,000,000–107,340,000; chr2:89,107,000–90,573,000; and chr22:22,350,000–23,307,000), and ii) the active E/SEs of the respective cell line (or, for primary DLBCL cases, the union list of all E/SEs identified across the entire set of 29 cell lines and normal GC B cells). In the 29 DLBCL cell lines, regions were defined according to the following criteria: i) active E/SEs: E/SEs called by the ROSE algorithm22 in the individual cell line under investigation; ii) inactive E/SEs: regions called by ROSE as active E/SEs in other cell lines but not in the cell line under investigation; iii) control random regions: randomly selected 40Kb (i.e., the mean size of a SE) or 6Kb (i.e. the mean size of an Es) genomic regions in the “rest of the genome”, equivalent in size to the union of the SEs (or Es) active in each cell line (size range = 7 to ~25Mb/cell line), with 100 permutations. For the primary cases, which lack matched ChIP-Seq data, mutation frequencies in active E/SEs were calculated as the number of detected somatic variants per Mb in the union of all E (or SE) regions called by ROSE across i) the 29 cell lines and 2 GC B cell pools (n=35,697 Es and 3,775 SEs); ii) ABC-DLBCL cell lines only; iii) GCB-DLBCL cell lines only; iv) GC B cells only; or in the set of E/SEs overlapping between GCB-DLBCL cell lines, ABC-DLBCL cell lines, and GC B cells (“shared” E/SEs). These data are reported in Fig. 1b, d and Extended Data Fig. 6a,b, as fold changes relative to the background mutation frequency in the same cell line or biopsy, set as 1.
To determine the percentage of hypermutated domains in each sample, individual regions (active E/SEs, inactive E/SEs, and randomly selected regions) were defined as hypermutated if fulfilling the following criteria: i) significantly higher mutation frequency with respect to the background mutation frequency in the same sample (Chi-squared test after BH correction, FDR <0.05); and ii) containing ≥ 3 variants with intermutation distance (IMD) of ≤1kb (irrespective of allelic distribution, which is consistent with the bi-allelic activity of the AID-mediated SHM process). These analyses are reported in Fig. 1c, e and Extended Data Fig. 6c.
The non-parametric Wilcoxon rank-sum test after BH correction was used for pairwise comparisons of mutation frequency (fold changes) and % of hypermutated E/SEs, and differences were considered significant if FDR<0.05 after correction. Enrichment of the hypermutated SEs in ABC- and GCB-DLBCL subtypes were calculated using the Fisher’s exact test, and the list of recurrently mutated E/SEs is reported in Supplementary Table 2. The same methodology and statistics were adopted to assess the mutational targeting of these regions in BL and CLL.
Measurement of mutation frequencies at promoters.
For the assessment of mutation frequencies at active promoters (Extended Data Fig. 5), H3K4me3+ H3K27Ac+ TSS-proximal regions were classified as SE-embedded, E-embedded, and classical active promoters based on the overlap with the list of E/SEs identified by ROSE. Criteria and statistical tests used for the mutational analysis of promoters were as described in the previous paragraph.
Mutation frequency at the BCL6-PRDM1-BS, BCL2-NR3C1-BS and CXCR4-NR3C1-BS in various cancer types.
The percentage of cases carrying somatic mutations in the functionally dissected binding sites within the BCL6-, BCL2-, and CXCR4-SE across different tumor types was determined on an independent panel of 1,837 cases, consisting of 165 GC-derived lymphomas (43 DLBCL, 36 FL, 17 BL, and 69 IGHV mutated-CLL), 80 non-GC derived lymphoid malignancies (IGHV-unmutated CLL), and 1,592 other cancer types from the ICGC pan-cancer project (https://dcc.icgc.org/projects). As control, we randomly selected 15bp domains located between 0.5kb and 3kb from the corresponding BS, within the same SE (BS-distal), and calculated the mean percentage of mutated cases in these regions across the same cases, with 100 permutations. The same approach was also used to analyze 10kb-distal 15bp domains, which were never found mutated (not shown).
LymphGen classification of DLBCL cases.
Assignment of DLBCL cases to genetic classes was obtained by applying the LymphGen tool (https://llmpp.nih.gov/lymphgen/index.php)12 to the 29 cell lines and 223 primary samples with available WGS data. Analysis was performed both as is (“original” in Extended Data Fig. 12) and after integrating BCL6-PRDM1-BS and BCL2-NR3C1-BS mutations, which were encoded as translocations in the pre-set source code publicly available for the classifier.
Assignment of E/SEs to target genes.
To assign intergenic E/SEs to target genes, we adopted the following set of rules: i) proximity to TSS of candidate target gene; ii) location within the same topologically associating domain (TAD), based on information obtained from HiC data of normal GC B cell samples (SRA study id: SRP077918)69; and iii) expression in DLBCL cell lines displaying histone activation marks in the linked SEs (by RNA-seq and ChIP-seq respectively). Intragenic and TSS-proximal E/SEs were assigned to the overlapping gene, provided it was expressed and its promoter was acetylated in the corresponding cell line. When a unique target could not be assigned based on these criteria, E/SEs were annotated with multiple targets.
Graphic representation of ChIP-seq occupancy.
Genome-wide average representations of ChIP-seq occupancy at SEs, Es, and promoters were created by mapping ChIP-seq read densities in either the 50 kb (Extended Data Fig. 2a) or 30 kb (Extended Data Fig. 2b) regions flanking the peak centers. Each region was split into 100 bp bins and the density of each bin was normalized to the total number of mapped reads scaled in units of reads per million mapped reads per bin. Heatmaps in Extended Data Fig. 2a show the z-score scaled signal density.
ChIP-qPCR.
The binding of BLIMP1 and NR3C1 to candidate hotspot mutated regions was assessed by ChIP followed by qPCR. Experiments were performed according to the protocol described above, using 15 million cells per reaction and 4µg of the rat monoclonal anti-BLIMP1 (anta-Cruz Biotechnology, clone 6D3, cat#sc-47732, lot#A0721) or rabbit monoclonal anti-Glucocorticoid Receptor XP (NR3C1) (Cell Signaling Technology, D6H2L, cat#12041S, lot #5), with corresponding amounts of IgG as control (Rat IgG, Santa-Cruz Biotechnology, sc-2026; Rabbit IgG, Diagenode, C15410206). The list of oligonucleotides used for downstream PCR amplification are reported in Supplementary Table 6.
Transcription factor binding motifs.
As an unbiased approach to identify transcription factors (TF) whose binding could be perturbed by the mutations, we first defined 20-bp mutational hotspots within the BCL6, BCL2 and CXCR4 SEs, which were affected in ≥4% of samples, using a 1bp sliding window. Tomtom from the MEME Suite web server (v5.0.5)70 was then used to predict motif enrichment within these mutational hotspot windows, using position weight matrices from three different motif databases including Jolma et. al.71, JASPAR2022_CORE vertebrates non-redundant, and the Swiss Regulon (all available within the MEME suite). TFs predicted by all three motifs databases and expressed in GC B cells were considered for downstream analyses.
RNA extraction, cDNA synthesis, and real-time PCR.
Total RNA was extracted using the TRIzol Reagent (Invitrogen), as per manufacturer’s instructions, and used for reverse transcription or RNA-seq library preparation. cDNA synthesis was performed from 2 µg of RNA using the SuperScript® First-Strand Synthesis System (Life Technologies). The list of oligonucleotides used for RT-PCR and qRT-PCR are reported in Supplementary Table 6.
RNA-seq analysis.
Total RNA was assessed for quality and quantified using the Bioanalyzer 2100 (Agilent), and samples with RIN>9 were used to generate RNA-seq libraries with the Illumina Stranded Total RNA Prep with Ribo-Zero Plus, followed by high throughput sequencing on the Illumina HiSeq 3000 (60M reads, 2×100bp mode). Sequencing reads were aligned to the human reference genome hg19 using the STAR RNA-seq aligner with default parameters (v2.7.2a)72. Gene expression counts were then obtained using featureCounts (v1.6.3)73 and normalized to Transcripts Per Million mapped reads (TPM). For the primary cases, STAR-aligned RNA-seq data were downloaded from the EGA using accession number EGAD00001003783, and processed according to the same pipeline. A cutoff of TPM = 1 was used to define above-background expression levels.
Measuring transcription at E/SEs.
To quantify the transcriptional levels at each E/SEs, TPM values were calculated from matched Ribo-Zero RNA-seq data using featureCounts (v1.6.3)73. The analysis was performed on cell line-specific E/SEs (overall, or separately for hypermutated and not-hypermutated), with inactive E/SEs as control. For the analysis of divergent transcription, sense and anti-sense transcripts were defined based on the transcript orientation of the overlapping gene. The latter analysis was performed on intragenic E/SEs only, as this allows to define the transcript orientation based on the overlapping coding gene.
De novo mutational signatures.
Single base substitution (SBS)-based de novo mutational signatures were inferred from variants detected in the SE regions of the 93 primary DLBCL cases (n=106,342 events) using the Palimpsest R package27. To assign a potential etiology to the identified signatures, we then calculated the cosine similarity between the top 3 SE signatures and the curated SBS mutational signatures in the COSMIC catalogue (version 3)28. Palimpsest was also used to calculate the contribution of these 3 signatures to the mutations found in the E regions and the rest of the genome (excluding SE and E regions).
AID motif enrichment analysis.
As an independent method to determine whether mutations found in SEs reflect the activity of AID, we queried their enrichment in R(G)YW and WR(C)Y motifs, a well-established preferential nucleotide targeting motif for this cytidine deaminase, across SEs and Es (defined as described in the corresponding section) in all cell lines and primary cases, using four-base sliding windows. C to T variants in WR(C)Y and G to A variants in R(G)YW defined mutated AID motifs. C to T and G to A variants in other four-base windows defined mutated non-AID motifs. The Fisher’s exact test was used to assess enrichment of variants in AID motifs vs. non-AID motifs.
Generation and analysis of CRISPR-Cas9 cell lines.
Genome engineering of DLBCL cell lines for the introduction of single nucleotide substitutions in the BCL6, BCL2 and CXCR4 SEs was performed using the Alt-R® CRISPR-Cas9 System (Integrated DNA Technologies). Specifically, Alt-R CRISPR RNAs (crRNAs) were designed using the GPP sgRNA Design tool (https://portals.broadinstitute.org/gpp/public/analysis-tools/sgrna-design) to target: i) the mutated allele in the BCL6-iSE in HLY1, LY18 and Karpas-422 (allele A in Fig. 3b); both alleles in the control unmutated cell line DOHH2; ii) all 3 alleles in the mutated LY10 cell line for BCL2-SE (the targeting of mutated alleles only was not possible since this cell line does not carry other mutations in the targeted region allowing specific design); iii) the mutated CXCR4-SE allele in HLY1 and RCK8, and both alleles in the unmutated control cell lines BJAB and Karpas-422; iii) all alleles in the neutral control region in the PPP1R12C intron 1 in all cell lines74. To increase the efficiency of the homology directed repair, single stranded DNA (ultramer DNA oligo, Integrated DNA Technologies) donor templates of 150bp spanning the targeted nucleotide were designed to have perfect homology to the flanking sequence(s) of the targeted allele within each cell line. All crRNAs and donor template sequences used in this study are provided in Supplementary Table 6. Complexes including specific crRNA, a tracerRNA labelled with ATTO™ 550 (Integrated DNA Technologies) and Alt-R s.p.Cas9 Nuclease V3 (Integrated DNA Technologies) were generated according to the manufacturer’s protocol and electroporated into cell lines together with 20 pmol of donor template DNA in 10 μL of Buffer R using the Neon System kit (ThermoFisher Scientific). Forty-eight hours after electroporation, ATTO™ 550-positive cells were sorted using the SH800 Cell Sorter (Sony Biotechnology), and single cell plated (n=600/crRNA) in order to determine the percentage of recovered clones and to isolate corrected/mutated clones. Single clones were individually analyzed for editing and repair by PCR amplification and direct sequencing, followed by inspection of the chromatograms both manually and using the Crisp-ID (v1.1) tool (http://crispid.gbiomed.kuleuven.be/). We note that this assay is not designed to measure increased fitness, as could be conferred by the reintroduction of hotspot mutations in a normal GC B cell, because the cell line models used are already transformed.
Protein Extraction and Immunoblot analysis.
Whole cell extracts were obtained from human cell lines in log phase of growth using NP-40 lysis buffer according to a previously described protocol75. For the extraction of nuclear proteins, cells were first resuspended in cytoplasmic extraction buffer (10 mM Hepes pH 7.5, 1.5 mM MgCl2, 10 mM KCl, 1 mM DTT, 0.5% NP-40) for 10 min and centrifuged at 500g for 10 minutes. After removing the supernatant, the nuclei pellet was incubated for 30 minutes in the nuclear extraction buffer (20 mM Hepes pH 7.5, 1.5 mM MgCl2, 450 mM NaCl, 1 mM DTT, 20% Glycerol) and centrifuged 10 minutes at 20000g. Clear nuclear extracts were isolated for downstream analyses. For use in reverse ChIP, potassium glutamate (10mM) and 1 volume of buffer G100 (20mM Tris pH7.4, 10% glycerol, 100mM KCl, 10mM potassium glutamate, 0.04% NP-40) with 0.2mg/mL of Poly(dA:dT) were added to 2.5 mg of nuclear protein extracts obtained from HLY1, LY10 or RCK8 DLBCL cell lines (used with BCL6-PRDM1-BS, BCL2-NR3C1-BS, and CXCR4-NR3C1-BS DNA baits, respectively). Protein extracts were resolved on Tris-glycine 4–12% gels for BCL6, 4–20% gels for BCL2, and 10% gels for BLIMP1 (Life Technologies) and transferred to nitrocellulose membranes (GE Healthcare) according to the manufacturer’s instructions. Antibodies used were: rabbit monoclonal anti-BCL6 (Cell Signaling technology, clone D683V, cat#14895S, lot #1, 1:2000), rat monoclonal anti-BLIMP1 (Santa-Cruz Biotechnology, clone 6D3, cat#sc-47732, lot#A0721, 1:500), mouse monoclonal anti-α-tubulin (Sigma-Aldrich, clone B512, cat#T6074, batch#0000118483, 1:2000), mouse monoclonal anti-HDAC1 (Upstate, clone 2E10, cat#05–614, lot#29602, 1:2000). Quantification of signal intensity was obtained in the ImageJ (v1.53r) software, and values are expressed as fold differences relative to the wild-type protein sample, set at 1, after normalization for the loading control.
Electrophoretic mobility shift assay.
Nuclear extracts were prepared from the 293T cell line transfected with a vector encoding HA-BLIMP1 or the empty vector, as described in the protein extraction section. Gel shift analysis was performed using approximately 3 μg of extract, the oligoprobes indicated in Fig. 4a, and an anti-HA antibody (Cell Signaling Technology, clone C29F4, Cat#3724S, lot#10) according to a previously published protocol 76.
Reverse Chromatin Immunoprecipitation (R-ChIP).
As a second unbiased approach to capture DNA-associated proteins, we adapted the R-ChIP protocol from Unnikrishnan et al77. Briefly, wild-type and mutant DNA baits for the BCL6-BLIMP1-BS, BCL2-NR3C1-BS, and CXCR4-NR3C1-BS were generated by PCR using a 5’-biotinylated forward primer and an unbiotinylated reverse primer (Supplementary Table 6), with the KAPA Hifi Hotstart polymerase (Fisher Scientific). PCR amplicons were purified with the Qiaquick PCR purification kit (Qiagen) and resuspended in DW buffer (20mM Tris pH8.0, 2M NaCl, 0.5nM EDTA, 0.03% NP-40). Wild-type and mutant DNA baits (7ug each) were then separately immobilized onto streptavidin-coated magnetic beads (Dynabeads M-280, Life technologies) overnight at 4°C. DNA-conjugated beads were incubated for 1h at room temperature in blocking buffer (20mM Hepes, 0.05mg/mL BSA, 0.3M KCl, 5mg/mL Polyvinylpyrrolidone, 0.05mg/mL glycogen, 2.mM DTT) and used for incubation with cleared nuclear extracts in buffer G100 for 3 hours at 4°C. Beads were then washed 4 times in buffer G200 (20mM Tris pH7.4, 10% glycerol, 200mM KCl, 10mM potassium glutamate, 0.04% NP-40) and proteins were eluted in 200uL of 1x NuPage LDS buffer with 200nM of DTT. Eluates were then centrifugated at maximum speed and supernatants were recovered to be used in the subsequent steps.
R-ChIP samples were separated on 4–12% gradient SDS-PAGE and stained with SimplyBlue (Thermo fisher Scientific). Protein gel slices were excised and in-gel digestion was performed as previously described78, with minor modifications. Gel slices were washed with 1:1 Acetonitrile and 100 mM ammonium bicarbonate for 30 min, then dehydrated with 100% acetonitrile for 10 min until shrunk, and dried at room temperature for 10 minutes after removal of excess acetonitrile. Gel slices were reduced with 5 mM DTT for 30 min at 56oC in an air thermostat, cooled down to room temperature, alkylated with 11 mM IAA for 30 min with no light, then washed with 100 mM ammonium bicarbonate and 100 % acetonitrile for 10 min each. Excess acetonitrile was removed and dried in a speed-vacuum for 10 min at room temperature and the gel slices were re-hydrated in a solution of 25 ng/μl trypsin in 50 mM ammonium bicarbonate for 30 min on ice and digested overnight at 37°C in an air thermostat. Digested peptides were collected and extracted in 5% formic acid: acetonitrile (1:2 volume ratio) at high speed. Supernatants from both extractions were combined and dried in a speed vacuum. Peptides were further desalted using SDB-RPS StageTip and dissolved in 3% acetonitrile/0.1% formic acid
Liquid chromatography with tandem mass spectrometry (LC-MS/MS).
Peptides were separated within 80 min at a flow rate of 400 nl/min on a reversed-phase C18 column with an integrated CaptiveSpray Emitter (25 cm x 75µm, 1.6 µm, IonOpticks). Mobile phases A and B were with 0.1% formic acid in water and 0.1% formic acid in acetonitrile. The fraction of B was linearly increased from 2 to 23% within 70 min, followed by an increase to 35% within 10 min and a further increase to 80% before re-equilibration. The timsTOF Pro was operated in PASEF mode79 with the following settings: Mass Range 100 to 1700m/z, 1/K0 Start 0.6 V·s/cm2, End 1.6 V·s/cm2, Ramp time 100ms, Lock Duty Cycle to 100%, Capillary Voltage 1600V, Dry Gas 3 l/min, Dry Temp 200°C, PASEF settings: 10 MSMS Frames (1.16 seconds duty cycle), charge range 0–5, active exclusion for 0.4 min, target intensity 20000, Intensity threshold 2500, CID collision energy 59eV. A polygon filter was applied to the m/z and ion mobility plane to select features most likely representing peptide precursors rather than singly charged background ions.
LC-MS/MS data analysis.
Acquired PASEF raw files were processed in MaxQuant97(version 2.0) open software environment utilizing the Andromeda search engine against the human UniProt reference proteome database (version 2014, containing 88993 entries). For protein identification and quantification, carbamidomethylation of cysteine residues (+57.021 Da) was set as static modification, while the oxidation of methionine residues (+15.995 Da) and deamidation (+0.984) on asparagine were set as a variable modifications. Enzyme digestion specificity was set to Trypsin and a maximum of two missed cleavages were allowed. Parent peptide mass tolerance and fragment peptide mass tolerance up to 4.5–20 ppm were allowed. A cut-off of 1% FRD was applied first at the peptide level and second at the protein level. Label-free quantitation (LFQ) was performed with a minimum of 1 peptide. Results obtained from the MaxQuant protein groups table were used for data analysis, after filtering out molecules not expressed in GC B cells, not localized in the nucleus, or not binding to DNA.
Statistical analysis.
To assess statistically significant differences between groups, p-values were calculated for continuous or categorical variables using the Fisher’s exact test, the Student’s t-test, and one-way ANOVA as indicated. For data with unequal distribution (as determined by the Kolmogorov-Smirnov test) the non-parametric Wilcoxon rank-sum tests was applied. Bonferroni correction or Benjamini-Hochberg FDR methods were used post-hoc for multiple hypotheses testing in the Graphpad Prism v8.0 software or by using in-house R/MATLAB scripts. Results were considered statistically significant when p-values were <0.05, unless otherwise specified. Data in Figures 3d, 4c-d, and Extended Data Figure 9b, 11e, 13e-f, and 14g,j are represented as boxplots, where the middle line is the median, the lower and upper hinges correspond to the first and third quartiles, and the whisker extends from the minimum to maximum values.
Extended Data
Extended Data Figure 1: Experimental strategy used for the identification of mutated E/SEs in DLBCL.
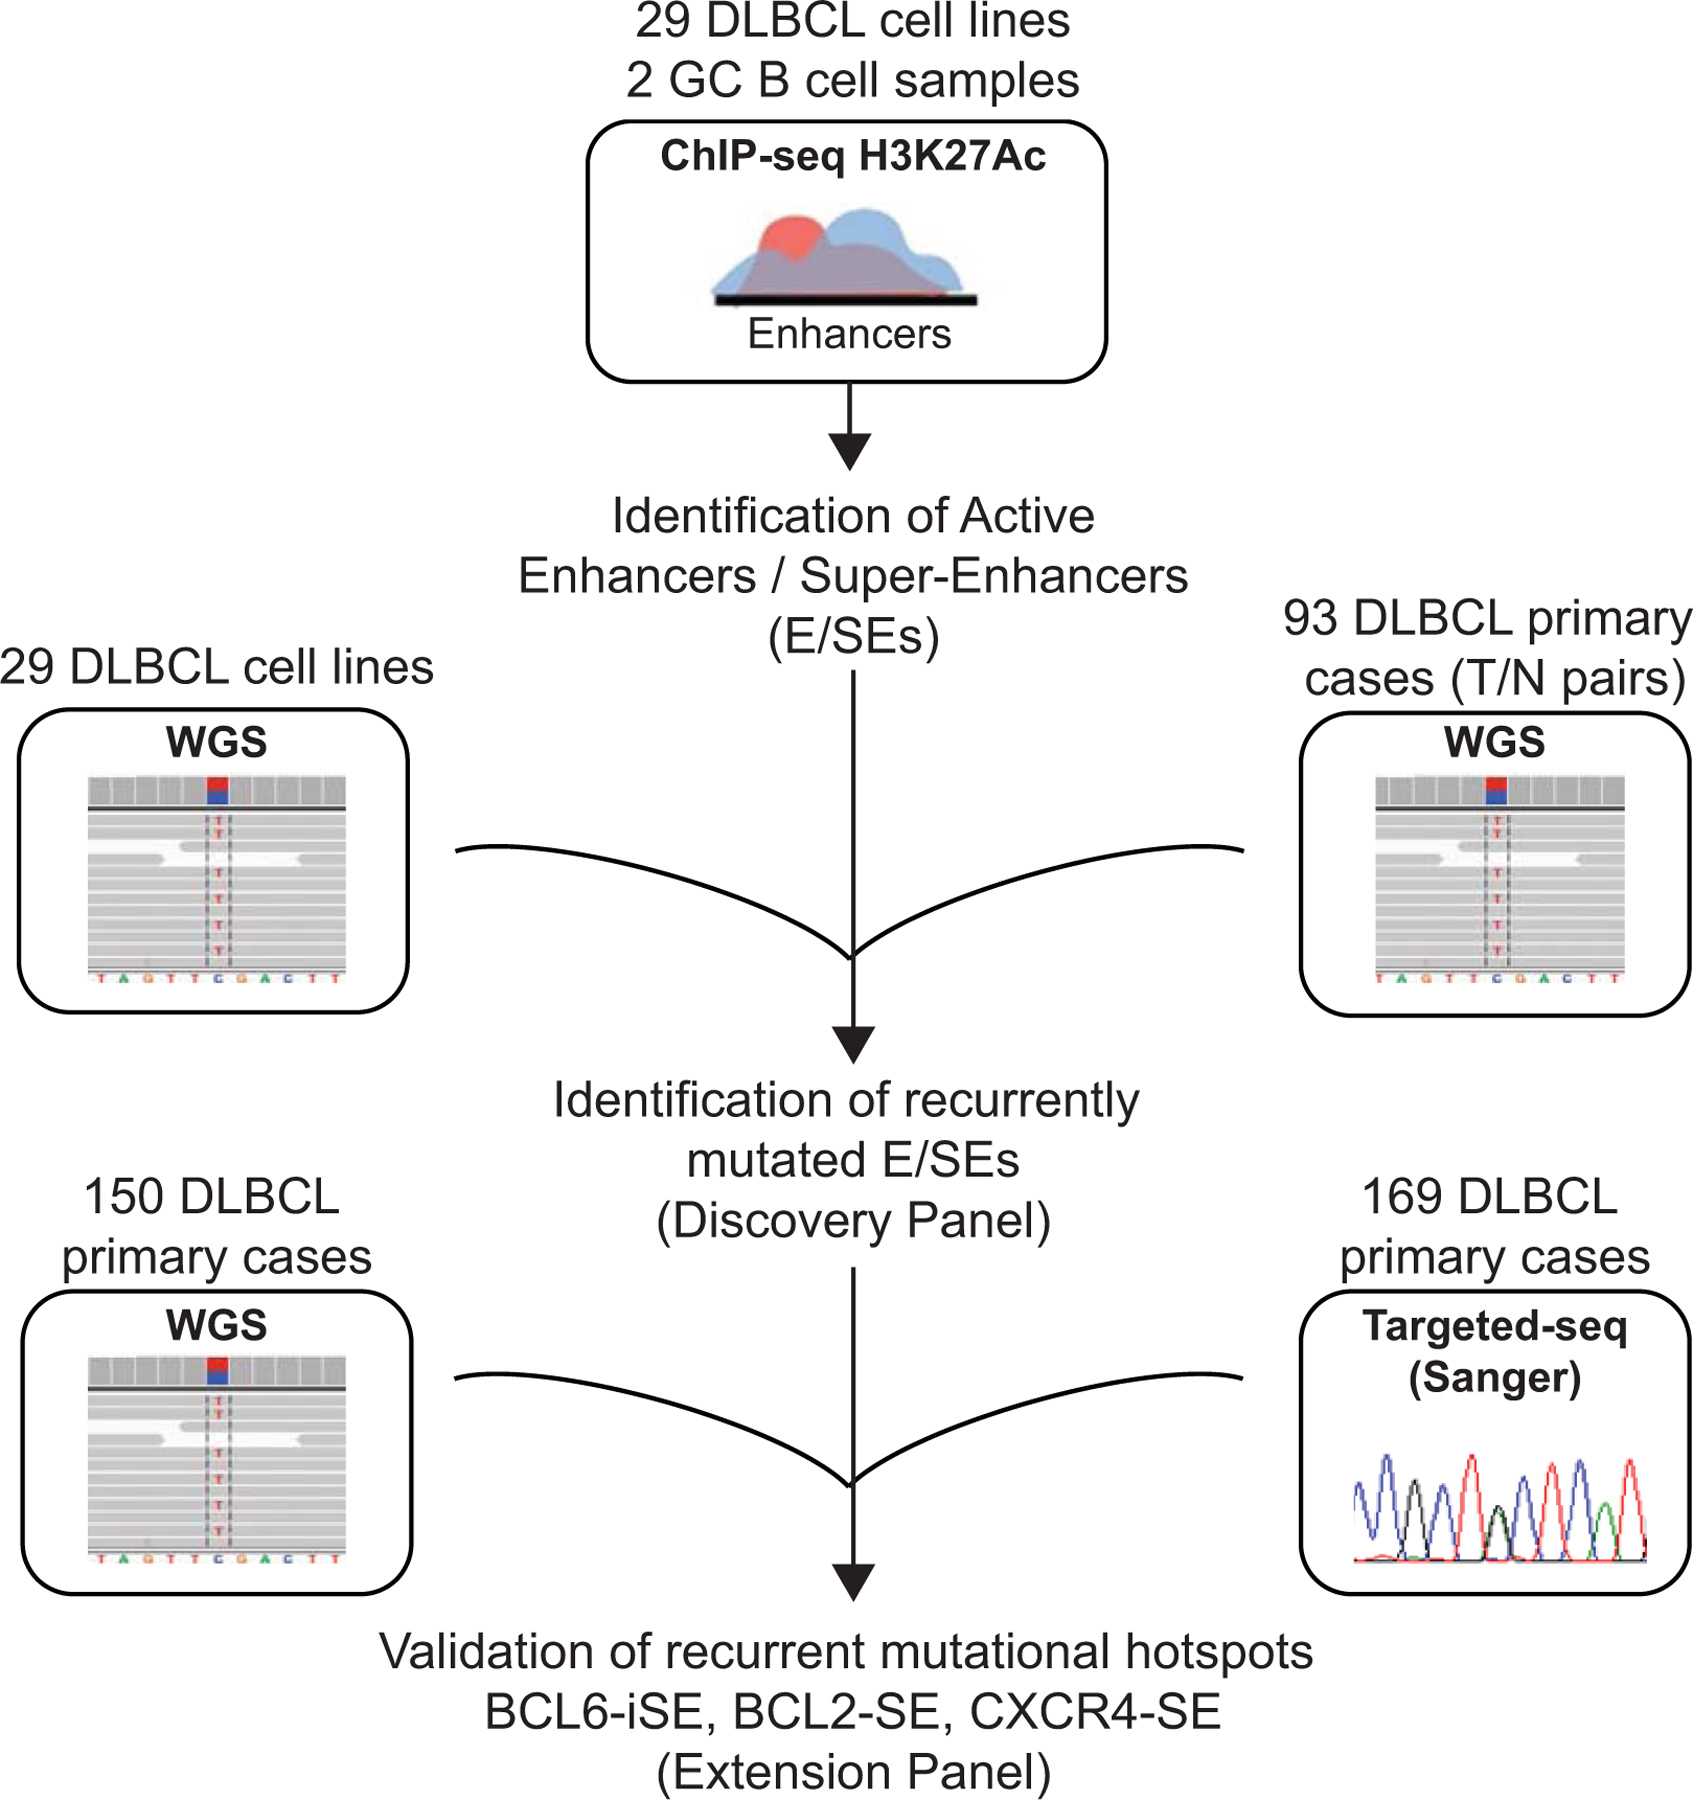
H3K27Ac ChIP-seq data were generated in duplicate from 29 cell lines and 2 independent pools of sorted human GC B cells, and used for the identification of active E/SEs based on the ROSE algorithm. The resulting list of E/SEs was intersected with the list of SNVs identified by WGS analysis in the same cell lines (matching each cell line to its own E/SEs) or in a panel of 93 de novo DLBCLs with matched normal DNA (Discovery Panel), to identify recurrently mutated E/SEs. An independent panel of 150 primary cases with WGS data and 169 primary cases with targeted-sanger sequencing data (Extension Panel) was then used to confirm the recurrent targeting of specific mutational hotspots identified in the BCL6-iSE, the BCL2 SE, and the CXCR4 SE.
Extended Data Figure 2: E/SEs identified by ROSE are enriched in H3K4me1 and recapitulate the E/SE landscape of primary large B cell lymphomas.
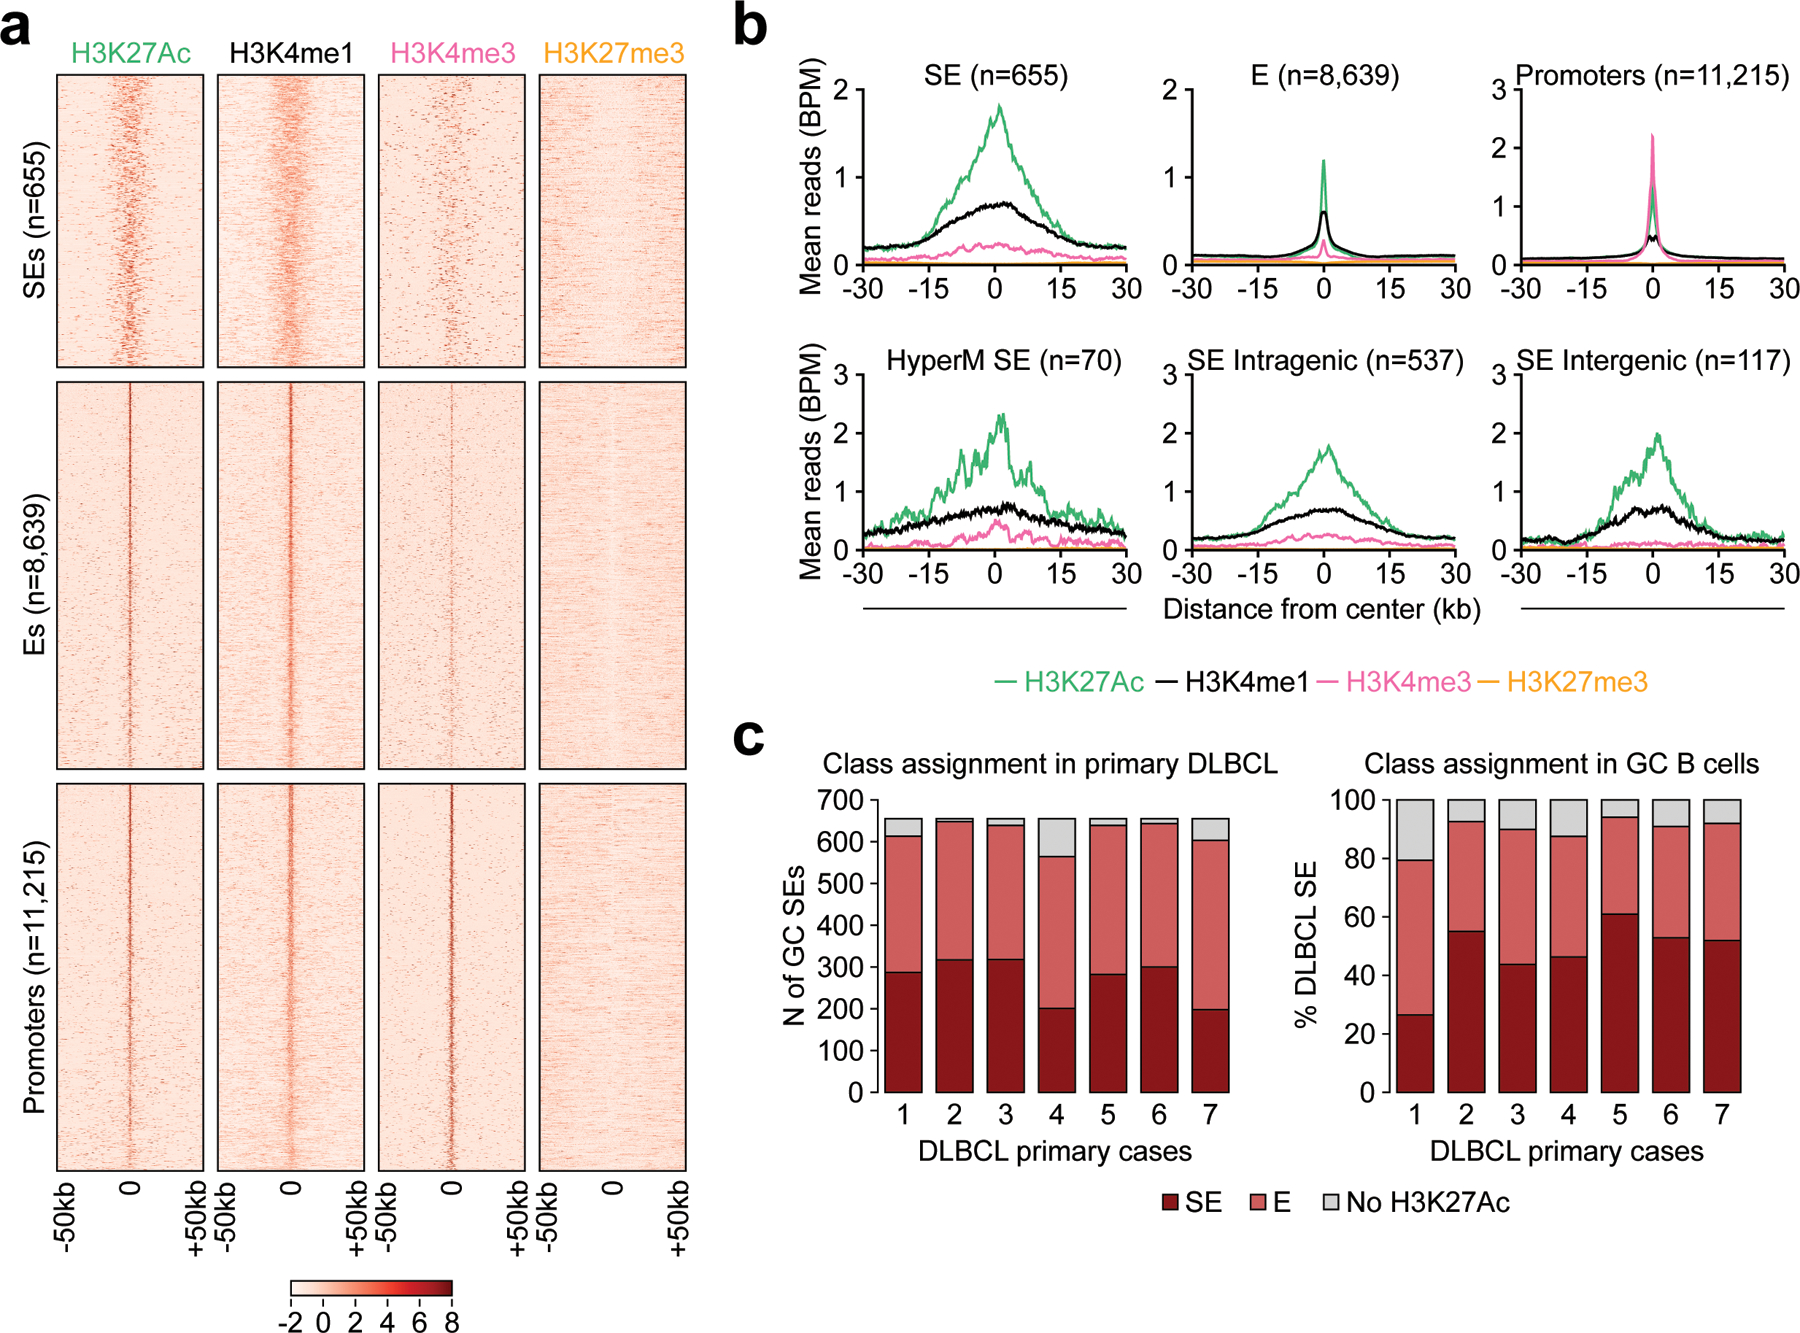
a. Heatmaps of the indicated histone mark signal at SEs, Es, and Promoter regions, defined as described in Methods. Shown are the 50kb regions upstream and downstream of the H3K27Ac peak center, set as 0. The color scale indicates the normalized z score. Data are shown for GC B cells and include all “shared” E/SEs found significantly hypermutated in DLBCL (Fig. 1b,d) as well as promoter regions. b. ChIP-seq density profiles of H3K4me1, H3K4me3, H3K27Ac and H3K27me3 at SEs, Es, and Promoter regions. The plots indicate normalized mean ChIP-seq density, relative to the H3K27Ac peak summit, set as 0. For the SEs, data are provided overall (top left) and separately for intragenic SEs, intergenic SEs, and the set of recurrently hypermutated “shared” SEs presented in Supplementary Table 2 (bottom). c. Left panel: number of H3K27Ac peaks nominated as SEs in the GC B cell pool CB4 (n=655) and also assigned to SEs (dark red) or classic Es (light red) in primary large B cell lymphoma cases. Data are provided separately for each of the 7 samples, and GC SEs not decorated by H3K27Ac in the primary samples are colored in grey. The reverse analysis is shown in the right panel, as the relative percentage of DLBCL-specific active SEs also found in normal GC B cells (dark red if active SEs, light red if typical Es) or not decorated by H3K27Ac in normal GC B cells (grey shade, representing ‘de novo’ SEs).
Extended Data Figure 3: Histone modification pattern of representative intragenic and TSS_distal SEs targeted by mutations in DLBCL.
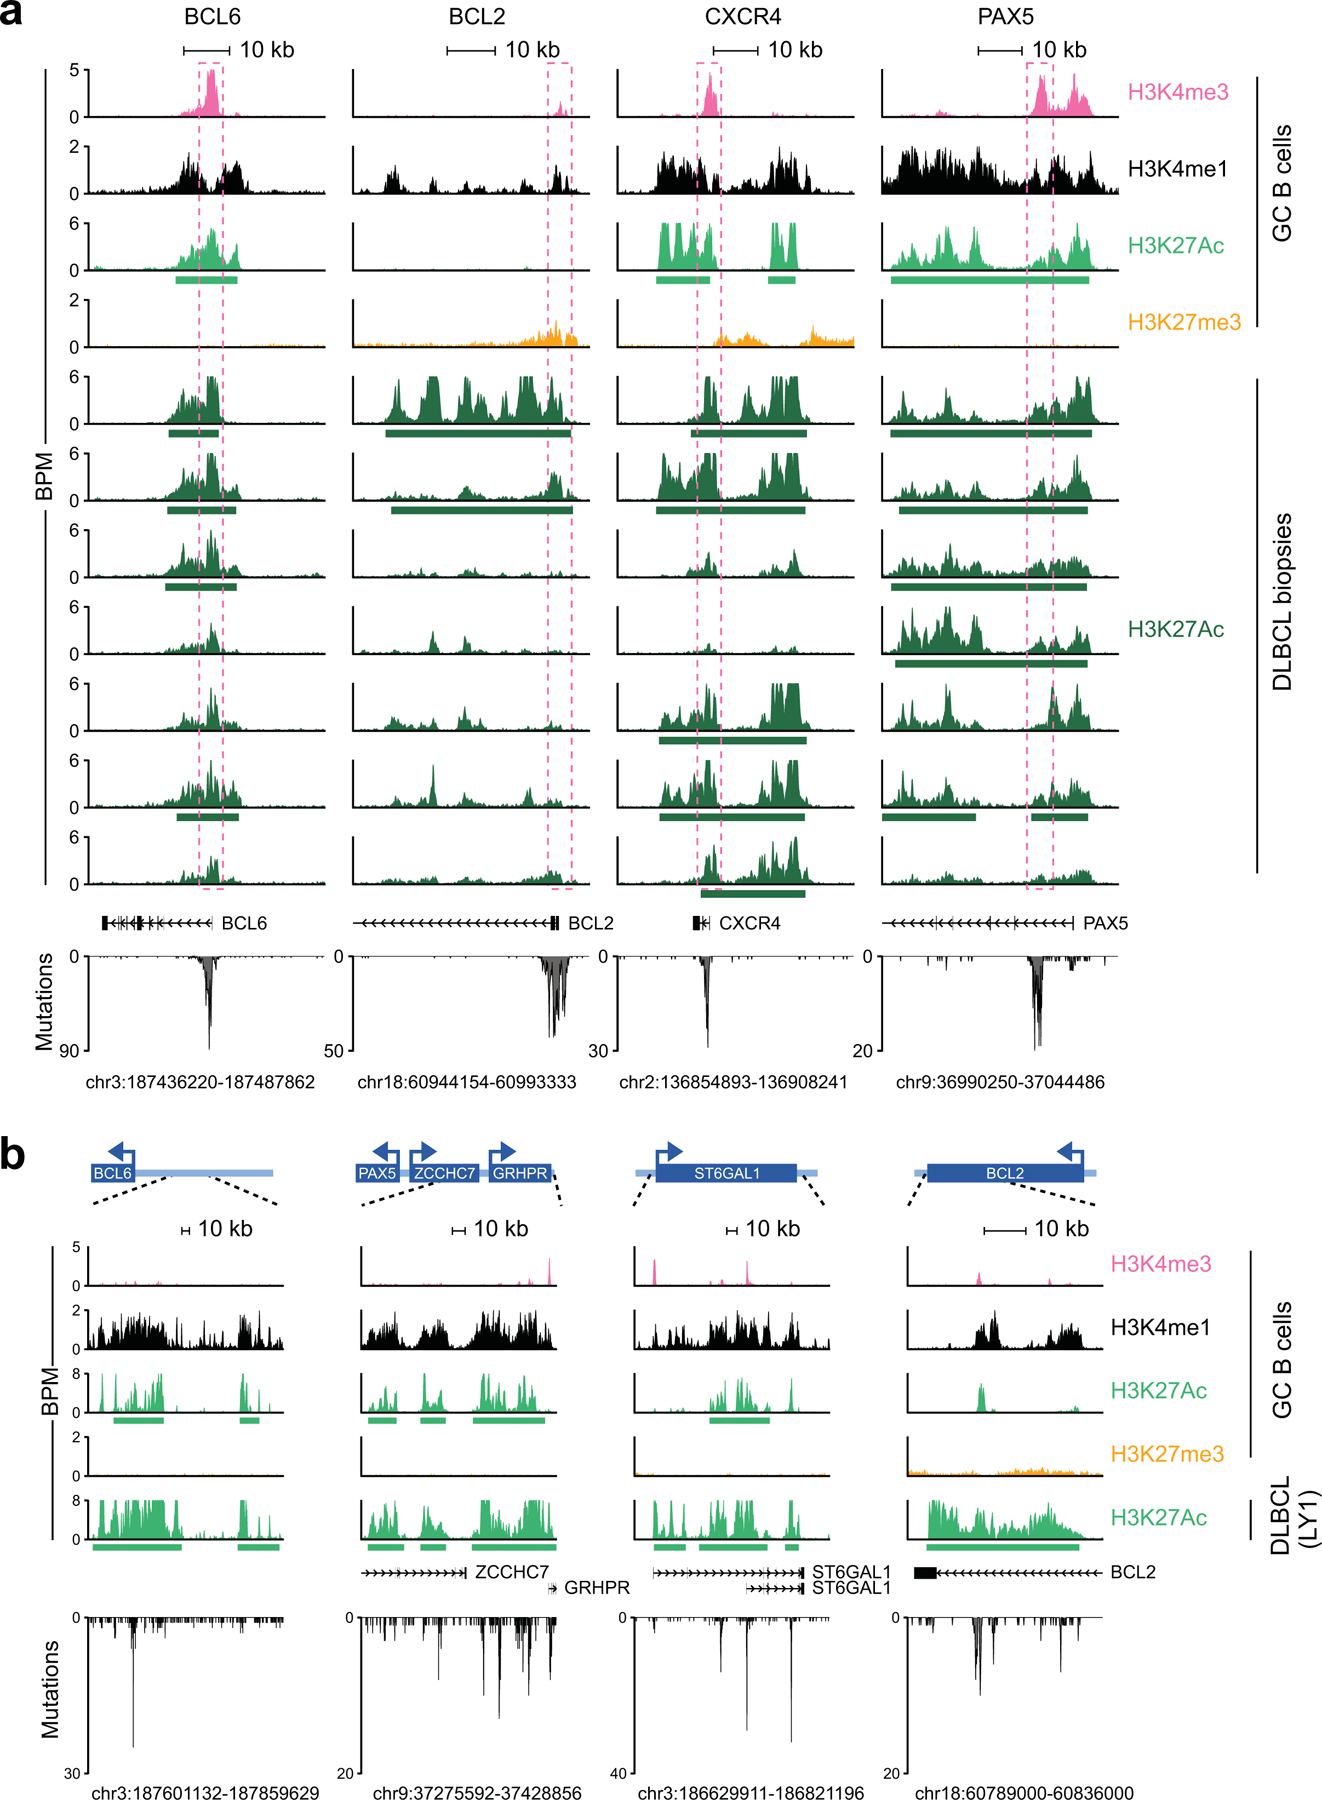
a. ChIP-Seq tracks of H3K4me3, H3K4me1, H3K27Ac, and H3K27me3 at representative intragenic ASHM-targeted SEs in normal GC B cells vs. primary B cell lymphomas. Enrichment is visualized as reads per bins per million bps (BPM), and the genomic coordinates of the region shown (hg19) are provided at the bottom, with the annotated coding gene/s (RefSeq accession No: NM_001706 for BCL6, NM_000633 for BCL2, NM_003467 for CXCR4, and NM_016734 for PAX5). Green horizontal bars below the H3K27Ac tracks indicate regions identified as SEs by ROSE. The dotted square indicates the hypermutated region. In the bottom panel, distribution and number of mutations identified in primary DLBCL cases. b. ChIP-Seq tracks of H3K4me3, H3K4me1, H3K27Ac, and H3K27me3 at representative TSS-distal, SHM-targeted SEs in normal GC B cells. H3K27Ac is also shown for the DLBCL cell line LY1. Enrichment is visualized as reads per bins per million bps (BPM), and green horizontal bars below the H3K27Ac tracks indicate regions identified as SEs by ROSE. The cartoon on top provides a broader view of the genomic region expanded below (dotted lines), with annotated coding genes represented as solid boxes and their promoter orientation indicated as an arrow (not in scale). The exact genomic coordinates (hg19) of the region magnified are provided at the bottom, and the distribution of somatic mutations found across the region in DLBCL (cell lines and primary cases) is plotted below the gene/s track.
Extended Data Figure 4: Transcriptional activity at active E/SEs targeted by ASHM.
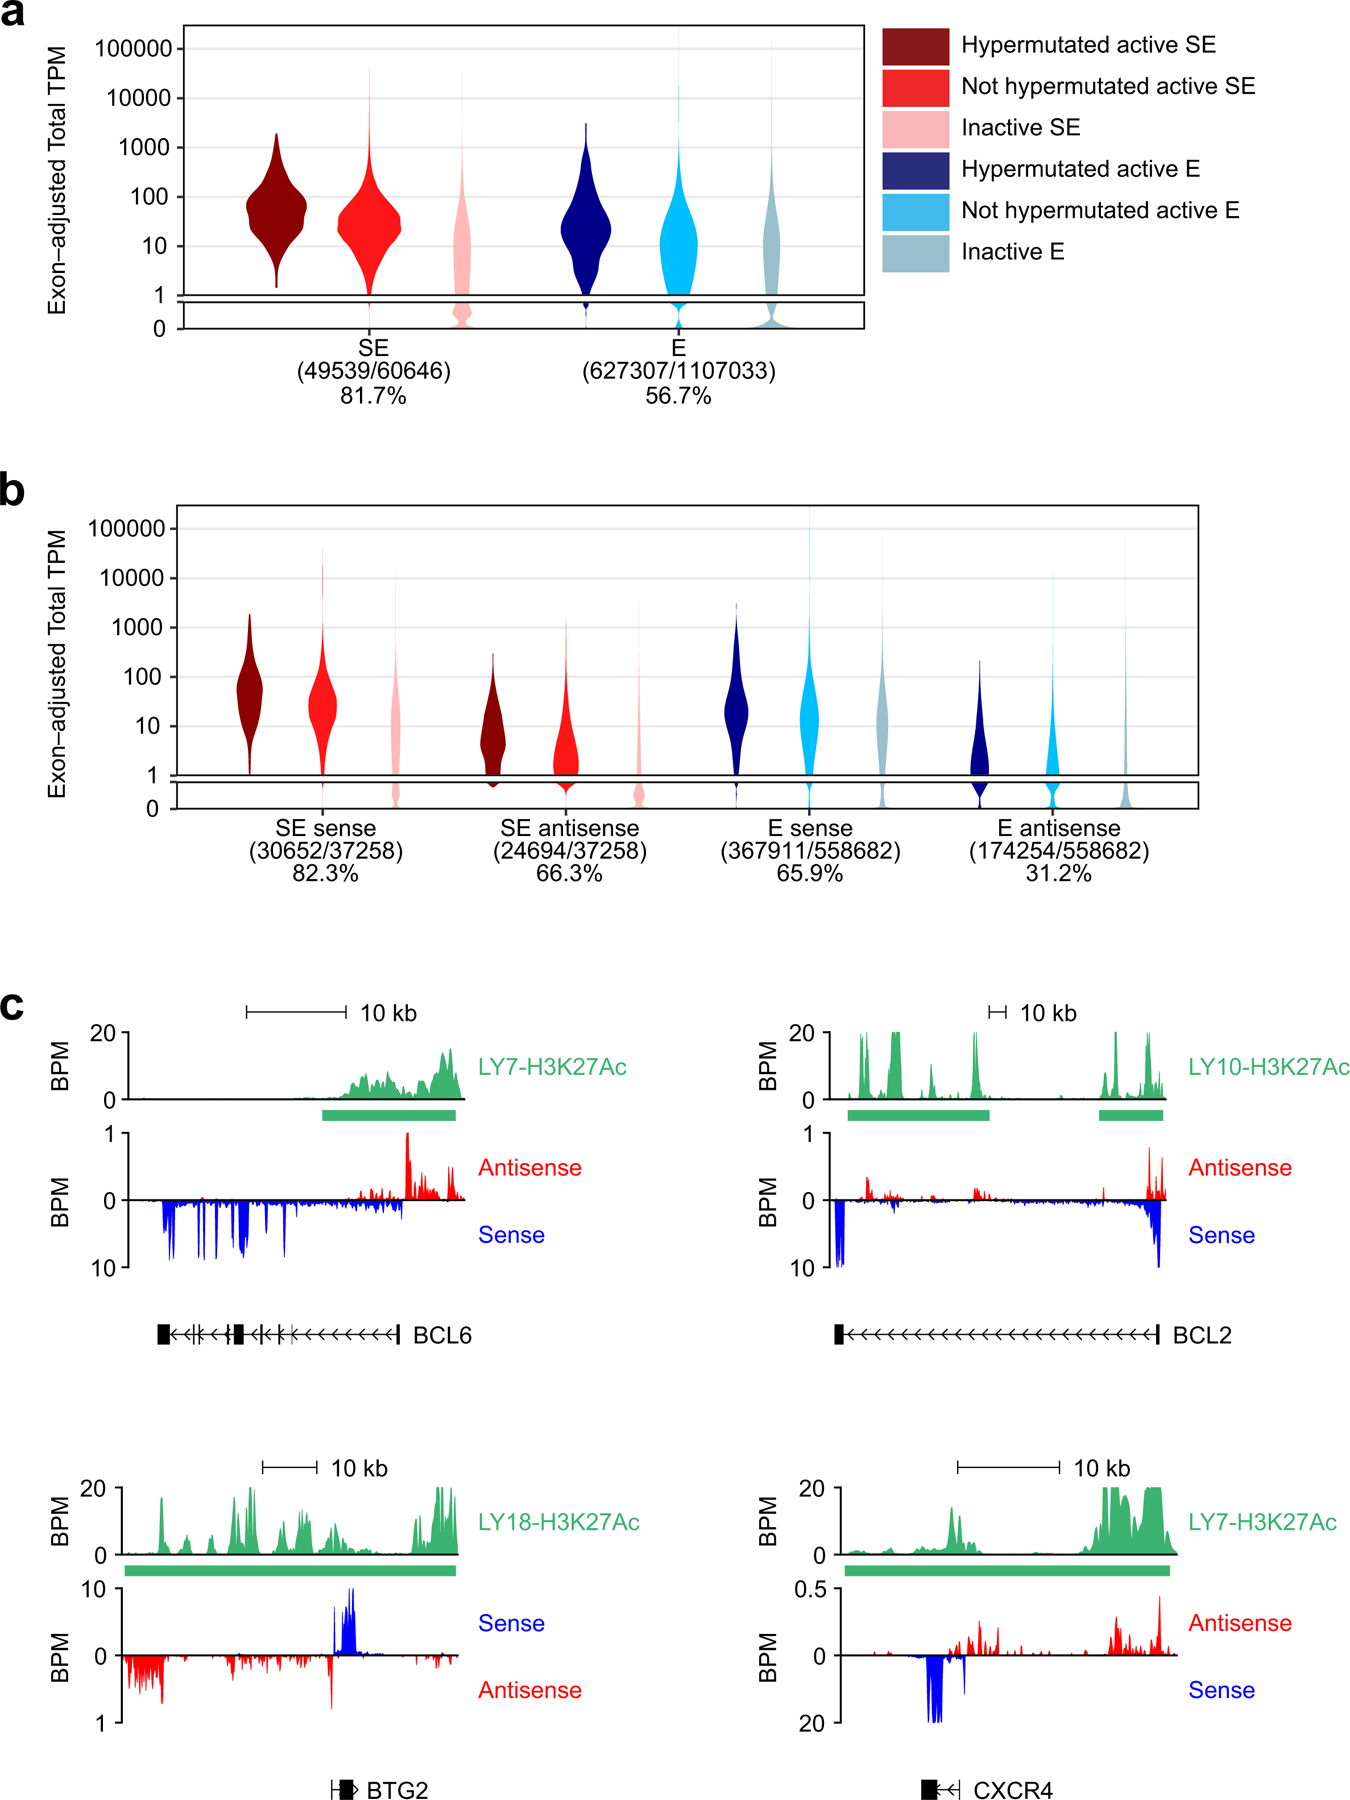
a. Distribution of transcripts per million (TPM) values for hypermutated, not hypermutated, and inactive E/SEs identified in the 29 DLBCL cell lines. b. Distribution of TPM values for sense and antisense transcripts at the indicated chromatin domains, documenting divergent transcription (legend as in a). c. H3K27Ac ChIP-seq track (green) and RNA-seq tracks (red, antisense transcription; blue, sense transcription) at 4 representative loci targeted by SE-ASHM. Green bar denotes the SEs identified by ROSE. BPM, bins per million (see methods). In panels a and b, pairwise comparisons between TPM values were significantly different across all categories and are thus not indicated (adjusted p<0.05; Wilcoxon rank-sum test with BH correction).
Extended Data Figure 5: Mutations are enriched at intragenic SEs encompassing H3K4me3+ promoters.
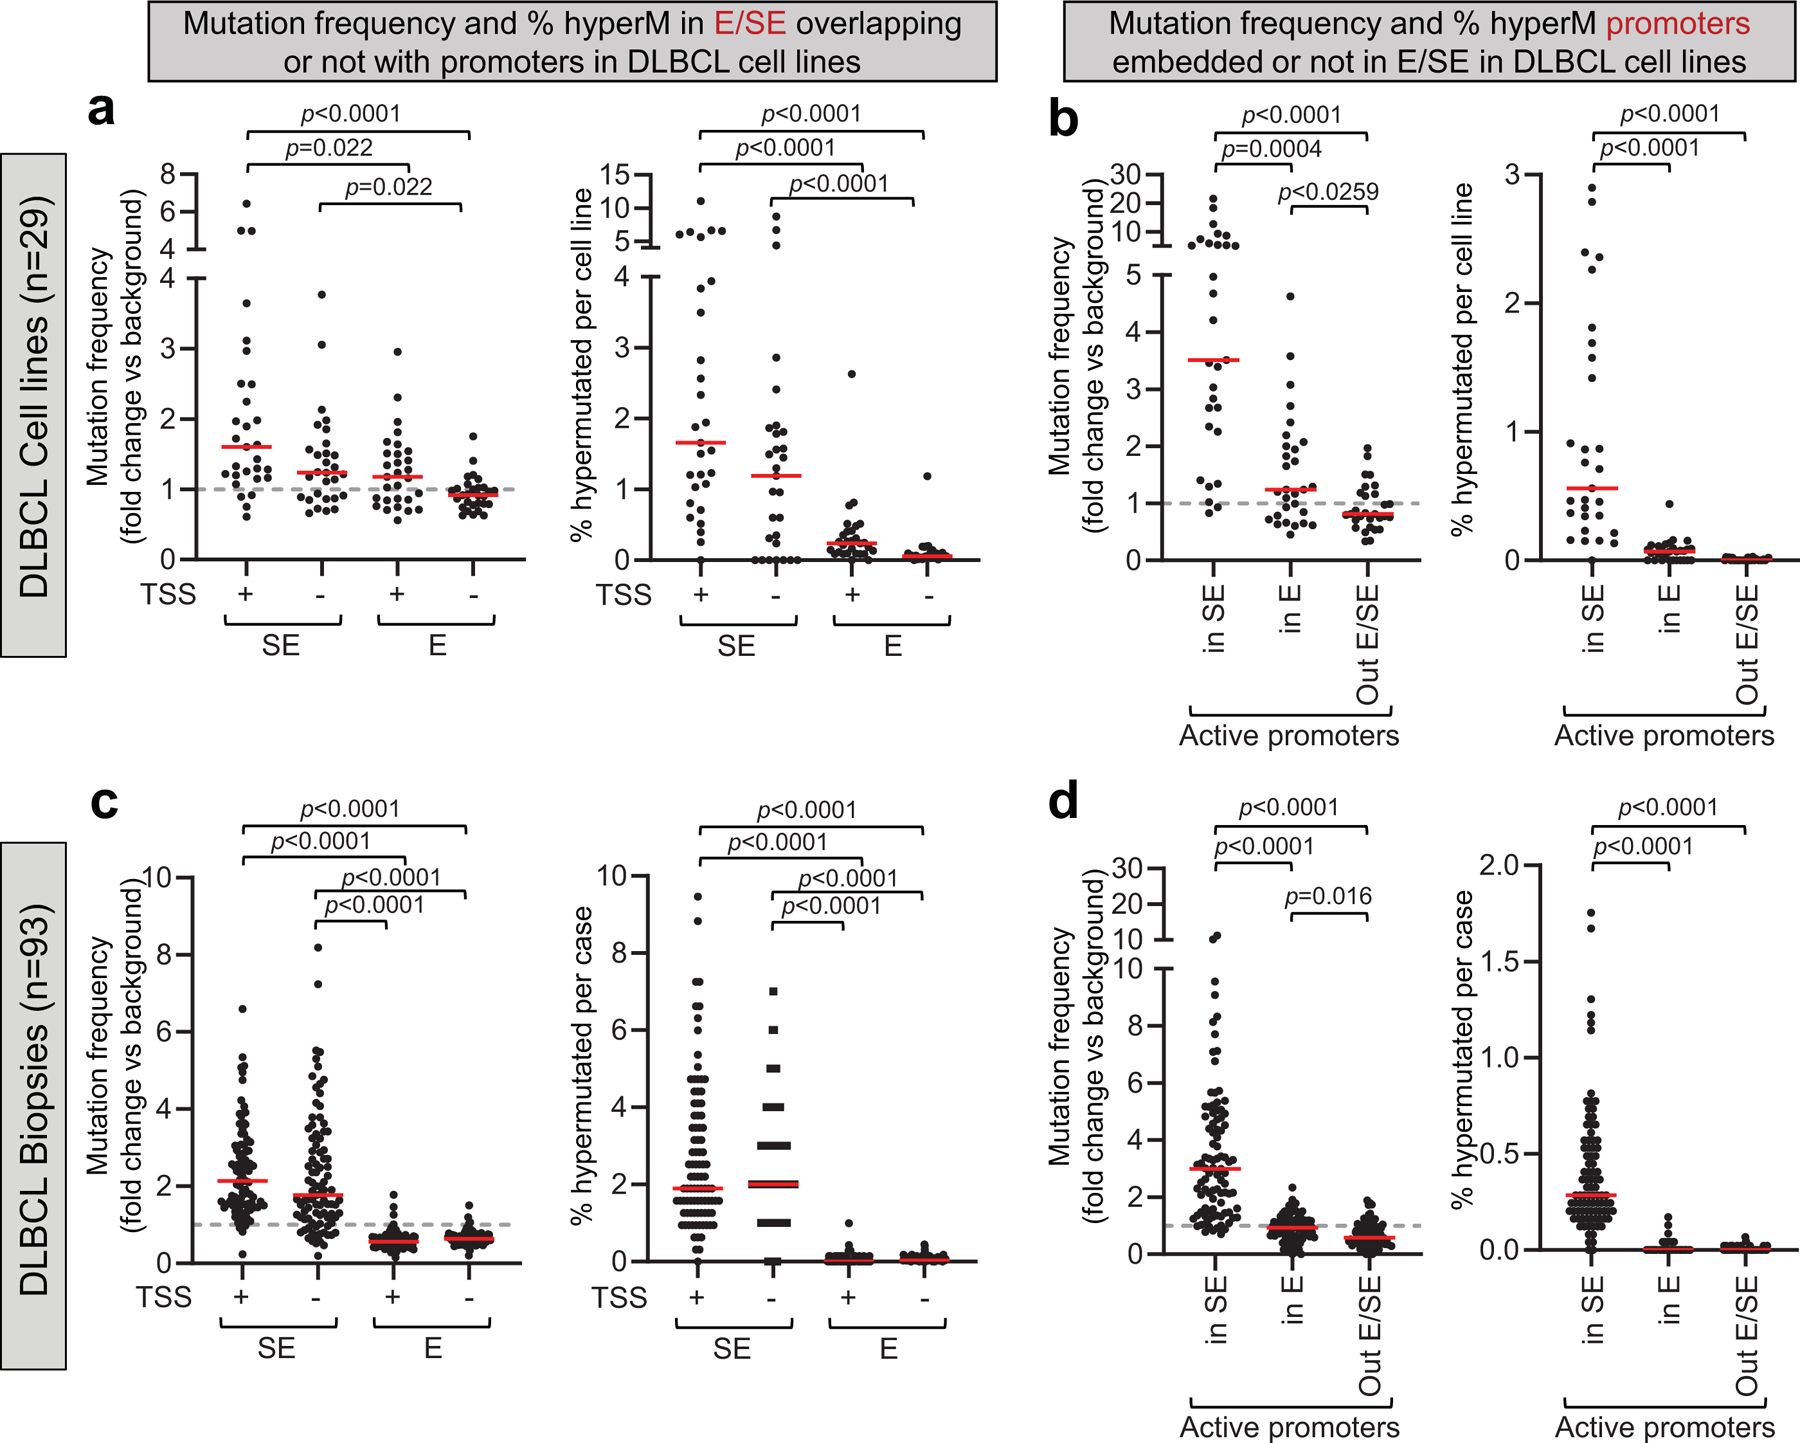
a. Overall mutation frequency (left panel) and percentage of hypermutated E/SEs (right panel; see Methods and Fig. 1b for definition) in 29 DLBCL cell lines. Data are provided separately for E/SEs encompassing promoters (i.e. overlapping with H3K4me3+) and devoid of promoters (i.e. not overlapping with H3K4me3+ regions and TSS-distal). Each dot represents one cell line, and mutation frequencies are expressed as fold changes vs. the background mutation frequency of the same cell line, set as 1 (dotted line). A horizontal red bar defines the mean across all 29 cell lines.b. Overall mutation frequency (left panel) and percentage of hypermutated active promoters (H3K27Ac+ H3K4me3+ regions) in 29 DLBCL cell lines. Data are provided separately for promoters embedded in SEs, promoters embedded in Es, and classical active promoters not embedded in E/SEs. Each dot represents one cell line, and the mutation frequencies are expressed as fold changes vs. the background mutation frequency of the same cell line, set as 1 (dotted line). A horizontal red bar defines the mean across all 29 cell lines. c. Overall mutation frequency (left panel) and percentage of hypermutated core E/SEs (right panel; see Fig. 1d and Methods for definition) in 93 primary DLBCL biopsies. Data are provided separately for E/SEs encompassing promoters and E/SEs devoid of promoters (defined as in a). Each dot represents one sample, and mutation frequencies are expressed as fold changes vs. the background mutation frequency of the same sample, set as 1 (dotted line). A horizontal red bar defines the mean across all 93 DLBCL samples. Note that these frequencies represent an underestimate of the actual mutation frequencies as, in the absence of sample-specific H3K27Ac data, the region interrogated represents the union of the core E/SEs found in all 29 cell lines. d. Overall mutation frequency (left panel) and percentage of hypermutated active promoters (H3K27Ac+ H3K4me3+ regions) in 93 DLBCL primary cases. Data are provided separately for promoters embedded in SEs, promoters embedded in Es, and classical active promoters not embedded in E/SEs. Each dot represents one DLBCL biopsy, and mutation frequencies are expressed as fold changes vs. the background mutation frequency of the same sample, set as 1 (dotted line). A horizontal red bar defines the mean across all 93 DLBCL biopsies. All p-values were calculated by two-sided Wilcoxon rank-sum test after BH correction.
Extended Data Figure 6: Mutation frequency and percentage of hypermutated E/SEs in DLBCL primary cases.
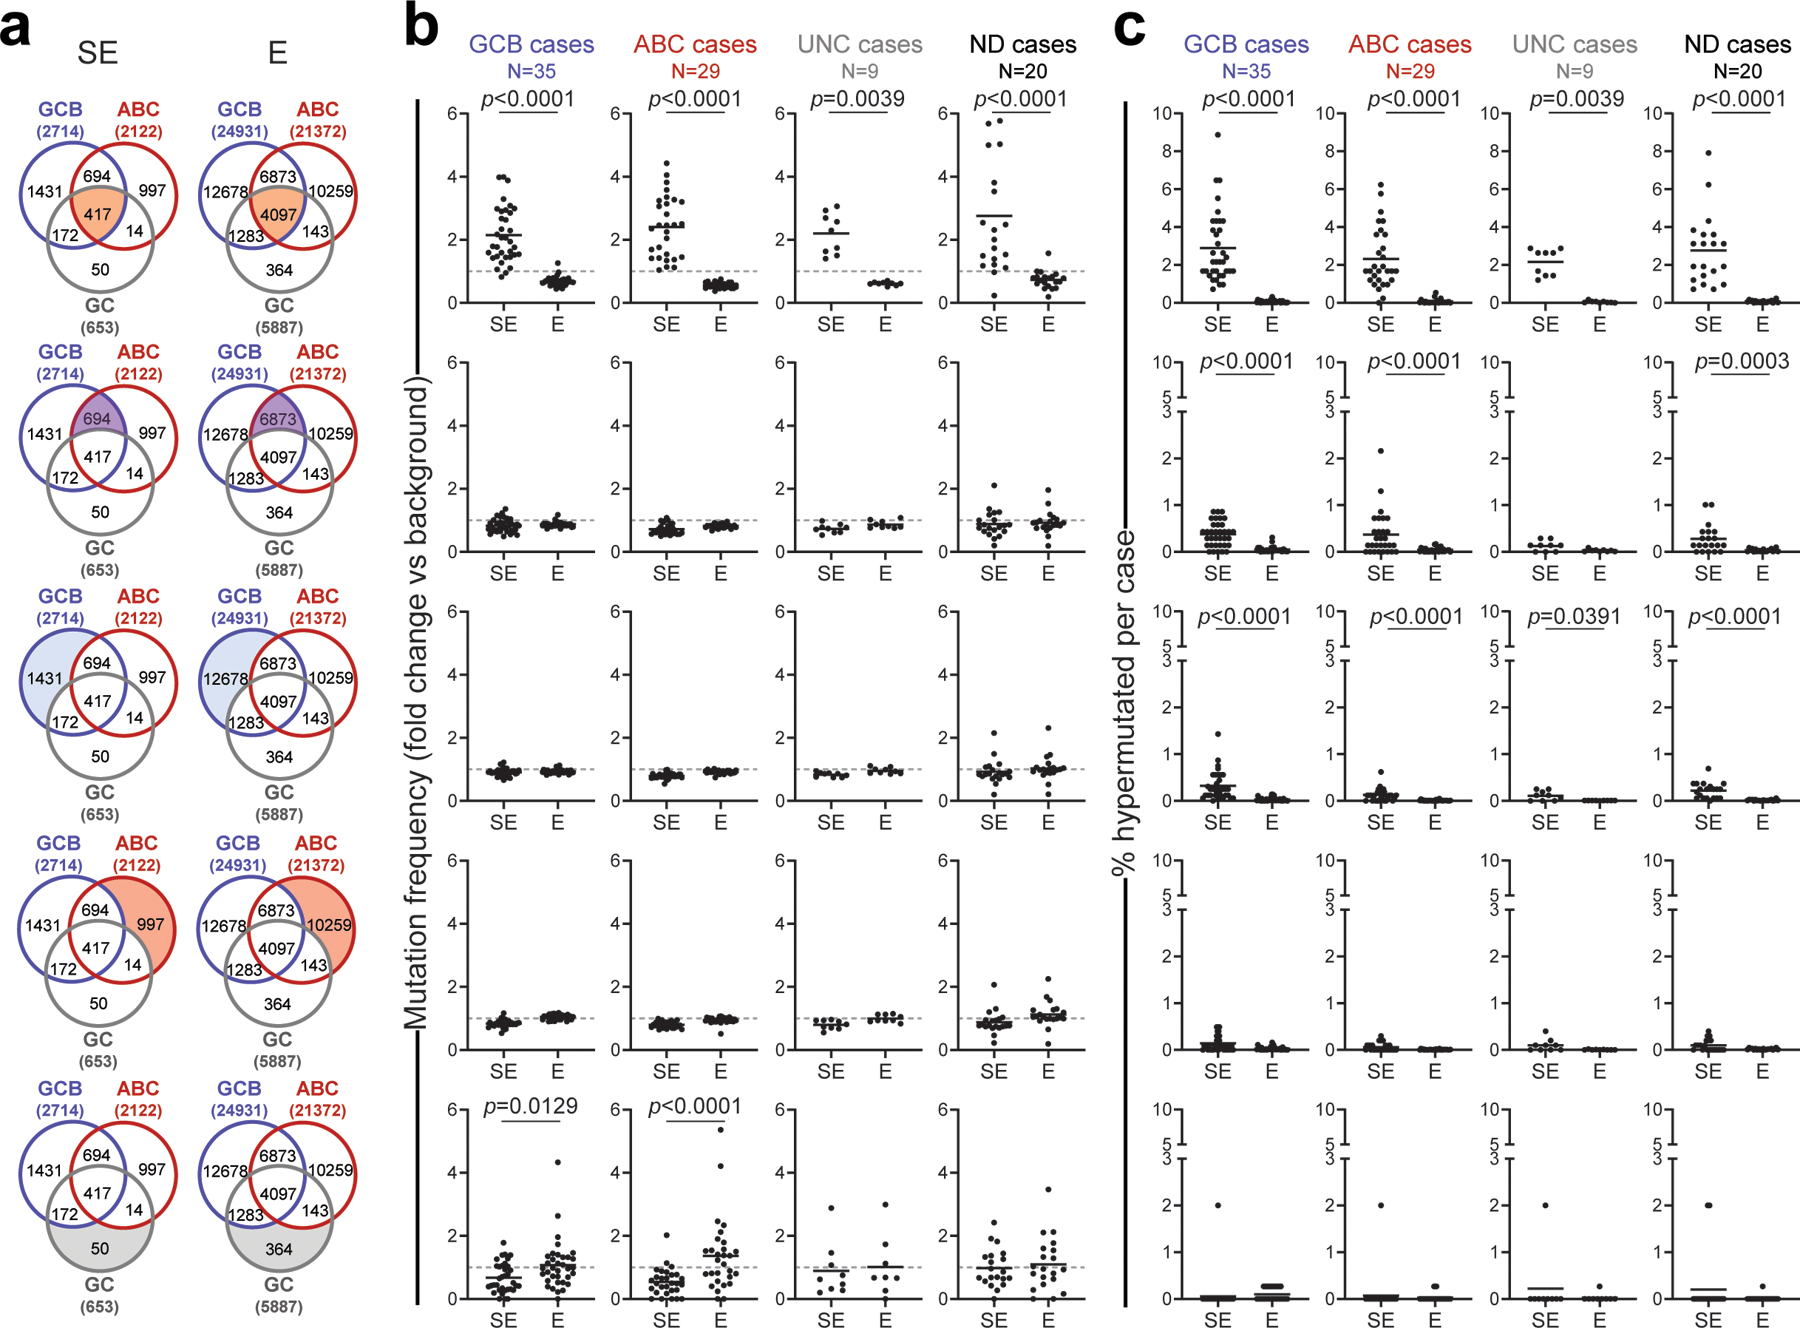
a. Venn diagrams showing the overlap between E/SEs identified in normal GC B cells, GCB-DLBCL cell lines and ABC-DLBCL cell lines. The shadowed area marks the subset of E/SEs interrogated in each of the analyses shown in panels b and c (same row), and the corresponding number is given for each subset inside the diagram. The total number of E/SEs identified in GC B cells, GCB-DLBCL cell lines and ABC-DLBCL cell lines appears outside the Venn diagram, in brackets. b, c. Sample-based mutation frequency (b) and percentage (c) of hypermutated E/SEs in primary DLBCL specimens grouped based on phenotypic subtypes (UNC, unclassified; ND, not determined). The analysis of different regions (corresponding to those highlighted in the aligned Venn diagram) is displayed in different rows, and data for “shared” E/SEs (Figure 1d,e) are shown for comparison on the top row, as these regions emerged as harboring the highest mutation frequency and % of hypermutated cases in DLBCL. In the graphs, each dot denotes one primary DLBCL sample, and mutation frequencies are expressed as fold changes vs. background, calculated in the same sample as described in Methods. The grey dashed line in panel b represents the background mutation frequency, set at 1 for each sample (see Methods). All p-values were calculated by two-sided Wilcoxon rank-sum test after BH correction.
Extended Data Figure 7: Mutation frequency and percentage of hypermutated E/SEs in BL and CLL.
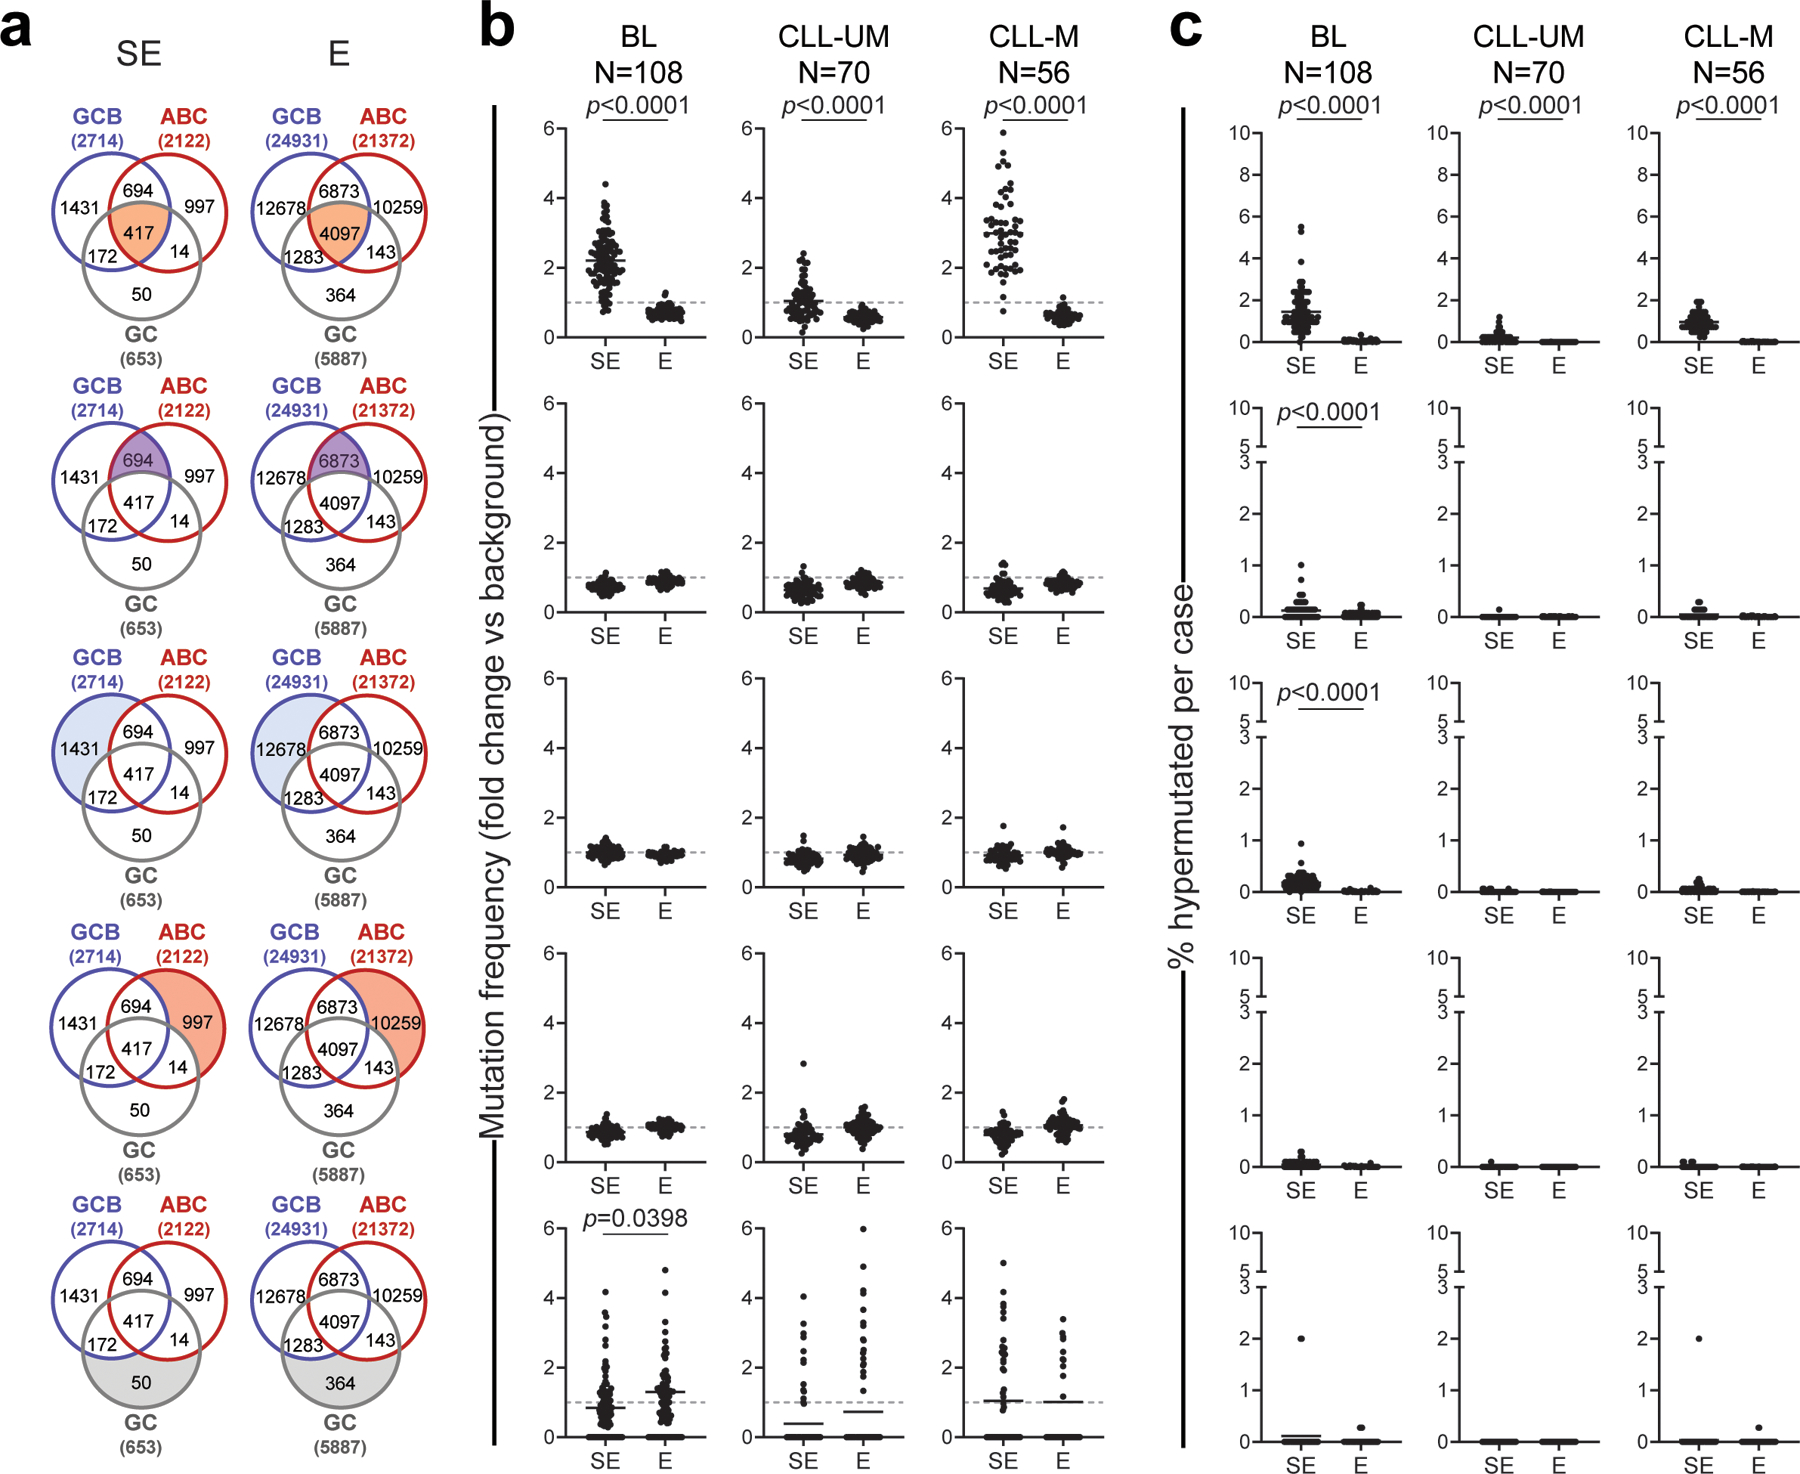
a. Venn diagrams showing the overlap between E/SEs identified in normal GC B cells, GCB-DLBCL cell lines and ABC-DLBCL cell lines. The shadowed area marks the subset of E/SEs interrogated in each of the analyses shown in panels b and c (same row), and the corresponding number is given for each subset inside the diagram. The total number of E/SEs identified in GC B cells, GCB-DLBCL cell lines and ABC-DLBCL cell lines appears outside the Venn diagram, in brackets. b, c. Sample-based mutation frequency (b) and percentage (c) of hypermutated E/SEs in primary BL and CLL specimens grouped based on molecular subtypes (IGHV-unmutated: CLL-UM; IGHV-mutated: CLL-M). The analysis of different regions (corresponding to those highlighted in the aligned Venn diagram) is displayed in different rows. In the graphs, each dot denotes one primary biopsy, and mutation frequencies are expressed as fold changes vs. background, calculated in the same sample as described in Methods. The grey dashed line in panel b represents the background mutation frequency, set at 1 for each sample (see Methods). All p-values were calculated by two-sided Wilcoxon rank-sum test after BH correction. Note that 82% of hypermutated SEs in CLL map to the IG loci.
Extended Data Figure 8: FishHook independently identifies E/SEs as recurrent mutational targets in DLBCL.
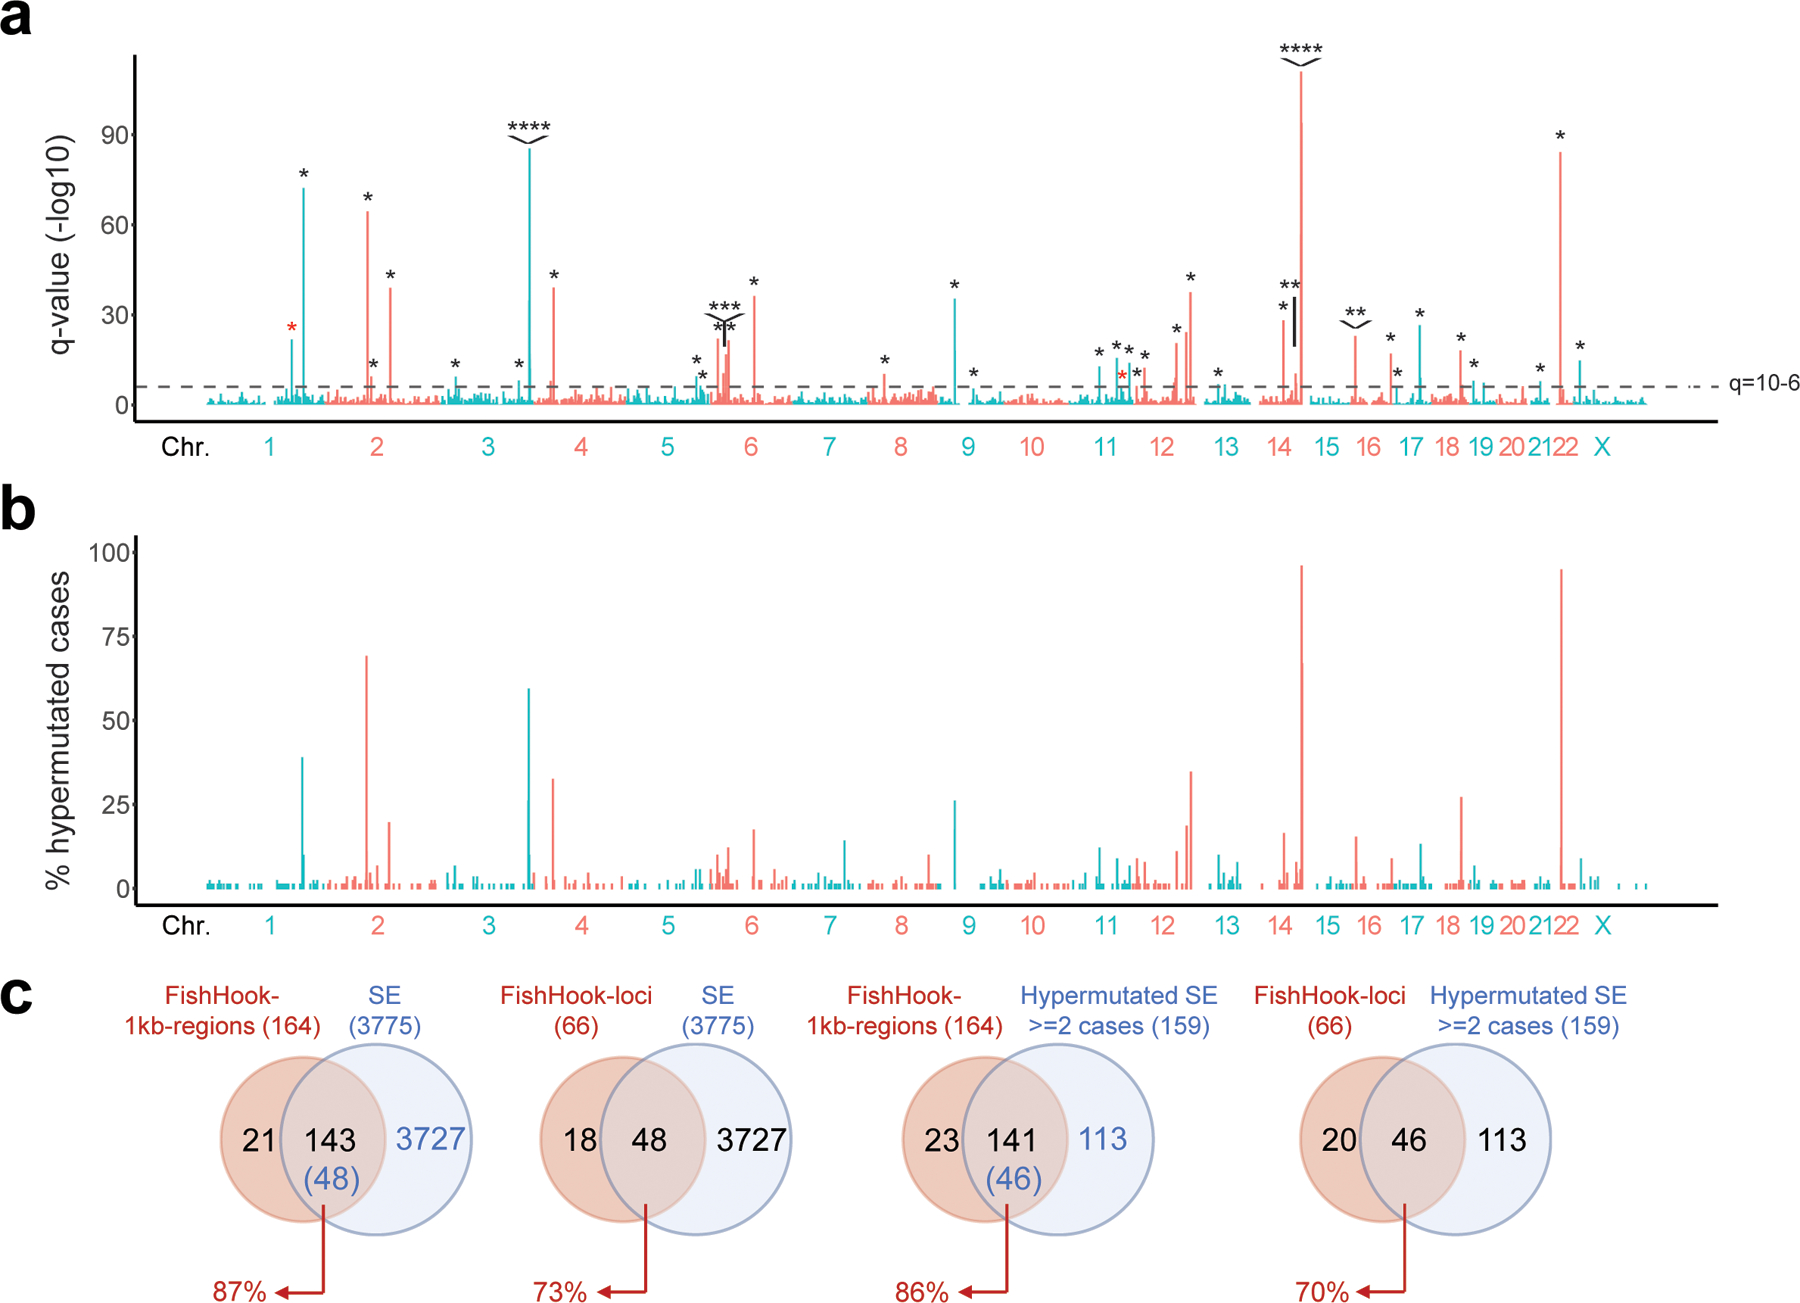
a. Significantly mutated regions (1kb) identified by FishHook in WGS data from the 93 DLBCL Discovery cases. The dotted line denotes the q-value at 10-6. Asterisks indicate peaks overlapping with hypermutated SEs identified by the integrated ChIP-Seq-based approach presented in Extended Data Figure 1 (see also Methods). b. Percentage of DLBCL primary cases hypermutated across the 3,775 SEs identified. c. Overlap of significantly mutated 1kb-regions called by FishHook (n=164) with the union list of active SEs identified by ChIP-Seq; data are shown for all SEs (n=3,775, diagram on the far-left side) or for SEs hypermutated in at least 2 cases (n=159, third diagram from the left). In a separate analysis, contiguous 1kb FishHook regions falling within the same SE were stitched into loci, and the overlap between these loci (n=66) and the union list of active SEs is provided on the second and fourth diagrams.
Extended Data Figure 9: SE-associated mutational signatures display features of AID activity.
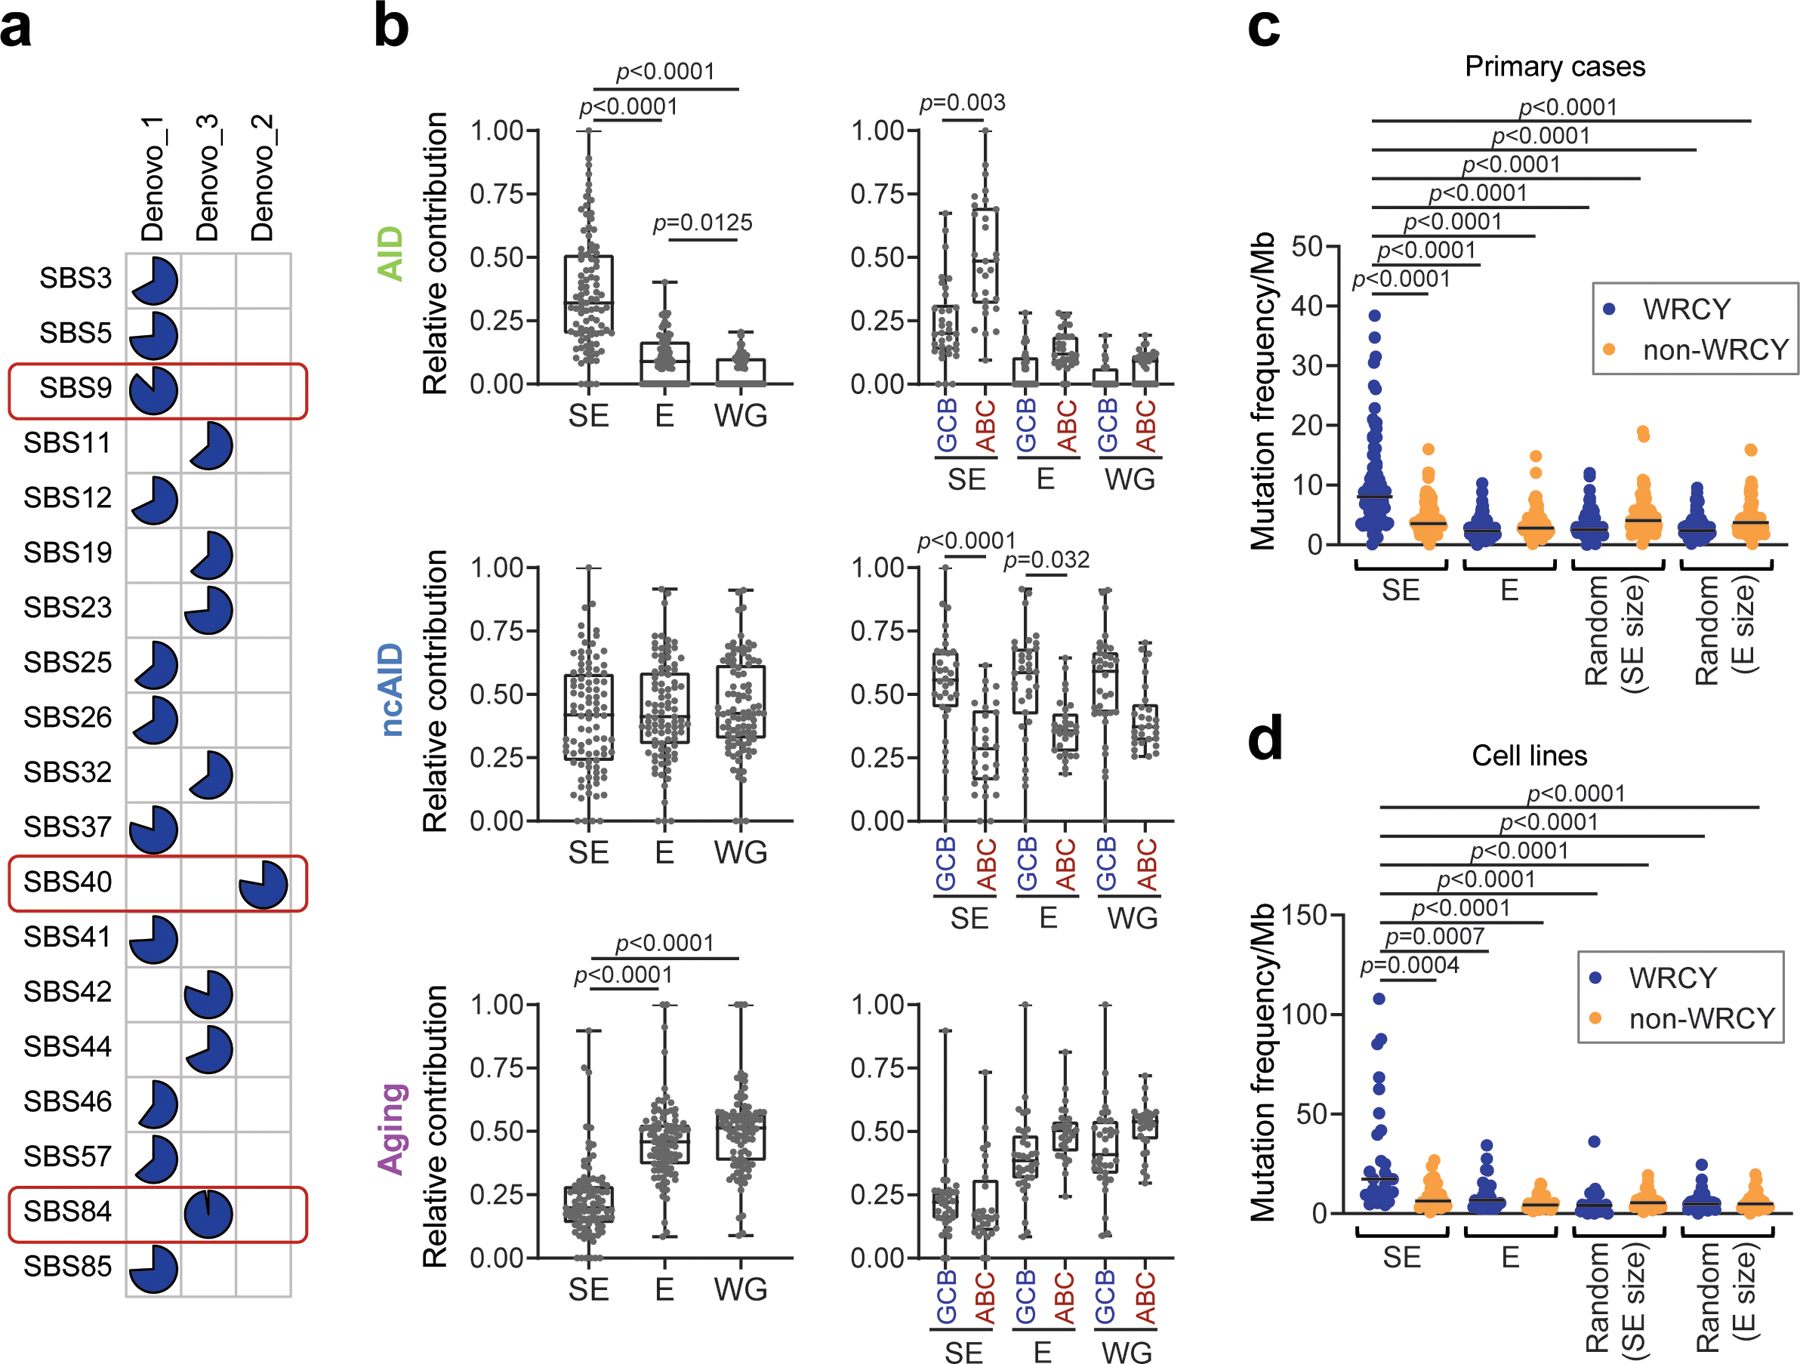
a. Cosine similarity of the three de novo mutational signatures identified in SEs (Fig. 1f) to the COSMIC signatures database. Blue slices in the pie reflect the degree of similarity with the COSMIC SBS signature listed to the left. Signatures with the highest similarity are highlighted in red (SBS9, non-canonical AID [ncAID]; SBS40, aging; SBS84, AID). b. Cumulative activity of the three signatures at SEs, Es and the rest of the genome (WG) across the 93 DLBCL cases, overall (left panels) and separately for GCB- and ABC-DLBCL (right panels). c,d. Mutation frequency of WRCY and non-WRCY motifs in E/SEs, as compared to random regions of equivalent size selected from the “rest of the genome”; data are shown for primary DLBCL biopsies (c) and cell lines (d). All p-values were calculated by two-sided Wilcoxon rank-sum test after BH correction.
Extended Data Figure 10: Percentage of cases carrying mutations in the BCL6-BLIMP1-BS, BCL2-NR3C1-BS, and CXCR4-NR3C1-BS across lymphoid and non-lymphoid cancers.
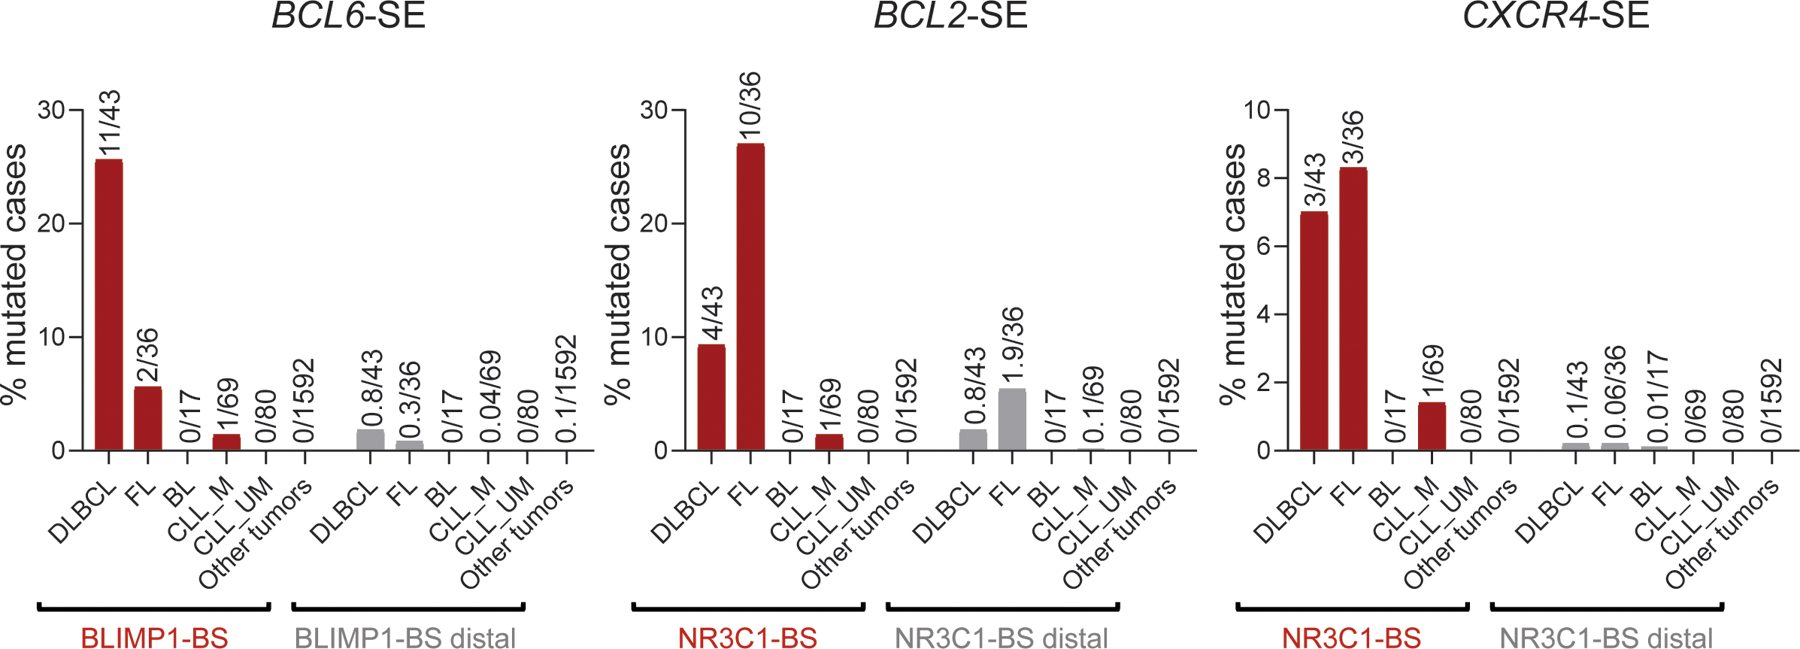
Percentage of cases carrying mutations in the BCL6-, BCL2-, and CXCR4- SE hotspots characterized in Figures 4–6 across an independent panel of GC-derived lymphomas (DLBCL, FL, BL, and IGHV-mutated-CLL), non-GC derived lymphomas (IGHV-unmutated-CLL), and other cancer types from the ICGC pan-cancer project. In further support of the selective pressure for mutating these sequences, 15bp domains located between 0.5kb and 3kb from the BS, within the same SE (BS-distal) were randomly selected with 100 permutations, and the percentage of mutated cases in these regions was calculated (grey bars; mean of 100 permutations). Particularly relevant is the lack of hotspot mutations in M-CLL (which have transited through the GC and therefore represent specific surrogates of normal GC alleles).
Extended Data Figure 11: Mutations in the BCL6-B1BS are enriched in GCB- and ST2-DLBCL.
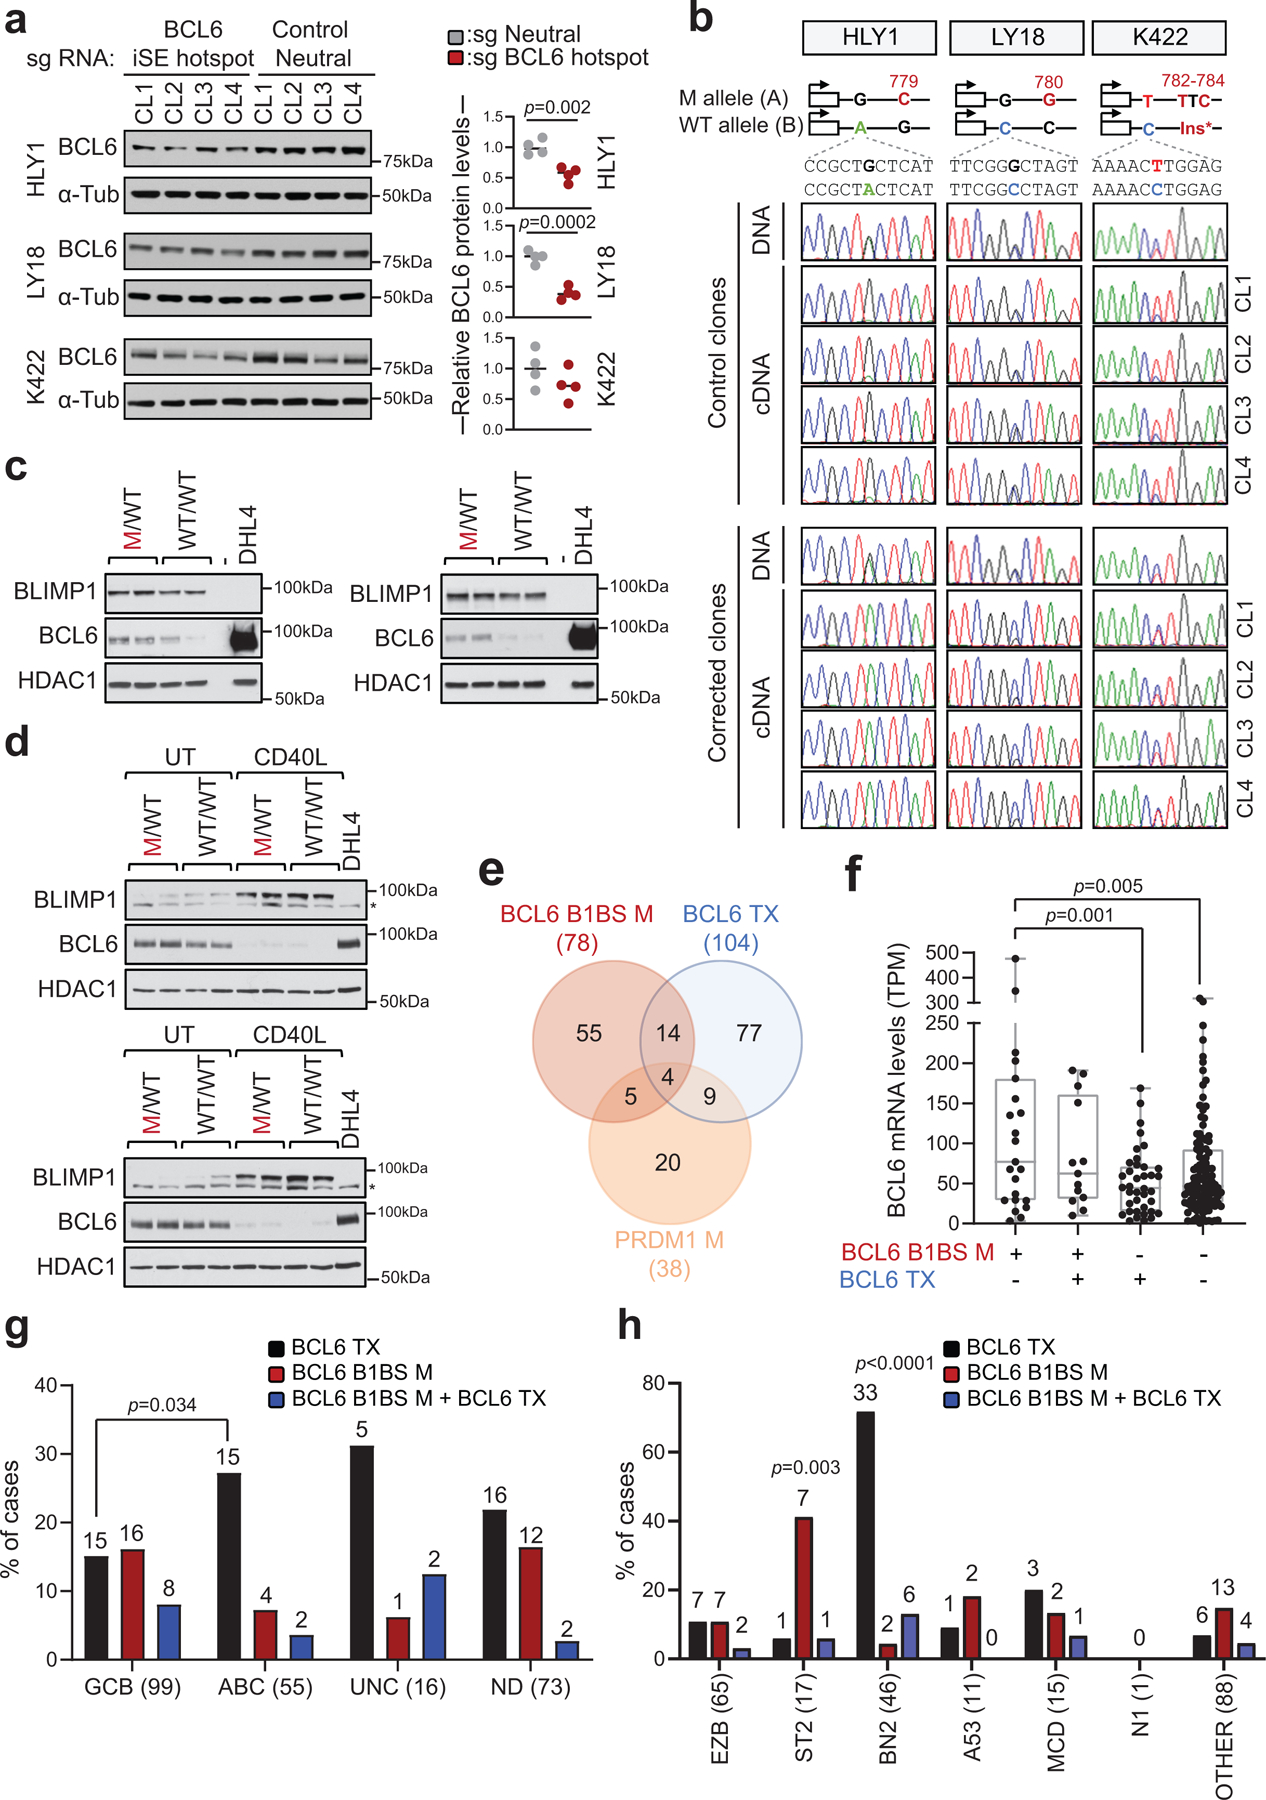
a. Immunoblot analysis of BCL6 protein expression in isogenic clones obtained from HLY1, LY18 and Karpas-422 after CRISPR-Cas9-mediated correction of specific mutations in the BCL6-iSE hotspot or after introduction of mutations in the control neutral region (n=4 clones/sgRNA; related to Fig. 3c,d). α-Tubulin, loading control. Shown is one representative experiment out of two that gave similar results (for gel source data, see Supplementary Figure 1). On the right panel, quantification of BCL6 expression, as assessed by densitometry after normalization for loading control (two-tailed unpaired t-test). b. Sequencing traces of BCL6 PCR amplicons encompassing cell-line specific heterozygous SNPs segregating with the mutant allele, obtained from the 8 clones shown in a. A schematic showing the allelic distribution of the BCL6 SNP, relative to the somatic mutation corrected in each cell line, is provided on the top. Amplicons were generated from DNA (one representative clone shown) and cDNA (n=4 clones/sgRNA). c,d. Immunoblot analysis of BLIMP1, BCL6 and HDAC1 expression in HLY1 (c) and LY18 (d) clones. In LY18, experiments were performed in basal conditions (UT) or upon CD40L stimulation. SUDHL4 is used as negative control for BLIMP1 and positive control for BCL6 expression. * non-specific band (for gel source data, see Supplementary Figure 1). e. Overlap between cases harboring mutations in the BCL6-BLIMP1 binding site (B1BS), BCL6 translocations (Tx), and/or coding mutations in the PRDM1 gene. Data are from 391 DLBCL primary cases analyzed by WGS or Sanger sequencing. f. BCL6 expression levels in DLBCL primary cases stratified based on the genetic lesions indicated in e (n=181 cases with matched WGS and RNA-seq data). Significant differences were calculated by one-way ANOVA with Bonferroni correction. g. Relative distribution of cases harboring the indicated genetic lesions in various DLBCL COO subtypes (two-tailed Fisher’s exact test). The total number of cases analyzed within each subtype is provided on the x-axis label, and the number of mutated cases is shown on the top. h. Mutation harboring the indicated genetic lesions in different LymphGen classes. The total number of cases analyzed is provided on the x-axis label, and the number of mutated cases is shown on the top. A two-tailed Fisher’s exact test was used to determine whether cases carrying the indicated genetic alteration were significantly enriched in a specific LymphGen class versus all other classes combined. Of note, although mutations in BCL6-B1BS can be found at some frequencies in all COO and LymphGen subroups, they were preferentially enriched in the GCB- and ST2 subgroups.
Extended Data Figure 12: Mutations in the BCL6-B1BS influence DLBCL class assignment.
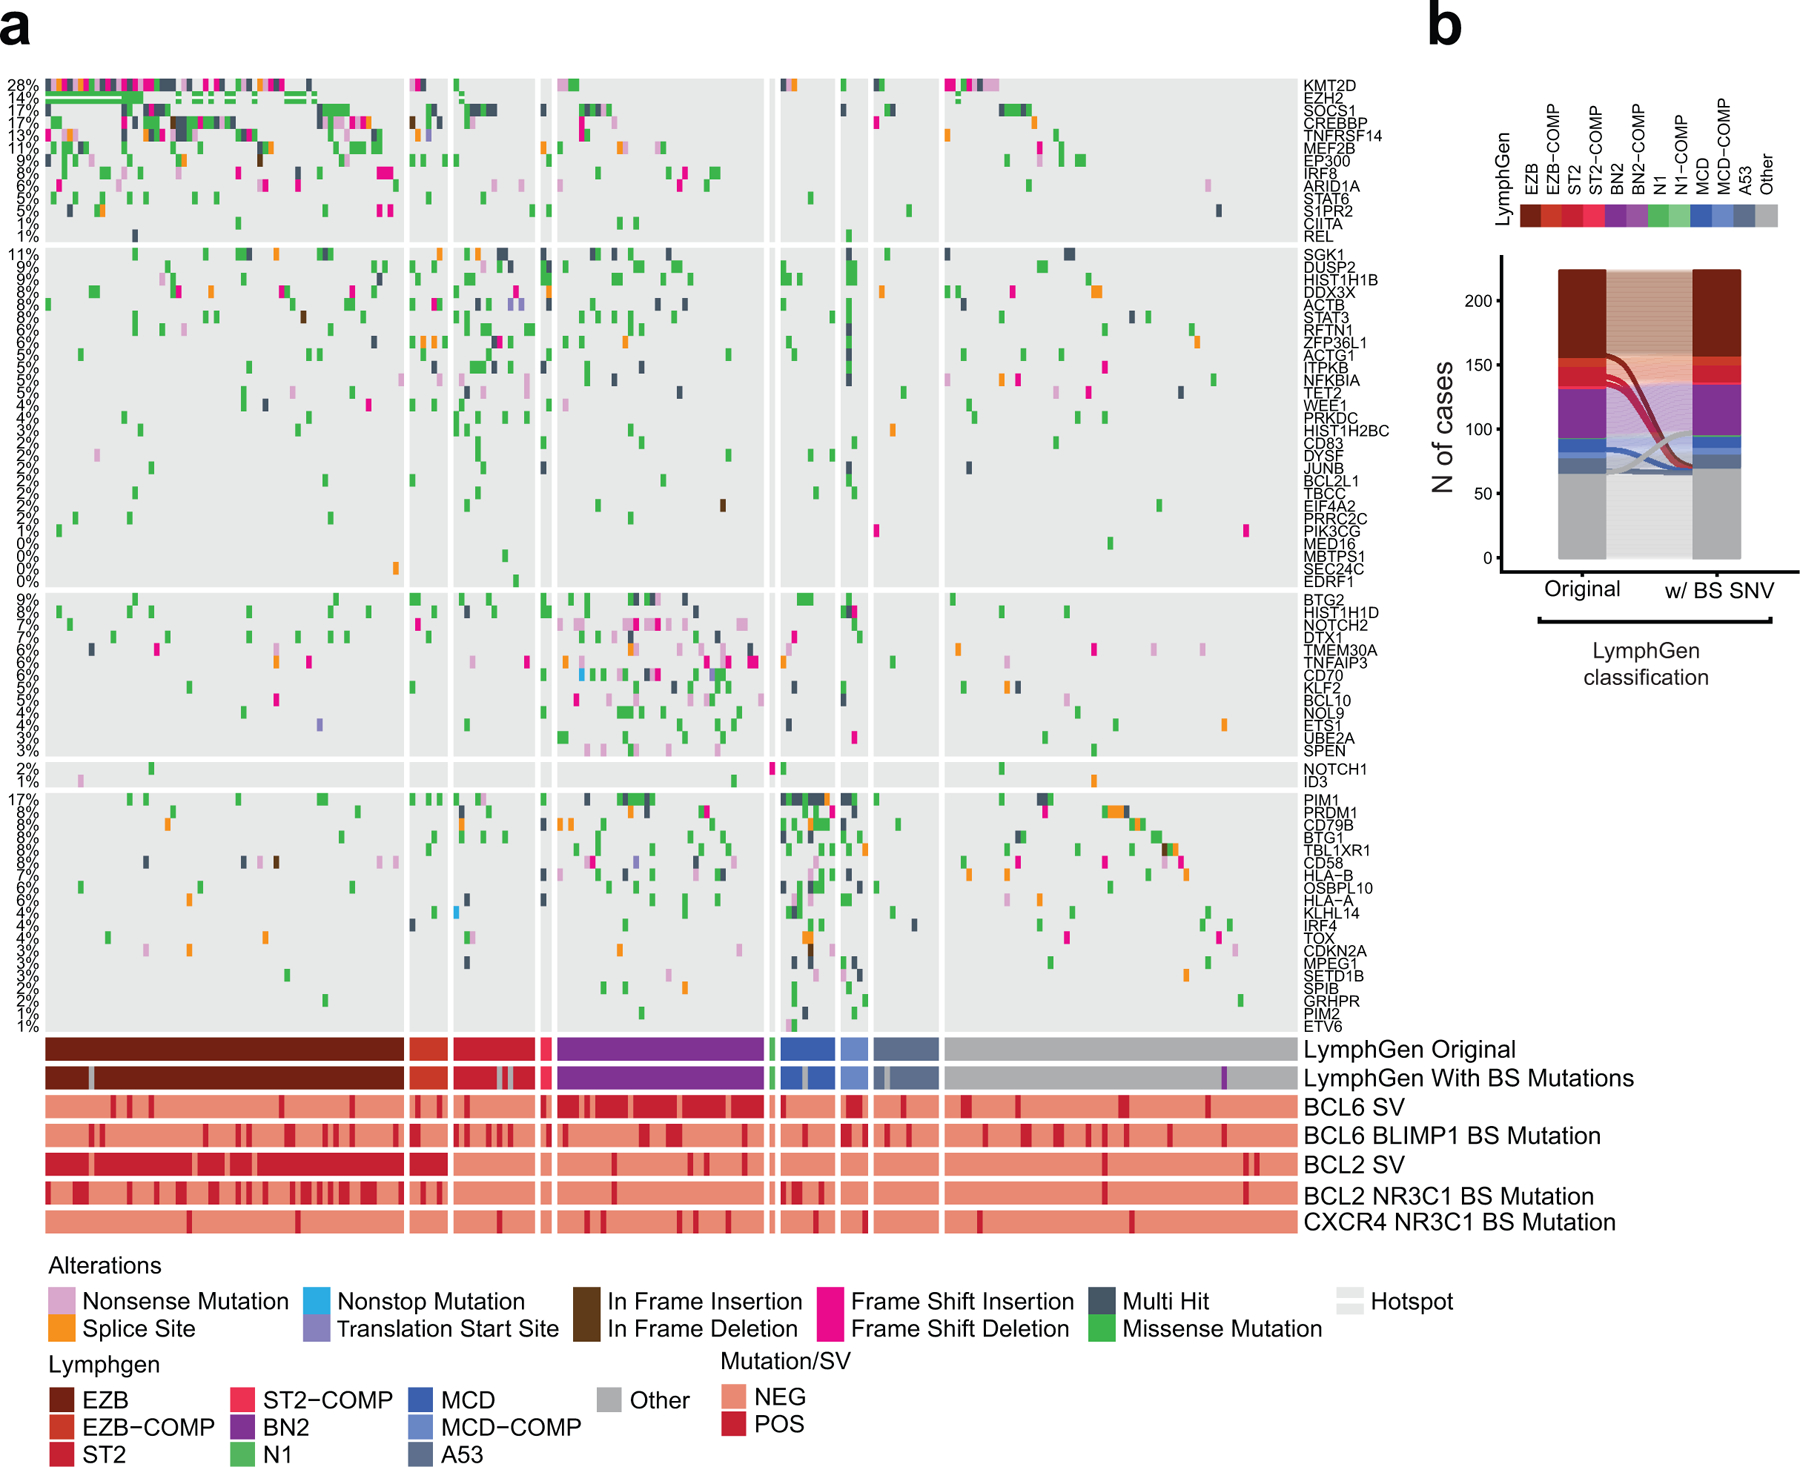
a. Oncoplot of 223 DLBCL cases classified into distinct genetic subtypes according to the LymphGen algorithm. Columns represent different DLBCL cases and rows correspond to genetic alterations used by the LymphGen algorithm, with their overall percentage shown on the left. Color coded keys below the plot indicate mutation type, presence/absence of BCL2 and BCL6 structural variants (SVs), presence/absence of mutations at the BCL2-NR3C1-, BCL6-BLIMP1-, and CXCR4-NR3C1-BS, and LymphGen class assignment, as obtained by running the algorithm without considering the BS mutations (LymphGen Original) or considering the BS mutations (LymphGen with BS mutations). b. Head-to-head comparison between LymphGen class assignments obtained as described in a. The results show 6 cases that changed class when including BS mutations, of which one was originally unclassified and became BN2 (purple), and 5 were originally classified and became “other” because they showed 0.5 < P(class) < 0.9 for multiple classes.
Extended Data Figure 13: NR3C1 binding is abrogated by specific BCL2 SE mutations in the LY10 cell line.
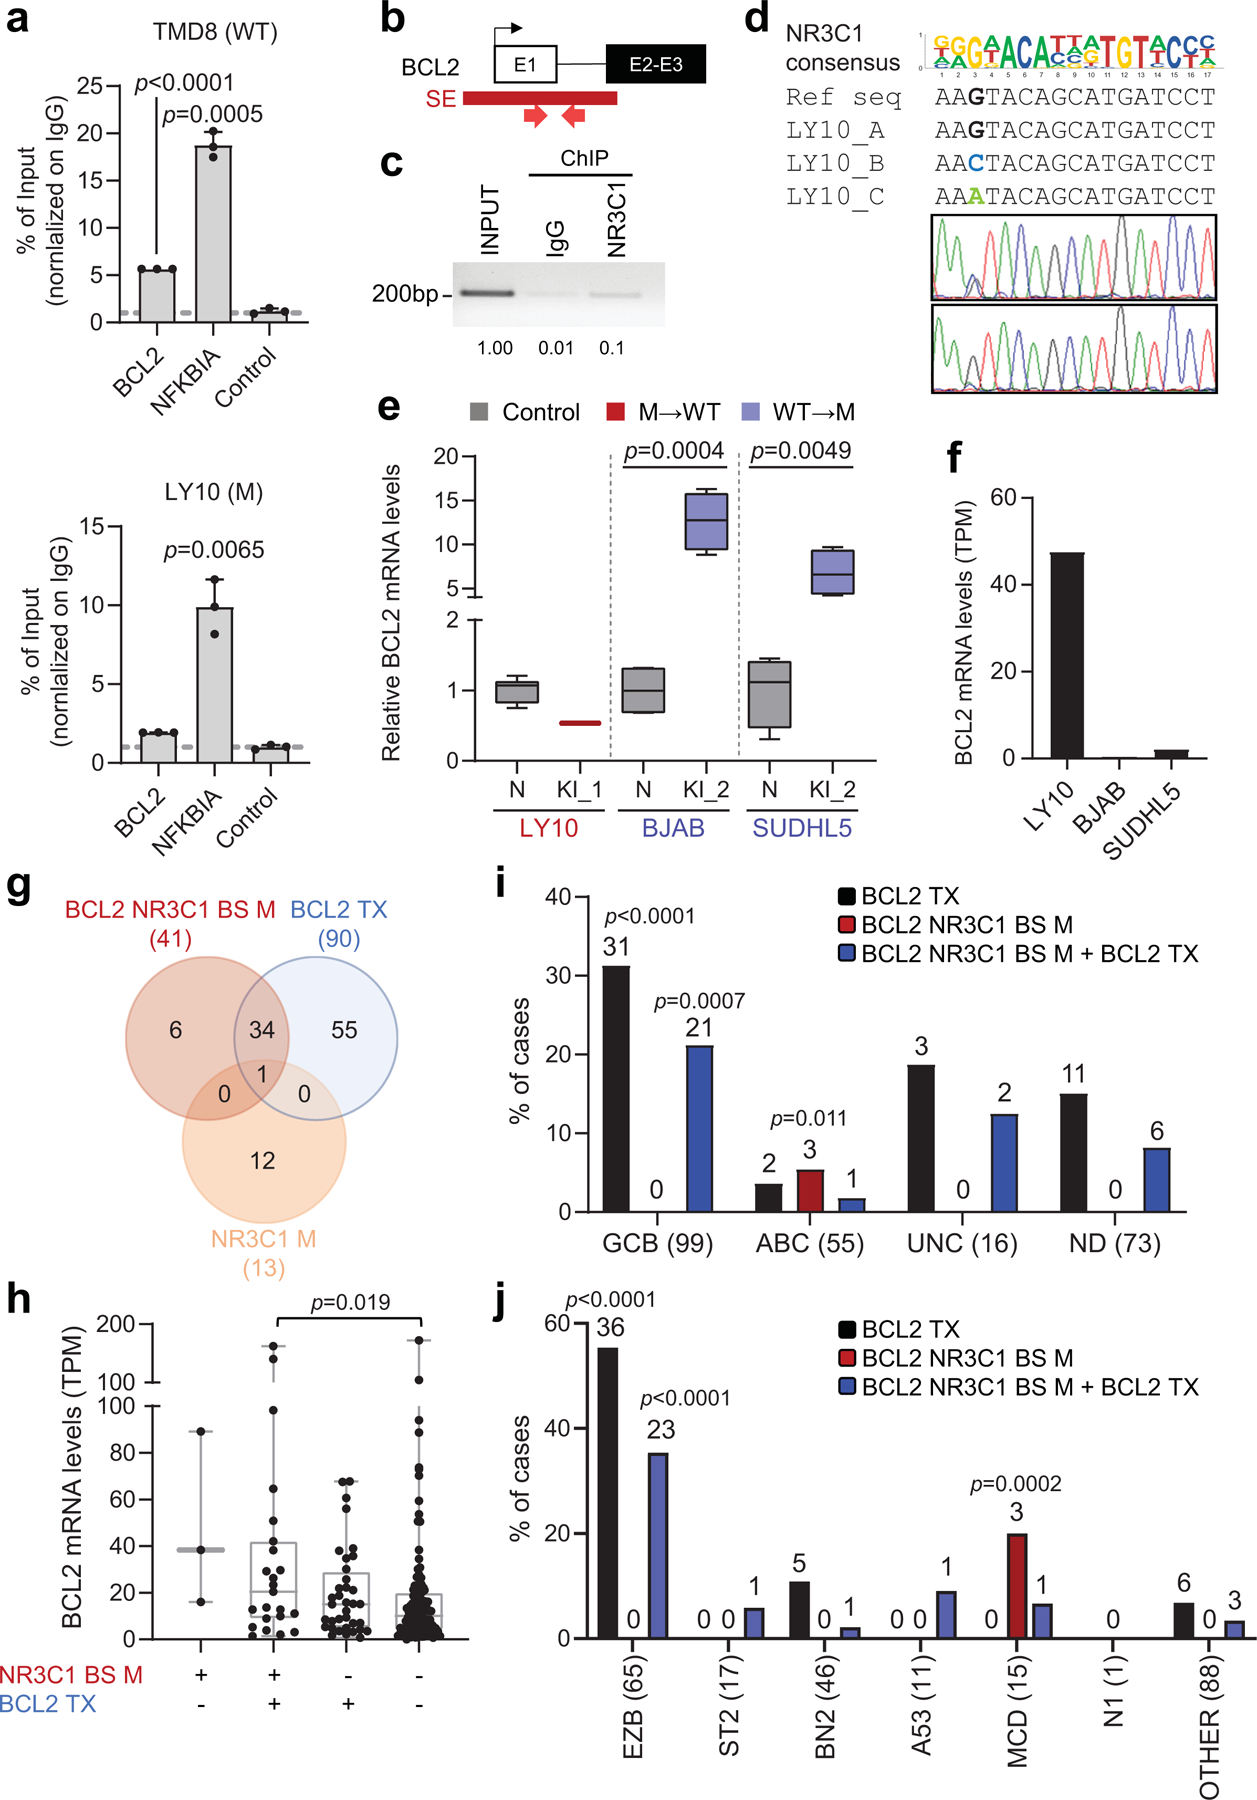
a. NR3C1 ChIP-qPCR in wild-type (TMD8, top) and mutant (LY10, bottom) DLBCL cell lines, using primers encompassing the BCL2 SE hotspot, the known NR3C1 target NFKBIA, and a control non-target region (mean +/− SD; n=3 technical replicates from one representative experiment out of 2 that gave analogous results; one-way ANOVA with Bonferroni correction). Data are expressed as % of input normalized on control IgG IP. b. Schematic of the BCL2 locus, with the hypermutated SE shown in red, and the primers used in the NR3C1-ChIP-PCR approximately positioned below the map. c. Gel electrophoresis of NR3C1 ChIP-PCR amplicons from the LY10 cell line, as compared to input and control IgG ChIP (data shown are from one representative experiment out of 2 independent experiments that gave analogous results). Band quantification was obtained by densitometry and the relative values are provided below the image, with input set as 1. d. Sequencing analysis of the PCR products shown in c. On the top panel, the reference BCL2 genomic sequence (NM_000624) and the sequence of the three BCL2 alleles (LY10 carries a trisomy 18) are aligned to the predicted NR3C1 binding motif. Sequencing traces of the ChIP-PCR amplicons document that only the wild-type “G” mutant allele is efficiently immunoprecipitated, as compared to the input, documenting abrogation of NR3C1 binding by the two mutations (Sanger sequencing performed with the reverse primer). e. Relative BCL2 expression changes in isogenic clones from the indicated cell lines, color coded as in Fig 5f (n=4 each except for LY10, where only 2 corrected clones were recovered, and control neutral clones, were 8 were used to exclude biological variability). For each cell line, the mean value of the unmanipulated clones is arbitrarily set as 1 (two-tailed unpaired t-test). f. Absolute BCL2 mRNA levels in the 3 cell lines used in CRISPR-Cas9 experiments, measured by RNA-seq (LY10, mutated; BJAB and SUDHL5, unmutated). g. Overlap between DLBCL cases harboring mutations in the BCL2-NR3C1-BS, BCL2 translocations (Tx), and/or coding mutations in the NR3C1 gene. Data are from 328 cases analyzed by WGS or Sanger sequencing. h. BCL2 expression levels in DLBCL primary cases, stratified based on the presence of the indicated genetic lesions (n=181 cases with available WGS and RNA-seq data). Data are expressed as TPM, and statistically significant differences were calculated by one-way ANOVA with Bonferroni correction. i. Relative distribution of cases harboring the indicated genetic lesions in various DLBCL COO subtypes. P-values were calculated by two-tailed Fisher’s exact test to determine specific enrichment of a genetic lesion in each COO group versus the other groups combined (UNC< unclassified; ND, not determined). The total number of cases analyzed within each subtype is provided in brackets, and the number of mutated cases is shown on the top. j. Relative distribution of cases harboring the indicated genetic lesions in LymphGen genetic classes. A two-tailed Fisher’s exact test was used to calculate the enrichment of each genetic lesion in each LymphGen class versus the other classes combined. The total number of cases analyzed within each class is provided in brackets, and the number of mutated cases is shown on the top.
Extended Data Figure 14: NR3C1 binding to the CXCR4-SE is abrogated by somatic mutations.
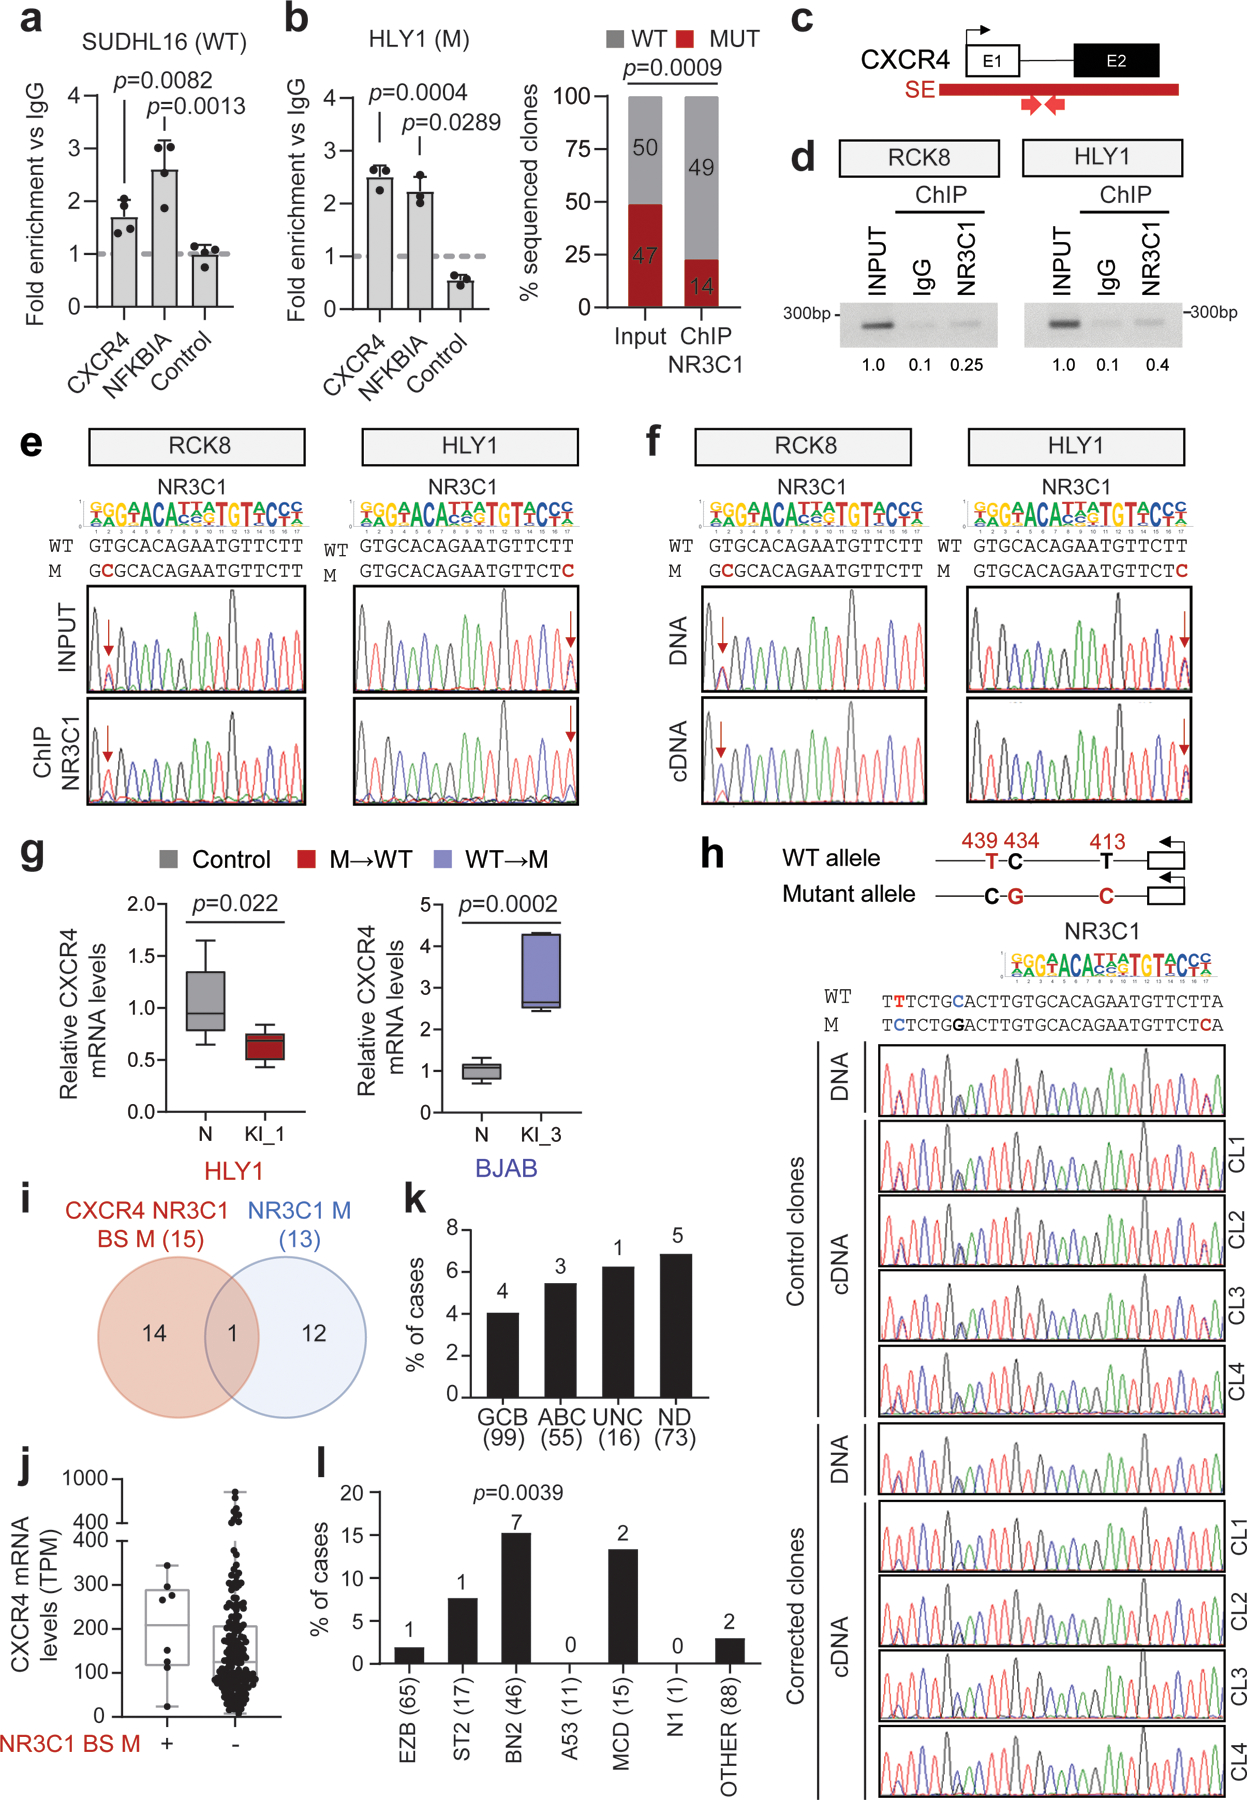
a. NR3C1 ChIP-qPCR of the region encompassing the CXCR4-SE mutational hotspot or the NFKBIA control region and a negative control region in the WT SUDHL16 cell line (mean +/− SD; n=4 technical replicates, from one representative experiment out of 2 independent experiments that gave analogous results, one-way ANOVA with Bonferroni correction). Data are expressed as fold enrichment vs. control IgG IP. b. NR3C1 ChIP-qPCR (left) and allelic quantification in the mutant (right) HLY1 cell line (mean +/− SD; n=3 technical replicates, from one representative of 2 independent experiments, one-way ANOVA with Bonferroni correction and two-tailed Fisher’s exact test). c. Simplified schematic of the CXCR4 locus; the recurrently hypermutated SE is shown in red, and the primers used for NR3C1-ChIP are approximately positioned below the map. d. Gel electrophoresis of NR3C1 ChIP-PCR amplicons from the indicted cell lines, as compared to input and control IgG ChIP. Band quantification was obtained by densitometry and the relative values are provided below the image, with input set as 1 (data shown are representative of 2 independent experiments). e. Sequencing analysis of the PCR products shown in d. On the top panel, the reference CXCR4 genomic sequence (NM_003467) and the sequence of the mutated allele are aligned to the predicted NR3C1 binding motif (reverse strand). Sequencing traces of ChIP-PCR amplicons document reduced signal for the mutant allele, as compared to the input (arrow), indicating abrogation of NR3C1 binding by the mutations. f. Sequencing traces of DNA and cDNA amplicons obtained from the same clones shown in e. Arrows indicate the mutated position. g. Relative changes in CXCR4 expression between unedited and CXCR4-corrected isogenic clones (n=8 each for HLY,1 and n=6 each for BJAB), color coded as in Fig 6e. For each cell line, the mean value of unedited clones is set as 1 (two-tailed unpaired t-test). h. CXCR4 allelic expression in clones surviving correction of the CXCR4-SE mutation. Top: Schematic diagram of the wild-type (WT) and mutant (M) CXCR4 alleles in the HLY1 cell line, carrying the A413G nucleotide substitution. Additional SNVs segregating with the two alleles and used to track allele-specific expression are also indicated, in red. The nucleotide sequence of the two alleles with the predicted NR3C1 binding motif, is shown below the diagram and is aligned to the sequencing tracks (reverse strand) of representative DNA and cDNA amplicons obtained from isogenic HLY1 clones (control, clones edited in the neutral genomic region; corrected, clones corrected in the 413 position within the CXCR4-SE). Arrow points to the mutated/corrected nucleotide. i. Relative distribution of genetic lesions affecting the CXCR4:NR3C1 axis in DLBCL. Overlap between DLBCL cases harboring mutations in the CXCR4-NR3C1 binding site (red) and/or in the NR3C1 coding exons (blue). Data are from 315 cases analyzed by WGS or Sanger sequencing. j. CXCR4 expression levels in DLBCL primary cases harboring WT vs. mutated CXCR4-SE sequences (n=181 cases with available WGS and RNA-seq data). Data are expressed as TPM. k. Percentage of cases harboring CXCR4-SE mutations in DLBCL COO subtypes. The total number of cases analyzed within each subtype is provided in brackets, and the number of mutated cases is shown on the top. l. Percentage of cases harboring CXCR4-SE mutations in different LymphGen genetic classes. P-values were calculated by two-tailed Fisher’s exact test for enrichment of a genetic lesion in a specific LymphGen class versus the other classes combined. The total number of cases analyzed within each class is provided in brackets, and the number of mutated cases is shown on the top. Data indicate a significant enrichment in the BN2 subtype (two-tailed Fisher’s exact test).
Supplementary Material
ACKNOWLEDGEMENTS
We thank Alberto Ciccia and Tarun S. Nambiar (Columbia University) for their expert advices on the design of CRISPR-Cas9 experiments, Keith R. Loeb and Lawrence A. Loeb for sharing the BCL6 mutation data in memory B cells prior to publication, and Amartya Singh (Rutgers University) for help with the multivariate analysis. We also thank Adolfo A. Ferrando (Columbia University), Ulf Klein (University of Leeds), and Ralf Küppers (University of Duisburg-Essen) for critically reading the manuscript. This study was supported by NIH grants R35-CA210105 (to R.D-F), R01-CA172492 (to L.P.), R01-CA233662 (to H.K.); an Astra Zeneca Scholar Award (to R.D.-F. and L.P.), a Herbert Irving Comprehensive Cancer Center (HICCC) VELOCITY award (to L.P. and R.D.-F.), and a Translational Grant from the V Foundation (T2019–012) (to H.K.). The study was also funded in part through the NIH/NCI Cancer Center Support Grant P30-CA13696 (HICCC) and P30-CA072720 (Rutgers Cancer Institute of New Jersey), and used the resources of the HICCC CCTI Flow Cytometry Core Facility, Molecular Pathology Shared Resource, and JP Sulzberger Genome Center at Columbia University Irving Medical Center, as well as the Biomedical Informatics Shared Resource at Rutgers Cancer Institute of New Jersey. E.B. was an AACR-Astra Zeneca Lymphoma Research Fellow, and C.C. is supported by a Lymphoma Research Foundation fellowship. K.D. was supported by grant 1P01CA229100 from the National Cancer Institute (to D. W. Scott). The results published here are in whole or in part based upon data generated by the Cancer Genome Characterization Initiative (CGCI)(phs000235), Non-Hodgkin Lymphoma, developed by the NCI. The data used for this analysis are available at https://www.ncbi.nlm.nih.gov/projects/gap/cgi-bin/study.cgi?study_id=phs000235.v14.p2 and https://www.ncbi.nlm.nih.gov/projects/gap/cgi-bin/study.cgi?study_id=phs000527.v3.p1. Information about CGCI projects can be found at https://ocg.cancer.gov/programs/cgci. We also acknowledge the ICGC MALY-DE project (https://dcc.icgc.org) and the European Genome-phenome Archive (https://ega-archive.org) for providing access to their datasets. All data were were used according to the data use agreements.
Footnotes
CODE AVAILABILITY
No custom codes were used in the study
COMPETING INTERESTS
R.D.-F. is a member of the scientific advisory board of NeoGenomics, and a consultant of Astra Zeneca. The work reported in this paper has no relation to the current activities in these companies.
ADDITIONAL INFORMATION
Supplementary information. The online version contains supplementary material available at…..
DATA AVAILABILITY
Raw WGS data from 20 DLBCL primary cases and 21 DLBCL cell lines were deposited in the dbGaP database under accession no. phs000328.v3.p1. H3K27Ac ChIP-seq data from the 29 cell lines were deposited in the GEO database under accession no. GSE182214. Other WGS datasets used in this analysis were downloaded from the European Genome-phenome Archive (Accession no. EGAD00001004142, EGAD00001006087, and EGAD00001003783)10,34; dbGaP (Study no. phs000235.v14.p2 and phs000527.v3.p1); the NCBI (SRP020237); the GEO database (Accession No GSE89688 for H3K27Ac data of normal GC B cells and GSE69558 for H3K27Ac data of primary lymphoma cases); and the ICGC Xena portal at https://xenabrowser.net/datapages/?hub=https://pcawg.xenahubs.net:443.
REFERENCES
- 1.Pasqualucci L et al. Analysis of the coding genome of diffuse large B-cell lymphoma. Nat Genet 43, 830–837, doi: 10.1038/ng.892 (2011). [DOI] [PMC free article] [PubMed] [Google Scholar]
- 2.Morin RD et al. Frequent mutation of histone-modifying genes in non-Hodgkin lymphoma. Nature 476, 298–303, doi: 10.1038/nature10351 (2011). [DOI] [PMC free article] [PubMed] [Google Scholar]
- 3.Reddy A et al. Genetic and Functional Drivers of Diffuse Large B Cell Lymphoma. Cell 171, 481–494 e415, doi: 10.1016/j.cell.2017.09.027 (2017). [DOI] [PMC free article] [PubMed] [Google Scholar]
- 4.Chapuy B et al. Molecular subtypes of diffuse large B cell lymphoma are associated with distinct pathogenic mechanisms and outcomes. Nature medicine 24, 679–690, doi: 10.1038/s41591-018-0016-8 (2018). [DOI] [PMC free article] [PubMed] [Google Scholar]
- 5.Schmitz R et al. Genetics and Pathogenesis of Diffuse Large B-Cell Lymphoma. The New England journal of medicine 378, 1396–1407, doi: 10.1056/NEJMoa1801445 (2018). [DOI] [PMC free article] [PubMed] [Google Scholar]
- 6.Roschewski M, Staudt LM & Wilson WH Diffuse large B-cell lymphoma-treatment approaches in the molecular era. Nature reviews. Clinical oncology 11, 12–23, doi: 10.1038/nrclinonc.2013.197 (2014). [DOI] [PMC free article] [PubMed] [Google Scholar]
- 7.Alizadeh AA et al. Distinct types of diffuse large B-cell lymphoma identified by gene expression profiling. Nature 403, 503–511, doi: 10.1038/35000501 (2000). [DOI] [PubMed] [Google Scholar]
- 8.Rosenwald A et al. The use of molecular profiling to predict survival after chemotherapy for diffuse large-B-cell lymphoma. The New England journal of medicine 346, 1937–1947, doi: 10.1056/NEJMoa012914 (2002). [DOI] [PubMed] [Google Scholar]
- 9.Pasqualucci L & Dalla-Favera R Genetics of diffuse large B-cell lymphoma. Blood 131, 2307–2319, doi: 10.1182/blood-2017-11-764332 (2018). [DOI] [PMC free article] [PubMed] [Google Scholar]
- 10.Arthur SE et al. Genome-wide discovery of somatic regulatory variants in diffuse large B-cell lymphoma. Nature communications 9, 4001, doi: 10.1038/s41467-018-06354-3 (2018). [DOI] [PMC free article] [PubMed] [Google Scholar]
- 11.Wilson WH et al. Targeting B cell receptor signaling with ibrutinib in diffuse large B cell lymphoma. Nature medicine 21, 922–926, doi: 10.1038/nm.3884 (2015). [DOI] [PMC free article] [PubMed] [Google Scholar]
- 12.Wright GW et al. A Probabilistic Classification Tool for Genetic Subtypes of Diffuse Large B Cell Lymphoma with Therapeutic Implications. Cancer cell 37, 551–568 e514, doi: 10.1016/j.ccell.2020.03.015 (2020). [DOI] [PMC free article] [PubMed] [Google Scholar]
- 13.Lacy SE et al. Targeted sequencing in DLBCL, molecular subtypes, and outcomes: a Haematological Malignancy Research Network report. Blood 135, 1759–1771, doi: 10.1182/blood.2019003535 (2020). [DOI] [PMC free article] [PubMed] [Google Scholar]
- 14.Mansour MR et al. Oncogene regulation. An oncogenic super-enhancer formed through somatic mutation of a noncoding intergenic element. Science 346, 1373–1377, doi: 10.1126/science.1259037 (2014). [DOI] [PMC free article] [PubMed] [Google Scholar]
- 15.Abraham BJ et al. Small genomic insertions form enhancers that misregulate oncogenes. Nature communications 8, 14385, doi: 10.1038/ncomms14385 (2017). [DOI] [PMC free article] [PubMed] [Google Scholar]
- 16.Koues OI et al. Enhancer sequence variants and transcription-factor deregulation synergize to construct pathogenic regulatory circuits in B-cell lymphoma; Immunity 42(1):186–98 (2015) [DOI] [PMC free article] [PubMed] [Google Scholar]
- 17.Pasqualucci L et al. Hypermutation of multiple proto-oncogenes in B-cell diffuse large-cell lymphomas. Nature 412, 341–346, doi: 10.1038/35085588 (2001). [DOI] [PubMed] [Google Scholar]
- 18.Honjo T, Muramatsu M & Fagarasan S AID: how does it aid antibody diversity? Immunity 20, 659–668, doi: 10.1016/j.immuni.2004.05.011 (2004). [DOI] [PubMed] [Google Scholar]
- 19.Qian J et al. B cell super-enhancers and regulatory clusters recruit AID tumorigenic activity. Cell 159, 1524–1537, doi: 10.1016/j.cell.2014.11.013 (2014). [DOI] [PMC free article] [PubMed] [Google Scholar]
- 20.Meng FL et al. Convergent transcription at intragenic super-enhancers targets AID-initiated genomic instability. Cell 159, 1538–1548, doi: 10.1016/j.cell.2014.11.014 (2014). [DOI] [PMC free article] [PubMed] [Google Scholar]
- 21.Hubschmann D et al. Mutational mechanisms shaping the coding and noncoding genome of germinal center derived B-cell lymphomas. Leukemia 35, 2002–2016, doi: 10.1038/s41375-021-01251-z (2021). [DOI] [PMC free article] [PubMed] [Google Scholar]
- 22.Whyte WA et al. Master transcription factors and mediator establish super-enhancers at key cell identity genes. Cell 153, 307–319, doi: 10.1016/j.cell.2013.03.035 (2013). [DOI] [PMC free article] [PubMed] [Google Scholar]
- 23.Ryan RJ et al. Detection of Enhancer-Associated Rearrangements Reveals Mechanisms of Oncogene Dysregulation in B-cell Lymphoma. Cancer discovery 5, 1058–1071, doi: 10.1158/2159-8290.CD-15-0370 (2015). [DOI] [PMC free article] [PubMed] [Google Scholar]
- 24.Tippens ND et al. Transcription imparts architecture, function and logic to enhancer units. Nat Genet 52, 1067–1075, doi: 10.1038/s41588-020-0686-2 (2020). [DOI] [PMC free article] [PubMed] [Google Scholar]
- 25.Pefanis E et al. RNA exosome-regulated long non-coding RNA transcription controls super-enhancer activity. Cell 161, 774–789, doi: 10.1016/j.cell.2015.04.034 (2015). [DOI] [PMC free article] [PubMed] [Google Scholar]
- 26.Imielinski M, Guo G & Meyerson M Insertions and Deletions Target Lineage-Defining Genes in Human Cancers. Cell 168, 460–472 e414, doi: 10.1016/j.cell.2016.12.025 (2017). [DOI] [PMC free article] [PubMed] [Google Scholar]
- 27.Shinde J et al. Palimpsest: an R package for studying mutational and structural variant signatures along clonal evolution in cancer. Bioinformatics 34, 3380–3381, doi: 10.1093/bioinformatics/bty388 (2018). [DOI] [PubMed] [Google Scholar]
- 28.Alexandrov LB et al. The repertoire of mutational signatures in human cancer. Nature 578, 94–101, doi: 10.1038/s41586-020-1943-3 (2020). [DOI] [PMC free article] [PubMed] [Google Scholar]
- 29.Pham P, Bransteitter R, Petruska J & Goodman MF Processive AID-catalysed cytosine deamination on single-stranded DNA simulates somatic hypermutation. Nature 424, 103–107, doi: 10.1038/nature01760 (2003). [DOI] [PubMed] [Google Scholar]
- 30.Balinas-Gavira C et al. Frequent mutations in the amino-terminal domain of BCL7A impair its tumor suppressor role in DLBCL. Leukemia 34, 2722–2735, doi: 10.1038/s41375-020-0919-5 (2020). [DOI] [PubMed] [Google Scholar]
- 31.Mottok A et al. Genomic Alterations in CIITA Are Frequent in Primary Mediastinal Large B Cell Lymphoma and Are Associated with Diminished MHC Class II Expression. Cell reports 13, 1418–1431, doi: 10.1016/j.celrep.2015.10.008 (2015). [DOI] [PubMed] [Google Scholar]
- 32.Kuhrt D & Wojchowski DM Emerging EPO and EPO receptor regulators and signal transducers. Blood 125, 3536–3541, doi: 10.1182/blood-2014-11-575357 (2015). [DOI] [PMC free article] [PubMed] [Google Scholar]
- 33.Basso K & Dalla-Favera R Roles of BCL6 in normal and transformed germinal center B cells. Immunological reviews 247, 172–183, doi: 10.1111/j.1600-065X.2012.01112.x (2012). [DOI] [PubMed] [Google Scholar]
- 34.Hilton LK et al. The double-hit signature identifies double-hit diffuse large B-cell lymphoma with genetic events cryptic to FISH. Blood 134, 1528–1532, doi: 10.1182/blood.2019002600 (2019). [DOI] [PMC free article] [PubMed] [Google Scholar]
- 35.Shapiro-Shelef M et al. Blimp-1 is required for the formation of immunoglobulin secreting plasma cells and pre-plasma memory B cells. Immunity 19, 607–620, doi: 10.1016/s1074-7613(03)00267-x (2003). [DOI] [PubMed] [Google Scholar]
- 36.Mandelbaum J et al. BLIMP1 is a tumor suppressor gene frequently disrupted in activated B cell-like diffuse large B cell lymphoma. Cancer cell 18, 568–579, doi: 10.1016/j.ccr.2010.10.030 (2010). [DOI] [PMC free article] [PubMed] [Google Scholar]
- 37.Parekh S et al. BCL6 programs lymphoma cells for survival and differentiation through distinct biochemical mechanisms. Blood 110, 2067–2074, doi: 10.1182/blood-2007-01-069575 (2007). [DOI] [PMC free article] [PubMed] [Google Scholar]
- 38.Shaffer AL et al. Blimp-1 orchestrates plasma cell differentiation by extinguishing the mature B cell gene expression program. Immunity 17, 51–62, doi: 10.1016/s1074-7613(02)00335-7 (2002). [DOI] [PubMed] [Google Scholar]
- 39.Saito M et al. BCL6 suppression of BCL2 via Miz1 and its disruption in diffuse large B cell lymphoma. Proceedings of the National Academy of Sciences of the United States of America 106, 11294–11299, doi: 10.1073/pnas.0903854106 (2009). [DOI] [PMC free article] [PubMed] [Google Scholar]
- 40.Liu M et al. Two levels of protection for the B cell genome during somatic hypermutation. Nature 451, 841–845, doi: 10.1038/nature06547 (2008). [DOI] [PubMed] [Google Scholar]
- 41.Weikum ER, Knuesel MT, Ortlund EA & Yamamoto KR Glucocorticoid receptor control of transcription: precision and plasticity via allostery. Nature reviews. Molecular cell biology 18, 159–174, doi: 10.1038/nrm.2016.152 (2017). [DOI] [PMC free article] [PubMed] [Google Scholar]
- 42.Xiao H et al. Haploinsufficiency of NR3C1 drives glucocorticoid resistance in adult acute lymphoblastic leukemia cells by down-regulating the mitochondrial apoptosis axis, and is sensitive to Bcl-2 blockage. Cancer cell international 19, 218, doi: 10.1186/s12935-019-0940-9 (2019). [DOI] [PMC free article] [PubMed] [Google Scholar]
- 43.Allen CD et al. Germinal center dark and light zone organization is mediated by CXCR4 and CXCR5. Nature immunology 5, 943–952, doi: 10.1038/ni1100 (2004). [DOI] [PubMed] [Google Scholar]
- 44.Kaiser LM, Hunter ZR, Treon SP & Buske C CXCR4 in Waldenstrom’s Macroglobulinema: chances and challenges. Leukemia 35, 333–345, doi: 10.1038/s41375-020-01102-3 (2021). [DOI] [PMC free article] [PubMed] [Google Scholar]
- 45.Pasqualucci L et al. BCL-6 mutations in normal germinal center B cells: evidence of somatic hypermutation acting outside Ig loci. Proceedings of the National Academy of Sciences of the United States of America 95, 11816–11821, doi: 10.1073/pnas.95.20.11816 (1998). [DOI] [PMC free article] [PubMed] [Google Scholar]
- 46.Shen HM, Peters A, Baron B, Zhu X & Storb U Mutation of BCL-6 gene in normal B cells by the process of somatic hypermutation of Ig genes. Science 280, 1750–1752, doi: 10.1126/science.280.5370.1750 (1998). [DOI] [PubMed] [Google Scholar]
- 47.Shen JC et al. A high-resolution landscape of mutations in the BCL6 super-enhancer in normal human B cells. Proceedings of the National Academy of Sciences of the United States of America 116, 24779–24785, doi: 10.1073/pnas.1914163116 (2019). [DOI] [PMC free article] [PubMed] [Google Scholar]
- 48.Gamberi B et al. Microsatellite instability is rare in B-cell non-Hodgkin’s lymphomas. Blood 89, 975–979 (1997). [PubMed] [Google Scholar]
- 49.de Miranda NF et al. DNA repair genes are selectively mutated in diffuse large B cell lymphomas. The Journal of experimental medicine 210, 1729–1742, doi: 10.1084/jem.20122842 (2013). [DOI] [PMC free article] [PubMed] [Google Scholar]
- 50.Cattoretti G et al. Deregulated BCL6 expression recapitulates the pathogenesis of human diffuse large B cell lymphomas in mice. Cancer cell 7, 445–455, doi: 10.1016/j.ccr.2005.03.037 (2005). [DOI] [PubMed] [Google Scholar]
- 51.Batmanov K, Wang W, Bjoras M, Delabie J & Wang J Integrative whole-genome sequence analysis reveals roles of regulatory mutations in BCL6 and BCL2 in follicular lymphoma. Scientific reports 7, 7040, doi: 10.1038/s41598-017-07226-4 (2017). [DOI] [PMC free article] [PubMed] [Google Scholar]
ADDITIONAL REFERENCES
- 52.Morin RD et al. Mutational and structural analysis of diffuse large B-cell lymphoma using whole-genome sequencing. Blood 122, 1256–1265, doi: 10.1182/blood-2013-02-483727 (2013). [DOI] [PMC free article] [PubMed] [Google Scholar]
- 53.Compagno M et al. Mutations of multiple genes cause deregulation of NF-kappaB in diffuse large B-cell lymphoma. Nature 459, 717–721, doi: 10.1038/nature07968 (2009). [DOI] [PMC free article] [PubMed] [Google Scholar]
- 54.Grande BM et al. Genome-wide discovery of somatic coding and noncoding mutations in pediatric endemic and sporadic Burkitt lymphoma. Blood 133, 1313–1324, doi: 10.1182/blood-2018-09-871418 (2019). [DOI] [PMC free article] [PubMed] [Google Scholar]
- 55.Puente XS et al. Non-coding recurrent mutations in chronic lymphocytic leukaemia. Nature 526, 519–524, doi: 10.1038/nature14666 (2015). [DOI] [PubMed] [Google Scholar]
- 56.Li H & Durbin R Fast and accurate short read alignment with Burrows-Wheeler transform. Bioinformatics 25, 1754–1760 (2009). [DOI] [PMC free article] [PubMed] [Google Scholar]
- 57.McKenna A et al. The Genome Analysis Toolkit: a MapReduce framework for analyzing next-generation DNA sequencing data. Genome Res 20, 1297–1303 (2010) [DOI] [PMC free article] [PubMed] [Google Scholar]
- 58.Li H et al. The Sequence Alignment/Map format and SAMtools. Bioinformatics 25, 2078–2079, doi: 10.1093/bioinformatics/btp352 (2009). [DOI] [PMC free article] [PubMed] [Google Scholar]
- 59.Kim S et al. Strelka2: fast and accurate calling of germline and somatic variants. Nature methods 15, 591–594, doi: 10.1038/s41592-018-0051-x (2018). [DOI] [PubMed] [Google Scholar]
- 60.Karczewski KJ et al. The mutational constraint spectrum quantified from variation in 141,456 humans. Nature 581, 434–443, doi: 10.1038/s41586-020-2308-7 (2020). [DOI] [PMC free article] [PubMed] [Google Scholar]
- 61.Favero F et al. Sequenza: allele-specific copy number and mutation profiles from tumor sequencing data. Annals of oncology : official journal of the European Society for Medical Oncology 26, 64–70, doi: 10.1093/annonc/mdu479 (2015). [DOI] [PMC free article] [PubMed] [Google Scholar]
- 62.Wala JA et al. SvABA: genome-wide detection of structural variants and indels by local assembly. Genome research 28, 581–591, doi: 10.1101/gr.221028.117 (2018). [DOI] [PMC free article] [PubMed] [Google Scholar]
- 63.Chen X et al. Manta: rapid detection of structural variants and indels for germline and cancer sequencing applications. Bioinformatics 32, 1220–1222, doi: 10.1093/bioinformatics/btv710 (2016). [DOI] [PubMed] [Google Scholar]
- 64.Quinlan AR BEDTools: The Swiss-Army Tool for Genome Feature Analysis. Current protocols in bioinformatics 47, 11 12 11–34, doi: 10.1002/0471250953.bi1112s47 (2014). [DOI] [PMC free article] [PubMed] [Google Scholar]
- 65.Zhang J et al. Disruption of KMT2D perturbs germinal center B cell development and promotes lymphomagenesis. Nature medicine 21, 1190–1198, doi: 10.1038/nm.3940 (2015). [DOI] [PMC free article] [PubMed] [Google Scholar]
- 66.Zhang J et al. The CREBBP Acetyltransferase Is a Haploinsufficient Tumor Suppressor in B-cell Lymphoma. Cancer discovery 7, 322–337, doi: 10.1158/2159-8290.CD-16-1417 (2017). [DOI] [PMC free article] [PubMed] [Google Scholar]
- 67.Giannopoulou EG & Elemento O An integrated ChIP-seq analysis platform with customizable workflows. BMC bioinformatics 12, 277, doi: 10.1186/1471-2105-12-277 (2011). [DOI] [PMC free article] [PubMed] [Google Scholar]
- 68.Amemiya HM, Kundaje A & Boyle AP The ENCODE Blacklist: Identification of Problematic Regions of the Genome. Scientific reports 9, 9354, doi: 10.1038/s41598-019-45839-z (2019). [DOI] [PMC free article] [PubMed] [Google Scholar]
- 69.Ernst J et al. Mapping and analysis of chromatin state dynamics in nine human cell types. Nature 473, 43–49, doi: 10.1038/nature09906 (2011). [DOI] [PMC free article] [PubMed] [Google Scholar]
- 70.Love MI, Huber W & Anders S Moderated estimation of fold change and dispersion for RNA-seq data with DESeq2. Genome biology 15, 550, doi: 10.1186/s13059-014-0550-8 (2014). [DOI] [PMC free article] [PubMed] [Google Scholar]
- 71.Bunting KL et al. Multi-tiered Reorganization of the Genome during B Cell Affinity Maturation Anchored by a Germinal Center-Specific Locus Control Region. Immunity 45, 497–512, doi: 10.1016/j.immuni.2016.08.012 (2016). [DOI] [PMC free article] [PubMed] [Google Scholar]
- 72.Bailey TL, Johnson J, Grant CE & Noble WS The MEME Suite. Nucleic acids research 43, W39–49, doi: 10.1093/nar/gkv416 (2015). [DOI] [PMC free article] [PubMed] [Google Scholar]
- 73.Jolma A et al. DNA-binding specificities of human transcription factors. Cell 152, 327–339, doi: 10.1016/j.cell.2012.12.009 (2013). [DOI] [PubMed] [Google Scholar]
- 74.Dobin A et al. STAR: ultrafast universal RNA-seq aligner. Bioinformatics 29, 15–21, doi: 10.1093/bioinformatics/bts635 (2013). [DOI] [PMC free article] [PubMed] [Google Scholar]
- 75.Liao Y, Smyth GK & Shi W featureCounts: an efficient general purpose program for assigning sequence reads to genomic features. Bioinformatics 30, 923–930, doi: 10.1093/bioinformatics/btt656 (2014). [DOI] [PubMed] [Google Scholar]
- 76.Meyer SN et al. Unique and Shared Epigenetic Programs of the CREBBP and EP300 Acetyltransferases in Germinal Center B Cells Reveal Targetable Dependencies in Lymphoma. Immunity 51, 535–547 e539, doi: 10.1016/j.immuni.2019.08.006 (2019). [DOI] [PMC free article] [PubMed] [Google Scholar]
- 77.Bereshchenko OR, Gu W & Dalla-Favera R Acetylation inactivates the transcriptional repressor BCL6. Nat Genet 32, 606–613, doi: 10.1038/ng1018 (2002). [DOI] [PubMed] [Google Scholar]
- 78.Pasqualucci L et al. Mutations of the BCL6 proto-oncogene disrupt its negative autoregulation in diffuse large B-cell lymphoma. Blood 101, 2914–2923, doi: 10.1182/blood-2002-11-3387 (2003). [DOI] [PubMed] [Google Scholar]
- 79.Unnikrishnan A et al. A quantitative proteomics approach identifies ETV6 and IKZF1 as new regulators of an ERG-driven transcriptional network. Nucleic acids research 44, 10644–10661, doi: 10.1093/nar/gkw804 (2016). [DOI] [PMC free article] [PubMed] [Google Scholar]
- 80.Shevchenko A, Tomas H, Havlis J, Olsen JV & Mann M In-gel digestion for mass spectrometric characterization of proteins and proteomes. Nat Protoc 1, 2856–2860, doi: 10.1038/nprot.2006.468 (2006). [DOI] [PubMed] [Google Scholar]
- 81.Meier F et al. Online Parallel Accumulation Serial Fragmentation (PASEF) with a Novel Trapped on Mobility Mass Spectrometer. Mol Cell Proteomics 17, 2534–2545, doi: 10.1074/mcp.TIR118.000900 (2018). [DOI] [PMC free article] [PubMed] [Google Scholar]
- 82.Cox J et al. Andromeda: a peptide search engine integrated into the MaxQuant environment. J. Proteome Res 10, 1794–1805 (2011). [DOI] [PubMed] [Google Scholar]
- 83.The ICGC/TCGA Pan-Cancer Analysis of Whole Genomes Consortium. Pan-cancer analysis of whole genomes. Nature 578, 82–93 (2020). [DOI] [PMC free article] [PubMed] [Google Scholar]
Associated Data
This section collects any data citations, data availability statements, or supplementary materials included in this article.
Supplementary Materials
Data Availability Statement
Raw WGS data from 20 DLBCL primary cases and 21 DLBCL cell lines were deposited in the dbGaP database under accession no. phs000328.v3.p1. H3K27Ac ChIP-seq data from the 29 cell lines were deposited in the GEO database under accession no. GSE182214. Other WGS datasets used in this analysis were downloaded from the European Genome-phenome Archive (Accession no. EGAD00001004142, EGAD00001006087, and EGAD00001003783)10,34; dbGaP (Study no. phs000235.v14.p2 and phs000527.v3.p1); the NCBI (SRP020237); the GEO database (Accession No GSE89688 for H3K27Ac data of normal GC B cells and GSE69558 for H3K27Ac data of primary lymphoma cases); and the ICGC Xena portal at https://xenabrowser.net/datapages/?hub=https://pcawg.xenahubs.net:443.


