

Abstract
Chromatin modifications are epigenetic regulatory features with major roles in various cellular events, yet they remain understudied in algae. We interrogated the genome wide distribution pattern of mono- and trimethylated H3K4 using chromatin-immunoprecipitation followed by deep-sequencing (ChIP-Seq) during key phases of the Chlamydomonas cell cycle: early G1 phase (Zeitgeber Time 1, ZT1) when cells initiate biomass accumulation, S/M phase (ZT13) when cells are replicating DNA and undergoing mitosis, and late G0 phase (ZT23) when they are quiescent. Tri-methylated H3K4 was predominantly enriched at TSSs of the majority of protein coding genes (85%). The likelihood of a gene being marked by H3K4me3 correlated with it being transcribed at some point during the life cycle but not necessarily by continuous active transcription, as exemplified by early zygotic genes, which may remain transcriptionally dormant for thousands of generations between sexual cycles. The exceptions to this rule were around 120 loci, some of which encode non-poly-adenylated transcripts, such as snRNAs and replication dependent histones that had H3K4me3 peaks only when they were being transcribed. Mono-methylated H3K4 was the default state for the vast majority of histones that were bound outside of transcription start sites (TSSs) and terminator regions of genes. A small fraction of the genome that was depleted of any H3 lysine 4 methylation was enriched for DNA cytosine methylation and the genes within these DNA methylation islands were poorly expressed. Besides marking protein-coding genes, H3K4me3 ChIP-Seq data served also as a annotation tool for validation of hundreds of long non-coding RNA genes.
Keywords: meiotic genes, non-poly-adenylated transcripts, replication-dependent histones, DNA methylation
INTRODUCTION
Eukaryotic nuclear DNA is organized into chromatin, enabling condensed packaging of DNA in the nucleus. Chromatin can be subdivided into domains of euchromatin and heterochromatin. These domains are defined by their level of compaction and are usually associated with active gene expression for euchromatin and silent, repeat-rich DNA for heterochromatin. Nucleosomes composed of histone octamers and wrapped with DNA are the fundamental packaging unit for chromatin (Luger et al., 1997, Workman and Kingston, 1998, Luger, 2003). Histones are positively-charged, mainly globular proteins with unstructured N-terminal tails that carry many posttranslational modifications (PTMs). The identification of specific types of histone modifications at different loci and chromatin domains --including acetylation, methylation, phosphorylation, sumoylation and ubiquitination-- suggested that chromatin contains complex regulatory features in addition to its packing function (Bannister and Kouzarides, 2011). Accordingly, different histone PTMs have been correlated with the repression or activation of associated gene expression (Strahl and Allis, 2000, Li et al., 2007). Previous studies have demonstrated that histone lysine methylation deposited by histone methyltransferases and recognized by a variety of chromatin “readers” plays an important role in regulating gene expression in diverse eukaryotic taxa. Histone H3 lysine 4 (H3K4) methylation is one of the most studied histone PTM and H3K4 can have up to three different methylation states, mono-, di- or tri-methylation (Kouzarides, 2007).
Methylation of H3K4 has been extensively studied in the budding yeast Saccharomyces cerevisiae. In S. cerevisiae, tri-methylation of Lysine 4 at histone H3 is a signature motif at the 5′ end of transcribed open reading frames and marks transcription start sites (TSS) of genes that are poised for transcription (Bernstein et al., 2002, Santos-Rosa et al., 2002, Ng et al., 2003, Schneider et al., 2004). Furthermore, H3K4me3 was also associated with epigenetic memory (Ng et al., 2003) and maintaining appropriate regulation of gene expression as cells age (Cruz et al., 2018). Mono-, di-, and trimethylation of H3K4 is mediated by the Set1 subunit of the COMPASS complex in yeast (Miller et al., 2001, Roguev et al., 2001, Nagy et al., 2002). Notably, enrichment of H3K4me3 at the 5′ end of open reading frames (ORFs) seems to be conserved in metazoans. In humans, mouse and fly, H3K4me3 is also enriched at TSS of actively transcribed genes (Schübeler et al., 2004, Bernstein et al., 2005, Barski et al., 2007, Guenther et al., 2007). In mammalian cell lines, H3K4me3 is mediated primarily by Set1A and Set1B, two members of the COMPASS family of methyltransferases with partially redundant function (Piunti and Shilatifard, 2016, Sze et al., 2020). By contrast, mono-methylation of H3K4 (H3K4me1) was shown to be enriched predominantly at enhancers (Heintzman et al., 2007), with a fraction of H3K4me1 also found at or around promoter regions, depending on the co-occurrence of other histone marks at the respective loci (Bae and Lesch, 2020).
In land plants, such as Arabidopsis, rice and maize, tri-methylation at lysine 4 of histone H3 occurs predominantly at gene promoters, while mono-methylation at lysine 4 of histone H3 is distributed within transcribed regions in Arabidopsis (Oh et al., 2008, Wang et al., 2009, Zhang et al., 2009, He et al., 2010, Zong et al., 2013) where it is highly correlated with DNA methylation (Zhang et al., 2009). While H3K4me3 peaks at TSSs seem to be stable after environmental perturbations in most organisms, enrichment of H3K4me3 at promoter regions displayed dynamic changes in response to dehydration stress in Arabidopsis (van Dijk et al., 2010). In summary, H3K4me3 marks promoters and can be quite dynamic in certain situations while genomic distribution of H3K4me1 seems to vary between taxa and either occupies distant enhancers, promoter regions or gene bodies.
We sought to document H3K4 mono- and tri-methylation in Chlamydomonas reinhardtii (referred to Chlamydomonas hereafter), a reference organism for investigating photosynthesis, the cell cycle, cilium biogenesis, cellular metabolism and other processes (Harris, 2008). Previous chromatographic and mass spectrometry studies of bulk purified histones revealed that nearly all detectable H3 has lysine methylation in Chlamydomonas with very little unmethylated H3 (Waterborg et al., 1995, Khan et al., 2018, Rommelfanger et al., 2021). The majority of H3K4 was mono-methylated (H3K4me1) with a few percent having tri-methylation (H3K4me3). Moreover, using top-down mass spectrometry, a strong positive correlation was found between H3K4me3 and high levels of H3 acetylation, while H3K4me1 H3 had much lower acetylation levels (Rommelfanger et al., 2021). Mono- and tri-methylation of lysine 4 at histone H3 have been further studied in Chlamydomonas, but mainly in the context of transgene silencing and at single loci using chromatin immunoprecipitation and quantitative PCR (ChIP-qPCR) (van Dijk et al., 2005, Strenkert et al., 2013). H3K4me1 was associated with inactive euchromatin at transgenic loci, while H3K4me3 was enriched at promoters of highly transcribed RBCS2 and HSP70A genes (van Dijk et al., 2005, Strenkert et al., 2013). Genome wide profiling of H3K4me3, H3K9me3, H3K27me3 and H3K36me3 in response to nitrogen deficiency confirmed that H3K4me3 is enriched within TSSs in Chlamydomonas, while the majority of genomic loci seems to be devoid of any of the other histone modifications (Ngan et al., 2015). While earlier studies in Chlamydomonas addressed the combinatorial pattern of a subset of five different histone modifications and how they relate to gene expression in a particular stress situation, our study was specifically designed to uncover how genomic DNA methylation relates to H3K4 methylation (me1 and me3) and to investigate how different degrees of H3K4 methylation are co-regulated in a dynamically changing transcriptional landscape that occurs during the cell cycle.
Although some genes in Chlamydomonas are expressed stably and constitutively, most of the transcriptome is expressed in a periodic manner over the course of a diurnal cycle under phototrophic conditions. Under a typical 12 h light :12 h dark diurnal regime, cell growth (G1 phase) occurs during the light period and cell division (S and M phases or S/M) occurs by multiple fission around the time of the light-to-dark transition and is followed by a quiescent period (G0) before the next light phase (Fig. 1) (Zones et al., 2015, Strenkert et al., 2019). There are also some genes in Chlamydomonas that are expressed infrequently and facultatively such as those required during gametogenesis, mating and the diploid phase of the life cycle (Ning et al., 2013, Lopez et al., 2015, Joo et al., 2017), or those induced under specific stress conditions (Gonzalez-Ballester et al., 2010, Castruita et al., 2011, Urzica et al., 2012, Schmollinger et al., 2014). The relationships between these different gene expression patterns (always on, cycling on and off, and expressed infrequently and/or only under very specific conditions) and chromatin architecture have not been examined at this level previously.
Figure1. Experimental design and sampling scheme.

Diagram shows Zeitgeber Time (ZT) of light (ZT0 to ZT12), and dark (ZT12 to ZT24). Shown is a synchronized Chlamydomonas culture with growth (G1), division (S/M), and resting (G0) stages indicated by gray arrows. Experiments were performed exactly as described in Strenkert at al. 2019. Cultures were sampled at ZT1 (early G1), ZT13 (mitosis) and ZT23 (end of G0) (blue vertical lines).
Chromatin immunoprecipitation (ChIP) is one of the most widely used tools to discover DNA-protein interactions, and when combined with high-throughput sequencing (ChIP-Seq), it enables the discovery of epigenetic regulatory patterns on a genome wide scale. Here we focused on interrogating the methylation status of H3K4 during the vegetative cell cycle using ChIP-Seq under synchronous diurnal conditions. Combining ChIP-seq data for H3K4me3 and H3K4me1 with DNA methylation data and matching transcriptome data allowed us to produce an integrated map of epigenetic dynamics at key cell cycle phases. We used these data to discover conserved and novel features of epigenetic programming during the Chlamydomonas life cycle including the identification of a small group of genes with dynamic H3K4me3 peaks. This subgroup was enriched for genes encoding non-poly-adenylated transcripts, such as replication dependent histones. We further established how promoter enrichment of H3K4me3 can be used as a tool to facilitate annotation of novel protein coding genes as well as long non-coding RNAs (lncRNAs).
RESULTS
Comprehensive analysis of Chlamydomonas H3K4me3 and H3K4me1 during the vegetative cell cycle
We investigated two histone modifications (H3K4me1 and H3K4me3) in Chlamydomonas using ChIP-Seq, with input DNA serving as a control, and using antibodies that were previously shown to be effective for ChIP in Chlamydomonas (Strenkert et al., 2013). Absence of unspecific cross-reactivity of the exact batch of each antibody that was used for ChIP (H3K4me1 and H3K4me3) was confirmed using immunoblotting of Chlamydomonas whole cell lysates (Figure S1). We carried out ChIP-Seq at three key stages of a synchronous diurnal cycle under phototrophic conditions—early G1 phase (ZT1) when cells are actively photosynthesizing and growing in biomass, S/M phase (ZT13) when cells are rapidly dividing, and late G0 phase (ZT23) when cells are undergoing dark phase metabolism and photosynthesis is inactive (Figure 1). Matched RNA-Seq data from triplicate samples was obtained from a previous study (Strenkert et al., 2019) and analyzed along with ChIP-Seq data from this work. The majority of reads (> 91%) could be mapped to the nuclear genome, which suggested that the sequencing data were high quality (Data S1). Model-based analysis using MACS software (Zhang et al., 2008) was used for peak identification. We identified 13771, 14032 and 13733 H3K4me3 peaks in ZT1, ZT13 and ZT23, respectively (Table 1). Notably, replicate samples from all three time points showed excellent correlation with each other, with the majority of peaks (>98%) being identified in both replications (Table 1). Visual inspection of the data obtained for H3K4me1 on the genome browser revealed that the majority of the genome seems to be mono-methylated at H3K4 with no clear peak enrichment, making traditional peak calling impossible. This near featureless landscape of H3K4me1 was not due to a technical failure as we identified valleys of H3K4me1 depletion that overlapped with promoter regions (Figure S2) and H3K4me3 peaks (Table 1).
Table 1.
Peak calling statistics.
| Time point | Agreement between replicates (%) |
Total consensus peaks/depleted regions |
Number of peaks (w/gene overlap %) |
|---|---|---|---|
| H3K4me3, ZT1 | 98.5 | 13771 | 12754 (92.6) |
| H3K4me3, ZT13 | 99.7 | 14032 | 12903 (92.0) |
| H3K4me3, ZT23 | 99.0 | 13733 | 12733 (92.7) |
| H3K4me1, ZT1 | 91.3 | 10348 | 9980 (96.4) |
| H3K4me1, ZT13 | 94.0 | 12144 | 11377 (93.7) |
| H3K4me1, ZT23 | 91.4 | 9523 | 9148 (96.1) |
Distribution of H3K4me3 and H3K4me1 in the Chlamydomonas genome
The majority of H3K4me3 peaks (~85%) overlapped with the transcription start sites (TSS) of genes, and most of the remaining peaks were intergenic (~11%) or found near 3′ ends of genes (~3%) (Figure 2A). TSS regions comprise only 4% of the nuclear genome (Figure S3), but are found within 85% of H3K4me3 peaks indicating extremely strong enrichment for TSS regions that exceeds H3K4me3 enrichment at TSS that is expected from randomized distributions (n=10, mean=23.47 +/− 0.36%, Z score 151). The localization of H3K4me3 at TSS regions was also apparent when the relative enrichment for this mark was plotted by genic position across all gene models (Figure 2B). The general pattern was H3K4me3 enrichment at the predicted TSS, modest depletion in the gene body with minor peaks found downstream of the transcription termination site (TTS). We further checked whether the occurrence of H3K4me3 peaks at TTS was attributable to the relatively dense distribution of genes in Chlamydomonas where many TTS are nearby to the TSS of a downstream gene. To test this possibility, we analyzed H3K4me3 enrichment in TTS of adjacent genes that are in a tail-to-tail arrangement and found that the minor peaks in TTS disappear when there is no adjacent TSS for a downstream gene (Figure S4). These data strongly sugges that H3K4me3 is found almost exclusively at TSS regions and not elsewhere. While H3K4me1 was not enriched in any specific genomic or genic region, it was depleted at promoter regions and inversely correlated with H3K4me3 enrichment (Figure 2C). To gain a better understanding of the relationship between these two chromatin marks, we plotted the sizes of H3K4me3 peaks individually for all 17741 predicted protein coding genes and ordered them from strongest to weakest. This plot shows that around 90% of predicted genes have a H3K4me3 peak around their TSS with a proportionately deep valley for H3K4me1 (Figure 3). Neither the enrichment of H3K4me3 nor the depletion of H3K4me1 at gene promoters changed as a function of gene length (Figure S5).
Figure 2. Genomic distribution of H3K4me3 and H3K4me1 in three time points during the cell cycle.
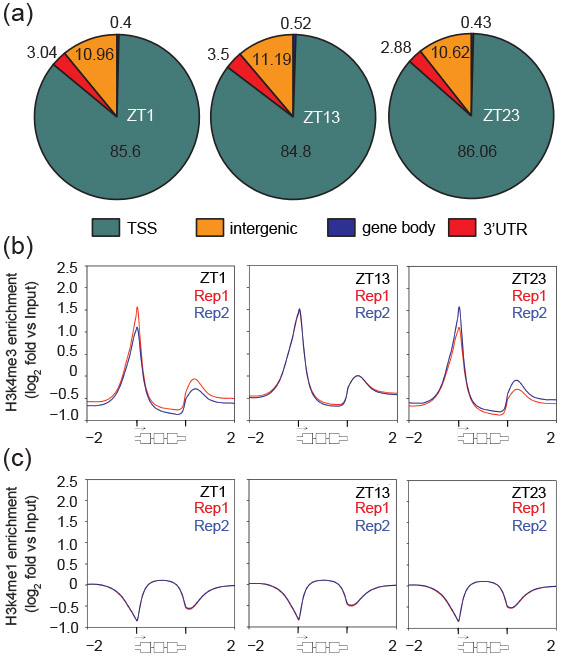
(a) Enrichment of H3K4me3 at genomic regions at time points ZT1, ZT13 and ZT23 as indicated. A 750 bp window from the middle of each H3K4me3 peak was allowed to determine enrichment at genomic regions such as transcription start sites (TSSs, cyan), intergenic regions (orange), gene bodies (blue) and 3′UTRs (red). (b,c) Gene wide distribution of (b) H3K4me3 and (c) H3K4me1 along all Chlamydomonas genes was visualized using density blots. For these profiles, each gene was scaled to the same length and signal enrichments were displayed for the scaled gene lengths and 2 kbp upstream/downstream of the genes’ transcription start/termination sites, respectively. Shown are density blots of H3K4me3/me1 enrichment from two independent replications in red or blue, respectively.
Figure 3. Distribution pattern of H3K4me3 and H3K4me1 around genes.

The distribution of H3K4me3 and H3K4me1 along all Chlamydomonas genes in three time points during the cell cycle was visualized using heat maps. For each gene, the histone modification intensity is displayed along −2 kb to 2 kb regions around the TSSs. Genes shown in both heat maps are sorted based on H3K4me3 enrichment. Blue color indicates enrichment over genomic DNA, red color indicates depletion as compared to genomic DNA. Rep = replicate.
H3K4me3 is stably maintained independently of gene expression level for most genes
To investigate the relationship between gene expression and H3K4me3 TSS enrichment, we compared transcript abundances in FPKMs with H3K4me3 peak enrichment revealing a weak positive correlation between the two (r around 0.4, p-value ≤0.0001, Figure 4A). To further examine the nature of this correlation we divided all Chlamydomonas genes into five groups based on their transcript abundances, and then compared H3K4me3 enrichment for each group (Fig. 4B). This analysis showed that genes with very low expression (0-0.1 and 0.1-1 FPKM) were influencing the correlation, and that above an FPKM threshold of 1, there was almost no correlation between H3K4me3 and strength of gene expression over four orders of magnitude (1-10,000 FPKMs). Among the 7479 genes that showed low expression values (<0.1 FPKM), there was no significant enrichment for any functional MapMan categories (http://pathways.mcdb.ucla.edu/algal/ontology.html) as compared to highly expressed genes (Data S2). A reciprocal analysis was also done where genes were grouped based on whether or not they had a detectable H3K4me3 peak at any of the three time points, and transcript abundance levels were compared between the two groups (Figure 4C). This plot again showed that the small group of genes without any H3K4me3 peak at their TSS was significantly less expressed than those with a peak.
Figure 4. Relationship between H3K4me3 enrichment and gene expression.

(a) Comparison of the ratio of transcript levels in FPKMs (determined by RNA-seq) of genes at all three time points with the ratio of H3K4me3 enrichment against input in the same time points. Shown is the Pearson correlation coefficient. The heat map scale depicts relative density of data points. (b) Levels of H3K4me3 enrichment in genes from five different groups of genes that were separated based on their respective transcript abundances in FPKMs. The number of genes (n) in each group is shown above each boxplot. For this analyses, all genes across all three time points were merged. (c) Expression values in FPKMs of all genes across all three time points (black) and of genes that have no significant enrichment of H3K4me3 at their TSS (red). (b,c) *p < 0.05 (one-way ANOVA, Holm-Sidak post hoc test).
Unexpected H3K4me3 enrichment patterns at infrequently expressed genes in the life cycle
The discovery that H3K4me3 peaks were largely uncoupled from gene expression magnitude led us to ask whether genes that were known to be repressed during the vegetative life cycle but well expressed under very specific conditions also retained H3K4me3 peaks. Sex is facultative in Chlamydomonas, and strains may replicate vegetatively for thousands of generations between matings. Several hundred early zygotic genes are expressed strongly and specifically in a short window after fertilization (Lopez et al., 2015, Joo et al., 2017), and are a good test for persistence of H3K4me3 peaks on genes that are very infrequently expressed (Data S3). Remarkably, nearly all these genes (83%) retained peaks despite very infrequent and unpredictable timing of expression (Figure 5A). Since zygotic genes were defined based on expression ratios compared with vegetative or gametic expression levels, some of them do have some basal vegetative or gametic expression. A more stringent filter for zygotic genes was created to retain only those genes that had low vegetative or gametic expression (<1 FPKM) and significant zygotic expression (>10 FPKM). In this list of 74 genes, 61 had H3K4me3 peaks at their promoters in at least one time point with 59 having a significant peak at all three time points (Data S2). Of the remaining 13 early zygotic genes, the absence of a detectable peak was due to missing sequence coverage at these genomic loci, so we found no evidence of a stringently-expressed early zygotic gene that lacked a H3K4me3 peak. We also looked at H3K4 trimethylation on the TSS of nine well annotated core meiotic genes that are predicted to be expressed only when zygotes germinate. Seven of these meiotic genes—including those encoding single orthologs of Spo11, Hop1, Dmc1, and mismatch repair proteins—were completely missing H3K4me3 at their predicted TSS (Figure 5). The two meiotic genes which retained H3K4me3 at their TSS, HOP2/TBPIP and MND, are also expressed in the mitotic cell cycle and are predicted to function in both meiosis and mitosis. It is not clear whether core meiotic genes have different epigenetic markings at their promoters, or whether they might transiently acquire H3K4me3 when expressed. It is also unclear whether other classes of genes are also missing this mark, but the absence of H3K4me3 at the TSS of well supported gene models whose expression is required during the life cycle could be a potential filter to identify new meiotic genes or other classes of genes that are functionally related to each other.
Figure 5. Presence and absence of H3K4me3 peaks at early zygotic and meiotic zygotic genes.

(a) Proportions of 657 early zygotic genes that have a H3K4me3 peak at their TSS (purple) compared to those without H3K4me3 enrichment at their TSS (orange). (b-d) Replicate ChIP-seq tracks from samples taken at ZT1, ZT13 and ZT23 displaying H3K4me3 enrichment. Promoter regions of the respective genes are highlighted in green. Introns are drawn as black line, exons as black bars, 5′UTRs are shown as white bars, while 3′UTRs are shown as grey bars. (b) typical vegetatively expressed genes Cre09.g411900 (SHMT3) and Cre09.g411950 (MYB-LIKE DNA-BINDING PROTEIN). (c) a representative, early zygote gene Cre03.g151950 (EZY1B) and (d) a representative core meiotic gene, Cre02.g141846, encoding an ortholog of Rad51/DMC1 adjacent to a convergently transcribed vegetative gene that has a H3K4me3 peak. See Table S2 for gene IDs and zygotic and meiotic gene expression data.
A third class of facultative genes are those expressed in response to abiotic stresses such as macro nutrient or trace element limitation. While there are many such genes documented in different studies (Gonzalez-Ballester et al., 2010, Castruita et al., 2011, Urzica et al., 2012, Schmollinger et al., 2014), almost all of them had H3K4me3 peaks at their TSS, but also had significant basal expression even in the absence of a stress trigger, so their retention of H3K4me3 might reflect the presence of a basally active euchromatin state at those loci.
In summary, the early zygotic genes we analyzed demonstrate the potential for long-term persistence of H3K4me3 at TSS of promoters over many generations even in the absence of expression, while the core meiotic genes are a noteworthy exception to the near ubiquitous presence of H3K4me3 at the TSS of nearly all genes, regardless of their expression status.
Dynamic H3K4me3 peaks and their relationship to gene expression
While the vast majority of the H3K4me3 peaks that we identified were stably maintained over the course of the cell cycle, we found 120 genes with a dynamic pattern where peak intensity fluctuated in a cell-cycle-dependent manner (Data S3). We focused on 62 of these peaks that were located at TSS and found that the majority (45/62) had a strong H3K4me3 peak during cell division (S/M) phase with weak peaks during G1 and G0 (Figure 6). Strikingly, genes with a dynamic S/M peak included 8 histone genes, a result that was highly unlikely to be obtained by chance among >17,000 predicted protein coding genes, even when factoring in that there are >30 histone gene clusters throughout the genome (Figure 6). Core histone clusters in Chlamydomonas typically have bi-directional promoters, often with adjacent H2A/H2B and H3/H4 pairs, are silent during most of the vegetative cell cycle, and are expressed in a strong burst when replication occurs during S/M phase. This expression behavior classifies this majority of histone genes as replication-dependent (Figure 7A)(Zones et al., 2015, Strenkert et al., 2019). A small minority of histone loci, however, are replication independent and expressed at constant levels across the cell cycle (Figure 7B) (Strenkert et al., 2019). Interestingly, the dynamic peak behavior we observed applied only to the replication dependent class of histone genes and not the replication independent ones (Figure 7C, D; Figure S6-S8). Besides histone genes, we noted that several other genes were among those with dynamic S phase H3K4me3 peaks at their TSS and were also expressed most strongly during S/M, including the cell cycle gene MCM10 (Figure 6). However, having dynamic S/M phase H3K4me3 peaks was the exception for cell cycle genes and not the rule. An exceptional feature of replication dependent histone transcripts in Chlamydomonas (but not replication independent histone genes) is the absence of 3′ polyadenylation (Fabry et al., 1995). To ask whether other non-polyadenylated transcripts also had dynamic H3K4me3 peaks, we surveyed H3K4me3 enrichment at genes coding for rRNAs, tRNAs and snRNAs. While rDNA arrays and tRNAs mapped to genomic regions with low read coverage, impeding our ability to draw robust conclusions, we could map all previously identified snRNAs (snRNA U1, U2, U4, U5 and U6) to the current Chlamydomonas genome version 5.6 (Jakab et al., 1992, Jakab et al., 1997, Merchant et al., 2007). To validate snRNA loci, we verified expression of each by manual curation on the genome browser using our mapped transcript data set (Figure 7E, Data S4). Strikingly, with one exception, we could indeed identify dynamic S/M phase H3K4me3 enrichment at the regions just upstream of the snRNAs U1, U2, U4 and U5 (Supplemental Figure 5). The only exception was the 5′ region of the U4 snRNA gene which was located so close to the promoter region of a neighboring gene that changes in H3K4me3 enrichment at the U4 promoter region could not be ascertained.
Figure 6. Overview of dynamic peaks spanning the TSS of genes.

Left side: Relative H3K4me3 enrichment values at the TSS of the respective genes are visualized as ellipses. H3K4me3 enrichment was determined using EdgeR and values for replicates were averaged and then normalized to the time point with the maximum value that was set to 1. Relative peak height for each time point is represented by the gray scale value in each ellipse. Right side: RNA abundances of the respective genes are visualized as a heat map showing log2 FPKM values as averages of three replicates. Gene names and annotations were derived from Phytozome, (https://phytozome.jgi.doe.gov/pz/portal.html).
Figure 7. Cell cycle dependent expression and dynamic H3K4me3 peaks at core histone genes.

Normalized expression patterns of (a) replication dependent histone clusters on chromosome 17: H3 (Cre17.g713950), H4 (Cre17.g714000), H2A (Cre17.g714100), H2B (Cre17.g714050) as well as (b) replication independent constitutively expressed histones on chromosome 16, H3 (Cre16.g650300) and H4 (Cre16.g650250). Relative expression values over the full diurnal cycle from ZT0 to ZT24 are based on averaging each of three replicates and setting the maximum expression value to 1 for each gene. (c,d) Replicate ChIP-seq tracks of histone loci in panels a and b, respectively. Introns are drawn as black lines, exons as black bars, 5′UTRs as white bars and 3′UTRs as grey bars. Samples were taken at ZT1, ZT13 and ZT23 as indicated. (e) Genome browser view of dynamic histone H3K4me3 peaks at snRNA loci. snRNA genes are shown in green. Adjacent or overlapping protein coding genes are also shown along with their Phytozome gene ID with color coding and sampling times the same as in c,d.
In summary, we discovered a novel expression-associated dynamic H3K4me3 peak behavior for replication dependent core histone genes and snRNA loci that suggests the epigenetic environment and control mechanism for genes encoding non-poly-adenylated transcripts may be different from those for typical protein coding genes.
Relationship between histone H3 lysine 4 methylation and DNA methylation
In many species 5-methylcytosine (5meC) on nuclear DNA is associated with heterochromatin or gene silencing. Although Chlamydomonas has a much lower fraction of nuclear 5-Methylcytosine (5meC) than do other species (<0.75% of total cytosine (Hattman et al., 1978, Lopez et al., 2015), its 5meC distribution has been localized to around two dozen hyper-methylated regions that have lower-than-average gene density and high repeat content, possibly corresponding to heterochromatin (Lopez et al., 2015). We analyzed the relationship between published regions of 5meC enrichment and H3K4 methylation status in our data. Intriguingly, we found that 5meC is enriched in regions of the nuclear genome that are lacking both H3K4me3 and H3K4me1 (Figure 8A, B). The genes within these hypo-methylated regions are also enriched for those with poor expression (<1FPKM) compared with all genes (Figure 8C). In summary, our data point to an inverse correlation between H3K4 methylation of either type and of 5meC, suggesting that DNA hyper-methylated regions may have atypical chromatin architecture.
Figure 8. Correlations between H3K4 methylation, DNA cytosine-5 methylation and gene expression.

(a) Genome-wide comparison of H3K4me3 versus H3K4me1 enrichment plotted against input signal in (500 bp windows). The heat map scale depicts relative density of data points. (b) The same plot as in (a), but without the heat map scale and with 5meC-enriched loci plotted in red. (c) Stacked bar graphs represent the percentage of genes with high (>1 FPKM in at least one cell cycle time point) and low (<1 FPKM at all cell cycle time points) expression levels calculated for all 17742 predicted nuclear genes (left) and for the 175 genes located within genomic regions lacking both, H3K4me3 and H3K4me1 (right).
H3K4me3 peaks as a genome annotation tool
Almost 11 percent of all identified H3K4me3 peaks mapped to intergenic regions in all three time points. We inferred that at least some of these peaks might be at structurally unannotated loci. Long non-coding RNAs (lncRNAs) are difficult to predict bioinformatically without empirical expression data and are easier to mispredict than protein coding genes since they lack long open reading frames and are not always well conserved. We focused on a large set of lncRNAs that were identified previously in Chlamydomonas (Li et al., 2016), and were able to successfully map a total of 1067 of these to the current Chlamydomonas genome assembly and annotation version 5.6 (Data S4). Around 40% of the predicted lncRNAs had a stable H3k4me3 peak at their TSS while 60% did not (Figure 9A). Interestingly, the genes with H3K4me3 at their TSS were more likely to be expressed compared with those that did not, suggesting that presence of H3K4me3 is an effective filter for identifying the TSS and validating structural annotations, including lncRNA loci (Figure 9B).
Figure 9. Validation of lncRNAs using H3K4me3 peaks at the TSS.

(A) Pie chart showing the proportion of 1052 lncRNAs that have H3K4me3 enrichment at their TSS (turquoise) vs, without (purple) and boxplot visualizing RNA abundances in FPKMs of each group. (B) Replicate ChIP-seq tracks from samples taken at ZT1, ZT13 and ZT23 as indicated displaying H3K4me3 enrichment at TSSs of lncRNA (highlighted in green). A clear H3K4me3 peak with no overlap to an annotated gene is highlighted in green. Introns are drawn as black line, exons as black bars, 5′UTRs are shown as white bars, while 3′UTRs are shown as grey bars.
DISCUSSION
Stable H3K4me3 enrichment at TSSs of the majority of genes during cell cycle progression
Our data demonstrate that H3K4me3 is a stably maintained chromatin mark in Chlamydomonas with enrichment at TSSs of the majority of known protein coding genes. This result further supports tri-methylated H3K4 enrichment at the transcription start sites of genes as a conserved feature in eukaryotes including yeast, mammals and plants (Santos-Rosa et al., 2002, Bernstein et al., 2005, Pokholok et al., 2005, Barski et al., 2007, Zhang et al., 2009). In Chlamydomonas, H3K4me3 enrichment at TSSs correlates weakly with transcript abundances. More specifically, H3K4me3 seems to mark genes if their expression exceeded 0.1 FPKMs at least once during the cell cycle, even for facultatively expressed genes, such as those involved in nutrient limitation responses and zygotic genes. We propose that H3K4me3 might be a chromatin mark that facilitates transcription initiation for both active and inactive genes. Moreover, the majority of genes in Chlamydomonas may experience transcription initiation while not being actively transcribed, which is also the case for most protein coding genes within the human genome (Guenther et al., 2007). If the TSSs of most genes within the Chlamydomonas genome are occupied with paused RNA polymerase II, it would also explain why the transcription elongation mark H3K36me3 was previously found to be mainly enriched at TSS in Chlamydomonas (Ngan et al., 2015)(Strahl et al., 2002, Bannister et al., 2005, Pokholok et al., 2005). In this context, it would be interesting to interrogate Chlamydomonas for genes with bivalent chromatin, meaning a chromatin state that is characterized by the presence of both repressive (H3K27me3) as well as active histone modifications (H3K4me3) at the same time. It was shown that bivalent chromatin is mainly enriched at TSS of lowly transcribed genes, or again, of genes that are poised for trans-activation (Sen et al., 2016)
Notably, genes that lack any expression evidence show a tendency to not be marked with H3K4me3 at their TSS. The correlation between H3K4me3 and gene expression may be related to expression potential (transcript levels when the gene is normally expressed) rather than frequency of expression. Extending this idea, many of the genes that lack H3K4me3 may not ever be expressed at high levels or may have mis-predicted TSSs.
Importantly, there are some genes that lack H3K4me3 but are almost certainly expressed in at least part of the life cycle. Core meiotic genes fall into this category and present an interesting exception. Unfortunately, synchronizing germination and meiosis in zygotes and breaking open the extremely tough zygotic walls pose difficult challenges for interrogating chromatin marks at this stage of the life cycle.
Cell cycle dependent, dynamic H3K4me3 enrichment at histone gene promoters
While the majority of H3K4me3 peaks was maintained stably over the course of the diurnal cycle, less than one percent of all H3K4me3 peaks showed a more dynamic behavior. Notably, genes encoding replication dependent histones were the dominant protein coding gene class with a dynamic H3K4me3 peak at their TSS. The majority of Chlamydomonas histone gene clusters are expressed in a replication dependent manner during S/M phase. In Chlamydomonas and metazoans, replication-dependent histone mRNAs differ from canonical mRNAs in that they are not poly-adenylated, while by contrast, plants and many other unicellular eukaryotes express only 3′ polyadenylated histone mRNAs (Fabry et al., 1995, Marzluff and Duronio, 2002, Marzluff et al., 2008). For a long time, the existence of non-polyA containing, replication-dependent expressed histone mRNAs was assumed to be a unique feature of metazoans until discovered in Chlamydomonas (Fabry et al., 1995) and its relative Volvox (Müller et al., 1990). In Chlamydomonas, more than 29 copies of each of the core histone genes are organized in non-tandem gene clusters and expressed during replication (Fabry et al., 1995, Walther and Hall, 1995, Strenkert et al., 2019). Strikingly, every single promoter for replication- dependent histone loci had H3K4me3 enrichment during mitosis, but the histone mark was absent during interphase. Interestingly, this observation is restricted to replication dependent expressed histone genes, as their constitutively expressed counterparts exhibited stable H3K4me3 enrichment at their TSSs during the cell cycle. We propose that dynamically marked histone gene promoters are depleted of H3K4me3 during G0 or G1 phase by either the activity of histone demethylases or by histone turnover. Our observations suggest that histone gene promoters have some unique properties that may attract demethylases and/or induce active turnover of histones positioned near the TSS. How this phenomenon relates to histone gene expression remains to be determined.
A unique, genome wide distribution pattern of H3K4me1 in Chlamydomonas
The genome wide distribution pattern of H3K4me1 seems to be unique in Chlamydomonas, in that almost the entire genome is mono-methylated at H3K4me1. This observation is in stark contrast to the findings of a previous study, in which the authors concluded that the majority of genomic loci are devoid of any histone modifications in Chlamydomonas (Ngan et al., 2015). The latter conclusion was based on genome wide maps of H3K4me3, K3K27Ac, H3K9me3 and H3K36me3 and together with our work indicates that H3K4me1 might exclusively occupy chromatin that is not marked with any of the other histone modification surveyed to date. While previous work based on LC-MS, and top down proteomics on Chlamydomonas histones indicated that mono-methylated H3K4me1 is a predominant histone PTM in Chlamydomonas (Waterborg et al., 1995, Khan et al., 2018, Rommelfanger et al., 2021), it is still striking to see the uniformity of this chromatin mark across the entire genome sparing only gene promoter regions. Notably, the genome wide distribution pattern of H3K4me1 seems to vary significantly between taxa, but the histone mark was mostly found within gene boundaries in land plants. For example in Arabidopsis, H3K4me1 was shown to cover entire gene bodies, but not the entire genome (Zhang et al., 2009, van Dijk et al., 2010). As the Chlamydomonas genome exhibits much higher gene density as compared to the Arabidopsis genome, it may well be that the genome wide H3K4me1 pattern is reflective of the genomic architecture in general. In any case, our results in Chlamydomonas are in stark contrast to what has been observed in yeast and humans where H3K4me1 is enriched at TSS (Liu et al., 2005). The same is true in humans, in which active genes are also characterized by high levels of H3K4me1 at their TSSs (Barski et al., 2007). Notably, H3K4me1 was also enriched at enhancers in human cells if H3K4me3 was depleted (Heintzman et al., 2007, Hon et al., 2009).
Inverse correlation between histone H3K4 methylation and DNA methylation
Most of the genome-wide DNA methylation and histone modification studies on mammalian cells show inverse correlation between DNA methylation and histone H3K4 methylation (Fu et al., 2020). Specifically, DNA methylation is associated with the complete absence of H3K4 mono-, di-, or tri-methylation (Laurent et al., 2010). Our data shows a similar trend with an inverse correlation between the presence of H3K4 mono-and tri-methylation and DNA methylation. The latter indicates that DNA methyl transferases might be inhibited by H3K4 methylation also in Chlamydomonas, as this is the case in animal systems (Fan et al., 2008, Meissner et al., 2008, Otani et al., 2009, Cheng and Blumenthal, 2010, Hashimoto et al., 2010). The reciprocal relationship may also hold true, with methylated DNA regions being resistant to incorporation or retention of H3K4 methylated histones. While the mechanism(s) behind the antagonistic relationship of DNA methylation and histone methylation remains to be resolved, the ubiquitous presence of H3K4me1 may partly explain the paucity of DNA methylation in Chlamydomonas.
High quality H3K4me3 map as an annotation tool
Our finding that the vast majority of protein coding genes has a discrete H3K4me3 peak at the TSS provides a potentially powerful annotation tool that can be used as positive verification for the start of transcription and for validation of predicted genes where other types of evidence might be lacking. In the case of lncRNAs, which cannot usually be verified based on similarity criteria, the presence of an H3K4me3 peak is also a potential verification tool. To date, the major challenge to identify novel lncRNAs in large transcriptome datasets is discriminating between possible transcriptional noise and physiological meaningful, dedicated expression (Louro et al., 2009, Mercer et al., 2009). It was noted that lncRNAs, like their protein coding counterparts, are associated with a specific chromatin domain which is characterized by the presence of trimethylated H3K4 within the promoter region and trimethylated H3K36 over the coding region, also referred as the so-called K4-K36 domain in mammals (Guttman et al., 2009). Indeed, when we sought to functionally validate a catalogue of lncRNAs using H3K4me3 enrichment, we found that almost half of all candidate lncRNAs were associated with H3K4me3 at their TSSs. There seems to be no clear pattern as to why a lncRNA is associated with H3K4me3 enrichment or not. But, again like their protein coding counterparts, lncRNAs seem to be more likely to be trimethylated at H3K4me3 if they are actively transcribed. For either protein coding or non-protein coding genes, the absence of a H3K4me3 peak does not automatically discount a valid gene prediction. For instance, conserved meiotic genes were missing this mark, and some genes such as those for canonical histones only had the mark at a specific time. Indeed, the absence of a H3K4me3 mark for genes that are otherwise predicted with high confidence may be highly informative about potential alternative expression mechanisms. Nevertheless, the predicted lncRNAs have not been rigorously validated and the H3K4me3 mark can be used as a validation for the subset that do carry the mark. The remainder of lncRNAs should be independently validated since they might not be valid lncRNAs but represent over prediction instead.
Writers and readers of Chlamydomonas H3K4 methylation and their implications in transgene silencing pathways
Chromatin effectors are enzymes that write and read the histone code and translate it into biological function. SET domain containing proteins are implied in writing histone lysine methylation. Chlamydomonas Mut11 was shown to be involved in transgene silencing and encodes a WD40-repeat protein that is homologous to yeast Swd3 and human WDR5, both of which are conserved subunits of the H3K4 Histone Methyl Transferase (HMTase) complexes (Roguev et al., 2001, Hughes et al., 2004, Dou et al., 2005). Chlamydomonas Mut11 was shown to interact with conserved subunits of the H3K4 methyltransferase complex and a mut11 mutant exhibited a reduction in monomethylated H3K4 at a global scale as well as at transgenic loci (van Dijk et al., 2005). Previous attempts to generate strains that express nuclear transgenes more efficiently were based on UV mutagenesis and resulted in strains (UVM4 and UVM11) that were affected in a histone deacetylase and also showed reduced levels of H3K4me1 at transgenic loci (Neupert et al., 2009, Neupert et al., 2020). In general, chromatin at transgenic loci seems to be highly enriched with H3K4me1 and H3K9me1, but this repressive, heterochromatic state was partially avoided if strong promoters were used for transgene expression (Strenkert et al., 2013). While H3K4me1 is widely was uniformly distributed in our study, H3K4me3 was present at TSS of most genes, all of which had the potential for significant expression during the life cycle. For most genes H3K4me3 may be a necessary but not sufficient mark for transcriptional activation. Understanding how this mark is established and propagated in place of H3K4me1 may lead to more reliable methods of generating active transgenes.
The relatively compact haploid genome (111 Mb) of Chlamydomonas combined with the ability to generate highly synchronous and uniform cell populations at different cell cycle and diurnal stages has previously enabled functional characterization of genes by co-expression analysis (Salomé and Merchant, 2021). Here we leveraged these highly advantageous properties in Chlamydomonas cultures to comprehensively characterize conserved H3K4 methylation marks across its genome at key cell cycle and diurnal time points, and compare them to DNA methylation patterns. Although most H3K4me3 peaks were stable, this synchronized system allowed us to identify a remarkable set of transient peaks at promoters of core histone genes. Overall, our findings highlight the potential for further discoveries coming from profiling additional epigenetic marks and histone modifications during the cell cycle.
METHODS
Chromatin-immunoprecipitation (ChIP) and library preparation
Chlamydomonas reinhardtii strain CC5390 was grown in a photo-bioreactor as described in (Strenkert et al., 2019). ChIP was performed as described in (Strenkert et al., 2011) with the following modifications: A total of 2x10⁸ cells, corresponding to 100 mL culture, were collected at the time points indicated by a 2-min centrifugation at 4°C and 3220g. The supernatant was discarded completely. To cross-link protein–DNA interactions, cells were resuspended in 10 mL freshly prepared cross-linking buffer (20 mM HEPES-KOH, pH 7.6, 80 mM KCl, and 0.35% formaldehyde) and incubated for 10 min at 24°C. Cross-linking was quenched by the addition of glycine to a final concentration of 125 mM and further incubation for 5 min at 24°C. Cells were collected by a 2-min centrifugation at 4°C and 3220g. Cells were lysed by the addition of 1000 μL lysis buffer (1% SDS, 10 mM EDTA, 50 mM Tris-HCl, pH 8.0, and 0.25× protease inhibitor cocktail [Roche]). Cells were sonicated on ice to generate an average DNA fragment size of ~250 bp. ChIP was performed with aliquots corresponding to ~2 × 10⁷ cells that were diluted 1/10 with ChIP buffer (1.1% Triton X-100, 1.2 mM EDTA, 167 mM NaCl, and 16.7 mM Tris-HCl, pH 8) and supplemented with 10 μg BSA. We omitted the addition of sonicated λ-DNA that was supplemented as blocking agent in (Strenkert et al., 2011) since it interferes with library preparation steps after ChIP. Antibodies specific for the following epitope were used: trimethylated H3K4 (10 μL, ab8580, lot# GR134854-1), monomethylated H3K4 (10 μL ab8895, lot# GR61306-1); Antibody-protein/DNA complexes were allowed to form during a 1-h incubation at 4°C, complexed with 6 mg pre-swollen protein A Sepharose beads (Sigma-Aldrich) during a 2-h incubation at 4°C, and precipitated by a 20-s centrifugation at 16,000g. Sepharose beads were washed once with washing solution 1 (0.1% SDS, 1% Triton X-100, and 2 mM EDTA, pH 8) containing 150 mM NaCl, once with washing solution 1 containing 500 mM NaCl, once with washing buffer 2 (250 mM LiCl, 1% Nonidet P-40, 1% Na-deoxycholate, 1 mM EDTA, and 10 mM Tris-HCl, pH 8), and twice with TE (1 mM EDTA and 10 mM Tris-HCl, pH 8). Protein-DNA complexes were eluted by incubating twice for 15 min at 65°C in elution buffer (1% SDS and 0.1 M NaHCO3), and cross-links were reverted by an overnight incubation at 65°C after addition of NaCl to a final concentration of 0.5 M. Proteins were digested by incubating for 1 h at 55°C after the addition of proteinase K (3.5 μg/mL), EDTA (8 mM), and Tris-HCl, pH 8.0 (32 mM). DNA was extracted once with phenol/chloroform/isoamyl alcohol (25:24:1), once with chloroform/isoamyl alcohol (24:1), and precipitated by incubation with 2 volumes of ethanol after addition of 0.3 M Na-acetate, pH 5.2, and 10 μg/mL glycogen over night at −20°C. Precipitated DNA was collected by a 20-min centrifugation at 4°C and 16,000g, washed with 70% ethanol, and air-dried and resuspended in 50 uL MilliQ water. 1-8 ng of ChIPed DNA was treated with end-repair, A-tailing, and ligation of Illumina compatible adapters (IDT, Inc) using the KAPA-Illumina library creation kit (KAPA biosystems). The ligated products were enriched with 8-10 cycles of PCR (HiFi premix, KAPA biosystems) and size selected to 200-500 bp with AMPure XP beads (Agencourt). qPCR was used to determine the concentration of the libraries and up to 5 libraries were pooled and sequenced on the Illumina Hiseq (HiSeq-1Tb at 1 X 100).
ChIP-Seq data analysis
The filtered reads from each library were mapped to the Chlamydomonas reinhardtii genome v5.6 using BWA mem (v. 0.7.17). H3K4me3 and H3K4me1 data were normalized against their corresponding genomic DNA inputs by using the BamCompare function in DeepTools (Ramirez et al., 2016). Average normalized signal density profiles over normalized lengths of all genes, as well as average normalized signal density profiles and heatmaps around TSS regions (~ 2kb) of all genes (all together, or grouped into 10 deciles according to gene lengths) were generated by using the PlotProfile and PlotHeatmap functions in DeepTools (Ramirez et al., 2016). For the log10(FPKM) vs H3K4me3 normalized signal scatter plot, the mean normalized H3K4me3 signal value around TSS regions (~ 250bp) for each gene was calculated and plotted against their log10(FPKM) values. For the H3K4me3 vs H3K4me1 normalized signals scatter plot, mean normalized signals over 1000 bp regions across the genome were calculated using the multiBigwigSummary function in DeepTools. The same function was also used to calculate the average normalized H3K4me1 and H3K4me3 signals over the previously reported hypermethylated regions (Lopez et al., 2015).
H3K4me3 peaks were called using MACS2 (Zhang et al., 2008), and H3K4me1 negative peaks were identified using in-house scripts. For the detection of negative H3K4me1 peaks, first the genomic bins with negative normalized signals were extracted and merged into continuous genomic regions using the bedtools merge function (Quinlan and Hall, 2010). Next, mean signal values and the minimum signal values over each region were calculated. Using these values, two z-scores were calculated for each region in comparison to genome-wide average; one for their mean signal, and one for their minimum signal. If a region’s either z-score was lower than −2, then that region was identified as the negative signal peak region. Regions that are shorter than 200 bp were discarded in this analysis. For both H3K4me3 and H3K4me1 peaks, the consensus peaks between two replicates at each time point were found using the bedtools intersect function (Quinlan and Hall, 2010). The same function was also used to identify peaks that overlap genes. In addition, H3K4me3 peak summit regions were checked against the gene regions (TSS, gene body, 3′UTR, and intergenic) using the bedtools closest function (Quinlan and Hall, 2010). If a peak summit was within a 750 bp window of any region, then the summit was mapped to that particular region.
Dynamic H3K4me3 peaks were identified using DiffBind. All the statistical routines available in the package were performed separately (EdgeR, DESeq, and DESeq2) between all pair-wise time points (ZT1 vs ZT13, ZT1 vs ZT23, ZT13 vs ZT23) and peaks with FDR values lower than 0.05 were identified as dynamic. All identified dynamic peaks were merged and further curated manually by visual inspection. Regions that are flagged as anomalous based on their extremely high (or extremely low) input read counts were discarded from the dynamic peak analysis. The anomalous regions were detected using the GreyListChIP package with 0.9 and 0.1 p-value thresholds for marking the regions as “grey” for their high and low read counts, respectively.
Previously reported lncRNA sequences (Li et al., 2016) were mapped to the soft-masked Chlamydomonas reinhardtii genome v5.5 using BLAT (Kent, 2002). 1085 out of 1440 reported lncRNA sequences were mapped with >99% match to the chromosome regions in the genome when the size of maximum gap between tiles in a clump was set to 3. The FPKM values and average mean normalized H3K4me3 signals around TSS (250 bp) for 1052 lncRNA regions were calculated using Cuffdiff (Trapnell et al., 2012) and DeepTools (Ramirez et al., 2016), respectively. Sequences, transcript abundances and H3K4me3 enrichment at TSSs of all 1085 lncRNAs are listed in Supplemental Data Set 4.
Data statement
ChIP-Seq data are available from the US NCBI Short Read Archive (SRA) (https://www.ncbi.nlm.nih.gov/sra) using the accession numbers listed in Data S1.
Protein analyses by immuno-detection
For analyses of total proteins, 2 x 10⁷ cells/ml were centrifuged at 1650 x g and at 4°C. The cell pellet was resuspended in 100 μl of buffer containing 10 mM Na-Phosphate buffer (pH 7). Samples were stored at −80°C prior to analysis. Protein samples were diluted with 2 x sample buffer (125 mM Tris-HCl pH 6.8, 20% Glycerol, 4% SDS, 10% β-Mercaptoethanol, 0.005% Bromphenolblue) and separated on a 15% SDS-containing polyacrylamide gel using protein corresponding to 2x10⁵ cells for each lane. The separated proteins were then transferred by semi-dry electro-blotting to nitrocellulose membranes (Amersham Protran 0.1 NC). The membrane was blocked for 30 min with 3% dried non-fat milk in phosphate buffered saline (PBS) solution containing 0.1% (w/v) Tween 20 and then incubated in primary antiserum. The PBS solution was used as the diluent for both primary and secondary antibodies. The membranes were washed in PBS containing 0.1% (w/v) Tween 20. Antibodies used were: trimethylated H3K4 (1;1000, ab8580, lot# GR134854-1), monomethylated H3K4 (1:1000, ab8895, lot# GR61306-1); The secondary antibody, used at 1:5000, was goat anti-rabbit conjugated to alkaline phosphatase.
Supplementary Material
ACKNOWLEDGMENTS
Library preparation and sequencing (CSP1921), conducted by the U.S. Department of Energy Joint Genome Institute, a DOE Office of Science User Facility, and data analysis (DS) and manuscript preparation (DS) and editing (SSM) under the Laboratory Directed Research and Development Program of Lawrence Berkeley National Laboratory (SSM), are supported by the Office of Science of the U.S. Department of Energy under Contract No. DE-AC02-05CH11231. Sample preparation for JGI (DS) and bioinformatics at UCLA (AY) was supported by the Institute of Genomics and Proteomics under a cooperative agreement with the US Department of Energy Office of Science, Office of Biological and Environmental Research program under Award DE-FC02-02ER63421. Antibodies, project initiation / supervision, and manuscript editing was supported by the National Science Foundation MCB 1515220 and National Institutes of Health grant R01GM126557 to JGU. We thank Matthew Mingay for read mapping and initial data quality assessment.
Footnotes
CONFLICT OF INTEREST STATEMENT
The authors have no conflict of interest to declare.
REFERENCES
- Bae S and Lesch BJ (2020) H3K4me1 Distribution Predicts Transcription State and Poising at Promoters. Front Cell Dev Biol, 8. [DOI] [PMC free article] [PubMed] [Google Scholar]
- Bannister AJ and Kouzarides T (2011) Regulation of chromatin by histone modifications. Cell research, 21, 381–395. [DOI] [PMC free article] [PubMed] [Google Scholar]
- Bannister AJ, Schneider R, Myers FA, Thorne AW, Crane-Robinson C and Kouzarides T (2005) Spatial distribution of di- and tri-methyl lysine 36 of histone H3 at active genes. The Journal of biological chemistry, 280, 17732–17736. [DOI] [PubMed] [Google Scholar]
- Barski A, Cuddapah S, Cui K, Roh TY, Schones DE, Wang Z, Wei G, Chepelev I and Zhao K (2007) High-resolution profiling of histone methylations in the human genome. Cell, 129, 823–837. [DOI] [PubMed] [Google Scholar]
- Bernstein BE, Humphrey EL, Erlich RL, Schneider R, Bouman P, Liu JS, Kouzarides T and Schreiber SL (2002) Methylation of histone H3 Lys 4 in coding regions of active genes. Proc Natl Acad Sci U S A, 99, 8695–8700. [DOI] [PMC free article] [PubMed] [Google Scholar]
- Bernstein BE, Kamal M, Lindblad-Toh K, Bekiranov S, Bailey DK, Huebert DJ, McMahon S, Karlsson EK, Kulbokas EJ 3rd, Gingeras TR, Schreiber SL and Lander ES (2005) Genomic maps and comparative analysis of histone modifications in human and mouse. Cell, 120, 169–181. [DOI] [PubMed] [Google Scholar]
- Castruita M, Casero D, Karpowicz SJ, Kropat J, Vieler A, Hsieh SI, Yan W, Cokus S, Loo JA, Benning C, Pellegrini M and Merchant SS (2011) Systems biology approach in Chlamydomonas reveals connections between copper nutrition and multiple metabolic steps. The Plant cell, 23, 1273–1292. [DOI] [PMC free article] [PubMed] [Google Scholar]
- Cheng X and Blumenthal RM (2010) Coordinated chromatin control: structural and functional linkage of DNA and histone methylation. Biochemistry-Us, 49, 2999–3008. [DOI] [PMC free article] [PubMed] [Google Scholar]
- Cruz C, Della Rosa M, Krueger C, Gao Q, Horkai D, King M, Field L and Houseley J (2018) Tri-methylation of histone H3 lysine 4 facilitates gene expression in ageing cells. Elife, 7. [DOI] [PMC free article] [PubMed] [Google Scholar]
- Dou Y, Milne TA, Tackett AJ, Smith ER, Fukuda A, Wysocka J, Allis CD, Chait BT, Hess JL and Roeder RG (2005) Physical association and coordinate function of the H3 K4 methyltransferase MLL1 and the H4 K16 acetyltransferase MOF. Cell, 121, 873–885. [DOI] [PubMed] [Google Scholar]
- Fabry S, Müller K, Lindauer A, Park PB, Cornelius T and Schmitt R (1995) The Organization Structure and Regulatory Elements of Chlamydomonas Histone Genes Reveal Features Linking Plant and Animal Genes. Current genetics, 28, 333–345. [DOI] [PubMed] [Google Scholar]
- Fan SC, Zhang MQ and Zhang XG (2008) Histone methylation marks play important roles in predicting the methylation status of CpG islands. Biochemical and biophysical research communications, 374, 559–564. [DOI] [PMC free article] [PubMed] [Google Scholar]
- Fu K, Bonora G and Pellegrini M (2020) Interactions between core histone marks and DNA methyltransferases predict DNA methylation patterns observed in human cells and tissues. Epigenetics, 15, 272–282. [DOI] [PMC free article] [PubMed] [Google Scholar]
- Gonzalez-Ballester D, Casero D, Cokus S, Pellegrini M, Merchant SS and Grossman AR (2010) RNA-seq analysis of sulfur-deprived Chlamydomonas cells reveals aspects of acclimation critical for cell survival. The Plant cell, 22, 2058–2084. [DOI] [PMC free article] [PubMed] [Google Scholar]
- Guenther MG, Levine SS, Boyer LA, Jaenisch R and Young RA (2007) A chromatin landmark and transcription initiation at most promoters in human cells. Cell, 130, 77–88. [DOI] [PMC free article] [PubMed] [Google Scholar]
- Guttman M, Amit I, Garber M, French C, Lin MF, Feldser D, Huarte M, Zuk O, Carey BW, Cassady JP, Cabili MN, Jaenisch R, Mikkelsen TS, Jacks T, Hacohen N, Bernstein BE, Kellis M, Regev A, Rinn JL and Lander ES (2009) Chromatin signature reveals over a thousand highly conserved large non-coding RNAs in mammals. Nature, 458, 223–227. [DOI] [PMC free article] [PubMed] [Google Scholar]
- Harris EC (2008) The Chlamydomonas Sourcebook: Introduction into Chlamydomonas and its laboratory use. Elsevier Academic Press. [Google Scholar]
- Hashimoto H, Vertino PM and Cheng XD (2010) Molecular coupling of DNA methylation and histone methylation. Epigenomics-Uk, 2, 657–669. [DOI] [PMC free article] [PubMed] [Google Scholar]
- Hattman S, Kenny C, Berger L and Pratt K (1978) Comparative study of DNA methylation in three unicellular eucaryotes. J Bacteriol, 135, 1156–1157. [DOI] [PMC free article] [PubMed] [Google Scholar]
- He GM, Zhu XP, Elling AA, Chen LB, Wang XF, Guo L, Liang MZ, He H, Zhang HY, Chen FF, Qi YJ, Chen RS and Deng XW (2010) Global Epigenetic and Transcriptional Trends among Two Rice Subspecies and Their Reciprocal Hybrids. The Plant cell, 22, 17–33. [DOI] [PMC free article] [PubMed] [Google Scholar]
- Heintzman ND, Stuart RK, Hon G, Fu Y, Ching CW, Hawkins RD, Barrera LO, Van Calcar S, Qu C, Ching KA, Wang W, Weng Z, Green RD, Crawford GE and Ren B (2007) Distinct and predictive chromatin signatures of transcriptional promoters and enhancers in the human genome. Nat Genet, 39, 311–318. [DOI] [PubMed] [Google Scholar]
- Hon GC, Hawkins RD and Ren B (2009) Predictive chromatin signatures in the mammalian genome. Human molecular genetics, 18, R195–201. [DOI] [PMC free article] [PubMed] [Google Scholar]
- Hughes CM, Rozenblatt-Rosen O, Milne TA, Copeland TD, Levine SS, Lee JC, Hayes DN, Shanmugam KS, Bhattacharjee A, Biondi CA, Kay GF, Hayward NK, Hess JL and Meyerson M (2004) Menin associates with a trithorax family histone methyltransferase complex and with the hoxc8 locus. Molecular cell, 13, 587–597. [DOI] [PubMed] [Google Scholar]
- Jakab G, Kis M and Solymosy F (1992) Nucleotide sequence of U5 RNA from a green alga, Chlamydomonas reinhardtii. Nucleic Acids Res, 20, 5224. [DOI] [PMC free article] [PubMed] [Google Scholar]
- Jakab G, Mougin A, Kis M, Pollak T, Antal M, Branlant C and Solymosy F (1997) Chlamydomonas U2, U4 and U6 snRNAs. An evolutionary conserved putative third interaction between U4 and U6 snRNAs which has a counterpart in the U4atac-U6atac snRNA duplex. Biochimie, 79, 387–395. [DOI] [PubMed] [Google Scholar]
- Joo S, Nishimura Y, Cronmiller E, Hong RH, Kariyawasam T, Wang MH, Shao NC, El Akkad SE, Suzuki T, Higashiyama T, Jin E and Lee JH (2017) Gene Regulatory Networks for the Haploid-to-Diploid Transition of Chlamydomonas reinhardtii. Plant physiology, 175, 314–332. [DOI] [PMC free article] [PubMed] [Google Scholar]
- Kent WJ (2002) BLAT--the BLAST-like alignment tool. Genome research, 12, 656–664. [DOI] [PMC free article] [PubMed] [Google Scholar]
- Khan A, Eikani CK, Khan H, Iavarone AT and Pesavento JJ (2018) Characterization of Chlamydomonas reinhardtii Core Histones by Top-Down Mass Spectrometry Reveals Unique Algae-Specific Variants and Post-Translational Modifications. Journal of proteome research, 17, 23–32. [DOI] [PubMed] [Google Scholar]
- Kouzarides T (2007) Chromatin modifications and their function. Cell, 128, 693–705. [DOI] [PubMed] [Google Scholar]
- Laurent L, Wong E, Li G, Huynh T, Tsirigos A, Ong CT, Low HM, Kin Sung KW, Rigoutsos I, Loring J and Wei CL (2010) Dynamic changes in the human methylome during differentiation. Genome research, 20, 320–331. [DOI] [PMC free article] [PubMed] [Google Scholar]
- Li B, Carey M and Workman JL (2007) The role of chromatin during transcription. Cell, 128, 707–719. [DOI] [PubMed] [Google Scholar]
- Li H, Wang Y, Chen M, Xiao P, Hu C, Zeng Z, Wang C, Wang J and Hu Z (2016) Genome-wide long non-coding RNA screening, identification and characterization in a model microorganism Chlamydomonas reinhardtii. Scientific reports, 6, 34109. [DOI] [PMC free article] [PubMed] [Google Scholar]
- Liu CL, Kaplan T, Kim M, Buratowski S, Schreiber SL, Friedman N and Rando OJ (2005) Single-nucleosome mapping of histone modifications in S. cerevisiae. PLoS Biol, 3, e328. [DOI] [PMC free article] [PubMed] [Google Scholar]
- Lopez D, Hamaji T, Kropat J, De Hoff P, Morselli M, Rubbi L, Fitz-Gibbon S, Gallaher SD, Merchant SS, Umen J and Pellegrini M (2015) Dynamic Changes in the Transcriptome and Methylome of Chlamydomonas reinhardtii throughout Its Life Cycle. Plant physiology, 169, 2730–2743. [DOI] [PMC free article] [PubMed] [Google Scholar]
- Louro R, Smirnova AS and Verjovski-Almeida S (2009) Long intronic noncoding RNA transcription: expression noise or expression choice? Genomics, 93, 291–298. [DOI] [PubMed] [Google Scholar]
- Luger K (2003) Structure and dynamic behavior of nucleosomes. Curr Opin Genet Dev, 13, 127–135. [DOI] [PubMed] [Google Scholar]
- Luger K, Mader AW, Richmond RK, Sargent DF and Richmond TJ (1997) Crystal structure of the nucleosome core particle at 2.8 A resolution. Nature, 389, 251–260. [DOI] [PubMed] [Google Scholar]
- Marzluff WF and Duronio RJ (2002) Histone mRNA expression: multiple levels of cell cycle regulation and important developmental consequences. Curr Opin Cell Biol, 14, 692–699. [DOI] [PubMed] [Google Scholar]
- Marzluff WF, Wagner EJ and Duronio RJ (2008) Metabolism and regulation of canonical histone mRNAs: life without a poly(A) tail. Nat Rev Genet, 9, 843–854. [DOI] [PMC free article] [PubMed] [Google Scholar]
- Meissner A, Mikkelsen TS, Gu HC, Wernig M, Hanna J, Sivachenko A, Zhang XL, Bernstein BE, Nusbaum C, Jaffe DB, Gnirke A, Jaenisch R and Lander ES (2008) Genome-scale DNA methylation maps of pluripotent and differentiated cells. Nature, 454, 766–U791. [DOI] [PMC free article] [PubMed] [Google Scholar]
- Mercer TR, Dinger ME and Mattick JS (2009) Long non-coding RNAs: insights into functions. Nat Rev Genet, 10, 155–159. [DOI] [PubMed] [Google Scholar]
- Merchant SS, Prochnik SE, Vallon O, Harris EH, Karpowicz SJ, Witman GB, Terry A, Salamov A, Fritz-Laylin LK, Marechal-Drouard L, Marshall WF, Qu LH, Nelson DR, Sanderfoot AA, Spalding MH, Kapitonov VV, Ren Q, Ferris P, Lindquist E, Shapiro H, Lucas SM, Grimwood J, Schmutz J, Cardol P, Cerutti H, Chanfreau G, Chen CL, Cognat V, Croft MT, Dent R, Dutcher S, Fernandez E, Fukuzawa H, Gonzalez-Ballester D, Gonzalez-Halphen D, Hallmann A, Hanikenne M, Hippler M, Inwood W, Jabbari K, Kalanon M, Kuras R, Lefebvre PA, Lemaire SD, Lobanov AV, Lohr M, Manuell A, Meier I, Mets L, Mittag M, Mittelmeier T, Moroney JV, Moseley J, Napoli C, Nedelcu AM, Niyogi K, Novoselov SV, Paulsen IT, Pazour G, Purton S, Ral JP, Riano-Pachon DM, Riekhof W, Rymarquis L, Schroda M, Stern D, Umen J, Willows R, Wilson N, Zimmer SL, Allmer J, Balk J, Bisova K, Chen CJ, Elias M, Gendler K, Hauser C, Lamb MR, Ledford H, Long JC, Minagawa J, Page MD, Pan J, Pootakham W, Roje S, Rose A, Stahlberg E, Terauchi AM, Yang P, Ball S, Bowler C, Dieckmann CL, Gladyshev VN, Green P, Jorgensen R, Mayfield S, Mueller-Roeber B, Rajamani S, Sayre RT, Brokstein P, Dubchak I, Goodstein D, Hornick L, Huang YW, Jhaveri J, Luo Y, Martinez D, Ngau WC, Otillar B, Poliakov A, Porter A, Szajkowski L, Werner G, Zhou K, Grigoriev IV, Rokhsar DS and Grossman AR (2007) The Chlamydomonas genome reveals the evolution of key animal and plant functions. Science, 318, 245–250. [DOI] [PMC free article] [PubMed] [Google Scholar]
- Miller T, Krogan NJ, Dover J, Erdjument-Bromage H, Tempst P, Johnston M, Greenblatt JF and Shilatifard A (2001) COMPASS: a complex of proteins associated with a trithorax-related SET domain protein. Proc Natl Acad Sci U S A, 98, 12902–12907. [DOI] [PMC free article] [PubMed] [Google Scholar]
- Müller K, Lindauer A, Brüderlein M and Schmitt R (1990) Organization and Transcription of Volvox Histone-Encoding Genes - Similarities between Algal and Animal Genes. Gene, 93, 167–175. [DOI] [PubMed] [Google Scholar]
- Nagy PL, Griesenbeck J, Kornberg RD and Cleary ML (2002) A trithorax-group complex purified from Saccharomyces cerevisiae is required for methylation of histone H3. Proc Natl Acad Sci U S A, 99, 90–94. [DOI] [PMC free article] [PubMed] [Google Scholar]
- Neupert J, Gallaher SD, Lu YH, Strenkert D, Segal N, Barahimipour R, Fitz-Gibbon ST, Schroda M, Merchant SS and Bock R (2020) An epigenetic gene silencing pathway selectively acting on transgenic DNA in the green alga Chlamydomonas. Nature Communications, 11. [DOI] [PMC free article] [PubMed] [Google Scholar]
- Neupert J, Karcher D and Bock R (2009) Generation of Chlamydomonas strains that efficiently express nuclear transgenes. Plant J, 57, 1140–1150. [DOI] [PubMed] [Google Scholar]
- Ng HH, Robert F, Young RA and Struhl K (2003) Targeted recruitment of Set1 histone methylase by elongating Pol II provides a localized mark and memory of recent transcriptional activity. Molecular cell, 11, 709–719. [DOI] [PubMed] [Google Scholar]
- Ngan CY, Wong CH, Choi C, Yoshinaga Y, Louie K, Jia J, Chen C, Bowen B, Cheng H, Leonelli L, Kuo R, Baran R, Garcia-Cerdan JG, Pratap A, Wang M, Lim J, Tice H, Daum C, Xu J, Northen T, Visel A, Bristow J, Niyogi KK and Wei CL (2015) Lineage-specific chromatin signatures reveal a regulator of lipid metabolism in microalgae. Nature plants, 1, 15107. [DOI] [PubMed] [Google Scholar]
- Ning J, Otto TD, Pfander C, Schwach F, Brochet M, Bushell E, Goulding D, Sanders M, Lefebvre PA, Pei J, Grishin NV, Vanderlaan G, Billker O and Snell WJ (2013) Comparative genomics in Chlamydomonas and Plasmodium identifies an ancient nuclear envelope protein family essential for sexual reproduction in protists, fungi, plants, and vertebrates. Genes & development, 27, 1198–1215. [DOI] [PMC free article] [PubMed] [Google Scholar]
- Oh S, Park S and van Nocker S (2008) Genic and global functions for Paf1C in chromatin modification and gene expression in Arabidopsis. PLoS Genet, 4, e1000077. [DOI] [PMC free article] [PubMed] [Google Scholar]
- Otani J, Nankumo T, Arita K, Inamoto S, Ariyoshi M and Shirakawa M (2009) Structural basis for recognition of H3K4 methylation status by the DNA methyltransferase 3A ATRX-DNMT3-DNMT3L domain. EMBO reports, 10, 1235–1241. [DOI] [PMC free article] [PubMed] [Google Scholar]
- Piunti A and Shilatifard A (2016) Epigenetic balance of gene expression by Polycomb and COMPASS families. Science, 352, aad9780. [DOI] [PubMed] [Google Scholar]
- Pokholok DK, Harbison CT, Levine S, Cole M, Hannett NM, Lee TI, Bell GW, Walker K, Rolfe PA, Herbolsheimer E, Zeitlinger J, Lewitter F, Gifford DK and Young RA (2005) Genome-wide map of nucleosome acetylation and methylation in yeast. Cell, 122, 517–527. [DOI] [PubMed] [Google Scholar]
- Quinlan AR and Hall IM (2010) BEDTools: a flexible suite of utilities for comparing genomic features. Bioinformatics, 26, 841–842. [DOI] [PMC free article] [PubMed] [Google Scholar]
- Ramirez F, Ryan DP, Gruning B, Bhardwaj V, Kilpert F, Richter AS, Heyne S, Dundar F and Manke T (2016) deepTools2: a next generation web server for deep-sequencing data analysis. Nucleic Acids Res, 44, W160–165. [DOI] [PMC free article] [PubMed] [Google Scholar]
- Roguev A, Schaft D, Shevchenko A, Pijnappel WW, Wilm M, Aasland R and Stewart AF (2001) The Saccharomyces cerevisiae Set1 complex includes an Ash2 homologue and methylates histone 3 lysine 4. EMBO J, 20, 7137–7148. [DOI] [PMC free article] [PubMed] [Google Scholar]
- Rommelfanger SR, Zhou M, Shaghasi H, Tzeng SC, Evans BS, Paša-Tolić L, Umen JG and Pesavento JJ (2021) An Improved Top-Down Mass Spectrometry Characterization of Chlamydomonas reinhardtii Histones and Their Post-translational Modifications. Journal of the American Society for Mass Spectrometry, 32, 1671–1688. [DOI] [PMC free article] [PubMed] [Google Scholar]
- Salomé PA and Merchant SS (2021) Co-expression networks in Chlamydomonas reveal significant rhythmicity in batch cultures and empower gene function discovery. The Plant cell, 33, 1058–1082. [DOI] [PMC free article] [PubMed] [Google Scholar]
- Santos-Rosa H, Schneider R, Bannister AJ, Sherriff J, Bernstein BE, Emre NC, Schreiber SL, Mellor J and Kouzarides T (2002) Active genes are tri-methylated at K4 of histone H3. Nature, 419, 407–411. [DOI] [PubMed] [Google Scholar]
- Schmollinger S, Mühlhaus T, Boyle NR, Blaby IK, Casero D, Mettler T, Moseley JL, Kropat J, Sommer F, Strenkert D, Hemme D, Pellegrini M, Grossman AR, Stitt M, Schroda M and Merchant SS (2014) Nitrogen-Sparing Mechanisms in Chlamydomonas Affect the Transcriptome, the Proteome, and Photosynthetic Metabolism. The Plant cell, 26, 1410–1435. [DOI] [PMC free article] [PubMed] [Google Scholar]
- Schneider R, Bannister AJ, Myers FA, Thorne AW, Crane-Robinson C and Kouzarides T (2004) Histone H3 lysine 4 methylation patterns in higher eukaryotic genes. Nat Cell Biol, 6, 73–77. [DOI] [PubMed] [Google Scholar]
- Schübeler D, MacAlpine DM, Scalzo D, Wirbelauer C, Kooperberg C, van Leeuwen F, Gottschling DE, O'Neill LP, Turner BM, Delrow J, Bell SP and Groudine M (2004) The histone modification pattern of active genes revealed through genome-wide chromatin analysis of a higher eukaryote. Genes & development, 18, 1263–1271. [DOI] [PMC free article] [PubMed] [Google Scholar]
- Sen S, Block KF, Pasini A, Baylin SB and Easwaran H (2016) Genome-wide positioning of bivalent mononucleosomes. BMC medical genomics, 9, 60. [DOI] [PMC free article] [PubMed] [Google Scholar]
- Strahl BD and Allis CD (2000) The language of covalent histone modifications. Nature, 403, 41–45. [DOI] [PubMed] [Google Scholar]
- Strahl BD, Grant PA, Briggs SD, Sun ZW, Bone JR, Caldwell JA, Mollah S, Cook RG, Shabanowitz J, Hunt DF and Allis CD (2002) Set2 is a nucleosomal histone H3-selective methyltransferase that mediates transcriptional repression. Molecular and cellular biology, 22, 1298–1306. [DOI] [PMC free article] [PubMed] [Google Scholar]
- Strenkert D, Schmollinger S, Gallaher SD, Salome PA, Purvine SO, Nicora CD, Mettler-Altmann T, Soubeyrand E, Weber APM, Lipton MS, Basset GJ and Merchant SS (2019) Multiomics resolution of molecular events during a day in the life of Chlamydomonas. Proc Natl Acad Sci U S A, 116, 2374–2383. [DOI] [PMC free article] [PubMed] [Google Scholar]
- Strenkert D, Schmollinger S and Schroda M (2011) Protocol: methodology for chromatin immunoprecipitation (ChIP) in Chlamydomonas reinhardtii. Plant Methods, 7, 35. [DOI] [PMC free article] [PubMed] [Google Scholar]
- Strenkert D, Schmollinger S and Schroda M (2013) Heat shock factor 1 counteracts epigenetic silencing of nuclear transgenes in Chlamydomonas reinhardtii. Nucleic Acids Res, 41, 5273–5289. [DOI] [PMC free article] [PubMed] [Google Scholar]
- Sze CC, Ozark PA, Cao K, Ugarenko M, Das S, Wang L, Marshall SA, Rendleman EJ, Ryan CA, Zha D, Douillet D, Chen FX and Shilatifard A (2020) Coordinated regulation of cellular identity-associated H3K4me3 breadth by the COMPASS family. Science advances, 6, eaaz4764. [DOI] [PMC free article] [PubMed] [Google Scholar]
- Trapnell C, Roberts A, Goff L, Pertea G, Kim D, Kelley DR, Pimentel H, Salzberg SL, Rinn JL and Pachter L (2012) Differential gene and transcript expression analysis of RNA-seq experiments with TopHat and Cufflinks. Nat Protoc, 7, 562–578. [DOI] [PMC free article] [PubMed] [Google Scholar]
- Urzica EI, Casero D, Yamasaki H, Hsieh SI, Adler LN, Karpowicz SJ, Blaby-Haas CE, Clarke SG, Loo JA, Pellegrini M and Merchant SS (2012) Systems and trans-system level analysis identifies conserved iron deficiency responses in the plant lineage. The Plant cell, 24, 3921–3948. [DOI] [PMC free article] [PubMed] [Google Scholar]
- van Dijk K, Ding Y, Malkaram S, Riethoven JJ, Liu R, Yang J, Laczko P, Chen H, Xia Y, Ladunga I, Avramova Z and Fromm M (2010) Dynamic changes in genome-wide histone H3 lysine 4 methylation patterns in response to dehydration stress in Arabidopsis thaliana. BMC plant biology, 10, 238. [DOI] [PMC free article] [PubMed] [Google Scholar]
- van Dijk K, Marley KE, Jeong BR, Xu J, Hesson J, Cerny RL, Waterborg JH and Cerutti H (2005) Monomethyl histone H3 lysine 4 as an epigenetic mark for silenced euchromatin in Chlamydomonas. The Plant cell, 17, 2439–2453. [DOI] [PMC free article] [PubMed] [Google Scholar]
- Walther Z and Hall JL (1995) The uni chromosome of Chlamydomonas: histone genes and nucleosome structure. Nucleic Acids Res, 23, 3756–3763. [DOI] [PMC free article] [PubMed] [Google Scholar]
- Wang XF, Elling AA, Li XY, Li N, Peng ZY, He GM, Sun H, Qi YJ, Liu XS and Deng XW (2009) Genome-Wide and Organ-Specific Landscapes of Epigenetic Modifications and Their Relationships to mRNA and Small RNA Transcriptomes in Maize. The Plant cell, 21, 1053–1069. [DOI] [PMC free article] [PubMed] [Google Scholar]
- Waterborg JH, Robertson AJ, Tatar DL, Borza CM and Davie JR (1995) Histones of Chlamydomonas reinhardtii. Synthesis, acetylation, and methylation. Plant physiology, 109, 393–407. [DOI] [PMC free article] [PubMed] [Google Scholar]
- Workman JL and Kingston RE (1998) ALTERATION OF NUCLEOSOME STRUCTURE AS A MECHANISM OF TRANSCRIPTIONAL REGULATION. Annual Review of Biochemistry, 67, 545–579. [DOI] [PubMed] [Google Scholar]
- Zhang X, Bernatavichute YV, Cokus S, Pellegrini M and Jacobsen SE (2009) Genome-wide analysis of mono-, di- and trimethylation of histone H3 lysine 4 in Arabidopsis thaliana. Genome biology, 10, R62. [DOI] [PMC free article] [PubMed] [Google Scholar]
- Zhang Y, Liu T, Meyer CA, Eeckhoute J, Johnson DS, Bernstein BE, Nusbaum C, Myers RM, Brown M, Li W and Liu XS (2008) Model-based analysis of ChIP-Seq (MACS). Genome biology, 9, R137. [DOI] [PMC free article] [PubMed] [Google Scholar]
- Zones JM, Blaby IK, Merchant SS and Umen JG (2015) High-Resolution Profiling of a Synchronized Diurnal Transcriptome from Chlamydomonas reinhardtii Reveals Continuous Cell and Metabolic Differentiation. The Plant cell, 27, 2743–2769. [DOI] [PMC free article] [PubMed] [Google Scholar]
- Zong W, Zhong XC, You J and Xiong LZ (2013) Genome-wide profiling of histone H3K4-tri-methylation and gene expression in rice under drought stress. Plant molecular biology, 81, 175–188. [DOI] [PubMed] [Google Scholar]
Associated Data
This section collects any data citations, data availability statements, or supplementary materials included in this article.