

Abstract
The origin of life on Earth is associated with the Precambrian era, in which the existence of a large diversity of microbial fossils has been demonstrated. Notwithstanding, despite existing evidence of the emergence of life many unsolved questions remain. The first question could be as follows: Which was the inorganic structure that allowed isolation and conservation of the first biomolecules in the existing reduced conditions of the primigenial era? Minerals have been postulated as the ones in charge of protecting theses biomolecules against the external environment. There are calcium, barium, or strontium silica–carbonates, called biomorphs, which we propose as being one of the first inorganic structures in which biomolecules were protected from the external medium. Biomorphs are structures with different biological morphologies that are not formed by cells, but by nanocrystals; some of their morphologies resemble the microfossils found in Precambrian cherts. Even though biomorphs are unknown structures in the geological registry, their similarity with some biological forms, including some Apex fossils, could suggest them as the first “inorganic scaffold” where the first biomolecules became concentrated, conserved, aligned, and duplicated to give rise to the pioneering cell. However, it has not been documented whether biomorphs could have been the primary structures that conserved biomolecules in the Precambrian era. To attain a better understanding on whether biomorphs could have been the inorganic scaffold that existed in the primigenial Earth, the aim of this contribution is to synthesize calcium, barium, and strontium biomorphs in the presence of genomic DNA from organisms of the five kingdoms in conditions emulating the atmosphere of the Precambrian era and that CO2 concentration in conditions emulating current atmospheric conditions. Our results showed, for the first time, the formation of the kerogen signal, which is a marker of biogenicity in fossils, in the biomorphs grown in the presence of DNA. We also found the DNA to be internalized into the structure of biomorphs.
Introduction
The scientific study on the origin of life on Earth is associated with the primitive era, ∼3500 Ma ago, where the existence of a large diversity of microbial fossils mainly composed of carbonaceous matter has been demonstrated.1−5 Notwithstanding, although there is evidence that life existed since an early stage of our planet (taking into account the Precambrian cherts), questions remain like, “What is the chemical origin that allowed primitive cells to exist, starting from simple molecules and chemical reactions, in that era of the Earth?” and, “How did these primitive microorganisms evolve to allow the generation of organisms of other species?” Trying to respond to these questions entails the difficulty of establishing solid hypotheses because they are based on the emergence of life and the evolution of species, events that have only been inferred, but not the tracking between the prebiotic chemistry to the biological chemistry. To explain the origin of life, during decades, experiments have been designed that emulate the conditions that existed in the Precambrian era.6−16 One of these experiments was performed by Urey and Miller, who, from the primitive atmosphere, obtained essential chemical blocks like amino acids and organic chemical compounds.8,9 The results favor the hypothesis that the first cell must have emerged from the conditions prevailing in the Precambrian era. It has also been experimentally shown that simple chemical molecules originated the first biomolecule from these compounds in conditions that emulate the primitive era.6−9 There are other unknowns and inherent factors to that era that have not been solved (e.g., the role of highly intense UV radiation).9−16 One of the most important questions is, “Once the first biomolecule was formed, what was the mechanism or inorganic structure that isolated and conserved the biomolecules in the reducing conditions existing in the primitive era?” The first reason to consider why the first DNA molecules had to be isolated and become protected from the environment is that during this primitive era there also existed a high energy ultraviolet (UV) radiation. The latter, due to the lack of ozone, impinged directly on the Earth,17 rupturing the nucleic acids.18,19 On the other hand, it has been shown that UV light favors the chemistry of small molecules, through photolysis, photoionization, and photoexcitation; these mechanisms gave rise to prebiotic chemistry.10,11 Notwithstanding, in both cases, it was necessary to preserve a given number of nucleic acid molecules that would allow for the generation of the first cells. The second reason to consider that the biomolecules were conserved in an inorganic-type structure is that it has been possible, through diverse studies, to infer that minerals and clays existing in that era favored the emergence of life.20−26 It has been postulated that minerals are able to protect against UV radiation, concentrate, organize, and catalyze the polymerization of molecules, preserve, and replicate structural defects, anionic substitutions, dislocations, and act as genetic candidates.20−22 The third evidence indicating those biomolecules were concentrated and conserved in some inorganic-type structure is that the natural environment that surrounds us is formed by organisms and inert elements, which have been interacting since the primitive stages of the Earth. Thus, the ancestral microorganisms already performed intracellular and extracellular mineralization processes, biologically induced by the precipitation of minerals in the environment.27 This process has been conserved in the organisms of the five kingdoms until the current era.28,29 Once the primitive microorganism had been formed, how was the emergence of other species favored? Was it performed through a macroevolution process as has been proposed?30 Was the DNA from the new species also conserved in the first inorganic structures? In the current era, is there any evidence on how the DNA was isolated and conserved? Our research team is interested in contributing responses to these and other questions on the origin of life; therefore, to start the studies on this topic, we must count upon an inorganic model that could help to understand whether the DNA of all kingdoms is capable of incorporating itself into an inorganic structure. The latter could be the first evidence that the DNA was isolated and conserved in a mineral structure in the Precambrian era, and since then, the biomineralization process is part of all living organisms. These inorganic compounds emulate the curved, helicoidal, or conic morphologies of some organisms like radiolarians, diatoms, worms, spirals, leaves, and flowers, among others. Included in them are the silica–carbonates of Ba(II), Ca(II), and Sr(II) usually called silica biomorphs.31−40 This characteristic is especially relevant because they are structures with diverse biological morphologies that are not formed by cells, but by nanocrystals, and some of these morphologies resemble some of the microfossils found in the cherts of the Precambrian era.1,38 Even though biomorphs are unknown structures in the geological registry, their similarity with biological forms, including some Apex fossils,1 could lead to considering them as the first “inorganic scaffold” where the first biomolecules concentrated, conserved, aligned, and duplicated to give rise to the pioneer cell. However, it has not been documented whether biomorphs could have been the primary structures that conserved biomolecules in the Precambrian era. To gain a better understanding on whether biomorphs could have been the inorganic scaffold that existed in the primigenial Earth, the present work was aimed at synthesizing calcium, barium, or strontium silica biomorphs in the presence of genomic DNA of selected organisms of the five kingdoms in two synthesis conditions that emulate both the atmosphere of the Precambrian era and that of the CO2 concentration in conditions emulating current atmospheric conditions at room temperature (called RTP in this contribution). The morphology of the synthesized biomorphs was evaluated through scanning electron microscopy (SEM). The obtained microphotographs showed that the biomorphs’ morphology is influenced by the contents of CO2 from the atmosphere, as well as the type of alkaline earth metal element, and the DNA of the different organisms. The chemical composition, the crystalline structure, as well as the presence of the molecular biomarker, kerogen, were determined through Raman and IR spectroscopy. The obtained calcium, barium, or strontium biomorphs corresponded to crystalline CaCO3 structures (calcite, aragonite, vaterite), BaCO3 (witherite), or SrCO3 (strontianite), respectively; interestingly, the presence of kerogen was identified in most biomorphs. In this way, the presence of kerogen bands was identified for the first time in conditions emulating the Precambrian atmosphere and in RTP conditions and CO2 concentration in the presence of DNAs. Additionally, to assess whether DNA was or not part of the biomorphs’ structure, as well as its location in them, DNA was specifically marked with the 2-(4-amininophenyl)-1H-indole-6-carboxamidine (DAPI) fluorochrome. In the biomorphs synthesized with the different DNA-DAPI, DNA was found to be part of the structure of the biomorphs and that it becomes internalized in them. The aim of this contribution is to synthesize calcium, barium, and strontium biomorphs in the presence of genomic DNA from organisms of the five kingdoms in conditions emulating the atmosphere of the Precambrian era and that of the current era regarding the CO2 concentration. Even though these results do not conclusively mean that the biomorphs are the structures found in cherts (archaic microfossils), it must comply with the given conditions, that is, to be geochemically plausible, which is inferred from the characteristic kerogen signal, a condition that is complied with by the biomorphs we have synthesized in the presence of a biomolecule like the DNA.
Experimental Section
Organisms Used for DNA Extraction
From the Monera kingdom, the strain of the eubacterium Escherichia coli JM109 was used, which was cultured in Luria–Bertani medium (LB: containing 5 g/L of yeast extract, 10 g/L of tryptone, and 5 g/L of NaCl).
From the Protista kingdom (currently classified in the Chromista kingdom for algae), the Arthrospira maxima alga was used.
From the Fungi kingdom, the yeast Candida albicans was used. This microorganism was cultured in YPD medium (10 g/L yeast extract, 20 g/L peptone, and 20 g/L dextrose).
From the Plantae kingdom, the plant Equisetum arvense was used.
From the Animalia kingdom, an aliquot of venous Homo sapiens blood, obtained from the cephalic median vein of the arm was used. The sample was donated by one of the authors of this work (M.C.-C.).
Extraction of Genomic DNA
E. coli
For the extraction of the genomic DNA from E. coli cells, a 5 mL culture was used that was centrifuged at 3000g for 10 min. The cell pellet was resuspended in lysis buffer (20 mM Tris-Cl, pH 8.0, 2 mM sodium EDTA, 1.2% Triton X-100, lysozyme 20 mg/mL). Starting with the cell lysate, the protocol was followed according to the One-4-all genomic DNA kit (Bio Basic Canada, Inc., Toronto, Canada). Briefly, 180 μL of the ACL buffer and 20 μL of proteinase K were added and vortexed. The mixture was incubated at 56 °C for 1 h. Then, 500 μL of solution CW2 was added and centrifuged at 9000g for 1 min. Finally, ethanol was allowed to evaporate from the membrane, and the obtained DNA was resuspended in 50 μL of nuclease-free water and stored at −20 °C until its use in the synthesis of biomorphs.
A. maxima
The DNA of A. maxima was purified from 50 mg of microalgal biomass using the All-in-one kit (Bio Basic Canada, Inc.). The biomass was supplemented with 350 μL of lysis buffer, then incubated in a water bath for 10 min at 70 °C. The lysate was centrifuged at 12,000g for 3 min at 4 °C, and the supernatant was transferred to a purification column and centrifuged at 9000g for 1 min at room temperature. Then 500 μL of the CW1 solution was added and incubated for 1 min at room temperature and then centrifuged at 9000g for 1 min at room temperature; the supernatant was discarded. The membrane containing the DNA was supplemented with 500 μL of the CW2 solution and centrifuged at 9000g for 1 min at room temperature. Then the ethanol was evaporated in a dry bath at 50 °C for 10 min, and the DNA was resuspended in 50 μL of endonucleases-free water. The extracted DNA was stored at −20 °C until its use.
C. albicans
The genomic DNA from C. albicans was obtained following the protocol previously described.31 The yeast cells were lysed with liquid nitrogen, supplemented with 600 μL of urea buffer (7 M urea, 0.35 M NaCl, 50 mM Tris-HCl, pH 8.0, 20 mM EDTA, 1% N-lauroylsarcosine), vortexed for 2 min, and left to rest at room temperature for 30 min. Then, 600 μL of a mixture of phenol–chloroform–isoamyl alcohol (25:24:1) was added and vortexed from 2 to 10 min and centrifuged at 12,000g for 10 min. The aqueous phase was recovered and placed in an Eppendorf tube. This step was repeated several times with the phenol–chloroform–isoamyl alcohol (25:24:1) until the organic phase was no longer visible. The DNA was precipitated by adding an equal volume of isopropanol to the recovered supernatant from the previous step, the tubes were mixed by inversion and then centrifuged at 14,000g for 10 min, the supernatant was discarded, and the pellet was resuspended in 500 μL of cold ethanol at 70%, which was vortexed and centrifuged at 12,000g for 10 min. The supernatant was discarded, the pellet was dried at room temperature, the pellet was resuspended in sterile nucleases-free water; and then 1 μL of RNase (20 mg/mL) was added to each tube and incubated at 37 °C for 20 min. The obtained genomic DNA was used for the formation of biomorphs.
E. arvense
Extraction and purification of the DNA from E. arvense was achieved from 50 mg of vegetal tissue, which was crushed in a mortar with liquid nitrogen until a fine powder was obtained. The powder was resuspended with 350 μL of lysis-DRP buffer (according to the instruction of the All-in-one kit of Bio Basic Canada, Inc.), and then it was incubated in a water bath for 10 min at 70 °C and the mixture was centrifuged at 12,000g for 3 min at 4 °C. The supernatant was transferred to a purification column and centrifuged at 9000g for 1 min at room temperature. To the center of the membrane containing the DNA was added 500 μL of solution CW1 and maintained for 1 min at room temperature. After this time, the sample was centrifuged at 9000g for 1 min at room temperature, and the supernatant was discarded. Then, 500 μL of the CW2 solution was added to the membrane containing the DNA and centrifuged at 9000g for 1 min at room temperature. Afterward, the ethanol was evaporated in a dry bath at 50 °C for 10 min. Finally, the DNA was resuspended with 50 μL of endonuclease-free water and stored at −20 °C for use for the synthesis of biomorphs.
H. sapiens
Procurement of DNA from peripheral venous blood was performed following the protocol described in the One-4-all genomic DNA kit (Bio Basic Canada, Inc.). From the donor (author of the article, M.C.-C.), 5 mL of peripheral blood was collected in a tube containing EDTA as anticoagulant; from this aliquot, 100 μL was taken and placed in a sterile 1.5 mL microtube containing 20 μL of proteinase K and 220 μL of PBS (150 mM sodium chloride, 50 mM potassium phosphate, pH = 7.2). The mixture was supplemented with 200 μL of cell lysis (CL) buffer, and vortexed. The mixture was incubated at 56 °C for 10 min, adding 200 mL of 6% (v/v) ethanol free of nucleases. The mixture was transferred to an EZ-10 spin column and centrifuged at 9000g for 1 min, and the supernatant was discarded. Immediately thereafter, 500 μL of the CW1 solution was added and centrifuged at 9000g for 1 min, discarding the supernatant. Then, 500 μL of the CW2 solution was added and centrifuged for 1 min at 9000g, and the supernatant was discarded. Evaporation of ethanol was achieved at 50 °C for 10 min in a dry bath. Finally, the DNA was eluted by adding 50 μL of water free of DNases. The obtained DNA was stored at −20 °C to be used in the synthesis of biomorphs.
Electrophoretic Analysis
The obtained DNA was visualized through agarose gel electrophoresis denaturalized at 0.8% using the procedure described by Rickwood and Hames.41 The gel was stained with 0.1% ethidium bromide, and the bands were observed in a UV transilluminator (Gel Doc XR System, Bio-Rad, Hercules, CA).
Spectrophotometric Analysis
The quality and concentration of the DNA samples was assessed with a spectrophotometer (Nanodrop, 2000). The absorbance of each sample was measured at 230, 260, and 280 nm to estimate their quality ratios A260 nm/A280 nm and A260 nm/A230 nm.
Biomorph Formation
Formation of the calcium, barium, or strontium silica–carbonate biomorphs was achieved by the gas diffusion method.42 Experiments were performed on glass plates of 5 mm in length, 5 mm in width, and 1 mm of thickness. The glass plate was placed inside a crystallization cell with a final volume of 200 μL. The biomorph synthesis solution was prepared with a mixture of 1000 ppm sodium metasilicate, 20 mM calcium, barium, or strontium chloride, and 50 ng of genomic DNA. Finally, the pH of the mixture was adjusted to 11.0 with sodium hydroxide. All reagents were from Sigma-Aldrich (St. Louis, MO). Experiments were performed at 37 °C in two different conditions: the first at constant 5% (v/v) CO2 inside of an incubator and the second in conditions emulating current atmospheric conditions called RTP; see Table 1. In this way, 42 different biomorph synthesis conditions were attained. Biomorph formation was allowed for 24 h. Experiments were repeated in triplicate.
Table 1. Biomorphs Obtained under Different Synthesis Conditionsa.
| Ca2+ |
Ba2+ |
Sr2+ |
||||
|---|---|---|---|---|---|---|
| type of DNA | 5% (v/v) CO2 | RTP | 5% (v/v) CO2 | RTP | 5% (v/v) CO2 | RTP |
| control | √ | √ | √ | √ | √ | √ |
| E. coli | √ | √ | √ | √ | √ | √ |
| A. maxima | √ | √ | √ | √ | √ | √ |
| C. albicans | √ | √ | √ | √ | √ | √ |
| E. arvense | √ | √ | √ | √ | √ | √ |
| H. sapiens | √ | √ | √ | √ | √ | √ |
| all DNAs | √ | √ | √ | √ | √ | √ |
The control sample does not contain DNA.
Labeling of Biomorphs with 2-(4-Amininophenyl)-1H-indole-6-carboxamidine (DAPI)
To assess whether DNA integrates into the structure of biomorphs, the DNA was labeled with the fluorescent marker 4′,6-diamidino-2-phenylindole (DAPI) or bis(benzimidazole), and then the biomorphs were visualized through confocal microscopy. DAPI was chosen because it is a fluorescent marker that binds strongly to adenine- and thymine-rich regions in DNA sequences. The DNA staining technique and its incorporation were modified, taking as basis the reports by Brunk et al.; Labarca and Paigen; and Kapuscinki and Skoczylas.42−45
Characterization of Biomorphs
Biomorphs were observed through scanning electron microscopy (SEM) and analyzed through Raman microspectroscopy, Fourier transform infrared (FTIR) microspectroscopy, and confocal microscopy.
Scanning Electron Microscopy (SEM)
Biomorphs were observed by means of SEM microphotographs in a TESCAN microscope (Brno, Czech Republic) model VEGA3 SB, with a secondary electron detector (SED) from 10 to 20 kV in high vacuum conditions (work distance of 10 mm).
Confocal Microscopy
Confocal microscopy was carried out using a Zeiss LSM700 scanning laser confocal microscope and image software (Zen 2011, Carl Zeiss MicroImaging GHBH, Jena, Germany). Confocal images were acquired using an EC Pln N 10x/0.3 DICI and N Achro Pln 63x/0.85 objective lens and a 405 nm laser. Vertical optical sectioning at every position with a slice thickness of 1 μm was used to generate Z-direction series.
Raman Microspectroscopy
Raman spectrum measurements were recorded with a WITec alpha300 R (WITec GmbH, Ulm, Germany) using a Nd:YVO4 green laser with a wavelength of 532 nm and 672 lines/mm grating. The incident laser beam was focused by a 100× objective (Zeiss, Germany) with 0.9 NA. Punctual Raman spectra were obtained with 0.5 s of integration time and 10 accumulations and a Raman map using 0.03 s of integration time with 14.4 mW of laser power. The data processing and analysis were performed with the WITec Project Version 5.1 software.
Fourier Transform Infrared Spectroscopy (FTIR)
FTIR analysis was performed in a Nicolet iS50R Thermo-Scientific (Waltham, MA) spectrometer equipped with an attenuated total reflectance (ATR) diamond crystal accessory (Smart-iTX). Spectral acquisitions were collected with 32 scans, 4 cm–1 of spectral resolution, in the range of 525 to 4000 cm–1. Data processing and analysis were performed with the OMNIC version 9.0 software.
3. Results and Discussion
The most typical morphologies for the silica–carbonate biomorphs of calcium, barium, and strontium have been properly characterized and have been extensively published in many papers in the literature. However, the most prevalent and the most characteristic morphologies have been described along these results and discussion’s part. It is well known that the addition in the crystallization environment of a biological macromolecule, as DNA is, can affect the morphology of inorganic crystals. Notwithstanding, in biomorphs it has not been evaluated whether DNA acts as a catalyst and directs the morphology that the biomorph can adopt, or if it becomes integrated into the crystalline structure of the biomorph. It is fundamental to elucidate how the DNA participates in the structure of the biomorph as this would be proof whether biomorphs are able or not to isolate the DNA from the surrounding environment.
3.1. Calcium Silica–Carbonate Biomorphs in the Presence of DNA Conserve the Biogenicity Markers
Knowledge of the morphology adopted by biomorphs in the presence of DNA obtained from different organisms is of special relevance because they are structures with diverse biological morphologies that are not formed by cells; however, some of these biomorphs present simililarities with some Apex fossils.1 This fact suggests that biomorphs could be considered as the first “inorganic scaffold” where the first biomolecules, formed in the primitive era, concentrated, conserved, aligned, and duplicated to give rise to the pioneer cell. To analyze whether the DNAs obtained from different organisms modify or not the morphology of biomorphs, we analyzed their formation in the presence of DNA from E. coli (bacteria), A. maxima (algae), C. albicans (yeasts), E. arvense (plants), and H. sapiens (humans), as well as in the presence of a mixture of the five DNAs. Synthesis of these biomorphs was performed under two synthesis conditions: (i) 5% (v/v) CO2 or (ii) at CO2 concentration of the current atmospheric conditions of the laboratory (RTP). The experiments were performed at 37 °C, although the effect of different temperatures from ambient to low temperatures has been already published elsewhere.34 These two conditions were chosen to emulate the conditions prevailing in the Precambrian era where a high CO2 concentration existed and the atmospheric conditions prevailing in the current era.
The biomorphs synthesized in the presence of calcium (Ca2+) without DNA, at a high CO2 concentration, presented rhombohedral and rhombic morphology (Figure 1A), which has been reported to be characteristic of calcium silica–carbonates.31,46
Figure 1.

SEM microphotographs of calcium silica–carbonate biomorphs synthesized in the presence of different DNAs and 5% (v/v) CO2 (A–G) and in conditions emulating current atmospheric conditions, called RTP in the second column (H–N).
Interestingly, in the presence of DNA from E. coli (Figure 1B), C. albicans (Figure 1D), E. arvense (Figure 1E), H. sapiens (Figure 1F), as well as in the presence of all DNAs (Figure 1G), polycrystalline or multilaminar structures were formed; this type of structure has been observed previously in the presence of genomic DNA from C. albicans.31 Additionally, it has been reported that calcium carbonate can generate several structural morphologies, including that observed herein.47−49 These data indicate that the calcium silica–carbonates in the presence of DNA, independently of coming from organisms of different kingdoms, are able to adopt practically the polycrystalline or multilaminar morphology. This stability characteristic is possibly the reason why this element is fundamental for life, as it has been part of different structural and inorganic parts of living organisms since the primitive era until our current days.
An important issue to consider is that the DNA from A. maxima did not change the biomorph morphology as compared to the control (Figure 1C). This behavior could possibly be explained because algae were one of the first forms of life on Earth described as the first organisms that were enveloped by a membrane and with the capacity to duplicate.
To assess whether the morphologies of the biomorphs are the same in the current CO2 conditions of the Earth with respect to those obtained at a high CO2 concentration (Figure 1), biomorphs were synthesized in CO2 concentration emulating current atmospheric conditions (RTP). In the control calcium sample, the morphology of biomorphs was rhombohedral and rhombic (Figure 1H), whereas in the biomorphs synthesized in the presence of DNA from E. coli (Figure 1I), A. maxima (Figure 1J), C. albicans (Figure 1K), E. arvense (Figure 1L), and H. sapiens (Figure 1M) they presented polycrystalline multilaminar arrangements of druse and chain types. These morphologies were not found under a 5% (v/v) CO2 atmosphere (Figures 1A–G).
Procurement of biomorphs with this type of morphologies in RTP conditions indicates that in the current atmospheric conditions of the Earth, in which the CO2 concentration is lower than in the primitive era, the formation of the different calcium structures in the different organisms is chemically plausible. Calcium, as mentioned, is one of the chemical elements of fundamental importance in nature because it is an element that helps to sustain life in all kingdoms. Thus, in prokaryote cells, the Ca2+ ion is found at an intracellular concentration from 100 to 300 nM, which is like that reported in eukaryote cells.50−57 Calcium is also part of motility, in the maintenance of cell structure, and is considered to participate in diverse cell processes like the cell cycle, the host–pathogen interaction, chemotaxis, sporulation, and gene expression.57,58 In fungi, calcium also plays an important role in homeostasis, signaling, and cell structure.59−72
In plants, Ca2+ is an essential nutrient, and like in other organisms, it is part of the cell wall and membranes and is a second messenger in diverse processes like fertilization.73−76 Calcium, as a structural component, plays a relevant role in the morphology of plants, which is influenced by the effects of tension and compression, and the latter mechanisms are regulated by Ca2+.77,78 In addition, Ca2+ stabilizes cell membranes through its interaction with phospholipids,79,80 which reveals that biomolecules interact with Ca2+ to stabilize the cell structures. For biomorphs synthesized in the presence of DNA, calcium must be interacting with the phosphate groups, influencing the morphology they adopt. This information correlates with the morphology adopted by biomorphs in the presence of calcium and DNA (Figures 1H–N); this evidence allows us to propose that calcium has determined the morphology from the first cells in the Precambrian era (which were limited morphologies, as found in biomorphs synthesized in 5% (v/v) CO2) (Figure 1A–G)) until living organisms of the current era, with a diversity of shapes, as observed in the biomorphs synthesized in RTP conditions (Figure 1H–N).
Ca2+ is the most abundant mineral in the human body; it is the structural component of bones and teeth and amounts to 99%.81 In the serum, it is found in 1% yield and participates in muscle contraction, regulation of the cardiac rhythm and nervous functions, blood clotting, cellular differentiation, immune response, programmed cell death, and neuronal activity.81−85
The process of crystalline mineral formation, like calcium minerals, has been considered to be a biomarker of the existence of life on Earth and other planets like Mars.86−90 The crystalline minerals of Ca2+ could display a biotic (microbially induced) or an abiotic origin as shown for Mars research in space.86−90 Identifying the origin and polymorphs of calcium minerals is not a trivial effort because detection of biomolecular markers in crystalline minerals provides valuable information on the possible existence of life on Earth. In this sense, several authors have proposed that the minerals obtained from controlled mineralization processes can be used as biomarkers as they fulfill characteristics that are different from abiotic minerals with the same chemical composition.90 For the identification of biomarkers, techniques like Raman and infrared spectroscopy (IR) have been used because both methods are robust enough to be used in different samples like stromatolites and microbialites, which are considered the most primitive organisms that contain traces of biological activity in our planet.1,87,89 Hence, if some of the compounds proposed as biomarkers in crystalline minerals are identified in the calcium biomorphs synthesized in the presence of DNA, it could be proposed that biomorphs might have been the first crystalline mineral structures where the biomolecules formed in the Precambrian were conserved and duplicated. However, because they are crystalline structures on the nano- or micrometer scale, no registries are found among the fossil remnants. To assess whether some biogenicity marker could be identified in the obtained calcium biomorphs (Figure 1), in addition to its chemical composition, the biomorphs were subjected to Raman and infrared spectroscopy.
Figure S1 shows representative samples of the obtained biomorphs characterized by Raman spectroscopy. In the Raman spectrum corresponding to the control samples produced in 5% (v/v) CO2 and RTP conditions, bands at 157, 283, 713, 1085 and at 165 291, 724, 1093 cm–1, respectively, were identified (Figure S1A,B, Table 2). These vibrations correspond to CaCO3 in one of its polymorphs that corresponds to calcite with a trigonal P3-m structure.32,91,92 In this case, no bands corresponding to any compound that would correspond to a biomarker in fossils was identified. Kerogen has been proposed as a biogenicity marker because the carbon isotopic composition of biogenic kerogen and carbonate carbon coexist since the Precambrian era; and kerogen has been identified in Apex cherts.1−3,93,94 In the Raman spectrum, the presence of kerogen is typically identified in two bands around 1300 (Band “D”) and 1600 (Band “G”) cm–1, as well as in poorly intense bands of 2600–2900 cm–1.1,94 In biomorphs, bands D and G appear between 1300 and 1700 cm–1, and generally, one band or the two poorly intense bands are identified from 2600 to 2900 cm–1. The IR analysis of the microstructure of the two silica-calcium carbonate crystals showed both conditions’ peaks at 760, 872, 903, 1394, 1560, 1654, 1685, 1793, and 1968 cm–1 (Figure S1A,B, Table 2). These results confirm that they correspond to abiotic type calcite because if there had been the presence of any compound used as biogenicity marker, they would have been the characteristics kerogen bands, which appear approximately at 700, 900, 1630, 1710, 2890, and 2930 cm–1.95 The small variations in these values in the IR spectra have been reported to be due to the type of kerogen and the degree of maturation.95 Interestingly, in the DNA samples from E. coli at a high CO2 concentration, bands corresponding to abiotic type calcite were also identified (Table 2). Like in RTP conditions, abiotic-type calcite was identified (Figure S1D, Table 2).
Table 2. Identification through Raman and IR Spectroscopy of the Polymorphs of Calcium Silica–Carbonate Biomorphsa.
| type of DNA | type of synthesis | Raman (λ cm–1) | IR (λ cm–1) | composition/biotic or abiotic |
|---|---|---|---|---|
| control | 5% (v/v) CO2 | 157, 283, 713, 1085 | 760, 872, 903, 1394, 1560, 1654, 1685, 1793, 1968 | calcite/abiotic |
| RTP | 165, 291, 724, 1093 | 603, 756, 870, 905, 1074, 1389 | calcite/abiotic | |
| E. coli | 5% (v/v) CO2 | 156, 282, 712, 1084 | 548, 604, 712, 757, 870, 904, 1388, 1793, 1979 | calcite/abiotic |
| RTP | 172, 290, 782, 1093, 2925, 2982 | 577, 587, 603, 712, 760, 871, 897, 1406, 1793 | calcite/abiotic | |
| A. maxima | 5% (v/v) CO2 | 105, 156, 283, 712, 1085 | 573, 603, 712, 757, 870, 1387, 1793, 1978 | vaterite/abiotic |
| RTP | 111–113, 121, 165, 275, 290, 456, 499, 720, 803, 1093, 1125, 1444, 1689, 1706, 2769, 2976 | 712, 792, 871, 1069, 1406, 1795, 2870, 2940 | calcite, aragonite, vaterite/biotic | |
| C. albicans | 5% (v/v) CO2 | 100, 103, 109, 158, 283, 489, 712, 1085, 1460, 1546, 2934 | 572, 712, 756, 870, 900, 1390, 1795, 2073, 2503, 2880, 2920 | calcite, vaterite/biotic |
| RTP | 118, 165, 290, 720, 1093, 1443, 1450, 1757, 2978 | 541, 712, 797, 870, 1081, 1260, 1390, 1800, 2560, 2870, 2910 | calcite, vaterite/biotic | |
| E. arvense | 5% (v/v) CO2 | 103, 110, 282, 426, 487–491, 570–585, 712–793, 827, 1085, 1102–1109, 1442, 1501, 1588, 1757, 2152–2182, 2360, 2428, 2534, 2905–2998 | 626, 712, 870, 902, 1064, 1390, 1794, 2850, 2940 | calcite, aragonite, vaterite/biotic |
| RTP | 165, 290, 720, 1093, 1443, 1757, 2865 | 712, 796, 871, 1062, 1393, 1793, 2507, 2870, 2940 | calcite/biotic | |
| H. sapiens | 5% (v/v) CO2 | 112–114, 158, 283, 446, 554, 713, 973, 1086, 1436, 1750, 2153, 2264, 2601, 2906, 2914 | 626, 712, 757, 870, 902, 1064, 1390, 1794, 1976, 2024, 2507, 2880, 2930 | calcite, aragonite/biotic |
| RTP | 123, 164, 290, 560, 718, 1088, 1093, 2460, 2971 | 582, 712, 871, 907, 1080, 1261, 1406, 1793, 2018, 2153, 2560, 2990 | calcite, aragonite/biotic | |
| all DNAs | 5% (v/v) CO2 | 102–104, 158, 283, 378,550, 713, 1086, 113, 1615, 2242, 2375, 2585, 2941 | 574, 597, 604, 617, 712, 761, 871, 898, 1389, 1788, 2870, 2910 | calcite, vaterite/biotic |
| RTP | 164, 290, 720, 1093, 1444, 1756, 2504, 2935 | 561, 573, 604, 711, 869, 1063, 1369, 1792, 2860, 2940 | calcite/biotic |
The control sample does not contain DNA.
Biomorphs produced with DNA from A. maxima in 5% (v/v) CO2 showed an abiotic-type vaterite polymorph, whereas in RTP conditions, calcite, aragonite, and vaterite but of the biotic type were identified (Table 2). For biomorphs obtained with DNA from an eukaryote unicellular organism, like C. albicans, both at a high and low (RTP) concentrations of CO2, polymorphs of calcite were identified in presence of kerogen (Table 2). Analysis of the silica–carbonate samples obtained with DNA from E. arvense with 5% (v/v) CO2 revealed the three polymorphs calcite, aragonite, and vaterite (Table 2), whereas in RTP conditions, the biotic-type calcite polymorph was identified in both conditions (Table 2). With the DNA from H. sapiens, calcite and aragonite polymorphs were obtained in the presence of kerogen in both conditions (Table 2). Finally, in the presence of all DNAs, the biomorphs synthesized at a high CO2 concentrations presented the biotic-type calcite and vaterite polymorphs, whereas the biomorphs in RTP conditions only presented the calcite polymorph (Table 2). Among minerals, CaCO3 is of great interest because organisms from all kingdoms are able to biomineralize it, generally in the calcite and aragonite polymorphs, and this finding is considered the most ancient evidence of life, although they can be synthesized biotically and abiotically.88,89,96 The polymorph calcite (microbially induced) is a biogenic mineral that has been conserved in organisms for at least 500 million years and is present in most organisms.96−102 Our results showed that the CaCO3 biomorphs obtained in the presence of genomic DNA correspond precisely to the calcite polymorphism in all conditions (Table 2). This is an important datum as it can explain the reason why this polymorphism in fossils is found in the five kingdoms in nature. In addition, it is obtained in RTP conditions, which are the usual conditions for many organisms of our current era, supporting the hypothesis that this biogenic mineral is the link between the Precambrian era and the subsequent ones. Additionally, the fact that in the presence of genomic DNA CaCO3 polymorphisms can coexist could explain the proposal that the calcite and aragonite polymorphisms are the most abundant crystalline structures in organisms from microorganisms to humans,101 with calcite being the one with the highest stability,96−102 which was identified also in all biomorphs, independently from the synthesis conditions (Figure 1, Table 2). The fact that there are organisms constituted by two CaCO3 polymorphs suggests that since the Precambrian era, with the existence of biomolecules, the organisms formed vital crystalline structures that have been conserved along millions of years.32,33 Our results also show that kerogen was identified as a biomarker of biogenicity in the presence of DNA from both prokaryote and eukaryote organisms (Table 2). To the best of our knowledge, this is the first time that kerogen could be identified in both atmospheric conditions, that emulating those of the Precambrian and the current atmosphere in the presence of DNAs. Even though these results do not conclusively mean that the biomorphs are the structures found in cherts (archaic microfossils), it must comply with given conditions, that is, to be geochemically plausible, which is inferred from the characteristic kerogen signal, a condition that is complied with by the biomorphs we have synthesized in the presence of a biomolecule like the DNA (Figure 1, Table 2). They will always keep the footprint or biomarker that their origin is biogenic, independent from the time elapsed since their synthesis as in the case of the Apex cherts.1 In addition, their morphology will be different from the mineral of biotic origin. For the biomorphs synthesized with the different DNA (Figure 1), the encountered morphologies had a laminar or granular pattern, morphologies that have been reported in the biomineralized CaCO3 of organisms. The laminar pattern is found in corals, sponges, and fossil shells, whereas the small crystals granular pattern is found in algae, microbialites, and stromatolites.88
3.2. Barium and Strontium Biomorphs Are Selective toward a Given Type of DNA
Barium and strontium biomorphs are of additional interest because, like the calcium biomorphs, they form morphologies that resemble living organisms and primitive organisms.32,33,103−105 Therefore, to assess whether the morphology of biomorphs changed in the presence of DNAs, as observed with the calcium ones, we performed the synthesis of barium or strontium silica–carbonates in the presence of these biomolecules and under high or low CO2 concentration. The control barium biomorphs under a 5% (v/v) CO2 current formed a spherulitic morphology (Figure 2A), which is the typical morphology observed in these synthesis conditions.32,33 The morphology adopted by the barium biomorphs in the presence of DNA from E. coli was of spherulitic type (Figure 2B), but the shape and distribution of the spicules of the crystals is very different from the controls (Figure 2A). For the biomorphs obtained with DNA from A. maxima (Figure 2C), C. albicans (Figure 2D), and E. arvense (Figure 2E), hollow structures were obtained resembling the skeleton of some type of face with clefts and crystals of short spicules This type of morphology is not commonly found in barium biomorphs; this contrasts with the morphology found in the biomorphs synthesized in the presence of DNA from H. sapiens, where they adopted a morula-type spherulitic morphology (Figure 2F). In the presence of the DNAs of the different organisms, the biomorphs also presented the morula-type spherulitic morphology (Figure 2G). This result reveals that in this combination the DNA from H. sapiens prevails over the other DNAs. The appearance of cell divisions, as in the morula-type process, it is favored by means of certain structures with clefts (Figure 2C–E). Our results agree with previous findings of our research team and thpse of other authors because the barium silica–carbonates are capable of forming structures that emulate early forms of life such as ancient microfossils.32−34,38−40 In addition, having obtained Ba2+ biomorphs with morphologies resembling radiolarians and diatoms106,107 in the presence of DNA is interesting evidence, as it suggests that possibly radiolarians and diatoms were formed after the primitive era and have been conserved until the present time.
Figure 2.

Microphotographs of barium or strontium silica–carbonate biomorphs observed through SEM at 5% (v/v) CO2 or RTP. Biomorphs were synthesized in the absence (control, A, H, O, V) or presence of DNA from E. coli (B, I, P, W), A. maxima (C, J, Q, X), C. albicans (D, K, R, Y), E. arvense (E, L, S, Z), H. sapiens (F, M, T, AA), and a combination of the DNAs of the five organisms (G, N, U, BB).
Another condition in which barium biomorphs were synthesized was at low CO2 (RTP) in the presence of the different DNAs. As shown in Figure 2H, the biomorphs of the control sample presented morphologies of leaves, flowers, helixes, and spheres, which are typical morphologies found in the absence of DNA.32−34 The samples treated with the DNA from E. coli (Figure 2I), A. maxima (Figure 2J), and C. albicans (Figure 2K) showed morphologies of leaves and stems, whereas those obtained with the DNA from H. sapiens (Figure 2M) showed a worm-type helix morphology. The biomorphs with the combination of all DNAs revealed a morphology where the worm-like helix morphology stands out (Figure 2N), similar to the morphology encountered with the DNA from H. sapiens (Figure 2M). In the barium biomorphs synthesized at a high CO2 concentration (Figures 2A–G), which emulates the atmosphere present in the Precambrian, the favored morphologies resembled radiolarians and diatoms, organisms that could have existed in that primitive era.106−108 In contrast, the morphologies obtained in RTP conditions are common in the current epoch (Figures 2H–N). The results could indirectly indicate how the atmospheric conditions of the primitive era favored relatively more simple morphologies, although of great beauty, like radiolarians and diatoms. When the atmospheric conditions changed, it is possible that these structures had to adequate themselves, favoring the diversity of morphologies, which gave rise to the evolution of species.
For the strontium biomorphs synthesized without DNA, a sphere-type morphology with discrete clefts was observed (Figure 2O); this is one of the typical morphologies reported in these conditions.32−34 The biomorphs synthesized in the presence of the different DNAs also presented a spherical morphology but without clefts and with a different crystalline structure; some biomorphs showed a smooth surface like the biomorphs obtained in the presence of the DNA from E. coli (Figure 2P), C. albicans (Figure 2R), and H. sapiens (Figure 2T), and others showed a rugose texture like those with the DNA from A. maxima (Figure 2Q) and E. arvense (Figure 2S). The biomorphs obtained with all of the DNAs also showed a smooth spherical morphology but with marked lines (Figure 2U). These data are relevant because it has been described that strontium was part of some of the first organisms since the Precambrian era and has been conserved until the present day, and most strontium biomorphs present spherical morphology with different textures.106−108 SEM images of the strontium silica–carbonates formed under RTP conditions revealed that the control sample presents spiral, leaf, and flower structures (Figure 2V). This morphology corresponds to a typical structure as reported by our research team and other authors.32−34,39,109 The Sr2+ silica–carbonates synthesized with genomic DNA from E. coli presented a morphology of leaves (Figure 2W), whereas those with DNA from A. maxima presented a morphology similar to algae (Figures 2X and 3). Obtaining this morphology precisely with the DNA from the alga A. maxima and strontium is very interesting because having a morphology similar to that of algae of the current epoch evidence that it can be the linking point between the Precambrian and recent eras. In this sense, Sr2+ has been identified in 744 marine carbonates during the Phanerozoic era,110 and currently, there are organisms, including algae, that contain strontium.111
Figure 3.

Comparison of morphologies between the biomorph obtained with DNA from A. maxima and Sr2+ (A) and algae found in nature (B). (B) Public domain picture under the standard license from IStock by Getty Images: www.istockphoto.com.
Samples obtained in the presence of DNA from C. albicans (Figure 2Y), E. arvense (Figure 2Z), H. sapiens (Figure 2AA), and the mixture of all DNAs (Figure 2BB) showed a morphology of flowers and compound leaves more complex than those of the control sample (Figure 2V). Obtaining biomorphs with more complex leaf, flower, and spiral morphologies in the presence of DNAs from eukaryote organisms is interesting because it suggests that this could be the reason why eukaryote organisms present more complex and differentiated morphologies than prokaryote organisms.
Additionally, to learn the chemical composition and the crystalline structure of the Ba2+ and Sr2+silica–carbonates, they were analyzed through Raman and IR spectroscopy like the calcium silica–carbonates. The Raman spectrum of the control sample of the Ba2+ silica–carbonate biomorphs in the presence of 5% (v/v) CO2 showed bands at 93, 139, 155, 229, 692, and 1059 cm–1 (Table 3), whereas in the same sample but in the presence of RTP conditions, the bands were found at 101, 145, 158, 228, 697, 1064, 1361, and 1609 cm–1. In both samples, these vibrations correspond to the BaCO3 polymorph aragonite-type, named witherite.112,113 In these samples, the band corresponding to kerogen was not identified; hence, they are considered of abiotic origin. In the barium samples synthesized in the presence of DNA from E. coli obtained at high or low CO2, the characteristic peaks of witherite were identified plus three peaks approximately at 1300, 1600, and 2900 cm–1 (Table 3). As stated before, these peaks indicate the presence of kerogen, proposed as a marker of biogenicity.1,94 Therefore, these samples are considered of biotic origin. The microstructure analysis of the silica–carbonate crystals through IR spectroscopy, in both conditions, revealed peaks at 554, 582, 600, 692, 778, 854, 894, 1058, 1412, 1577, 1751, 1980, 2451, 2830, 2910 cm–1 (Table 3), confirming the presence of kerogen in these samples through both Raman and IR spectroscopy.
Table 3. Identification through Raman and IR Spectroscopy of the Barium Silica–Carbonate Biomorphsa.
| type of DNA | type of synthesis | Raman (λ, cm–1) | IR (λ, cm–1) | composition/biotic or abiotic |
|---|---|---|---|---|
| control | 5% (v/v) CO2 | 93, 139, 155, 229, 692, 1059 | 692, 794, 855, 1073, 1415 | witherite/abiotic |
| RTP | 101, 145, 158, 228, 697, 1064 | 603, 692, 800, 854, 954, 1080, 1413, 1577 | witherite/abiotic | |
| E. coli | 5% (v/v) CO2 | 93, 142, 156, 224, 1060, 1296, 1449, 1607, 2917 | 554, 582, 600, 692, 778, 854, 894, 1058, 1412, 1577, 1751, 1980, 2451, 2830, 2910 | witherite/biotic |
| RTP | 99, 141, 152, 223, 692, 930, 1060, 1357, 1508, 2936 | 603, 692, 855, 953, 1077, 1416, 1576, 1748, 1979, 2161, 2990 | witherite/biotic | |
| A. maxima | 5% (v/v) CO2 | 94, 139, 155, 225, 691, 1059, 2922 | 591, 692, 785, 855, 1058, 1417 | witherite/abiotic |
| RTP | 141, 152, 224, 694, 1061, 1425, 1508, 2920 | 692, 799, 854, 953, 1077, 1471, 1600, 1750, 2970 | witherite/biotic | |
| C. albicans | 5% (v/v) CO2 | 104, 146, 161, 475, 698, 1066, 1461, 1613, 2924 | 604, 662, 786, 855, 951, 1076, 1416, 1749, 1960, 2050, 2450, 2650, 2830, 2920 | witherite/biotic |
| RTP | 101, 143, 696, 1061, 2934 | 572, 609, 692, 799, 854, 950, 1080, 1413, 1557 | witherite/abiotic | |
| E. arvense | 5% CO2 | 95, 140, 157, 225, 692, 1060 | 692, 800, 856, 958, 1080, 1415 | witherite/abiotic |
| RTP | 141, 225, 693, 1061, 2940 | 662, 788, 856, 933, 1074, 1413 | witherite/abiotic | |
| H. sapiens | 5% (v/v) CO2 | 102, 146, 162, 230, 698, 1066 | 692, 789, 855, 1058, 1417 | witherite/abiotic |
| RTP | 99, 142, 152, 225, 694, 1011, 1061 | 604, 761, 896, 1054, 1417 | witherite/abiotic | |
| all DNAs | 5% (v/v) CO2 | 94,108, 145, 224, 690, 1059 | 692, 788, 855, 1058, 1418 | witherite/abiotic |
| RTP | 141, 222, 692, 1060, 2917 | 662, 799, 855, 953, 1080, 1417, 1576 | witherite/abiotic |
The control sample does not contain DNA.
Regarding barium silica–carbonate biomorphs synthesized with DNA from A. maxima, at 5% (v/v) CO2, the abiotic-type witherite was found, whereas in concentrations emulating current atmospheric conditions of the laboratory, biotic witherite was formed (Table 3). The biomorphs obtained with DNA from C. albicans in 5% CO2 corresponded to biotic-type witherite; in contrast, biomorphs obtained in RTP conditions showed spectra with the characteristics of abiotic-type witherite (Table 3). Surprisingly, biomorphs in the presence of DNA from E. arvense, H. sapiens, and the combination of all DNAs in both conditions showed the characteristic witherite bands but not that of kerogen (Table 3). These data indicate, on one side, that the presence of barium with these types of DNA does not favor the formation of this biomarker, and on the other side that the DNA from E. arvense and H. sapiens is not compatible with this chemical element, which would explain why barium is not a component of plants and the human body.
In summary, these results indicate that the biomorphs in the presence of Ba2+ and DNA, like the calcium silica–carbonate biomorphs, could be the first mineral crystalline structure where the biomolecules of the Precambrian were isolated from the existing environment and, in this way, were conserved and duplicated, favoring the diversity of organisms. But, relevantly, they also show that the DNAs of plants and humans are not compatible with this chemical element (barium), which would reveal that, indeed, current plants and humans did not originate in the Precambrian era, but rather in more recent eras.114,115 In contrast, for example, there are algae and some marine organisms that are compatible with barium and even strontium and have conserved it until our current epoch.116
The chemical composition and crystalline structure of the strontium silica–carbonates was also determined. The control sample at 5% (v/v) CO2 showed bands at 105, 256, 488, 1072, 1302, and 1456 cm–1 (Table 4). These vibrations correspond to SrCO3 in the crystalline structure of strontianite, which is identical to that of aragonite.32−34,113,117 The control strontium biomorphs synthesized in RTP conditions (Table 4) showed the characteristic peaks reported for strontianite. In both conditions, the peaks corresponding to kerogen were not identified; hence, they correspond to abiotic-type strontianite. The Raman spectra of the strontium silica–carbonates synthesized with DNA from E. coli or A. maxima showed the characteristic peaks of strontianite and kerogen (Table 4).
Table 4. Identification through Raman and IR Spectroscopy of the Polymorphs of Strontium Silica–Carbonate Biomorphsa.
| type of DNA | type of synthesis | Raman (λ, cm–1) | IR (λ, cm–1) | composition/biotic or abiotic |
|---|---|---|---|---|
| Control | 5% (v/v) CO2 | 105, 256, 488, 1072, 1456 | 548, 608, 705, 854, 1070, 1439, 2005, 2005 | strontianite/abiotic |
| RTP | 158, 190, 252, 710, 1080, 1461 | 798, 854, 953, 1080, 1444 | strontianite/abiotic | |
| E. coli | 5% (v/v) CO2 | 104, 112, 122, 486, 1072, 1454, 1605, 2880, 2960 | 604, 698, 705, 854, 953, 1070, 1143, 1730, 2900 | strontianite/biotic |
| RTP | 150, 181, 244, 700, 1072, 1361, 1450, 2874, 2934 | 795, 854, 944, 1081, 1458, 1716, 2840, 2970 | strontianite/biotic | |
| A. maxima | 5% (v/v) CO2 | 109, 152, 479, 700, 913, 1071, 1177, 1451, 1606, 1870, 2205, 2406, 2889 | 688, 705, 796, 854, 960, 1070, 1441, 1750, 2900 | strontianite/biotic |
| RTP | 111, 154, 487, 1071, 1467, 1645, 2885 | 608, 705, 798, 854, 946, 1077, 1458, 1578, 1710, 2960 | strontianite/biotic | |
| C. albicans | 5% (v/v) CO2 | 112, 150, 182, 700, 1071 | 577, 604, 688, 705, 1070, 1979 | strontianite/abiotic |
| RTP | 111, 151, 182, 699, 1072, 2917 | 794, 854, 945, 1077, 1442 | strontianite/abiotic | |
| E. arvense | 5% (v/v) CO2 | 108, 572, 1072, 1455, 1608, 1953, 2025, 2476, 2887, 2951 | 604, 698, 705, 854, 853, 1070, 1442, 1712, 2950 | strontianite/biotic |
| RTP | 115, 151, 183, 246, 701, 1072, 1456, 1608, 2769, 2940 | 792, 945, 1077, 1446, 1700, 2850, 2930 | strontianite/biotic | |
| H. sapiens | 5% (v/v) CO2 | 150, 182, 1071 | 698, 854, 1070, 1433, 1879 | strontianite/abiotic |
| RTP | 115, 184, 700, 1072, 1775, 1937 | 792, 845, 1077, 1448 | strontianite/abiotic | |
| all DNAs | 5% (v/v) CO2 | 114, 151, 183, 699, 1071 | 580, 773, 854, 1068, 1232, 1437, 1768, 1988, 2158 | strontianite/abiotic |
| RTP | 105, 150, 182, 699, 1071, 2915 | 705, 792, 854, 1077, 1441 | strontianite/abiotic |
The control sample does not contain DNA.
In the biomorphs obtained in the presence of DNA from C. albicans with 5% (v/v) CO2, only the characteristic peaks of strontianite were identified; hence, they are of abiotic type (Table 4). In those produced under RTP conditions, also strontianite was identified, together with a low intensity band at 2917 cm–1, but kerogen characteristic peaks were not identified (Table 4); hence, they are also of abiotic type. In biomorphs synthesized with DNA from E. arvense at both CO2 concentrations, characteristic peaks of strontianite and kerogen were identified (Table 4). These are interesting results because they could suggest that the pioneer cells that later gave origin to algae, as we know it today, were compatible with the strontium present in the Precambrian, and some of these algae have conserved strontium since that era. The latter shows that strontium in contrast to barium is an element that under certain condition can be part of plants. The biomorphs obtained with DNA from H. sapiens, and the combination of all DNAs, in both synthesis conditions, showed the peaks corresponding to strontianite, but not those of kerogen (Table 4); in this case, like with barium, our data indicate that the human DNA is not compatible with these chemical elements.
These results are relevant and agree with other authors, who have reported that in several organisms like some species of algae, invertebrates, and fish, calcium and strontium have been identified mainly, and barium has been found only in few organisms.111 Data indicate that, indeed, although strontium and barium are elements of similar chemistry,116 strontium is preferred over barium in some organisms. This preference could be favored by the availability of this element because strontium can be found in different habitats like soils, peat bogs, and aquatic media.118,119 However, the human DNA is not compatible with any of these two chemical elements, suggesting that even in very simple systems, like biomorphs, it can be noted that calcium is an element completely compatible with this type of DNA, allowing for a selection at the chemical level since the origin of each organism.
3.3. DNA Is Internalized and Becomes Part of the Biomorphs’ Structure
The morphology and the crystalline habit of biomorphs depend on the type of DNA employed as well as on the alkaline earth metal that participates in its synthesis (Figures 1 and 2, Tables 2–4). Notwithstanding, in biomorphs it has not been evaluated whether DNA acts as a catalyst and directs the morphology that the biomorph can adopt, or if it becomes integrated into the crystalline structure of the biomorph. It is fundamental to elucidate how the DNA participates in the structure of the biomorph, as this would be proof that biomorphs are able or not to isolate the DNA from the surrounding environment. Besides, it would prove the biogenicity that favors the formation of kerogen, as we have shown in the biomorphs synthesized with the different DNAs. The latter will allow us to propose biomorphs as one of the first mineral structures where the biomolecules formed in the Precambrian could be isolated, protected, and duplicated, allowing for their conservation and posterior evolution and generation of the different organisms.
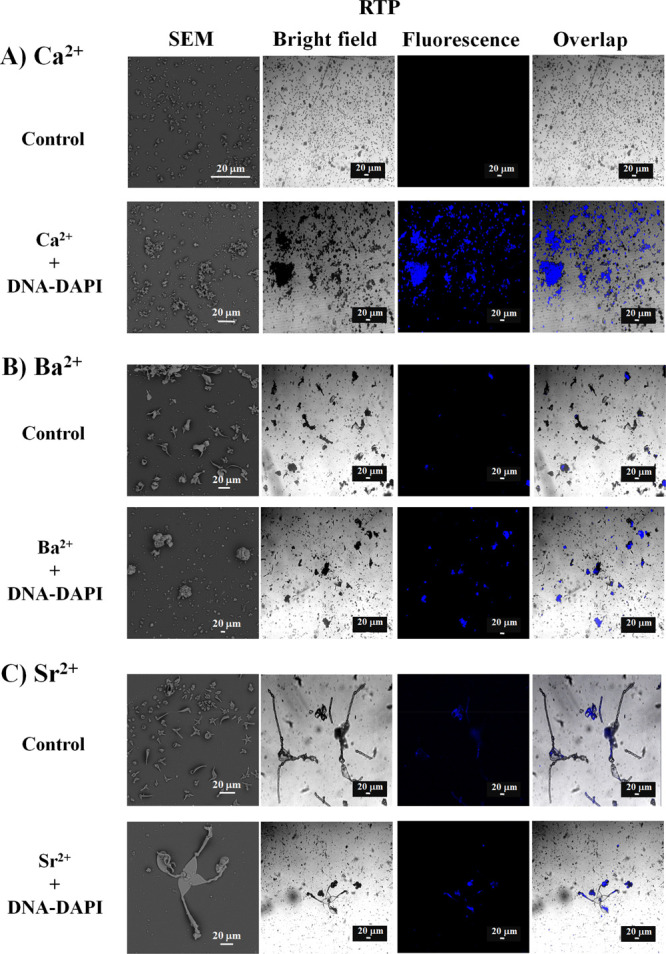
To assess the participation of DNA in the structure of biomorphs, DNA from all kingdoms was stained with the DAPI fluorochrome; then the biomorphs were visualized through confocal microscopy. The DNA staining technique and the incorporation to biomorphs was modified, and the synthesis was adjusted for this, based on reports by Brunk et al., Labarca and Paigen, and Kapuscinki and Skoczylas,43−45 as this is the first time that a fluorochrome was used for this purpose in biomorphs. Biomorphs with and without DNA were inspected in the presence of DAPI for the three types of silica–carbonates, (i) Ca2+, (ii) Ba2+, and (iii) Sr2+ at both CO2 concentrations, as described in the Experimental Section. The synthesized biomorphs were visualized through SEM, bright field, and fluorescence (Figures 4, 5). The DNA used for each alkaline metal was selected as follows: Ca2+ was from DNA of E. coli; Ba2+ was from DNA of H. sapiens and Sr2+ was from DNA of A. maxima.
Figure 4.

Micrographs of biomorphs synthesized in the absence or presence of DNA-DAPI under a constant 5% (v/v) CO2 current with (A) Ca2+, (B) Ba2+, or (C) Sr2+, obtained through SEM, bright field, and confocal microscopy.
Figure 5.
Micrographs of biomorphs synthesized in the presence or absence of DNA-DAPI in RTP conditions with (A) Ca2+, (B) Ba2+, or (C) Sr2+, obtained through SEM, bright field, and confocal microscopy.
Regarding the biomorphs synthesized at a 5% (v/v) CO2 concentration, the control calcium silica carbonates are not autofluorescent, as shown by fluorescence micrographs (Figure 4A), whereas in the sample of DNA marked with DAPI (DNA-DAPI), fluorescence colocalized with the biomorphs (Figure 4A), revealing that the DNA is localized in the biomorphs, as no fluorescence is observed in any other field outside of them. For the control sample of the barium biomorphs, as shown in the fluorescence micrograph, the barium exhibited low autofluorescence, barely perceived as a spot (Figure 4B). In contrast, the barium biomorphs synthesized with the DNA-DAPI, showed a high intensity fluorescence (Figure 4B). Like with the calcium biomorphs, fluorescence is localized only within the barium biomorphs (Figure 4B). The control sample of the strontium biomorphs shows barely perceptible spots; this is because barium and strontium per se present a very low fluorescence (Figure 4C), whereas in those with DNA-DAPI, the DNA was localized in the biomorphs (Figure 4C).
To prove that the binding of DNA to the DAPI biomorphs was achieved in RTP conditions (Figure 5), in the control calcium biomorphs, no fluorescence was found (Figure 5A), whereas in those obtained in the presence of DNA-DAPI, fluorescence was identified only in biomorphs (Figure 5A), as had been observed with 5% (v/v) CO2 (Figure 4A).
In the control samples with barium and strontium, barely perceptible fluorescence spots were observed (Figure 5B,C), which correspond to the self-fluorescence that these chemical elements have as mentioned before. The biomorphs synthesized with DNA-DAPI in the presence of barium or strontium presented a defined fluorescence in the biomorphs (Figure 5B,C). Another important issue to analyze was whether the DNA was sourced from prokaryotes or eukaryotes; therefore, we marked the DNAs of all organisms. Although it was observed that independently from the synthesis conditions and the used DNA, the DNA is localized in the biomorphs (Figures 4, 5, and S2), we were interested in knowing whether the DNA was in the external part of the biomorphs or if it became integrated internally in their structure. Knowing this is relevant as it allows understanding whether the DNA is located inside like in cells. With this in mind, biomorphs were subjected to optical sections, as confocal microscopy allows us to perform several fine optical sections and then perform tridimensional reconstructions, that is, in the depth plane of the sample, originating an image with the information from the x, y, z planes. This tool is used, for example, to know the changes in the expression and distribution of molecules in organelles, as well as in the analysis of colocalization of membrane or intracellular biomolecules.120,121 When performing the optical sections in several biomorphs synthesized in the presence of DNA-DAPI, we found, interestingly, that the DNA is inside the biomorph in both conditions and with the three analyzed chemical elements (Figure 6).
Figure 6.

Representative images of the fine optical sections and tridimensional reconstructions of biomorphs synthesized in the presence of DNA-DAPI, with (A) Ca2+, (B) Ba2+, or (C) Sr2+, obtained through bright field and confocal microscopy.
Additionally, to show that, in biomorphs with different morphologies, the DNA is located in their interior, we depict a biomorph that emulates a leaf with stems and flowers where the DNA is found inside the different morphologies (Figure S3).
In general, these data evidence that the DNA is located inside the biomorphs, which allows us to infer that, indeed, biomorphs are good candidates to allow biomolecules like the DNA to get isolated from the environment, independently from the synthetic conditions. This ability of DNA to be incorporated to the structure of the biomorphs in both synthesis conditions agrees with reports from other authors, who have proposed that the first organism was constituted by a mineral part and an organic part.122 This author postulates that this pioneer organism first evolved toward a cellular membrane, which would cover the mineral part.122 It has also been proposed that this first organism contained the first biomolecules like RNA, DNA, ribosomes, and enzymes and had a fixed metabolism.123,124 From this organism, through slow and complicated evolutionary processes, the development of more complex organisms was favored.125 Our results agree with these hypotheses because as observed the DNA becomes internalized in biomorphs; in this way, it was protected from the external environment (Figures 4–6), which would be the equivalent of the protocell proposed by Wächtershäuser.122 From this mineral–organic structure the cell membrane was formed, and more complex organisms were originated, as proposed by several authors.123−125 This hypothesis is the most viable regarding the origin of life on Earth as proposed because, as known, all organisms are constituted by a mineral portion that is part of the structure and function. This characteristic has been proposed to have existed since the protocell,122 and this mineral–organic relation was necessary for the origin of life in the Precambrian era is now supported by our results. Or it is the possible basis for how organisms of all kingdoms have conserved their mineral part in their structures. In this way, through the mineralization process, organisms produce the materials required for their protection and support. The synthesis of biogenic minerals among organisms of the five kingdoms has been widely described in bacteria, yeasts, protists, plants, and animals.28,32−34 Additionally, our results strengthen the proposals of other research teams that indicate that the first biomolecules and, hence, the first organism originated in the primordial soup included minerals.126−134 Another hypothesis supported by our results concerning the participation of minerals in the origin of life is the proposed mechanism through which minerals formed the crystals that are part of organisms.135 The fourth evidence is that we were able, for the first time, to identify kerogen bands in conditions that emulate the Precambrian as well as in the current RTP conditions in the presence of DNA. This had not been achieved because the presence of this biomarker in biomorphs had been induced in extreme conditions.38,136 Our results show that biomorphs could have been the first mineral structures in which the biomolecules formed in the Precambrian were concentrated, aligned, polymerized, and protected from UV radiations and hydrolysis, allowing for the formation of polymers, which assembled to form the first organisms, and later on, all organisms were formed through macroevolution.30
Finally, our proposal that biomorphs could have been the first mineral structures in which the pioneer biomolecules of the primigenial Earth were isolated from the environment to give origin to the first organisms is based on the similarities that biomorphs share with organisms from the cherts, like radiolarians and diatoms, which are as follows. (i) Both radiolarians and diatoms have a mineral skeleton, which is always of silica, a characteristic they share with biomorphs as their structure is also a silicate and require silicon for their synthesis. (ii) Both radiolarians and diatoms are unicellular organisms, although sometimes several organisms can coexist, a characteristic also found in biomorphs in the presence of DNA, where most synthesized biomorphs are found as individual biomorphs, with a minimal amount of grouped biomorphs. (iii) Radiolarians generally present a hollow structure, like some diatoms, a characteristic presented also by biomorphs. (iv) Both radiolarians and diatoms can have very elaborated and beautiful structures, just like biomorphs. (v) The body of radiolarians can be divided in an internal and an external part, leaving the nucleus in the inside; this characteristic was assessed in this work, where it was determined that biomorphs also present an external and an internal part. (vi) The DNA in radiolarians and diatoms is in their interior; the DNA in biomorphs is also located in their interior as shown in this work (Figures 4–6, S2, and S3). On the other side, the identification of kerogen, plausibly synthesized geochemically in biomorphs, complies with microfossil studies that establish that to confirm that a structure found in cherts is an archaic microfossil it must fulfill two fundamental conditions: (a) that the microfossil (MF), objective of the study, must be the result of a self-assembly process and (b) must be geochemically plausible. The MFs must comply with tests of antiquity and biogenicity; that is, MFs are or have been generated in a small petrographic section and must have appeared in a sedimentary or metasedimentary rock, the MF must be larger than the microorganism to which it is compared, the MF be composed of kerogen, aside from its silicon (quartz) composition,and the MF must present a defined tridimensional structure, its morphology compares with other microfossils of similar morphology, it must be hollow, and it must be elaborated cellularly.
The preceding data indicate that biomorphs could have been the first inorganic structures in which biomolecules like DNA became concentrated, aligned, polymerized, and protected from UV radiation and hydrolysis, allowing the formation of polymers, which became assembled to form the first organism. Although they are not dated as fossil registry, this could be because they are possibly the antecessor structure of the Precambrian cherts, becoming, in this way, invisible, or what has been dated are the silicon biomorphs that formed according to the chemical and physical conditions prevailing in that geological era and that the inclusion in sedimentary rocks is a simple common mineralization process.
Biomorphs fulfill these conditions; therefore, we propose them as one of the first inorganic structures where biomolecules became isolated from the surrounding environment during the Precambrian era.
Conclusions
Our results support that biomorphs could have been the first inorganic structures in which biomolecules, like Precambrian DNA, became concentrated, aligned, polymerized, and protected from the damaging effects of UV radiation. This allowed for the formation of polymers that assembled to form the first organism. Although biomorphs are not dated as fossil registry, this could be because they are the antecessor structure of the Precambrian cherts, making them invisible, or rather what has been dated are indeed silicon biomorphs that formed according to the chemical and physical conditions prevailing in the geological era, and the inclusion in sedimentary rocks is nothing more than a simple common biomineralization process.
Acknowledgments
This work was carried out with the financial support granted to M. Cuéllar-Cruz by Project No. CF2019-39216 as well as Project No. A1-S-7509 granted to Abel Moreno from the Consejo Nacional de Ciencia y Tecnología (CONACYT) and Proyecto-Institucional-UGTO-017/2022 from Universidad de Guanajuato, Mexico. A.M. acknowledges DGAPA-UNAM PAPIIT Project No. IN207922 for partial support for this project. The authors acknowledge Ms. Ingrid Mascher for the English revision of this manuscript. The authors thank Laboratorio Universitario de Caracterización Espectroscópica (LUCE) of the Instituto de Ciencias Aplicadas y Tecnología, UNAM and Ms. José Guadalupe Bañuelos for their support for the Raman measurements.
Supporting Information Available
The Supporting Information is available free of charge at https://pubs.acs.org/doi/10.1021/acsomega.2c04170.
(Figure S1) Representative image of the identification of the crystalline phase of CaCO3 biomorphs through Raman spectroscopy. (Figure S2) Images of the barium silica–carbonate biomorphs synthesized without DNA (A) or with DNA-DAPI from E. coli (B), A. maxima (C), C. albicans (D), E. arvense (E), and H. sapiens (F). (Figure S3) Representative image of the fine optical sections and tridimensional reconstruction of a biomorph with a complex morphology emulating leaves, flowers, and stems in the presence of DNA-DAPI (PDF)
Author Contributions
§ M.C.-C. and A.M. contributed equally.
The authors declare no competing financial interest.
Supplementary Material
References
- Schopf J. W.; Kudryavtsev A. B. Biogenicity of Earth́s earliest fossils: A resolution of the controversy. Gondwana Res. 2012, 22, 761–771. 10.1016/j.gr.2012.07.003. [DOI] [Google Scholar]
- Schopf J. W.; Kudryavtsev A. B.; Agresti D. G.; Wdowiak T. J.; Czaja A. D. Laser- Raman imagery of Earth’s earliest fossils. Nature 2002, 416, 73–76. 10.1038/416073a. [DOI] [PubMed] [Google Scholar]
- Schopf J. W. Microfossils of the Early Archean Apex chert: new evidence of the antiquity of life. Science 1993, 260, 640–646. 10.1126/science.260.5108.640. [DOI] [PubMed] [Google Scholar]
- Schopf J. W.Paleobiology of the Archean. In Schopf J. W., Klein C., Eds.; The Proterozoic Biosphere: A Multidisciplinary Study; Cambridge University Press, 1992; pp 25–39. [Google Scholar]
- Schopf J. W.; Packer B. M. Early Archean (3.3-billion to 3.5-billion-year-old) microfossils from Warrawoona Group, Australia. Science 1987, 237, 70–73. 10.1126/science.11539686. [DOI] [PubMed] [Google Scholar]
- Oparin A. I.The Origin of Life; BernaI J. D., Ed.; Oxford University Press, London. 1924; pp 197–234, transl Synge A. 1967. [Google Scholar]
- Oparin A. I.The origin of life on the Earth; Longmans: Edinburgh, 1957; Chapter 6, transl Synge A.. [Google Scholar]
- Urey H. On the early chemical history of the Earth and the origin of life. Proc. Natl. Acad. Sci. U. S. A. 1952, 38, 351–363. 10.1073/pnas.38.4.351. [DOI] [PMC free article] [PubMed] [Google Scholar]
- Miller S. A production of amino acids under possible primitive Earth conditions. Science 1953, 117, 528–529. 10.1126/science.117.3046.528. [DOI] [PubMed] [Google Scholar]
- Rapf R. J.; Vaida V. Sunlight as an energetic driver in the synthesis of molecules necessary for life. Phys. Chem. Chem. Phys. 2016, 18, 20067–20084. 10.1039/C6CP00980H. [DOI] [PubMed] [Google Scholar]
- Ranjan S.; Sasselov D. D. Influence of the UV environment on the synthesis of prebiotic molecules. Astrobiology 2016, 16, 68–88. 10.1089/ast.2015.1359. [DOI] [PubMed] [Google Scholar]
- Sagan C.; Khare B. N. Long-wavelength ultraviolet photoproduction of amino acids on the primitive Earth. Science 1971, 173, 417–420. 10.1126/science.173.3995.417. [DOI] [PubMed] [Google Scholar]
- Sarker P. K.; Takahashi J. I.; Obayashi Y.; Kaneko T.; Kobayashi K. Photo-alteration of hydantoins against UV light and its relevance to prebiotic chemistry. Adv. Space Res. 2013, 51, 2235–2240. 10.1016/j.asr.2013.01.029. [DOI] [Google Scholar]
- Powner M.; Gerland B.; Sutherland J. D. Synthesis of activated pyrimidine ribonucleotides in prebiotically plausible conditions. Nature 2009, 459, 239–242. 10.1038/nature08013. [DOI] [PubMed] [Google Scholar]
- Matsunaga T.; Hieda K.; Nikaido O. Wavelength dependent formation of thymine dimers and (6–4) photoproducts in DNA by monochromatic ultraviolet light ranging from 150 to 365 nm. Photochem. Photobiol. 1991, 54, 403–410. 10.1111/j.1751-1097.1991.tb02034.x. [DOI] [PubMed] [Google Scholar]
- Zhou L.; Chung-Chang Y.; Ng C. Y.; Jackson W. M. Evidence for direct molecule oxygen production in CO2 photodissociation. Science 2014, 346, 61–64. 10.1126/science.1257156. [DOI] [PubMed] [Google Scholar]
- Hessen D. O.Solar radiation and the evolution of life. In Solar Radiation and Human Health; Bjertnees E., Ed.; The Norwegian Academy of Science and Letters, Oslo; 2008, pp 123–136. [Google Scholar]
- Grant C. M. Metabolic reconfiguration is a regulated response to oxidative stress. J. Biol. 2008, 7, 1. 10.1186/jbiol63. [DOI] [PMC free article] [PubMed] [Google Scholar]
- Jamieson D. J. Oxidative stress responses of the yeast Saccharomyces cerevisiae. Yeast 1998, 14, 1511–1527. . [DOI] [PubMed] [Google Scholar]
- Hashizume H.Role of clay minerals in chemical evolution and the origins of life. Clay minerals in Nature-their characterization, modification and application; InTechOpen, 2012; Chapter 10, 191–206. [Google Scholar]
- Bernal J. D.The Physical Basis of Life; Routledge and Kegan Paul, London, 1951; p 364. [Google Scholar]
- Cains-Smith A. G.Genetic Takeover; Cambridge University Press: Cambridge, 1982; p 133. [Google Scholar]
- Greenland D. J.; Laby R. H.; Quirk J. P. Adsorption of Amino-Acids and Peptides by Montmorillinite and Illite. Trans. Farad. Soc. 1965, 61, 2024–2035. 10.1039/TF9656102024. [DOI] [Google Scholar]
- Hedges J. I.; Hare P. E. Amino acid adsorption by clay minerals in distilled water. Geochim. Cosmochim. Acta 1987, 51, 255–259. 10.1016/0016-7037(87)90237-7. [DOI] [Google Scholar]
- Dashman T.; Stotzky G. Adsorption and binding of peptides on homoionic montmorillonite and kaolinite. Soil Biol. Biochem. 1984, 16, 51–55. 10.1016/0038-0717(84)90125-1. [DOI] [Google Scholar]
- Hashizume H.; van der Gaast S.; Theng B. K. G. Adsorption of adenine, cytosine, uracil, ribose, and phosphate by Mg-exchanged montmorillonite. Clay Miner 2010, 45, 469–475. 10.1180/claymin.2010.045.4.469. [DOI] [Google Scholar]
- Lowenstam H. A. Minerals formed by organisms. Science 1981, 211, 1126–1131. 10.1126/science.7008198. [DOI] [PubMed] [Google Scholar]
- Lowenstam H. A.; Margulis L. Evolutionary prerequisites for early Phanerozoic calcareous skeleton. Biosystems 1980, 12, 27–41. 10.1016/0303-2647(80)90036-2. [DOI] [PubMed] [Google Scholar]
- Cuéllar-Cruz M. Synthesis of inorganic and organic crystals mediated by proteins in different biological organisms. A mechanism of biomineralization conserved throughout evolution in all living species. Prog. Cryst. Growth Charact. Mater. 2017, 63, 94–103. 10.1016/j.pcrysgrow.2017.07.001. [DOI] [Google Scholar]
- Grassé P. P.Evolution of living organisms (Evidence for a new theory of transformation); Elsevier: New York, 1977. ISBN: 9780122955501. [Google Scholar]
- Cuéllar-Cruz M.; Moreno A. Synthesis of crystalline silica-carbonate biomorphs of Ba (II) under the presence of RNA and positively and negatively charged ITO electrodes: obtainment of graphite via bioreduction of CO2 and its implications to the chemical origin of life on primitive Earth. ACS Omega 2020, 5, 5460–5469. 10.1021/acsomega.0c00068. [DOI] [PMC free article] [PubMed] [Google Scholar]
- Cuéllar-Cruz M.; Islas S. R.; González G.; Moreno A. Influence of nucleic acids on the synthesis of crystalline Ca (II), Ba (II), and Sr (II) silica-carbonate biomorphs: Implications for the chemical origin of life on primitive Earth. Cryst. Growth Des. 2019, 19, 4667–4682. 10.1021/acs.cgd.9b00573. [DOI] [Google Scholar]
- Cuéllar-Cruz M.; Moreno A. The role of calcium and strontium as the most dominant elements during combinations of different alkaline Earth metals in the synthesis of crystalline silica-carbonate biomorphs. Crystals 2019, 9, 381. 10.3390/cryst9080381. [DOI] [Google Scholar]
- Cuéllar-Cruz M.; Scheneider D. K.; Stojanoff V.; Islas S. R.; Sánchez-Puig N.; Arreguín-Espinosa R.; Delgado J. M.; Moreno A. Formation of crystalline silica-carbonate biomorphs of alkaline Earth metals (Ca, Ba, Sr) from ambient to low temperatures: chemical implications during the primitive Earth́s life. Cryst. Growth Des. 2020, 20, 1186–1195. 10.1021/acs.cgd.9b01473. [DOI] [Google Scholar]
- Cuéllar-Cruz M. Influence of abiotic factors in the chemical origin of life: Biomorphs as a study model. ACS Omega 2021, 6, 8754–8763. 10.1021/acsomega.1c00497. [DOI] [PMC free article] [PubMed] [Google Scholar]
- Islas S. R.; Cuéllar-Cruz M. Silica-Carbonate of Ba(II) and Fe2+/Fe3+ complex as study models to understand prebiotic chemistry. ACS Omega 2021, 6, 35629–35640. 10.1021/acsomega.1c05415. [DOI] [PMC free article] [PubMed] [Google Scholar]
- Zhang G.; Morales J.; Garcia-Ruiz J. M. Growth behaviour of silica/carbonate nanocrystalline composites of calcite and aragonite. J. Mater. Chem. B 2017, 5, 1658–1663. 10.1039/C6TB02612E. [DOI] [PubMed] [Google Scholar]
- García-Ruiz J. M.; Hyde S. T.; Carnerup A. M.; Christy A. G.; Kranendonk V. M. J.; Welham N. J. Self-Assembled Silica-Carbons structures and detection of ancient microfossils. Science 2003, 302, 1194–1197. 10.1126/science.1090163. [DOI] [PubMed] [Google Scholar]
- Opel J.; Wimmer F. P.; Kellermeier M.; Colfen H. Functionalisation of silica-carbonate biomorphs. Nanoscale Horiz 2016, 1, 144–149. 10.1039/C5NH00094G. [DOI] [PubMed] [Google Scholar]
- Voinescu A. E.; Kellermeier M.; Carnerup A. M.; Larsson A. K.; Touraud D.; Hyde S. T.; Kunz W. Co-precipitation of silica and alkaline-earth carbonates using TEOS as silica source. J. Cryst. Growth 2007, 306, 152–158. 10.1016/j.jcrysgro.2007.03.060. [DOI] [Google Scholar]
- Rickwood D.; Hames B. D.. Gel electrophoresis of nucleic acids: A practical approach; Oxford University Press: New York, 1990; pp 65–66. [Google Scholar]
- Noorduin W. L.; Grinthal A.; Mahadevan L.; Aiznberg J. Rationally Designed Complex, Hierarchical Microarchitectures. Science 2013, 340, 832–837. 10.1126/science.1234621. [DOI] [PubMed] [Google Scholar]
- Brunk C. F.; Jones K. C.; James T. W. Assay for nanogram quantities of DNA in cellular homogenates. Anal. Biochem. 1979, 92, 497–500. 10.1016/0003-2697(79)90690-0. [DOI] [PubMed] [Google Scholar]
- Labarca C.; Paigen K. A simple, rapid, and sensitive DNA assay procedure. Anal. Biochem. 1980, 102, 344–352. 10.1016/0003-2697(80)90165-7. [DOI] [PubMed] [Google Scholar]
- Kapuscinki J.; Skoczylas B. Fluorescent complexes of DN with DAPI 4′,6-diamidine-2-phenyl indole.2HCl or DCI 4′,6-dicarboxyamide-2-phenyl indole. Nucleic Acids Res. 1978, 5, 3775–3800. 10.1093/nar/5.10.3775. [DOI] [PMC free article] [PubMed] [Google Scholar]
- Sethmann I.; Wörheide G. Structure and composition of calcareous sponge spicules: a review and comparison to structurally related biominerals. Micron 2008, 39, 209–228. 10.1016/j.micron.2007.01.006. [DOI] [PubMed] [Google Scholar]
- Liu R.; Huang S.; Zhang X.; Song Y.; He G.; Wang Z.; Lian B. Biomineralisation, characterization, and stability of calcium carbonate containing organic matter. RSC Adv. 2021, 11, 14415–14425. 10.1039/D1RA00615K. [DOI] [PMC free article] [PubMed] [Google Scholar]
- Cao C.; Jiang J.; Sun H.; Huang Y.; Tao F.; Lian B. Carbonate mineral formation under the influence of limestone-colonizing actinobacteria: morphology and polymorphism. Front. Microbiol. 2016, 7, 366. 10.3389/fmicb.2016.00366. [DOI] [PMC free article] [PubMed] [Google Scholar]
- Lian B.; Hu Q.; Chen J.; Ji J.; Teng H. H. Carbonate biomineralization induced by soil bacterium Bacillus megaterium. Geochim. Cosmochim. Acta 2006, 70, 5522–5535. 10.1016/j.gca.2006.08.044. [DOI] [Google Scholar]
- Dominguez D. C. Calcium signaling in bacteria. Mol. Microbiol. 2004, 54, 291–297. 10.1111/j.1365-2958.2004.04276.x. [DOI] [PubMed] [Google Scholar]
- Gangola P.; Rosen B. P. Maintenance of intracellular calcium in Escherichia coli. J. Biol. Chem. 1987, 262, 12570–12574. 10.1016/S0021-9258(18)45243-X. [DOI] [PubMed] [Google Scholar]
- Futsaether C. M.; Johnsson A. Using fura-2 to measure intracellular free calcium in Propionibacterium acnes. Can. J. Microbiol. 1994, 40, 439–445. 10.1139/m94-072. [DOI] [PubMed] [Google Scholar]
- Herbaud M. L.; Guiseppi A.; Denizot F.; Haiech J.; Kilhoffer M. C. Calcium signalling in Bacillus subtilis. Biochim. Biophys. Acta 1998, 1448, 212–226. 10.1016/S0167-4889(98)00145-1. [DOI] [PubMed] [Google Scholar]
- Jones H. E.; Holland I. B.; Baker H. L.; Campbell A. K. Slow changes in cytosolic free Ca2+ in Escherichia coli highlight two putative influx mechanisms in response to changes in extracellular calcium. Cell Calcium 1999, 25, 265–274. 10.1054/ceca.1999.0028. [DOI] [PubMed] [Google Scholar]
- Knight M. R.; Campbell A. K.; Smith S. M.; Trewavas A. J. Recombinant aequorin as a probe for cytosolic free Ca2+ in Escherichia coli. FEBS Lett. 1991, 282, 405–408. 10.1016/0014-5793(91)80524-7. [DOI] [PubMed] [Google Scholar]
- Torrecilla I.; Leganes F.; Bonilla I.; Fernandez-Pinas F. Use of recombinant aequorin to study calcium homeostasis and monitor calcium transients in response to heat and cold shock in cyanobacteria. Plant Physiol 2000, 123, 161–176. 10.1104/pp.123.1.161. [DOI] [PMC free article] [PubMed] [Google Scholar]
- Dominguez D. C., Calcium signaling in prokaryotes. In Calcium and signal trasnduction; Buchholz J. N., Behringer E. J., Eds.; IntechOpen, 2018. DOI: 10.5772/intechopen.74489. [DOI] [Google Scholar]
- Norris V.; Grant S.; Freestone P.; Canvin J.; Sheikh F. N.; Toth I.; Trinei M.; Modha K.; Norman R. Calcium signalling in bacteria. J. Bacteriol. Res. 1996, 178, 3677–3682. 10.1128/jb.178.13.3677-3682.1996. [DOI] [PMC free article] [PubMed] [Google Scholar]
- Lange M.; Peiter E. Calcium transport proteins: The phylogenetic diversity of their relevance for growth, virulence, and stress resistence. Front. Microbiol. 2020, 10, 1–14. 10.3389/fmicb.2019.03100. [DOI] [PMC free article] [PubMed] [Google Scholar]
- Tamuli R.; Kumar R.; Srivastava D. A.; Deka R.. Calcium signaling. In Neurospora: Genomics and Molecular Biology; Kasbekar D. P., McCluskey K., Eds.; Academic Press, 2013; pp 209–226. [Google Scholar]
- Miseta A.; Fu L.; Kellermayer R.; Buckley J.; Bedwell D. M. The Golgi Apparatus plays a significant role in the maintenance of Ca2+ homeostasis in the vps33Δ vacuolar biogenesis mutant of Saccharomyces cerevisiae. J. Biol. Chem. 1999, 274, 5939–5947. 10.1074/jbc.274.9.5939. [DOI] [PubMed] [Google Scholar]
- Li G.; Fu W.; Deng Y.; Zhao Y. Role of calcium/calcineurin signalling in regulating intracelular reactive oxygen species homeostasis in Saccharomyces cerevisiae. Genes 2021, 12, 1311. 10.3390/genes12091311. [DOI] [PMC free article] [PubMed] [Google Scholar]
- Cui J.; Kaandorp J. A.; Ositelu O. O.; Beaudry V.; Knight A.; Nanfack Y. F.; Cunningham K. W. Simulating calcium influx and free calcium concentrations in yeast. Cell calcium 2009, 45, 123–132. 10.1016/j.ceca.2008.07.005. [DOI] [PMC free article] [PubMed] [Google Scholar]
- Bonilla M.; Cunningham K. W. Mitogen-activated Protein kinase stimulation of Ca2+ signaling is required for survival of endoplasmic reticulum stress in yeast. Mol. Biol. Cell 2003, 14, 4296–4305. 10.1091/mbc.e03-02-0113. [DOI] [PMC free article] [PubMed] [Google Scholar]
- Bonilla M.; Nastase K. K.; Cunningham K. W. Essential role of calcineurin in response to endoplasmic reticulum stress. EMBO J. 2002, 21, 2343–2353. 10.1093/emboj/21.10.2343. [DOI] [PMC free article] [PubMed] [Google Scholar]
- Iida H.; Yagawa Y.; Anraku Y. Essential role for induced Ca2+ influx followed by [Ca2+]i rise in maintaining viability of yeast cells late in the mating pheromone response pathway. J. Biol. Chem. 1990, 265, 13391–13399. 10.1016/S0021-9258(19)38311-5. [DOI] [PubMed] [Google Scholar]
- Putney J. W., Jr., Ed. Calcium Signaling, 2nd ed.; CRC Press: Boca Raton, 2005. [Google Scholar]
- Lee B. D.; Apel W. A.; Walton M. R. Calcium carbonate formation by Synechococcus sp. strain PCC 8806 and Synechococcus sp. strain PCC 8807. Bioresour. Technol. 2006, 97, 2427–2434. 10.1016/j.biortech.2005.09.028. [DOI] [PubMed] [Google Scholar]
- Ramanan R.; Kannan K.; Deshkar A.; Yadav R.; Chakrabarti T. Enhanced algal CO2 sequestration through calcite deposition by Chlorella sp. and Spirulina platensis in a mini-raceway pond. Bioresour. Technol. 2010, 101, 2616–2622. 10.1016/j.biortech.2009.10.061. [DOI] [PubMed] [Google Scholar]
- Hou W.; Lian B.; Zhang X. CO2 mineralization induced by fungal nitrate assimilation. Bioresour. Technol. 2011, 102, 1562–1566. 10.1016/j.biortech.2010.08.080. [DOI] [PubMed] [Google Scholar]
- Masaphy S.; Zabari L.; Pastrana J.; Dultz S. Role of fungal mycelium in the formation of carbonate concretions in growing media—an investigation by SEM and synchrotron-based X-ray tomographic microscopy. Geomicrobiol. J. 2009, 26, 442–450. 10.1080/01490450903060798. [DOI] [Google Scholar]
- Mitchell A. C.; Ferris F. G. The influence of Bacillus pasteurii on the nucleation and growth of calcium carbonate. Geomicrobiol. J. 2006, 23, 213–226. 10.1080/01490450600724233. [DOI] [Google Scholar]
- Thor K. Calcium-Nutrient and Messenger. Front. Plant Sci. 2019, 10, 440. 10.3389/fpls.2019.00440. [DOI] [PMC free article] [PubMed] [Google Scholar]
- Michard E.; Lima P. T.; Borges F.; Silva A. C.; Portes M. T.; Carvalho J. E.; Gilliham M.; Liu L. H.; Obermeyer G. Glutamate receptor–like genes form Ca2+ channels in pollen tubes and are regulated by pistil D-serine. Science 2011, 332, 434–437. 10.1126/science.1201101. [DOI] [PubMed] [Google Scholar]
- Monshausen G. B.; Miller N. D.; Murphy A. S.; Gilroy S. Dynamics of auxin-dependent Ca2+ and pH signaling in root growth revealed by integrating high-resolution imaging with automated computer vision-based analysis. Plant J. 2011, 65, 309–318. 10.1111/j.1365-313X.2010.04423.x. [DOI] [PubMed] [Google Scholar]
- Ortiz-Ramírez C.; Michard E.; Simon A. A.; Damineli D. S.; Hernández-Coronado M.; Becker J. D.; Feijó J. A. Glutamate receptor-like channels are essential for chemotaxis and reproduction in mosses. Nature 2017, 549, 91–95. 10.1038/nature23478. [DOI] [PubMed] [Google Scholar]
- Duan S.; Zhang C.; Song S.; Ma C.; Zhang C.; Xu W.; Bondada B.; Wang L.; Wang S. Understanding calcium functionality by examining growth characteristics and structural aspects in calcium-deficient grapevine. Sci. Rep 2022, 12, 3233. 10.1038/s41598-022-06867-4. [DOI] [PMC free article] [PubMed] [Google Scholar]
- Knight M. R.; Knight H.; Watkins N. J. Calcium and the generation of plant form. Philos. Trans R. Soc. London B Biol. Sci. 1995, 350, 83–86. 10.1098/rstb.1995.0141. [DOI] [PubMed] [Google Scholar]
- Marschner H.Mineral nutrition of higher plants; Academic Press: San Diego, 1995. [Google Scholar]
- Hepler P. K. Calcium: a central regulator of plant growth and development. Plant Cell 2005, 17, 2142–2155. 10.1105/tpc.105.032508. [DOI] [PMC free article] [PubMed] [Google Scholar]
- Beto J. A. The role of calcium in human aging. Clin. Nutr. Res. 2015, 4, 1–8. 10.7762/cnr.2015.4.1.1. [DOI] [PMC free article] [PubMed] [Google Scholar]
- Pu F.; Chen N.; Xue S. Calcium intake, calcium homeostasis and health. Food Sci. Hum. Wellness 2016, 5, 8–16. 10.1016/j.fshw.2016.01.001. [DOI] [Google Scholar]
- Zhou Y.; Xue S.; Yang J. J. Calciomics: integrative studies of Ca2+-binding proteins and their interactomes in biological systems. Metallomics 2013, 5, 29–42. 10.1039/C2MT20009K. [DOI] [PMC free article] [PubMed] [Google Scholar]
- Chen Y.; Naik S. G.; Krzystek J.; Shin S.; Nelson W. H.; Xue S.; Yang J. J.; Davidson V. L.; Liu A. Role of calcium in metalloenzymes: effects of calcium removal on the axial ligation geometry and magnetic properties of the catalytic diheme center in MauG. Biochemistry 2012, 51, 1586–1597. 10.1021/bi201575f. [DOI] [PMC free article] [PubMed] [Google Scholar]
- Zhao K.; Wang X.; Wong H. C.; Wohlhueter R.; Kirberger M. P.; Chen G.; Yang J. J. Predicting Ca2+-binding sites using refined carbon clusters. Proteins 2012, 80, 2666–2679. 10.1002/prot.24149. [DOI] [PMC free article] [PubMed] [Google Scholar]
- Blanco A.; D’Elia M.; Licchelli D.; Orofino V.; Fonti S. Studies of biominerals relevant to the search for life on Mars. Orig. Life Evol. Biosph. 2007, 36, 621–622. 10.1007/s11084-006-9045-2. [DOI] [PubMed] [Google Scholar]
- Edwards H. G. Raman spectroscopic protocol for the molecular recognition of key biomarkers in astrobiological exploration. Orig. Life Evol. Biosph. 2004, 34, 3–11. 10.1023/B:ORIG.0000009824.38510.9a. [DOI] [PubMed] [Google Scholar]
- D’Elia M.; Blanco A.; Galiano A.; Orofino V.; Fonti S.; Mancarella F.; Guido A.; Russo F.; Mastandrea A. SEM morphological studies of carbonates and the search for ancient life on Mars. Int. J. Astrobiol. 2017, 16, 137–142. 10.1017/S147355041600015X. [DOI] [Google Scholar]
- Blanco A.; Orofino V.; D’Elia M.; Fonti S.; Mastandrea A.; Guido A.; Russo F. Infrared spectroscopy of microbially induced carbonates and past life on Mars. Icarus 2013, 226, 119–126. 10.1016/j.icarus.2013.05.016. [DOI] [Google Scholar]
- Schwartz D. E.; Mancinelli R. L.; Kaneshiro E. S. The use of mineral crystals as bio-markers in the search for life on Mars. Adv. Space Res. 1992, 12, 117–119. 10.1016/0273-1177(92)90164-S. [DOI] [PubMed] [Google Scholar]
- Vagenas N. V.; Gatsouli A.; Kontoyannis C. G. Quantitative analysis of synthetic calcium carbonate polymorphs using FT-IR spectroscopy. Talanta 2003, 59, 831–836. 10.1016/S0039-9140(02)00638-0. [DOI] [PubMed] [Google Scholar]
- Agarwal P.; Berglund K. A. In situ monitoring of calcium carbonate polymorphs during batch crystallization in the presence of polymeric additives using Raman spectroscopy. Cryst. Growth Des. 2003, 3, 941–946. 10.1021/cg0256125. [DOI] [Google Scholar]
- Strauss H.; Moore T. B.. Abundances and isotopic compositions of carbon and sulfur species in whole rock and kerogen samples. In The Proterozoic Biosphere, A Multidisciplinary Study; Schopf J. W., Klein C., Eds.; Cambridge University Press: New York, 1992; pp 709–798. [Google Scholar]
- Marshall A. M.; Emry J. R.; Marshall C. P. Multiple generations of carbon in the Apex Chert and implications for preservation of microfossils. Astrobiology 2012, 12, 160–166. 10.1089/ast.2011.0729. [DOI] [PMC free article] [PubMed] [Google Scholar]
- Ganz H. H.; Kalkreuth W. IR classification of kerogen type, thermal maturation, hydrocarbon potential and lithological characteristics. J. Southeast Asian Earth Sci. 1991, 5, 19–28. 10.1016/0743-9547(91)90007-K. [DOI] [Google Scholar]
- Mann K., The calcified eggshell matrix proteome of a songbird, the zebra finch (Taeniopygia guttata). Proteome Sci.. 2015, 13. 10.1186/s12953-015-0086-1 [DOI] [PMC free article] [PubMed] [Google Scholar]
- Ruiz- Arellano R. R.; Moreno A. Obtainment of spherical-shaped calcite crystals induced by intramineral proteins isolated from eggshells of ostrich and emu. Cryst. Growth Des. 2014, 14, 5137–5143. 10.1021/cg5008389. [DOI] [Google Scholar]
- Ruiz-Arellano R. R.; Medrano F. J.; Moreno A.; Romero A. Crystal Structure of Struthiocalcin-1, an Intramineral Protein from Struthio camelus Eggshell, in two crystal forms. Acta Crystallogr. 2015, 809–818. 10.1107/S139900471500125X. [DOI] [PubMed] [Google Scholar]
- Reyes-Grajeda J. P.; Moreno A.; Romero A. Crystal structure of ovocleidin-17, a major protein of the calcified Gallus gallus eggshell: implications in the calcite mineral growth pattern. J. Biol. Chem. 2004, 279, 40876–40881. 10.1074/jbc.M406033200. [DOI] [PubMed] [Google Scholar]
- Colfen H. Biomineralization: a crystal-clear view. Nat. Mater. 2010, 9, 960–961. 10.1038/nmat2911. [DOI] [PubMed] [Google Scholar]
- Marin F.; Luquet G.; Marie B.; Medakovic D. Molluscan shell proteins: primary structure, origin, and evolution. Curr. Top. Dev. Biol. 2007, 80, 209–276. 10.1016/S0070-2153(07)80006-8. [DOI] [PubMed] [Google Scholar]
- Xiang L.; Su J.; Zheng G.; Liang J.; Zhang G.; Wang H.; Xie L.; Zhang R. Patterns of expression in the matrix proteins responsible for nucleation and growth of aragonite crystals in flat pearls of Pinctada fucata. PLoS One 2013, 8, e66564 10.1371/journal.pone.0066564. [DOI] [PMC free article] [PubMed] [Google Scholar]
- Melero-García E.; Santisteban-Bailón R.; García-Ruiz J. M. Role of bulk pH during witherite biomorph growth in silica gels. Cryst. Growth Des. 2009, 9, 4730–4734. 10.1021/cg9005967. [DOI] [Google Scholar]
- García-Ruiz J. M.; Melero-García E.; Hyde S. T. Morphogenesis of self-assembled nanocrystalline materials of barium carbonate and silica. Science 2009, 323, 362–365. 10.1126/science.1165349. [DOI] [PubMed] [Google Scholar]
- García-Ruiz J. M.; Nakouzi E.; Kotopoulou E.; Tamborrino L.; Steinbock O. Biomimetic mineral self-organization from silica-rich spring waters. Sci. Adv. 2017, 3, e1602285 10.1126/sciadv.1602285. [DOI] [PMC free article] [PubMed] [Google Scholar]
- Blueford J. R.; Gonzales J. J.; Scoy K. V. Comparing radiolarian and diatom diversity and abundance from the northeast Pacific. Mar. Micropaleontol. 1990, 15, 219–232. 10.1016/0377-8398(90)90012-B. [DOI] [Google Scholar]
- Bandy O. L. Distribution of foraminifera, radiolarian and diatoms in sediments of the Gulf of California. Micropaleontology 1961, 7, 1–26. 10.2307/1484140. [DOI] [Google Scholar]
- Zhang L.; Suzuki N.; Nakamura Y.; Tuji A. Modern shallow water radiolarians with photosynthetic microbiota in the western North Pacific. Mar. Micropaleontol. 2018, 139, 1–27. 10.1016/j.marmicro.2017.10.007. [DOI] [Google Scholar]
- Terada T.; Yamabi S.; Imai H. Formation process of sheets and helical forms consisting of strontium carbonate fibrous crystals with silicate. J. Cryst. Growth 2003, 253, 435–444. 10.1016/S0022-0248(03)01008-X. [DOI] [Google Scholar]
- Veizer J.; Ala D.; Azmy K.; Bruckschen P.; Buhl D.; Bruhn F.; Carden G. A. F.; Diener A.; Ebneth S.; Godderis Y.; Jasper T.; Korte C.; Pawellek F.; Podlaha O. G.; Strauss H. 87Sr/86Sr, δ13C and δ18O evolution of Phanerozoic seawater. Chem. Geol. 1999, 161, 1–3. 10.1016/S0009-2541(99)00081-9. [DOI] [Google Scholar]
- Templeton W. L.; Brown V. M. The Relationship between the cConcentrations of calcium, strontium and strontium-90 in wild brown trout, Salmo-Trutta L and the concentrations of the stable elements in some waters of the United-Kingdom, and the implications in radiological health studies. Air Water Pollut 1964, 8, 49–75. [Google Scholar]
- Lin C. C.; Liu L. G. High-pressure Raman spectroscopic study of post-aragonite phase transition in witherite (BaCO3). Eur. J. Mineral. 1997, 9, 785–792. 10.1127/ejm/9/4/0785. [DOI] [Google Scholar]
- Buzgar N.; Apopei A. I. The Raman study of certain carbonates. Geologie 2009, 97–112. [Google Scholar]
- Stringer C. The origin and evolution of Homo sapiens. Philos. Trans R. Soc. London B Biol. Sci. 2016, 371, 20150237. 10.1098/rstb.2015.0237. [DOI] [PMC free article] [PubMed] [Google Scholar]
- Silvestro D.; Bacon C. D.; Ding W.; Zhang Q.; Donoghue P. C. J.; Antonelli A.; Xing Y. Fossil data support a pre-Cretaceous origin of flowering plants. Nat. Ecol. Evol. 2021, 5, 449–457. 10.1038/s41559-020-01387-8. [DOI] [PubMed] [Google Scholar]
- Bowen H. J. M. Strontium and Barium in Sea water and marine organisms. J. Mar. Biol. Assoc. U.K. 1956, 35, 451–460. 10.1017/S0025315400010298. [DOI] [Google Scholar]
- Krischnamurti K.; Mirza W. F. Relation between solubility and absorption spectra of sparingly soluble salts. Naturwissenschaften 1960, 47, 493–494. 10.1007/BF00631050. [DOI] [Google Scholar]
- Niedermeier M.; Gierlinger N.; Lutz-Meindl U. Biomineralization of strontium and barium contributes to detoxification in the freshwater alga Micrasterias. J. Plant. Physiol. 2018, 230, 80–91. 10.1016/j.jplph.2018.08.008. [DOI] [PubMed] [Google Scholar]
- Isermann K.; Glatzle A. Discrimination of calcium against strontium in plants with a cryptating Agent. Naturwissenschaften 1975, 62, 238–239. 10.1007/BF00603175. [DOI] [Google Scholar]
- Beauquis J.; Vinuesa A.; Pomilio C.; Pavia P.; Saravia F. Hippocampal and cognitive alterations precede amyloid deposition in a mouse model for Alzheimer’s disease. Medicina (B Aires) 2014, 74, 282–286. [PubMed] [Google Scholar]
- Frasconi P.; Silvestri L.; Soda P.; Cortini R.; Pavone F. S.; Iannello G. Large-scale automated identification of mouse brain cells in confocal light sheet microscopy images. Bioinformatics 2014, 30, i587–i593. 10.1093/bioinformatics/btu469. [DOI] [PMC free article] [PubMed] [Google Scholar]
- Wächtershäuser G. From volcanic origins of chemoautotrophic life to Bacteria, Archaea and Eukarya. Philos. Trans. R. Soc., B 2006, 361, 1787–1808. 10.1098/rstb.2006.1904. [DOI] [PMC free article] [PubMed] [Google Scholar]
- Brunk C. F.; Marshall C. R. Whole organism, systems biology, and top-down criteria for evaluating scenarios for the origin of life. Life 2021, 11, 690. 10.3390/life11070690. [DOI] [PMC free article] [PubMed] [Google Scholar]
- Knoll A.; Bambach R. Directionality in the history of life: Diffusion from the left wall or repeated scaling of the right?. Paleontolog. Soc. 2000, 26, 1–14. [Google Scholar]
- Bekker A.; Holland H. D.; Wang P. L.; Rumble D.; Stein H. J.; Hannah J. L.; Coetzee L. L.; Beukes N. J. Dating the rise of atmospheric oxygen. Nature 2004, 427, 117–120. 10.1038/nature02260. [DOI] [PubMed] [Google Scholar]
- Martin W.; Baross J.; Kelley D.; Russell M. J. Hydrothermal vents and the origin of life. Nat. Rev. Microbiol. 2008, 6, 805–814. 10.1038/nrmicro1991. [DOI] [PubMed] [Google Scholar]
- Hazen R. M.; Filley T. R.; Goodfriend G. A. Selective adsorption of L- and D-amino acids on calcite: Implications for biochemical homochirality. Proc. Natl. Acad. Sci. U.S.A. 2001, 98, 5487–5490. 10.1073/pnas.101085998. [DOI] [PMC free article] [PubMed] [Google Scholar]
- Mendoza-Torres E.; Cruz-Cataneda J.; Negron-Mendoza A.; Heredia A. Computer and Experimental Simulation of Alloxazine Synthesis from Gamma Irradiation of Amino Acids on Iceland Spar: A Prebiotic Chemistry Perspective. J. Mol. Evol. 2020, 88, 284–291. 10.1007/s00239-020-09933-5. [DOI] [PubMed] [Google Scholar]
- Schrenk M. O.; Brazelton W. J.; Lang S. Q. Serpentinization, carbon, and deep life. Rev. Mineral. Geochem. 2013, 75, 575–606. 10.2138/rmg.2013.75.18. [DOI] [Google Scholar]
- Sojo V.; Herschy B.; Whicher A.; Camprubi E.; Lane N. The origin of life in alkaline hydrothermal vents. Astrobiology 2016, 16, 181–197. 10.1089/ast.2015.1406. [DOI] [PubMed] [Google Scholar]
- Russell M. J.; Hall A. J.; Martin W. Serpentinization as a source of energy at the origin of life. Geobiology 2010, 8, 355–371. 10.1111/j.1472-4669.2010.00249.x. [DOI] [PubMed] [Google Scholar]
- Russell M. J.; Ponce A. Six ‘Must-Have’ Minerals for Life’s Emergence: Fougerite and Mackinawite. Life 2020, 10, 291. 10.3390/life10110291. [DOI] [PMC free article] [PubMed] [Google Scholar]
- Madrigal-Trejo D.; Villanueva-Barragán P. S.; Zamudio-Ramírez R.; Cervantes-de la Cruz K. E.; Mejía-Luna I.; Chacón-Baca E.; Negrón-Mendoza A.; Ramos-Bernal S.; Heredia-Barbero A. Histidine Self-assembly and Stability on Mineral Surfaces as a Model of Prebiotic Chemical Evolution: An Experimental and Computational Approach. Orig. Life Evol. Biosph. 2021, 51, 117–130. 10.1007/s11084-021-09606-3. [DOI] [PubMed] [Google Scholar]
- Pérez-Aguilar C. D.; Cuéllar-Cruz M. The formation of crystalline minerals and their role in the origin of life on Earth. Prog. Cryst. Growth Charact. Mater. 2022, 68, 100558. 10.1016/j.pcrysgrow.2022.100558. [DOI] [Google Scholar]
- Addadi L.; Weiner S. Biomineralization: mineral formation by organisms. Phys. Scr. 2014, 89, 098003. 10.1088/0031-8949/89/9/098003. [DOI] [Google Scholar]
- McCollom T. M.; Seewald J. S. Experimental constraints on the hydrothermal reactivity of organic acids and acid anions: I. Formic acid and formate. Geochim. Cosmochim. Acta 2003, 67, 3625–364. 10.1016/S0016-7037(03)00136-4. [DOI] [Google Scholar]
Associated Data
This section collects any data citations, data availability statements, or supplementary materials included in this article.