Abstract
Patients with newly diagnosed acute promyelocytic leukemia (APL) are often obese or overweight, accompanied by metabolic disorders, such as dyslipidemia. However, the link between dyslipidemia and leukemia is obscure. Here, we conducted a retrospective study containing 1,412 cases (319 newly diagnosed APL patients, 393 newly diagnosed non-APL acute mye-loid leukemia patients, and 700 non-tumor controls) and found that APL patients had higher triglyceride levels than non-APL and control groups. Using clinical data, we revealed that hypertriglyceridemia served as a risk factor for early death in APL patients, and there was a positive correlation between triglyceride levels and leukocyte counts. RNA sequencing analysis of APL patients having high or normal triglyceride levels highlighted the contribution of peroxisome proliferator-activated receptor-α (PPARα), a crucial regulator of cell metabolism and a transcription factor involved in cancer development. The genome-wide chromatin occupancy of PPARα revealed that PPARα co-existed with PML/RARα within the super-enhancer regions to promote cell proliferation. PPARα knockdown affected the expression of target genes responsible for APL proliferation, including FLT3, and functionally inhibited the proliferation of APL cells. Moreover, in vivo results in mice having high fat diet-induced high triglyceride levels supported the connection between high triglyceride levels and the leukemic burden, as well as the involvement of PPARα-mediated-FLT3 activation in the proliferation of APL cells. Our findings shed light on the association between APL proliferation and high triglyceride levels and provide a genetic link to PPARα-mediated hyperlipidemia in APL.
Introduction
Clinical epidemiological studies have demonstrated that being overweight or obese is a risk factor for developing cancers, including leukemia.1 Cohort studies further provide evidence that patients with acute promyelocytic leukemia (APL), a subtype of acute myeloid leukemia (AML), are more obese than patients with other subtypes of AML.2-4 Dyslipidemia, resulting from abnormal lipid and fatty acid metabolism, is an essential link between obesity and certain types of malignancies.5-7 Numerous studies have demonstrated that lipids act as messengers for tumor growth signal transmission.8,9 Different compositions of lipids, including triglycerides and cholesterol, have varied cancer type-specific effects on cancer development. For instance, a higher high-density lipoprotein (HDL-C) level is associated with a higher risk of breast cancer.10 Higher serum triglycerides are significantly correlated with an increased prevalence of colorectal ade-nomas,11 and cholesterol esters are growth regulators of lymphocytic leukemia cells.12 The lipid status of APL patients has not been fully elucidated, and the mechanisms underlying the effects of dyslipidemia on APL development need to be investigated in detail. Obesity-associated microenvironmental alterations, such as dyslipidemia, have emerged as potential cooperating events, along with genetic and epigenetic variations promoting and sustaining leukemogenesis. The initiating factor of APL, the oncogenic fusion protein promyelocytic leukemia/retinoic acid receptor-α (PML/RARα) generated by the (15;17) translocation, is indispensable but insufficient for disease development.13,14 Genetically, an internal tandem duplication (ITD) of the fms-like tyrosine kinase 3 (FLT3) gene, FLT3-ITD, is prevalent in APL and is associated with high white blood cell (WBC) counts.15 Indeed, FLT3-ITD overexpression in murine bone marrow cells accelerates the APL transformation in a mouse model, providing direct support for the cooperating effects of FLT3-ITD in APL development.16 However, obesity-driven cooperating events remain under-explored, and the role of dyslipidemia in the pathogenesis of APL is still unclear. Peroxisome proliferator-activated receptor-α (PPARα), a nuclear receptor superfamily member, participates in multiple physiological and pathological processes. Extensive studies have shown the regulatory role of PPARα in various cancer cells, in addition to the canonical effect on lipid metabolism in liver cells.17 For instance, the activation of PPARα in breast cancer cells promotes proliferation.18 In cholangiocarcinoma, PPARα activation, induced by an alteration in bile acid metabolism, has a tumorigenic effect through ERK activation.19 These studies indicate the role of PPARα in cancer development. Here, we investigated the association between dyslipidemia and APL. The results showed that APL patients had higher triglyceride levels than non-APL AML and non-tumor controls. Mechanistic studies demonstrated that PPARα co-existed with PML/RARα within the super-enhancer regions, and PPARα-mediated-FLT3 activation interfered with the proliferation of APL cells.
Methods
Patient data collection
The study was approved by the Ethics Review Committee of Ruijin Hospital affiliated to Shanghai Jiao Tong University School of Medicine. We collected patient medical records from July 2012 to September 2019, including 319 newly diagnosed APL patients, 393 newly diagnosed non-APL AML patients, and 700 non-tumor controls between 18 and 75 years of age (at hospital admission). Body mass index (BMI), which is calculated as weight (kg)/height (m)2, greater than or equal to 25, is defined as overweight. Cases with underlying diseases that affect BMI or blood lipids, including diabetes, hypertension, coronary heart diseases, and hyperlipidemia, were excluded from the analysis. Non-tumor controls were from patients in departments other than the Department of Hematology, including Traumatology, Gynecology, Dermatology, Breast surgery, Otolaryngology, and Orthopedics.
Cell culture
NB4 and HEK-293T cells were authenticated before experiments. Detailed information can be found in the Online Supplementary Appendix.
Knockdown experiments, quatitative ploymerase chain reaction, RNA sequencing, Cleavage Under Targets and Tagmentation (CUT&Tag) sequencing, and functional experiments
Primers used for referred experimental assays are listed in the Online Supplementary Table S4, and details are available in the Online Supplementary Appendix. ìCUT&Tag was supported by Jiayin Biotechnology Ltd.
Mouse studies
The mouse experiments were conducted following the institutional animal protocols provided by the Institutional Animal Care and Use Committee of Ruijin Hospital affiliated to Shanghai Jiao Tong University School of Medicine. Details are available in the Online Supplementary Appendix.
Bioinformatics and statistical analysis
Bioinformatics and statistical analysis are detailed in the Online Supplementary Appendix.
Data availability
The datasets are available in NCBI's GEO with the access numbers GSE195776 (CUT&Tag) and GSE195777 (RNA sequencing).
Results
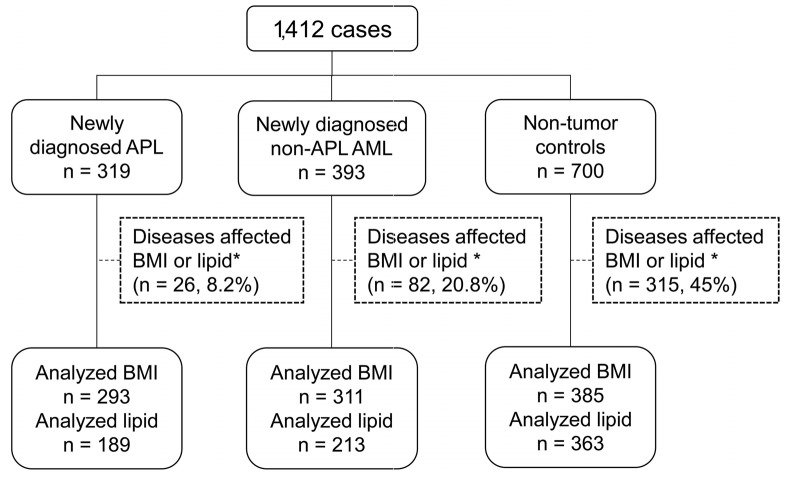
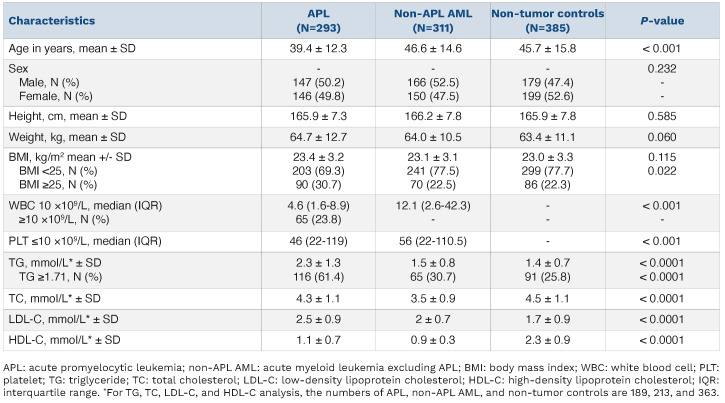
Acute promyelocytic leukemia patients had a higher overweight prevalence and a higher triglyceride tendency. We first retrospectively analyzed the demographics and clinicopathological data of 1,412 adult cases, including 319 newly diagnosed APL patients, 393 newly diagnosed non-APL AML patients, and 700 non-tumor controls (Figure 1). There were 26, 82, and 315 patients excluded from the APL, non-APL AML, and non-tumor control categories, respectively, owing to diabetes, hypertension, and coronary heart disease. Among the remaining cases, BMI was calculated for 293, 311, and 385 patients, and blood lipids were tested for 189, 213, and 363 patients in the three groups, respectively. The baseline characteristics of patients are provided in Table 1, and the dispositions of patients are illustrated in Figure 1. The APL patients were younger (mean age 39.0 years) than the non-APL AML patients (mean age 46.6 years), consistent with the epidemi-ological observation that the APL incidence is constant over the lifespan, whereas other AML-subtype incidences increase with age.20
Figure 1.
Flow chart showing the inclusions and exclusions of the primary data set. *For the body mass index (BMI) analysis, cases with underlying diseases that may affect BMI or lipid, e.g., diabetes, hypertension, coronary heart disease, and hyperlipidemia, were excluded.
Table 1.
Baseline characteristics of the study participants.
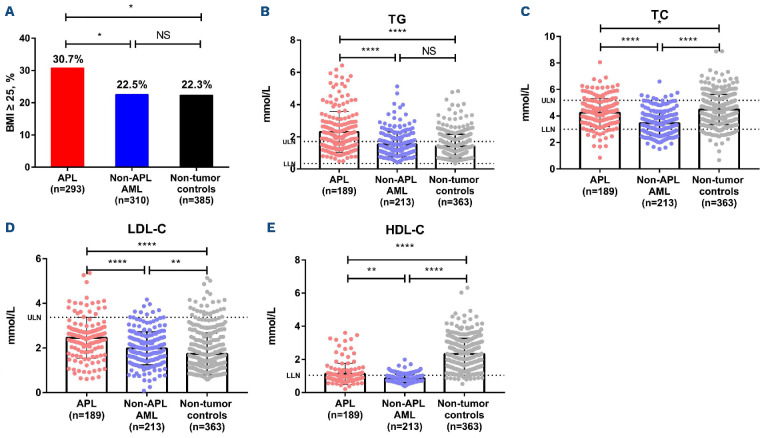
First, in order to investigate the associations between obesity and leukemia, we used BMI to divide the three groups, i.e., APL, non-APL AML, and non-tumor controls, into two categories: underweight/normal weight (BMI <25.0 kg/m2) and overweight/obese (BMI ≥25.0 kg/m2). As shown in Figure 2A, the proportion of overweight patients in the APL group (30.7%) was significantly higher than that in non-tumor control (22.3%, P<0.05) and non-AML APL groups (22.5%, P<0.05). The data suggested that APL patients had a higher overweight prevalence. Second, we analyzed the blood lipids of the patients mentioned above. As shown in Figure 2B, the triglyceride levels of APL patients were 2.3 mmol/L, which were significantly higher than those of non-APL AML patients (1.5 mmol/L, P<0.0001) and non-tumor controls (1.4 mmol/L, P<0.0001). In the APL group, 61.4% (116/189) patients had triglycerides greater or equal to the normal value (1.71 mmol/L), which was significantly higher than that in AML (30.7%, 65/213) and control (25.8%, 91/363) groups, respectively (P<0.0001). There was no difference in triglyceride levels between the control and non-APL AML groups. The APL group had a higher total cholesterol level (4.3 mmol/L) than the non-APL AML group (3.5 mmol/L, P<0.0001) (Figure 2C), but it was less than the reference value of 5.18 mmol/L. For the low-density lipoprotein cholesterol (LDL-C), the APL group’s level (2.5 mmol/L) was higher than those of non-APL AML (2.0 mmol/L) and control groups (1.7 mmol/L) (both P<0.0001; Figure 2D). The APL group had a lower high-density lipoprotein cholesterol (HDL-C) level (1.1 mmol/L) than the control group (2.3 mmol/L, P<0.0001; Figure 2E). Thus, the data showed that APL patients had a higher overweight prevalence and a higher triglyceride tendency.
The triglyceride level was positively associated with white blood cells counts and was a risk factor for early death in acute promyelocytic leukemia patients.
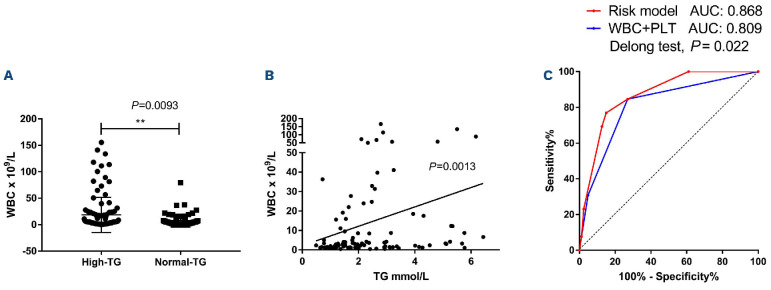
Despite the advances in APL treatment due to the introduction of all-trans retinoic acid (ATRA) and arsenic tri-oxide,21,22 the rate of early death, defined as death within 30 days from diagnosis, remains high.23 There were 13 early-death patients in our cohort, among which 11 died of intracranial hemorrhage, one died of respiratory failure, and one died of differentiation syndrome. APL with high triglycerides had a higher incidence of early death than APL with normal triglycerides (10.3% vs. 1.4%). High WBC count is an independent predictor of early death in APL.24 APL patients having higher triglyceride levels were observed to have higher WBC counts at diagnosis compared with patients having normal triglyceride levels (Figure 3A). Additionally, we explored the relationship between triglyc-erides and WBC using a linear regression analysis. As shown in Figure 3B, there was a positive correlation between triglycerides and WBC. These data indicated that a high triglyceride level was associated with leukemic cell proliferation. We then investigated whether high triglyc-erides might have an impact on the occurrence of early death in APL patients. We first performed a univariate analysis to determine the impact of the four lipid factors on early death in APL. We included WBC and platelet (PLT) counts in the analysis because WBC >109/L and PLT ≤109/L are known unfavorable levels associated with early death.25 As shown in Table 2, WBC count >10x109/L (odds ratio [OR]=5.25; P=0.006), PLT count ≤10x109/L (OR=8.83; P=0.002), triglyceride level >1.995 mmol/L (OR=6.37, P=0.018), and HDL-C level ≤0.655 (OR=4.79, P=0.022) were associated with early death. Furthermore, the multivariate logistic analysis found that WBC count >10x109/L, PLT count ≤10x109/L, and triglyceride level > 1.995 mmol/L were early death-associated risk factors (Table 2). The detection reliability is usually judged by the area under the curve (AUC). Consequently, we constructed ROC curves for the risk model using the combination of these risk factors. The three-parameter risk model, i.e., WBC, PLT plus triglyceride (AUC: 0.868; 95% confidence interval [CI]: 0.781–0.954), presented better sensitivity and specificity levels in predicting early death than WBC plus PLT. The Delong test showed that the AUC of the two risk models were significantly different. These results demonstrated that the triglyceride level was a risk factor for early death in APL patients (Figure 3C).
Figure 2.
Comparison of blood lipid levels in acute promyelocytic leukemia, non-acute promyelocytic leukemia acute myeloid leukemia patients, and non-tumor controls. (A) The proportions of the acute promyelocytic leukemia (APL), non-APL acute mye-loid leukemia (AML), and control groups with body mass index (BMI) ≥ 25. (B to E) Serum triglyceride (B) total cholesterol (C) low-density lipoprotein (D) and high-density lipoprotein (E) concentrations in the APL, non-APL AML, and non-tumor control groups. TG: triglyceride; TC: total cholesterol; LDL-C: low-density lipoprotein cholesterol; HDL-C: high-density lipoprotein cholesterol; ULN: upper limit of normal; LLN: lower limit of normal. Clinical reference ranges:TG, normal 0.34-1.71 mmol/L; TC, normal 3-5.18 mmol/L; LDL-C <3.37 mmol/L; HDL-C>1.04 mmol/L. *P<0.05; **P<0.01; ****P<0.0001; NS: not significant.
The PPAR signaling pathway was enriched in APL patients with higher triglyceride levels.
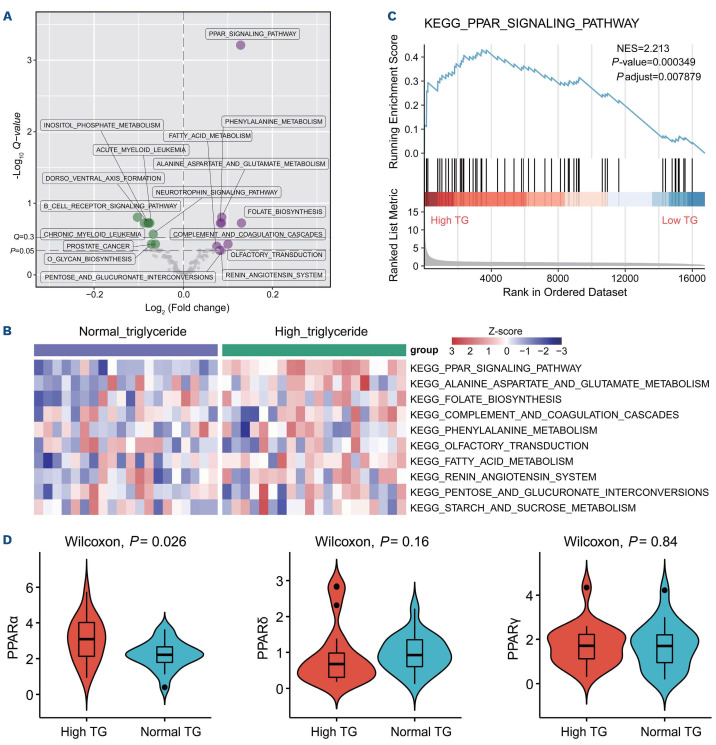
In order to explore the mechanisms underlying the impact of the triglyceride level on APL cell proliferation, we performed RNA sequencing (RNA-seq) to compare gene expression profiles between APL patients with high and normal triglyceride levels (Online Supplementary Table S1). Firstly, we employed the gene set variation analysis (GSVA) algorithm to perform pathway-centric analyses and comprehensively measured the pathway activity changes between the two groups based on the KEGG pathway signatures. As shown in Figure 4A, the activated pathways in APL with high triglyceride levels included those related to cell metabolism, e.g., glucose metabolism, amino acid metabolism, folate metabolism, and fatty acid metabolism. The PPAR signaling pathway was the most significantly activated among the metabolic pathways (Figure 4A and B). Furthermore, we conducted the gene-centric differentially expressed analysis and the gene set enrichment analysis (GSEA) on the differentially expressed genes between the two patient groups. The results revealed the upregulation of the PPAR signaling pathway in APL patients with high triglyceride levels (Figure 4C). PPAR have three subtypes (PPARa, PPAR|3/ö, and PPARy) and possess ligand-activated transcriptional abilities. Because different PPAR elicit distinct biological activities,26 the expression level of each PPAR subtype was compared in the two groups of patients. PPARa expression was significantly higher in the higher triglyceride APL patients than in the normal triglyceride patients (Figure 4D), whereas the expression levels of PPARö and PPARy were not statistically different between the two groups. Collectively, these data indicated that the PPARa pathway was enriched in APL patients having high triglyceride levels.
PPARa and PML/RARcx co-existed within the super-enhancer regions to promote cell proliferation
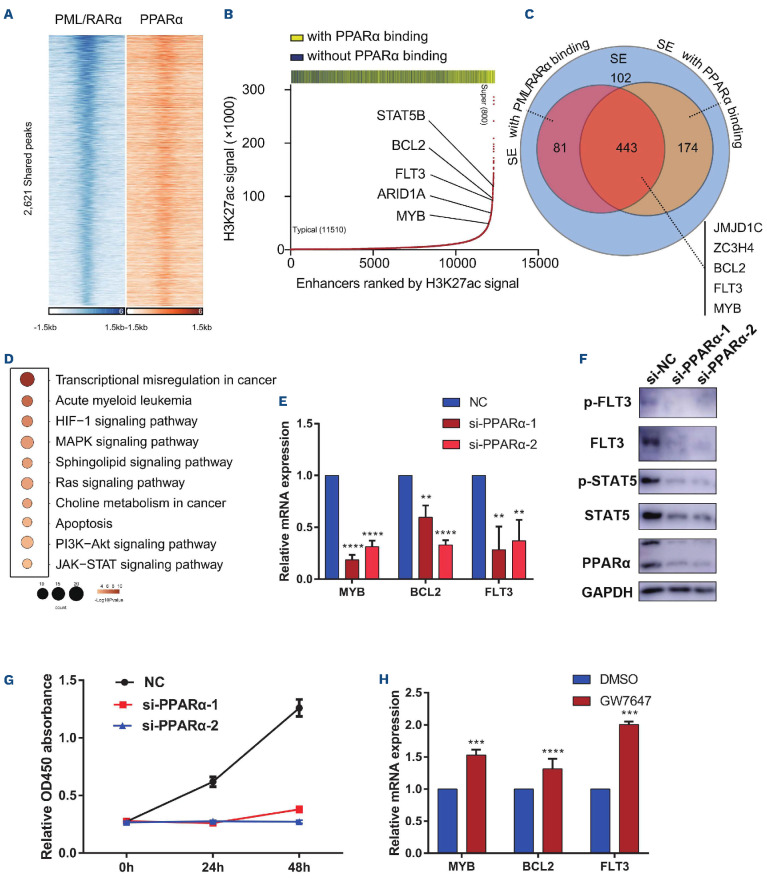
Since PPARa is a transcription factor belonging to the nuclear receptor superfamily,27 we further investigated genome-wide PPARa binding sites using a newly developed assay for chromatin occupancy, Cleavage Under Targets and Tagmentation (CUT&Tag) with a PPARa specific antibody, followed by sequencing (details in the Online Supplementary Appendix). Accordingly, 9,829 PPARa binding sites were identified in NB4 cells. PPARa binding sites were mainly distributed in promoter regions (68.88%), in-trons (14.64%), and distal intergenic regions (13.81%) (Online Supplementary Figure S1A). By comparing PPARa binding sites in NB4 cells with those in a neuroblastoma cell line SKNSH from the ENCODE,28 we found that PPARa binding sites were cell type-specific (Online Supplementary Figure S1B), suggesting that PPARα might participate in determining the identity of APL cells. Since APL is initiated by the oncogenic PML/RARα fusion protein and our recent study has shown that PML/RARα-mediated super-enhancer formation shapes the identity of APL cells,29,30 we then investigated whether PPARα is involved in the transcriptional dysregulation driven by PML/RARα. Through an integrative analysis of PPARα and PML/RARα binding sites in NB4 cells, we found that PPARα and PML/RARα co-occupied 2,621 binding sites, corresponding to 2,305 genes (Figure 5A; Online Supplementary Figure S1C). When PPARα binding sites were divided into those bound by PPARα only and those shared with PML/RARα, the former, but not the latter, revealed a significant enrichment of canonical PPAR-responsive elements (PPRE, DR1) (Online Supplementary Figure S1D, detailed in the Online Supplementary Appendix). The enrichment of PPRE suggested that PPARα might function as a cofactor with PML/RARα. We then investigated whether PPARα and PML/RARα are collaboratively involved in super-enhancer regulation. Interestingly, we found that PPARα tended to be enriched in super-enhancer regions of APL, ranked by H3K27ac in APL cells, similar to PML/RARα (Figure 5B). More importantly, a significant overlap existed between PPARα- and PML/RARα-mediated super-enhancer regions (84.54%) (Figure 5C; Online Supplementary Table S2), suggesting an interplay between PPARα and PML/RARα in APL cells. The functional enrichment analysis of target genes co-regulated by PPARα and PML/RARα-mediated super-enhancers showed transcrip-tional dysregulation (e.g., GFI1, MYB, and FLT3, Online Supplementary Figure S1C), the MAPK signaling pathway and the RAS signaling pathway were significantly enriched (Figure 5D).
Figure 3.
A high triglyceride level was associated with higher white blood cell counts and was a risk factor for early death in acute promyelocytic leukemia patients. (A) Acute promyelocytic leukemia (APL) patients with high triglyceride levels had higher white blood cell (WBC) counts than APL patients with normal triglyceride levels. (B) Linear regression analysis indicated a positive correlation between triglyceride levels and WBC counts at diagnosis. (C) The ROC curves analysis of early death prediction using factors described in Table 2. TG: triglyceride; PLT: platelets; AUC: area under the curve.
Table 2.
Logistic regression analysis of early death prognostic factors in acute promyelocytic leukemia.
In order to validate the role of PPARα in the activation of target genes associated with PML/RARα-mediated super-enhancer regions, especially those crucial for proliferation, we knocked down PPARα expression using small interfering RNA (siRNA) or inhibited PPARα with its antagonist GW6471. As shown in Figure 5E and the Online Supplementary Figure S2, the expression of these target genes, e.g., FLT3, MYB, and BCL2, was significantly downregu-lated. Because FLT3 is closely related to APL leukemogen-esis,31 we further examined the expression of the FLT3 protein and STAT5, a gene downstream of FLT3. As shown in Figure 5F, PPARα knockdown also showed decreased levels of phosphorylated FLT3 and phosphorylated STAT5, the activated forms, in APL cells, suggesting that PPARα contributed to the abnormal proliferation of APL cells by activating FLT3 and the downstream STAT5. Furthermore, we performed the CCK-8 assay and found that PPARα downregulation (through either knockdown or GW6471 treatment) indeed inhibited the proliferation of NB4 cells (Figure 5H; Online Supplementary Figure S3). Additionally, we also treated NB4 cells with the PPARα activator GW7647. The expression levels of these target genes were upregulated (Figure 5H) and the cell proliferation was increased (Online Supplementary Figure S4).
PML/RARα-transgenic mice with high triglyceride levels had increased tumor burdens and exhibited increased levels of PPARα and FLT3
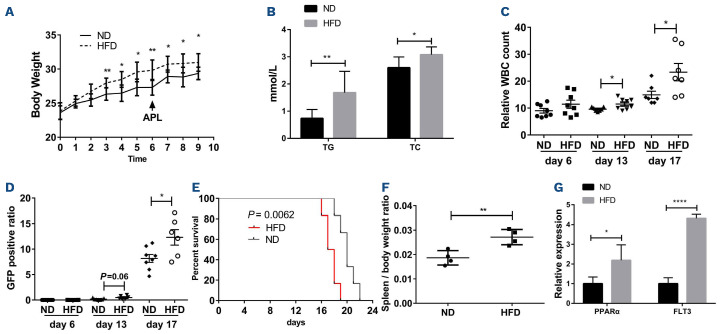
In order to acquire the in vivo evidence of the effects of high triglycerides on APL, we used PML/RARα-transgenic APL transplantable mouse model fed with either a high-fat diet (HFD) or a normal diet (ND). The serum lipid levels were examined in mice after 6 weeks. Mice in the HFD group were significantly more massive than in the ND group (Figure 6A), and the serum triglyceride and total cholesterol levels in the HFD mice were higher than those in the ND mice (Figure 6B). The WBC counts and the leukemia cell percentage (GFP-positive) of the two groups were regularly compared. Interestingly, we found that the WBC counts in the HFD group were significantly higher than that in the ND group beginning on day 13, and the difference was more significant on day 17 (Figure 6C). More importantly, the leukemia cell percentage in the HFD group was statistically higher than that in the control group, indicating that the expansion of leukemia cells in the former was more rapid than in the latter group (Figure 6D). Further statistical analysis of survival curves showed that mice in the HFD group had shorter survival times (Figure 6E). Spleen size and weights also revealed that the leukemia cells grew faster in the HFD group (Figure 6F). Furthermore, we found that the expression of PPARα and FLT3 were significantly elevated in the HFD group than that in the ND group (Figure 6G, consistent with the RNA-seq data of patients in Figure 4D.) Together, the tumor burdens of high-triglyceride mice was increased compared with those of normal-triglyceride mice, confirming the population's epidemiological results.3,32
Figure 4.
The PPAR-signaling pathway was enriched in hypertriglyceridemia acute promyelocytic leukemia samples. (A) Volcano plot of differential pathways in APL patients with high triglycerides vs. normal triglycerides. The 2 horizontal dashed lines denote a P-value cutoff of 0.05 and a false discovery rate (FDR) cutoff of 0.3. Two-sided P-values were adjusted for multiple hypothesis testing using the Benjamini-Hochberg correction. (B) The top 10 significantly enriched Kyoto Encyclopedia of Genes and Genomes (KEGG) pathways in APL patients with high triglycerides levels compared with APL with normal triglycerides levels. (C) Gene set enrichment analysis plot of the PPAR signaling signature genes in patients with high triglycerides levels vs. patients with normal triglycerides. (D) Violin plots showing the expression levels of PPAR in patients with high triglycerides and normal triglyceride levels. TG: triglyceride.
Figure 5.
PPARα was required for the proliferation of acute promyelocytic leukemia cells by co-existing with PML/RARα to control super-enhancer regulation. (A) Heatmap shows the binding sites of PPARα and PML/RARα. (B) PPARα tended to bind at enhancers with higher H3K27ac signals. (C) Venn diagram of the binding sites of PML/RARα, PPARα, and super-enhancer (SE). (D) Bubble diagram of enriched GO terms. (E) Downregulation of target genes co-bound by PML/RARα and PPARα upon PPARα knockdown using small interfering RNA (siRNA). (F) Repression of the protein levels of FLT3 expression and its downstream gene STAT5 upon PPARα knockdown. (G) Inhibition of cell growth in NB4 cells upon PPARα knockdown using siRNA. (H) Upregulation of target genes co-bound by PML/RARα and PPARα upon PPARα activation with GW7647 treatment. Data are shown as the means ± standard deviation of triplicates. *P<0.05; **P<0.01; ***P<0.001 ****P<0.0001; NC: negative control.
Discussion
Despite robust evidence connecting obesity with cancer development,1,33 the molecular mechanisms underlying this correlation remain ambiguous. In this study, we conducted a retrospective observational study that included 1,412 clinical cases and revealed the APL lipid profile characteristic of a higher triglyceride tendency. We found that the triglyceride level was a risk factor for early death. We compared the differentially expressed genes in APL patients with high triglyceride and normal triglyceride levels and found that the PPARα pathway was enriched in the former. Moreover, mechanistic studies revealed that PPARα and PML/RARα co-existed within the super-enhancer regions to promote cell proliferation. In vivo evidence showed that high triglyceride mice had increased tumor burdens. Our findings provide clinical and biological evidence demonstrating how PPARα drives hypertriglyce-ridemia/obesity-associated APL.
There is an association between obesity and APL,2-4 and obesity is often a risk factor for clinical outcomes in APL. Our study showed that the overweight/obese prevalence in APL patients was greater than that in non-APL AML and non-tumor controls. Abnormal lipid metabolism might be a reason for the correlation between obesity and cancer development.34 Among the four detected lipid profiles, i.e., triglycerides, total cholesterol, HDL-C, and LDL-C, we found that the APL patients' triglyceride levels were higher than those of the non-APL AML and those of non-tumor control groups, and they were also higher than the upper limits of normal. In contrast, the total cholesterol and LDL-C levels of the APL patients were still within the normal range, although a high tendency was observed compared with the two control groups. More importantly, our study showed a 61.4% incidence of hypertriglyceridemia in newly diagnosed APL patients, which is consistent with recent reports that 55.8% of APL patients have hypertrig-lyceridemia32,35 and supports evidence of dyslipidemia in APL patients.
Our data showed that the PPARα signaling was activated in APL patients having high triglyceride levels. It is deduc-ible that PPARα might be activated by endogenous fatty acids produced by the decomposition of triglycerides. More importantly, the mechanistic investigation using CUT&Tag analysis further indicated that PPARa interplayed with PML/RARa within the super-enhancer regions of APL cells. Indeed, we found that PML/RARa-transgenic mice with higher triglyceride levels due to HFD showed high PPARa expression levels and increased tumor burdens (Figure 6C to G).
Over two decades ago, Jansen et al. provided a preliminary clue that PML/RARa interferes with the PPAR signaling pathways.36 PPAR form a nuclear receptors superfamily that regulates genes important in cell differentiation and various metabolic processes, especially lipid and glucose homeostasis. The different isoforms of PPAR and different distribution and expression profiles ultimately lead to different clinical outcomes.37 PPARa is highly expressed in hepatocytes, cardiomyocytes, intestinal epithelial cells, and renal proximal tubule cells.38 Long-term administration of a PPARa agonist causes hepatocellular carcinoma in rodents,39 and PPARa activation promotes proliferation in breast cancer cells.18 The highest expression of PPAR-β/δ is found in the small intestine, colon, and skin epithelium.40 In the hematopoietic system, studies have shown that PPARδ plays an important role in maintaining hematopoietic stem cells (HSC) by regulating mitochondrial phagocytosis and promoting the asymmetric cell division of HSC.41 PPARy is highly expressed in adipose tissue. Li et al. demonstrated that PPARy is a direct target of PML/RARa. PML/RARa overexpression increases the ubi-quitination of PPARy and inhibits the PPARy activity by disrupting the PPARy/RXR heterodimer.32 The relationship between PML/RARa and PPAR signaling deserves further study, at the transcription, post-transcription, translation, and post-translational modification levels. Our study demonstrated that PPARa and PML/RARa coexisted within the super-enhancer regions in APL cells. Considering the recent study that PML/RARa transactiv-ates target genes largely through super-enhancer regulation,30 we speculated that PPARa might participate in the activation of target genes associated with PML/RARa-me-diated super-enhancer regions. Indeed, the expression of the three representative genes well-known for promoting leukemogenesis, such as FLT3, MYB, and BCL2, was up-regulated. FLT3, which is activated mainly due to FLT3-ITD, is known to work synergistically with PML/RARa to hasten APL development.42 Overexpression of wild-type FLT3 has also been reported to promote AML in mice.43,44 MYB acts as a protooncogene in AML and is decisive in regulating the hematopoiesis, including the proliferation and differentiation of blood cells.45 BCL2 is critical in inhibiting apoptosis in AML.46 Therefore, PPARa and PML/RARa might be collaboratively involved in super-enhancer regulation in APL pathogenesis. Early death remains a major obstacle in the successful treatment of APL. In our data, the early death rate was 6.9%, and most patients (11/13) died of intracerebral hemorrhage, consistent with previous reports.21,47,48 In order to remove confounding factors from the analysis, we compared the treatment supportive care, and time-to-treatment initiation between the normal triglyceride group and high triglyceride group. Patients with normal and high triglyceride levels received the same treatment regimen, i.e., ATRA plus ATO with or without chemotherapy according to Sanz risk stratification in the induction course. As shown in the Online Supplementary Table S3, there was no statistical difference in the Sanz risk stratification between the patients with normal and high tri-glyceride levels (P=0.219). Regarding the time-to-treatment initiation, there was no difference between the two groups. Patients were treated with ATRA immediately when a diagnosis of APL was suspected. The length of hospital stay can be partially used to assess the effects of supportive care.49 The median length of hospital stay was similar between the two groups, i.e., 30 days (interquartile range, 27 to 34 days) for patients with normal triglyceride levels and 30 days (interquartile range, 25 to 33 days) for patients with high triglyceride levels.
Figure 6.
PML/RARα-transgenic mice with high triglyceride levels had increased tumor burden and exhibited increased levels of PPARα and FLT3. (A) Body weights of mice fed with a high-fat diet (HFD) or a normal diet (ND). (B) Serum triglyceride and total cholesterol concentrations were measured in mice fed with HFD or ND for 6 weeks. (C) Relative leukocyte counts (x109/L) in the HFD and ND groups of FVB/APL mice at 6, 13, and 17 days after transplantation. (D) GFP-positive ratios in peripheral blood cells of HFD and ND groups of FVB/APL mice at 6, 13, and 17 days after transplantation. (E) High triglyceride mice were more likely to develop acute promyelocytic leukemia (APL). We used a Kaplan-Meier analysis to estimate the survival of FVB/APL mice. (F) The spleen/body weight ratios showed that the spleens of the HFD group were swollen. (G) quantitative polymerase chain reaction showing the expression of PPARα and FLT3 in mice fed with HFD and ND for 6 weeks.
The limitations of this study are as follows. Firstly, this is a single-center, retrospective study. In the non-tumor controls, we included patients with heterogeneous diseases other than hematologic tumors and cardiovascular diseases (or patients using drugs that affected blood lipids). Multi-center and multi-ethnic studies with more precise inclusion and exclusion criteria may help reduce selection bias. Secondly, we showed that PPARα and PML/RARα coexisted within the super-enhancer regions to promote proliferation. A previous study showed that PML/RARα drives oncogenesis through chromatin conformation at the super-enhancer region and through the recruitment of cofactors.30 Whether PPARα interacts with other cofactors requires further investigation. In addition, due to the limitations of the mouse model itself, it is difficult to determine whether hypertriglyceridemia or obesity contributes to the tumor development in preleukemic cells or at later stages once leukemia has already developed. It is also possible that obesity affects all these processes. More studies, in vitro or in vivo, are needed to address these issues. Because the current knowledge underlying the dyslipide-mia-cancer association is diverse, our findings provide a possible mechanism by which PPARα serves as a link between dyslipidemia and APL. The results expand our knowledge of the mechanisms responsible for the obesity–cancer association. Our study also emphasizes the influence of obesity/dyslipidemia on APL proliferation and potentially confers a rationale for treating APL with the PPAR activators.
Supplementary Material
Funding Statement
Funding: This study was supported by the National Natural Science Foundation of China (81890994,81770153, 31801176) and the National Key R&D Program of China (2019YFA0905902).
References
- 1.Bhaskaran K, Douglas I, Forbes H, dos-Santos-Silva I, Leon DA, Smeeth L. Body-mass index and risk of 22 specific cancers: a population-based cohort study of 5.24 million UK adults. Lancet. 2014;384(9945):755-765. [DOI] [PMC free article] [PubMed] [Google Scholar]
- 2.Castillo JJ, Mulkey F, Geyer S, et al. Relationship between obesity and clinical outcome in adults with acute myeloid leukemia: A pooled analysis from four CALGB (alliance) clinical trials. Am J Hematol. 2016;91(2):199-204. [DOI] [PMC free article] [PubMed] [Google Scholar]
- 3.Estey E, Thall P, Kantarjian H, Pierce S, Kornblau S, Keating M. Association between increased body mass index and a diagnosis of acute promyelocytic leukemia in patients with acute myeloid leukemia. Leukemia. 1997;11(10):1661-1664. [DOI] [PubMed] [Google Scholar]
- 4.Mazzarella L, Botteri E, Matthews A, et al. Obesity is a risk factor for acute promyelocytic leukemia: evidence from population and cross-sectional studies and correlation with flt3 mutations and polyunsaturated fatty acid metabolism. Haematologica. 2020;105(6):1559-1566. [DOI] [PMC free article] [PubMed] [Google Scholar]
- 5.Currie E, Schulze A, Zechner R, Walther Tobias C, Farese Robert V, Cellular fatty acid metabolism and cancer. Cell Metab. 2013;18(2):153-161. [DOI] [PMC free article] [PubMed] [Google Scholar]
- 6.Nomura DK, Long JZ, Niessen S, Hoover HS, Ng S-W, Cravatt BF. Monoacylglycerol lipase regulates a fatty acid network that promotes cancer pathogenesis. Cell. 2010;140(1):49-61. [DOI] [PMC free article] [PubMed] [Google Scholar]
- 7.Snaebjornsson MT, Janaki-Raman S, Schulze A. Greasing the wheels of the cancer machine: the role of lipid metabolism in cancer. Cell Metab. 2020;31(1):62-76. [DOI] [PubMed] [Google Scholar]
- 8.Schulze A, Harris AL. How cancer metabolism is tuned for proliferation and vulnerable to disruption. Nature. 2012;491(7424):364-373. [DOI] [PubMed] [Google Scholar]
- 9.Han H, Qi R, Zhou JJ, et al. Regulation of the hippo pathway by phosphatidic acid-mediated lipid-protein interaction. Mol Cell. 2018;72(2):328-340.e8. [DOI] [PMC free article] [PubMed] [Google Scholar]
- 10.Martin LJ, Melnichouk O, Huszti E, et al. Serum lipids, lipoproteins, and risk of breast cancer: a nested case-control study using multiple time points. J Natl Cancer Inst. 2015;107(5):djv032. [DOI] [PMC free article] [PubMed] [Google Scholar]
- 11.Yang MH, Rampal S, Sung J, et al. The association of serum lipids with colorectal adenomas. Am J Gastroenterol. 2013;108(5):833-841. [DOI] [PubMed] [Google Scholar]
- 12.Mulas MF, Abete C, Pulisci D, et al. Cholesterol esters as growth regulators of lymphocytic leukaemia cells. Cell Prolif. 2011;44(4):360-371. [DOI] [PMC free article] [PubMed] [Google Scholar]
- 13.Cicconi L, Fenaux P, Kantarjian H, Tallman M, Sanz MA, Lo-Coco F. Molecular remission as a therapeutic objective in acute promyelocytic leukemia. Leukemia. 2018;32(8):1671-1678. [DOI] [PubMed] [Google Scholar]
- 14.de Thé H, Chen Z. Acute promyelocytic leukaemia: novel insights into the mechanisms of cure. Nat Rev Cancer. 2010;10(11):775-783. [DOI] [PubMed] [Google Scholar]
- 15.Esnault C, Rahmé R, Rice KL, et al. FLT3-ITD impedes retinoic acid, but not arsenic, responses in murine acute promyelocytic leukemias. Blood. 2019;133(13):1495-1506. [DOI] [PMC free article] [PubMed] [Google Scholar]
- 16.Sohal J, Phan VT, Chan PV, et al. A model of APL with FLT3 mutation is responsive to retinoic acid and a receptor tyrosine kinase inhibitor, SU11657. Blood. 2003;101(8):3188-3197. [DOI] [PubMed] [Google Scholar]
- 17.Kersten S, Desvergne B, Wahli W. Roles of PPARs in health and disease. Nature. 2000;405(6785):421-424. [DOI] [PubMed] [Google Scholar]
- 18.Suchanek KM, May FJ, Robinson JA, et al. Peroxisome proliferator-activated receptor alpha in the human breast cancer cell lines MCF-7 and MDA-MB-231. Mol Carcinog. 2002;34(4):165-171. [DOI] [PubMed] [Google Scholar]
- 19.Manieri E, Folgueira C, Rodríguez ME, et al. JNK-mediated disruption of bile acid homeostasis promotes intrahepatic cholangiocarcinoma. Proc Natl Acad Sci U S A. 2020;117(28):16492-16499. [DOI] [PMC free article] [PubMed] [Google Scholar]
- 20.Vickers M, Jackson G, Taylor P. The incidence of acute promyelocytic leukemia appears constant over most of a human lifespan, implying only one rate limiting mutation. Leukemia. 2000;14(4):722-726. [DOI] [PubMed] [Google Scholar]
- 21.Sanz MA, Fenaux P, Tallman MS, et al. Management of acute promyelocytic leukemia: updated recommendations from an expert panel of the European LeukemiaNet. Blood. 2019;133(15):1630-1643. [DOI] [PMC free article] [PubMed] [Google Scholar]
- 22.Tallman MS, Nabhan C, Feusner JH, Rowe JM. Acute promyelocytic leukemia: evolving therapeutic strategies. Blood. 2002;99(3):759-767. [DOI] [PubMed] [Google Scholar]
- 23.Lehmann S, Ravn A, Carlsson L, et al. Continuing high early death rate in acute promyelocytic leukemia: a population-based report from the Swedish Adult Acute Leukemia Registry. Leukemia. 2011;25(7):1128-1134. [DOI] [PubMed] [Google Scholar]
- 24.Mantha S, Goldman DA, Devlin SM, et al. Determinants of fatal bleeding during induction therapy for acute promyelocytic leukemia in the ATRA era. Blood. 2017;129(13):1763-1767. [DOI] [PMC free article] [PubMed] [Google Scholar]
- 25.Cai P, Wu Q, Wang Y, Yang X, Zhang X, Chen S. An effective early death scoring system for predicting early death risk in de novo acute promyelocytic leukemia. Leuk Lymphoma. 2020;61(8):1989-1995. [DOI] [PubMed] [Google Scholar]
- 26.Michalik L, Desvergne B, Wahli W. Peroxisome-proliferator-activated receptors and cancers: complex stories. Nat Rev Cancer. 2004;4(1):61-70. [DOI] [PubMed] [Google Scholar]
- 27.Vamecq J, Latruffe N. Medical significance of peroxisome proliferator-activated receptors. Lancet. 1999;354(9173):141-148. [DOI] [PubMed] [Google Scholar]
- 28.An integrated encyclopedia of DNA elements in the human genome. Nature. 2012;489(7414):57-74. [DOI] [PMC free article] [PubMed] [Google Scholar]
- 29.de The H, Pandolfi PP, Chen Z. Acute promyelocytic leukemia: a paradigm for oncoprotein-targeted cure. Cancer Cell. 2017;32(5):552-560. [DOI] [PubMed] [Google Scholar]
- 30.Tan Y, Wang X, Song H, et al. A PML/RARα direct target atlas redefines transcriptional deregulation in acute promyelocytic leukemia. Blood. 2021;137(11):1503-1516. [DOI] [PMC free article] [PubMed] [Google Scholar]
- 31.Meshinchi S, Appelbaum FR. Structural and functional alterations of FLT3 in acute myeloid leukemia. Clin Cancer Res. 2009;15(13):4263-4269. [DOI] [PMC free article] [PubMed] [Google Scholar]
- 32.Li K, Wang F, Yang Z-N, et al. PML-RARα interaction with TRIB3 impedes PPARγ/RXR function and triggers dyslipidemia in acute promyelocytic leukemia. Theranostics. 2020;10(22):10326-10340. [DOI] [PMC free article] [PubMed] [Google Scholar]
- 33.Li D, Morris JS, Liu J, et al. Body mass index and risk, age of onset, and survival in patients with pancreatic cancer. JAMA. 2009;301(24):2553-2562. [DOI] [PMC free article] [PubMed] [Google Scholar]
- 34.Liu Q, Luo Q, Halim A, Song G. Targeting lipid metabolism of cancer cells: A promising therapeutic strategy for cancer. Cancer Lett. 2017;401:39-45. [DOI] [PubMed] [Google Scholar]
- 35.Sun J, Lou Y, Zhu J, et al. Hypertriglyceridemia in newly diagnosed acute promyelocytic leukemia. Front Oncol. 2020;10:577796. [DOI] [PMC free article] [PubMed] [Google Scholar]
- 36.Jansen JH, Mahfoudi A, Rambaud S, Lavau C, Wahli W, Dejean A. Multimeric complexes of the PML-retinoic acid receptor alpha fusion protein in acute promyelocytic leukemia cells and interference with retinoid and peroxisome-proliferator signaling pathways. Proc Natl Acad Sci U S A. 1995;92(16):7401-7405. [DOI] [PMC free article] [PubMed] [Google Scholar]
- 37.Grygiel-Górniak B. Peroxisome proliferator-activated receptors and their ligands: nutritional and clinical implications - a review. Nutr J. 2014;13:17. [DOI] [PMC free article] [PubMed] [Google Scholar]
- 38.Guerre-Millo M, Gervois P, Raspé E, et al. Peroxisome proliferator-activated receptor alpha activators improve insulin sensitivity and reduce adiposity. J Biol Chem. 2000;275(22):16638-16642. [DOI] [PubMed] [Google Scholar]
- 39.Reddy JK, Azarnoff DL, Hignite CE. Hypolipidaemic hepatic peroxisome proliferators form a novel class of chemical carcinogens. Nature. 1980;283(5745):397-398. [DOI] [PubMed] [Google Scholar]
- 40.Girroir EE, Hollingshead HE, He P, Zhu B, Perdew GH, Peters JM. Quantitative expression patterns of peroxisome proliferator-activated receptor-beta/delta (PPARbeta/delta) protein in mice. Biochem Biophys Res Commun. 2008;371(3):456-461. [DOI] [PMC free article] [PubMed] [Google Scholar]
- 41.Ito K, Turcotte R, Cui J, et al. Self-renewal of a purified Tie2+ hematopoietic stem cell population relies on mitochondrial clearance. Science. 2016;354(6316):1156-1160. [DOI] [PMC free article] [PubMed] [Google Scholar]
- 42.Kelly LM, Kutok JL, Williams IR, et al. PML/RARalpha and FLT3-ITD induce an APL-like disease in a mouse model. Proc Natl Acad Sci U S A. 2002;99(12):8283-8288. [DOI] [PMC free article] [PubMed] [Google Scholar]
- 43.Palmqvist L, Argiropoulos B, Pineault N, et al. The Flt3 receptor tyrosine kinase collaborates with NUP98-HOX fusions in acute myeloid leukemia. Blood. 2006;108(3):1030-1036. [DOI] [PubMed] [Google Scholar]
- 44.Reindl C, Quentmeier H, Petropoulos K, et al. CBL exon 8/9 mutants activate the FLT3 pathway and cluster in core binding factor/11q deletion acute myeloid leukemia/myelodysplastic syndrome subtypes. Clin Cancer Res. 2009;15(7):2238-2247. [DOI] [PubMed] [Google Scholar]
- 45.Arsura M, Luchetti M, Erba E, Golay J, Rambaldi A, Introna M. Dissociation between p93B-myb and p75c-myb expression during the proliferation and differentiation of human myeloid cell lines. Blood. 1994;83(7):1778-1790. [PubMed] [Google Scholar]
- 46.Naumovski L, Cleary ML. Bcl2 Inhibits apoptosis associated with terminal differentiation of HL-60 myeloid leukemia Cells. Blood. 1994;83(8):2261-2267. [PubMed] [Google Scholar]
- 47.Chen L, Zhu HM, Li Y, et al. Arsenic trioxide replacing or reducing chemotherapy in consolidation therapy for acute promyelocytic leukemia (APL2012 trial). Proc Natl Acad Sci U S A. 2021;118(6):e2020382118. [DOI] [PMC free article] [PubMed] [Google Scholar]
- 48.Jillella AP, Kota VK. The global problem of early deaths in acute promyelocytic leukemia: a strategy to decrease induction mortality in the most curable leukemia. Blood Rev. 2018;32(2):89-95. [DOI] [PubMed] [Google Scholar]
- 49.Burnett AK, Russell NH, Hills RK, et al. Arsenic trioxide and all-trans retinoic acid treatment for acute promyelocytic leukaemia in all risk groups (AML17): results of a randomised, controlled, phase 3 trial. Lancet Oncol. 2015;16(13):1295-1305. [DOI] [PubMed] [Google Scholar]
Associated Data
This section collects any data citations, data availability statements, or supplementary materials included in this article.
Supplementary Materials
Data Availability Statement
The datasets are available in NCBI's GEO with the access numbers GSE195776 (CUT&Tag) and GSE195777 (RNA sequencing).


