

Abstract
Measurement of macrophage activation and its modulation for immune regulation is of great interest to arrest inflammatory responses associated with degeneration of intervertebral discs that cause chronic back pain, and with transplants that face immune rejection. Due to the phenotypic plasticity of macrophages that serve multiple immune functions, the net disease outcome is determined by a balance of subpopulations with competing functions, highlighting the need for single-cell methods to quantify heterogeneity in their activation phenotypes. However, since macrophage activation can follow several signaling pathways, cytometry after fluorescent staining of markers with antibodies does not often provide dose-dependent information on activation dynamics. We present high throughput single-cell impedance cytometry for multiparametric measurement of biophysical changes to individual macrophages for quantifying activation in a dose and duration dependent manner, without relying on a particular signaling pathway. Impedance phase metrics measured at two frequencies and the electrical diameter from impedance magnitude at lower frequencies are used in tandem to benchmark macrophage activation by degenerated discs against that from lipopolysaccharide stimulation at varying dose and duration levels, so that reversal of the activation state by curcumin can be ascertained. This label-free single-cell measurement method can form the basis for platforms to screen therapies for inflammation, thereby addressing the chronic problem of back pain.
Keywords: Inflammation, Macrophages, Microfluidics, Impedance, Cytometry, Intervertebral disc
1. Introduction
Effective immune systems require immune cells to perform diverse functions (Satija and Shalek, 2014), leading to heterogeneity in their cellular phenotypes. Macrophages are immune effector cells that display a high degree of phenotypic plasticity while serving multiple homeostatic functions associated with host defense, wound healing, and immune regulation, in response to activation under environmental cues (Mosser and Edwards, 2008). The spatiotemporal profiles of the stimuli on phenotypically plastic macrophages leads to heterogeneity in their phenotypes (Oyler-Yaniv et al., 2017), highlighting the need for single-cell techniques to measure macrophage activation (Spiller et al., 2010). Macrophages are the predominant cells driving inflammation in response to the degeneration of intervertebral discs (henceforth, IVD or discs) (Burke et al., 2002), as well as to biomaterial (Abebayehu et al., 2017) and cellular transplants (Langer, 2010). Emerging evidence (Jin et al., 2021) suggests that the balance of activation phenotypes of macrophage subpopulations infiltrating the degenerated disc determines outcomes, such as back and radicular pain. Back pain from disc degeneration is the most common cause of disability (Andersson, 1999), with a prevalence of over 80% in individuals between the ages of 20–50 (Hoy et al., 2014), for which no disease-modifying medications currently exist to address the long-term outcomes (Purmessur et al., 2013). Drugs designed to modulate the activation of macrophages can alleviate disc degeneration and the associated back pain, as well as immune rejection of transplant therapies. However, for in vitro screening of immunomodulation therapies, macrophage activation needs to be quantified with single-cell sensitivity, and in a dose and duration-dependent manner.
Flow cytometry after fluorescent staining of cell surface markers is commonly used for quantification of phenotypic responses at single-cell sensitivity. However, since phenotypes of macrophages are dynamic and stimulus dependent (Lu et al., 2015), (An et al., 2002), it is often not possible to capture the full spectrum of macrophage activation, using molecular markers from a particular signaling pathway (Silva et al., 2019; Vogel et al., 2014). Also, endpoint fluorescent staining assays are not compatible with longitudinal studies on activation dynamics for the same set of cells within the sample (Gordonov et al., 2016). Similarly, single-cell RNA sequencing, while valuable in identifying distinct macrophage states, is destructive and does not permit downstream studies on activated cells. Raman microspectroscopy for profiling lipid transformations is an emerging label-free technique to characterize macrophage activation with single-cell sensitivity (Feuerer et al., 2021), but it measures only limited cell numbers (~100 per sample). Label-free quantitative phase microscopy to characterize cell morphologies is especially of interest due to its ability to measure global changes in cellular phenotype to provide dose-dependent phenotypic information that does not rely on definitive markers of a particular signaling mechanism (Pavillon et al., 2018). However, due to its intensive computational needs for multivariate analysis of images, only limited cell numbers can be measured (~100–500 per sample) and the data analysis can only be performed off-line, thereby limiting the ability to select phenotypes for downstream studies.
Emerging cytometry methods using electrical, mechanical, and imaging modalities offer single-cell biophysical information for label-free stratification and cell selection based on phenotypes (Lee et al., 2021). Impedance cytometry is one such technique that can provide non-invasive, sensitive, and high throughput (300–400 events/s) biophysical information on cells based on disruptions to the magnitude and phase of alternating current flow by passing single cells or subcellular particles in a microchannel (Cheung et al., 2010), (Sun and Morgan, 2010), over several frequencies in the 0.5–50 MHz range. In this manner, biophysical phenotypes can be discerned based on cellular electrical size at low frequency (~0.5 MHz), or membrane features can be discerned based on membrane conductance and capacitance at mid-frequencies (2–10 MHz), and features in the cell interior can be followed at high frequencies (≥10 MHz) (Honrado et al., 2021). Using size-controlled co-flowing insulating beads for data normalization (Spencer and Morgan, 2020), impedance magnitude (|Z|) and phase (φZ) metrics can be quantified and compared across different biological samples over multiple frequencies, so that the dispersions can provide multiparametric information on cell phenotype (Moore et al., 2020) and drug-induced transformations (De Ninno et al., 2020), (Honrado et al., 2020; Spencer et al., 2020).
In this work, we present impedance metrics from single-cell cytometry for quantifying macrophage activation in a dose and duration-dependent manner, so that drug-induced modulation of these phenotypes can be ascertained by label-free biophysical measures for each cell, without relying on molecular markers from a particular signaling pathway. Using differing dose and duration levels of lipopolysaccharide (LPS) stimulation on macrophages (Raw 264.7) that are known to stimulate the pro-inflammatory Toll-like receptor 4 (TLR4) (An et al., 2002), macrophage activation determined by impedance cytometry is cross-validated based on imaging and secreted nitrite (NO) in media (Jacobs and Ignarro, 2001) for enabling comparison to the level elicited by degenerated discs. Impedance metrics are identified to discern the modulation of macrophage activation, including during its interaction with progressively degenerated discs, and after treatment with curcumin, an anti-inflammatory compound that can reverse activation (Zhou et al., 2015). Recent impedance cytometry work has correlated leukocyte activation to an increase in electrical diameter (Petchakup et al., 2021), but for macrophages that possess a highly migratory phenotype, intercellular interactions can limit the size increase and stress cells to create heterogeneity in their activation response (Nomura et al., 2000). Hence, using impedance phase metrics to detect the stressed subpopulation from intercellular interaction, we optimize macrophage cell density to enable facile formation of the polarized cell morphology under activation (Berghaus et al., 2010), (Taciak et al., 2018). Using multiple frequencies to aggregate the multivariate phenotypic alterations, based on electrical diameter, capacitance of the plasma membrane, and conductivity and permittivity of the cell interior, impedance metrics are identified to quantify macrophage activation by degenerated discs and its reversal by curcumin, with dose and duration dependence. We envision application of this single-cell biophysical cytometry method to screen for immunomodulation therapies that address the chronic problem of back pain.
2. Materials and methods
2.1. In vitro culture of macrophages
Macrophages Raw 264.7 cells from American Type Culture Collection (ATCC) (Manassas, VA) were cultured with Dulbecco’s modified Eagle’s medium (DMEM, high glucose 4.5 g/L, Gibco, Grand Island, NY) supplied with 10% fetal bovine serum (FBS) (Gibco), 1% penicillin (100 μg/mL), and 1% streptomycin (100 μg/mL) (Gibco) and maintained in 5% CO2 at 37 °C. The cell seeding density was optimized using a 24 well plate including: 5 × 10⁵, 2 × 10⁵, and 1 × 10⁵ cells/mL, with 0.5 mL per well, to yield 2 × 10⁶, 1 × 10⁶, and 2 × 10⁵ cells per well after culture in complete growth media overnight and subsequently in serum-free media for 1 day.
2.2. LPS-induced activation of macrophages
In a 24-well plate, Raw 264.7 cells were pre-seeded in the complete growth media at a density of 1 × 10⁵ cells/mL (0.5 mL/well) overnight. Cells treated with serum free media were replaced with or without LPS at differing doses and durations: 10 ng/mL or 100 ng/mL for 6 or 24 h, respectively, before proceeding to impedance cytometry and secretion analysis.
2.3. Ex vivo dissection of mouse intervertebral disc and their pretreatment
Animal protocols were approved by the Institutional Animal Care & Use Committee at the University of Virginia prior to the study. Mice were euthanized in a CO2 chamber, followed by cervical dislocation. Mouse lumbar IVD (without bony endplates) (L1-L6, 5 discs per animal) were dissected from C57BL/6 mice (8–12 weeks, 20–25 g, both male and female) (Envigo, Indianapolis, IN) under a dissecting scope following published protocol (Dai et al., 2019). In brief, dissected discs were immersed in sterile PBS with 2% antibiotic-antimycotic for 20 min, before transferring into DMEM (high glucose 4.5 g/L) containing 1% penicillin (100 μg/mL) and 1% streptomycin (100 μg/mL). After equilibrating in the incubator for 30 min, discs were randomly assigned to place 3 discs per well, in a 24-well plate. To induce disc degeneration, discs (3 discs per well) were incubated with fresh serum-free media (0.5 mL per well), with human interleukin-1β (IL-1β) (Abcam, USA) (100 ng/mL) for 2 days. To demonstrate the potential phenotype reversal effect of Curcumin, discs were incubated with fresh serum-free media with IL-1β (10 ng/mL) or IL-1β (10 ng/mL) +Curcumin (10 μM) for 1 day.
2.4. Co-culture of macrophages with degenerated mouse disc
In a 24-well plate, Raw 264.7 cells were pre-seeded in the complete growth media at a density of 5 × 10⁴ cells/well (in 0.5 mL) overnight and replaced with serum-free media. Discs subjected to various treatment (as above) were rinsed with warm DMEM twice before transferring into macrophage wells, via a sterilized fine tweezer, to allow coculture for 1 day at 37 °C in a humidified atmosphere with 5% CO2.
2.5. Impedance cytometry
At designated time points, macrophages subjected to the described treatment and co-culture protocols were harvested by trypsin and resuspended in serum-free DMEM (1 mL per well per sample), for single-cell impedance cytometry to measure the biophysical phenotypes (Fig. 1 and Fig. S1). A syringe pump was used to introduce macrophages, with co-flowing 7 μm polystyrene beads (Sigma) at ~1.2 × 10⁵ beads/mL into the microchannel with patterned electrodes for a detection region 30 μm (width) × 30 μm (height) (McGrath et al., 2020), for measurement at ~300 events/s at four simultaneous frequencies (0.5, 2, 18 and 30 MHz) using an impedance analyzer (Amphasys AG, Switzerland). Acquisition settings were optimized for signal to noise, based on levels of signal modulation, amplification, demodulation, and the trigger voltage level. Processed signal data (impedance magnitude and phase) were analyzed using Python.
Fig. 1.
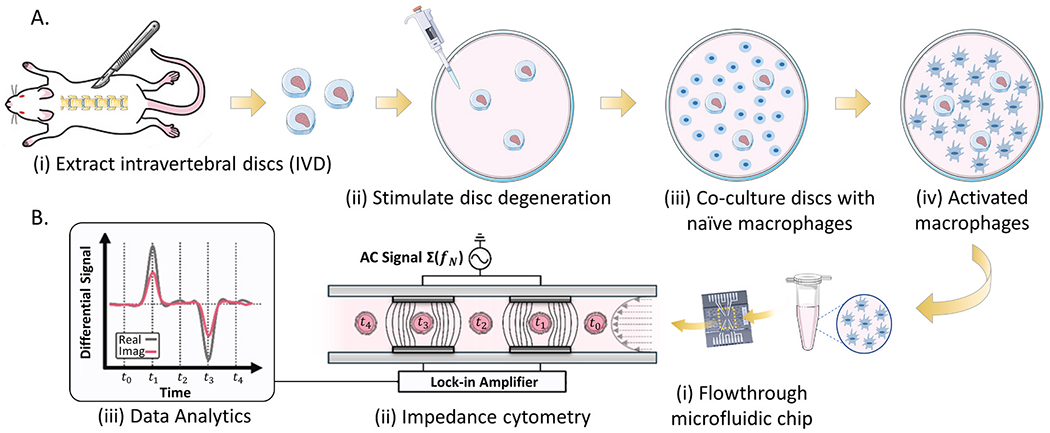
A. Biological sample preparation, including: (i) ex vivo dissection of mouse lumbar intervertebral discs, (ii) stimulation with inflammatory cytokine IL-1β, and (iii) co-culture with macrophages in a 24-well plate (iv). B. Impedance cytometry of activated macrophages.
2.6. Impedance data processing and statistical analysis
The impedance phase and magnitude for macrophages were normalized by division to those obtained for polystyrene beads to account for any temporal variations during the measurement and to enable quantitative comparison between measurements (Salahi et al., 2022). Due to normalization, impedance phase is reported in arbitrary units (with respect to impedance phase of beads indexed at zero). The macrophage cells were gated from reference beads in normalized impedance data at 30 MHz for analyzing the gated macrophages at each probe frequency (0.5–30 MHz) (SI Fig. S2). All statistical analysis was performed using a custom script in Python. Significance level was defined as p < 0.05. Comparisons between any two groups were done using a student’s two-tailed t-test, while comparisons between multiple groups were performed using a one-way ANOVA with a Tukey’s multiple comparisons test. All results are representative of at least three repetitions; with error bars indicating standard deviation between sample triplicates.
2.7. Validation of macrophage activation with real-time RT-PCR and Griess assay
After incubation with LPS or coculture with discs, the NO in culture media was measured with Griess assay (Promega, Madison, WI) following standard protocols (Li et al., 2017). Total RNA of macrophages was isolated with Trizol Reagent (Invitrogen) and quantified with NanoDropTM 1000 Spectrophotometer (ThermoFisher Scientific, Waltham, MA). One microgram of total RNA was used for cDNA synthesis with iScript cDNA synthesis kit (Bio-Rad Laboratories, Hercules, CA) following the manufacture’s instruction. Real-time reverse transcription polymerase chain reaction (RT-PCR) was performed with RT^2 SYBR Green Fluo FAST Mastermix (Qiagen Sciences, Germantown, MA) on a QuantStudio3 Real-time PCR system (Applied Biosystems, Waltham, MA). The relative mRNA levels of target genes were calculated by the comparative CT method (also known as the 2–ΔΔCT method) using 18S as an internal control. The mRNA expression of inos, and tnf-α were evaluated. The 18S rRNA were used as internal controls. Sequences of primers listed in Table S1.
2.8. Macrophage cell morphology analysis
After coculture with discs (pre-treated with 10 ng/mL IL-1β or 10 ng/ mL IL-1β+10 μM Curcumin) for 1 day, blight-field images of macrophages (200 × magnification) were assessed for morphology (3 region-of-interests per sample per SI: Figs. S9–S10). Cell boundaries were traced by ImageJ for automated analysis of cell area, perimeter, circularity, and aspect ratio. In each condition, ~100 cells were analyzed to obtain mean values of these morphological parameters.
3. Results and discussion
3.1. Optimizing macrophage seeding density to control for heterogeneity
The measured impedance magnitude (|Z|) represents amplitude reductions and impedance phase (φZ) represents temporal alterations to the input sinusoidal signal, as created by each passing cell suspended in its culture media, which is measured simultaneously at four frequencies of interest. These include: 0.5 MHz due to its dependence on particle size, 2 MHz due to its dependence on membrane properties, 18 MHz due to its dependence on cell interior and 30 MHz to allow for gating of cells versus co-flowing beads. After normalization of the data from each cell to data from co-flowing beads, the metric of electrical diameter (or ) is with respect to beads of known size, opacity (|Z|plobe freq./|Z|0.5 MHz) is with respect to beads at opacity of unity, and impedance phase is with respect to beads at a phase level of 0. Per dielectric model simulations using typical biophysical cellular parameters, cell size differences sharply alter the |Z0.5MHz| (SI: Fig. S3) and plasma membrane conductance alterations can be detected based on φZ in the 0.5–3 MHz range (SI: Fig. S4B), while its capacitance alterations modify the φZ response in the 0.5–10 MHz range (SI: Fig. S4A) and the opacity in the 2–8 MHz range (SI: Figs. S4C–S4D). Similarly, conductivity alterations to the cell interior modify the φZ and opacity in the >10 MHz range for cells in the 0.8–1.2 S/m range (SI: Fig. S5A & Fig. S5C), while permittivity alterations to the cell interior modify only the φZ in the >10 MHz range. Many of these simulated impedance metrics have been experimentally validated using modified red blood cells (Salahi et al., 2022).
Intercellular interactions strongly influence the phenotype of highly migratory cells, such as macrophages (Shim et al., 2011), thereby creating a degree of heterogeneity in their polarized morphology under activation. Using three different macrophage seeding densities per well (# cells/mL): high (5 x 10⁵), medium (2 x 10⁵), and low (1 x 10⁵), we observe that higher cell densities limit cell spread to cause successively smaller cell sizes (SI: Fig. S6A & Fig. 2A–C). The resulting alteration in size and membrane conditions cause the histograms φZ0.5 MHz to show distinct subpopulations (Figs. 2D and SI: Fig. S6B), as indicated by arrows. While the majority population (green arrow) is relatively unshifted, a downshifted minority subpopulation (red arrow) is apparent at all three cell densities within the scatter plots (Fig. 2A–C) and the histograms (Fig. 2D and Fig. S6B). The emergence of this minority subpopulation is not due to loss of cell viability, which would cause much lower φZ0.5 MHz levels, as observed for heat treated cells in Fig. 2D. Instead, we attribute it to a stressed subpopulation with arrested migration ability for cells seeded at higher densities. To ensure that intercellular interactions do not influence the polarized morphology of activated macrophages, we maintain a low cell density level in all subsequent work, wherein this subpopulation is highly reduced. Decrease in cell size arising from higher cell density would lower electrical diameter (or ) and φZ0.5 MHz (Fig. S3B), but the latter impedance metric is also a sensitive indicator of the cell membrane condition (De Ninno et al., 2020); particularly alterations its RC time constant (product of resistance and capacitance per SI: Figs. S4A–S4B). At higher frequencies, the impedance phase no longer exhibits a systematic dependence on cell density (SI: Figs. S6C–S6D), indicating minimal alterations to the cell interior. Future work uses high frequencies: φZ2 MHz and φZ18 MHz that are sensitive to the phenotypes in the cell interior (SI: Figs. S5A–5B) for assessing activation-induced alterations to macrophages.
Fig. 2.
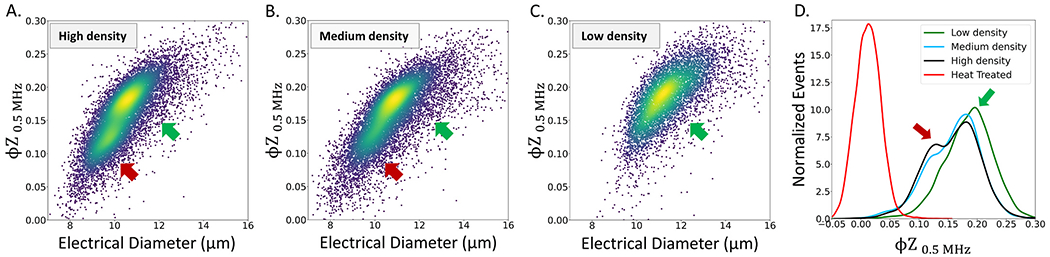
Heterogeneity in macrophage (Mac) phenotypes due to intercellular interactions as a function of cell seeding density. Scatter plot of impedance phase at 0.5 MHz (φZ0.5 MHz) versus electrical diameter of macrophages is shown at different cell seeding densities: A. High (5 × 10⁵ cells/mL), B. Medium (2 × 10⁵ cells/mL), and C. Low (1 × 10⁵ cells/mL), with 0.5 mL per well. D. Histogram of φZ0.5 MHz for control (untreated) macrophages at different cell seeding densities is compared to heat treated samples, to show stress rather than viability loss.
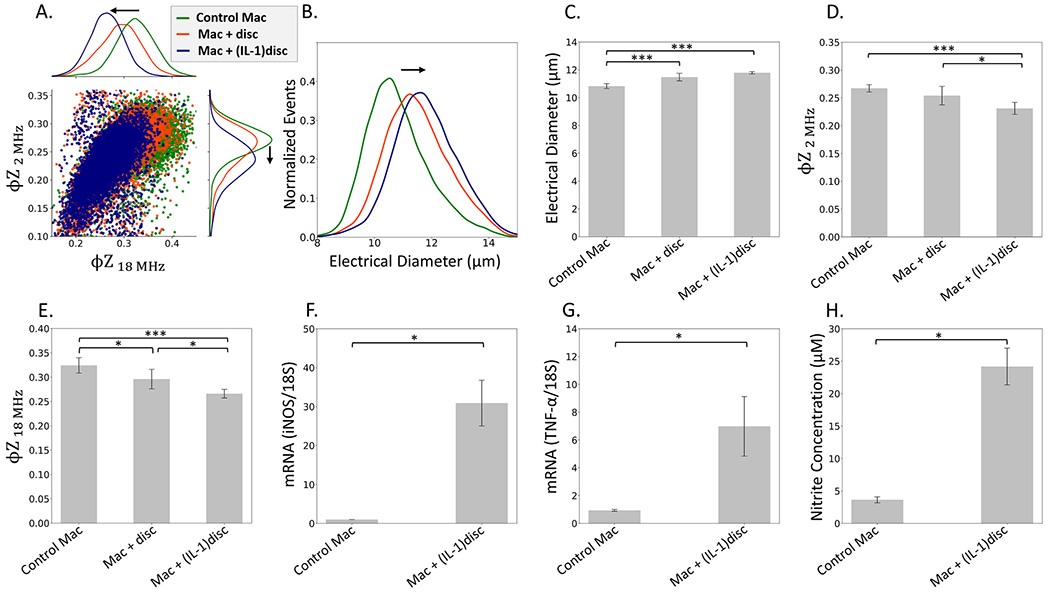
Fig. 5.
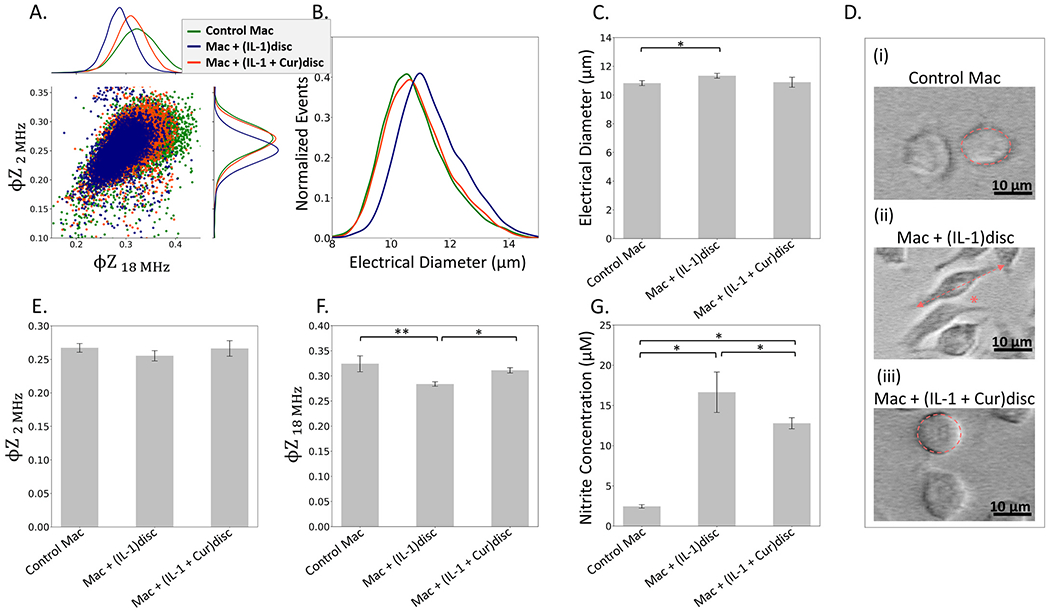
Macrophage activation by degenerated discs is reversed by curcumin treatment of discs by comparing control macrophages (Mac), Mac with discs pre-treated with IL-1β 10 ng/mL for 1 day (Mac+(IL-1)disc), and Mac with discs pre-treated with IL-1β 10 ng/mL and curcumin 10 μM for 1 day (Mac+(IL-1+Cur)disc) based on: A. Scatter plot (and histograms) of φZ2 MHz vs. φZ18 MHz show downshifting with degenerated discs and its reversal in presence of curcumin. B. Histograms of electrical diameter; Activation reversal: C. Not significant based on mean electrical diameter; but indicated by images D(i)-D(iii) and associated image analysis in Supplementary Information (Fig. S10); E. Not significant based on mean φZ2 MHz; F. Significant based on mean φZ18 MHz differences between samples (*p < 0.05 level, **p < 0.01). G. Nitrite secreted in cell culture supernatant measured using the Griess assay indicates reversal of the activation phenotype (*p < 0.05), albeit not at single-cell sensitivity. Cross-validation based on mRNA expression is shown in SI: Fig. S8.
3.2. Dose and duration-dependent LPS-activation
Activation of immune cells is known to increase their electrical diameter (Petchakup et al., 2021) and this murine macrophage cell line (Raw 264.7) exhibits increases in cell size with activation under LPS stimulation, as determined by Coulter cell size analysis at high dose and duration levels (100 ng/mL, 1 μg/mL, and 10 μg/mL for 2 days) (Saxena et al., 2003). Herein, we focus on a lower dose and duration range (100 ng/mL for 24 h, 100 ng/mL for 6 h and 10 ng/mL for 6 h). Also, since electrical diameter only measures changes to the cell exterior, whereas macrophage activation can influence morphologies of the cell membrane and its interior region, we explore impedance phase (φZ) at various frequencies, as a multiparametric index to quantify the activation in a dose and duration-dependent manner. While alterations in impedance magnitude opacity do not exhibit systematic differences with LPS stimulation (SI: Fig. S7), the φZ levels at 2 MHz and 18 MHz show systematic downshifting (Fig. 3A), while the electrical diameter () shows systematic increases (Fig. 3B) as a function of LPS stimulation dose and duration, as apparent from the significance plots in Fig. 3C–E. The activated phenotype measured by impedance is cross validated based on nitrite in the media, using the Griess assay that reflects levels averaged across the entire macrophage population. This confirms secretion of high levels of nitric oxide in media, especially after LPS stimulation at a dose of 100 ng/mL for 24 h (Fig. 3F), but the assay cannot detect significant differences at the lower dose or shorter duration. However, the impedance metrics reported here can detect the activation over lower LPS dose and duration levels, and the sensitivity of the respective metrics are compared in a later section.
Fig. 3.
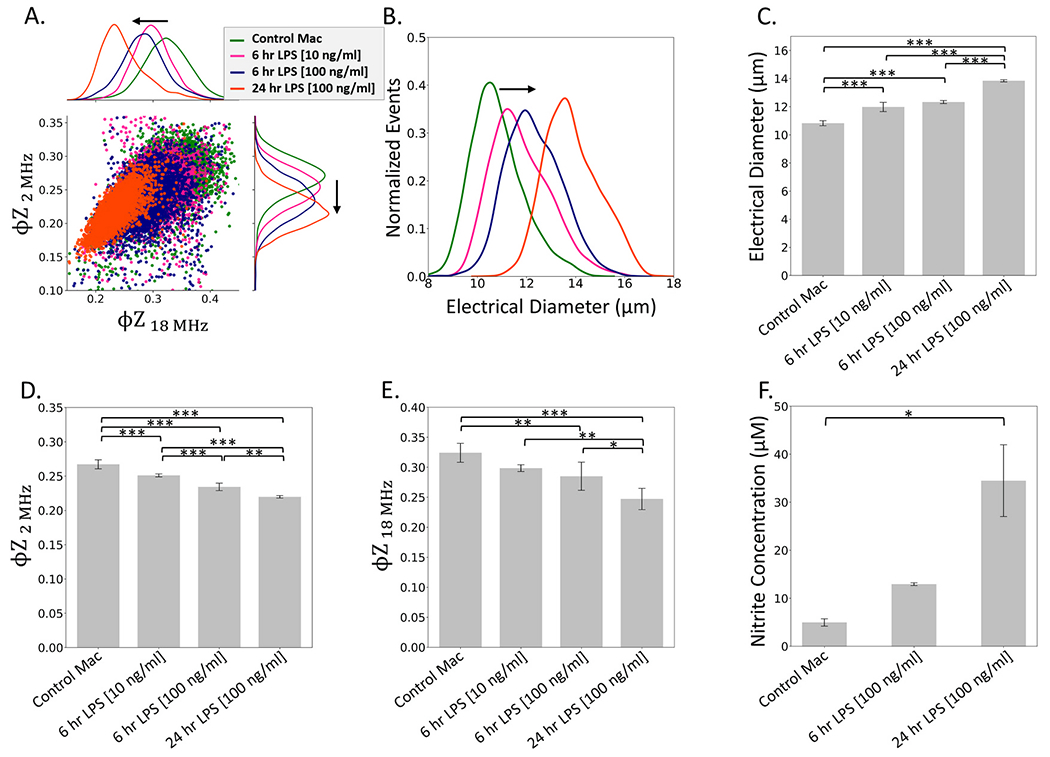
LPS dose and duration-dependent macrophage activation based on comparing control (untreated) macrophages to those treated with LPS doses of 10 ng/mL and 100 ng/mL for 6 h, and 100 ng/mL for 24 h. A. Scatter plot (and histograms) of φZ2 MHz vs. φZ18 MHz shows downshifting with activation. B. Histograms of electrical diameter; C. Mean electrical diameter shows significant differences between samples (***p < 0.001); D. Mean φZ2 MHz shows significant differences between samples (**p < 0.01 level; ***p < 0.001); E. Mean φZ18 MHz shows significant differences between samples (*p < 0.05 level; **p < 0.01 level; ***p < 0.001); F. Cross-validation based on secreted nitrite measured in culture media using the Griess assay. Polarized morphology of macrophages after 6 h LPS treatment is in SI: Fig. S9B.
3.3. IL-1 induced disc degeneration leads to macrophage activation
The pro-inflammatory cytokine, interleukin-1β (IL-1β), is highly expressed in degenerative disc tissues and is a major mediator of disc degeneration and inflammation (Le Maitre et al., 2005). For instance, direct injection of IL-1β promotes progression of degeneration in a rat lumbar disc herniation model (Kim et al., 2021) and IL-1 contributes to disc disease through degradation of extracellular matrix (Johnson et al., 2015), leading to activation through the MAPK, NF-kB and C/EBP signaling pathways (Wang et al., 2013). The resulting macrophage phenotypes have been measured based on their polarized morphology (Silva et al., 2019) and cytokine secretion profile (Takada et al., 2012). Herein, the phenotype of macrophages is compared to that after co-culture with invertebrate discs, before and after IL-1 pretreatment to induce disc degeneration. The scatter plots of single-cell macrophage events based on φZ2 MHz and φZ18 MHz metrics (Fig. 4A) show downshifting after co-culture with degenerated discs. The electrical diameter metric shows an increase for the macrophage control sample after interaction with both, untreated and IL-1 treated discs (Fig. 4B), but with no statistical significance between the two disc conditions (Fig. 4C). On the other hand, downshifting of the φZ2 MHz and φZ18 MHz metrics is systematic and statistically significant between the two disc conditions (Fig. 4D–E), indicating sensitivity to the changes in macrophage phenotype after interaction with untreated versus degenerative disc. It is also clear that in comparison to the naive macrophages (control mac), IL-1 pretreated discs significantly promote (*p < 0.05) the mRNA expression of iNOS (Fig. 4F) and TNF-α (Fig. 4G) in macrophages, and this is also apparent based on the nitrite level in the culture media (Fig. 4H). Hence, we infer that the φZ2 MHz and φZ18 MHz metrics can detect alterations in the activation state of macrophages due to degenerative discs, which resembles that obtained after LPS stimulation.
Fig. 4.
Degenerated discs stimulate macrophages (Mac) towards a pro-inflammatory phenotype based on impedance metrics, NO secretion, and inflammatory gene expression; Mac with control discs, and Mac with degenerated disc (IL-1β 100 ng/mL, 2 days). A. Scatter plot (and histograms) of φZ2 MHz vs. φZ18 MHz shows downshifting with degenerated discs to indicate activation. B. Histograms of electrical diameter; C. Mean electrical diameter shows significant differences between samples (***p < 0.001); D. Mean φZ2 MHz shows significant differences between samples (*p < 0.05 level; ***p < 0.001); E. Mean φZ18 MHz shows significant differences between samples (*p < 0.05 level,***p < 0.001). PCR analysis of inos (F) and tnf-α, (G) mRNA levels of control macrophages (Mac) and Mac with degenerated discs (IL-1 stimulation) (*p < 0.05); H. Nitrite contents in culture media using the Griess assay. The polarized macrophage morphology after co-culture with IL-1 treated discs in shown in SI: Fig. S9D.
3.4. Curcumin reverses degenerated disc-induced macrophage activation
Treatment with curcumin is known to significantly reduce IL-1α and IL-6, iNOS, COX-2 and MMP-9 levels in rats with surgically induced lumbar intervertebral disc (Hu et al., 2017) and it regulates macrophage polarization through altering cytokine expression (Chen et al., 2021). Intraperitoneal injection of curcumin is also effective in attenuating mouse lumbar radiculopathy by reducing neuroinflammation, oxidative stress and nociceptive factors (Xiao et al., 2017). The φZ2 MHz vs. φZ18 MHz scatter plots from single-cell macrophages events (Fig. 5A), confirm downshifting of their respective levels after co-culture with IL-1β pretreated discs and recovery to their original level after curcumin treatment. Also, while an increase in cell electrical diameter is observed for the macrophages after co-culture with IL-1 pretreated discs to indicate activation (Fig. 5B), the recovery after curcumin treatment is not statistically significant (Fig 5C). Images of cell morphologies (Fig. 5D(i)–5D(iii)), alongside the associated image analysis in Supplementary Information (SI: Figs. S9–S10) confirm that IL-1β induced disc degeneration promotes macrophage polarization to cause larger cell sizes (area and perimeter), higher aspect ratios and less circularity levels (*p < 0.05 vs naive macrophages). With curcumin + IL-1β pretreated discs (M0+ (IL-1+Cur) disc), these morphological changes are greatly diminished (*p < 0.05 vs mac+(IL-1) disc group). The activated macrophages (M0+(IL-1) disc) show an increase in size in comparison to the naive macrophages (Mac), which is in accordance with the increase in electrical diameter noted earlier through impedance-based analysis (Fig. 5B). The activated macrophages are more dendritic/spindle shaped, resulting in an increased perimeter and aspect ratio due to the stretched cellular extensions, and therefore a concurrent decrease in circularity in comparison to naïve macrophages (Mac). Upon treatment with curcumin (Mac+(IL-1+Cur)disc), the morphology of the macrophages more closely resembles the naive macrophages (Mac) indicating an amelioration or inhibition of activation, but these results are based on just 100 cells. On the other hand, alterations in the φZ18 MHz levels determined from automated analysis of ~10,000 events are statistically significant (Fig. 5F), but respective alterations in φZ2 MHz levels are not significant (Fig. 5E). Due to specificity of the φZ at high frequencies (>10 MHz) to interior conductivity and permittivity (SI: Figs. S5A–5B), we suggest that macrophage activation induces alterations to the intracellular regions (mitochondria, endoplasmic reticulum, and polarization of interior morphologies), which are more sensitively transduced to significant changes for φZ18 MHz, but not for φZ2 MHz, wherein cell membrane alterations have a role (SI: Figs. S4A–S4B). Nitrite secretions confirm the ability of curcumin to reverse the activation of macrophages by IL-1;β pretreated discs (Fig. 5G), while cross-validation based on mRNA expression is shown in SI: Fig. S8.
3.5. Impedance metrics indicate dose and duration-dependent macrophage activation
Macrophage activation under different environmental cues can follow a variety of signaling pathways that may involve different subcellular regions. Hence, we consider the sensitivity of our approach to assess macrophage activation in a stimulation dose and duration-dependent manner, using impedance metrics of φZ2 MHz (Fig. 6A), φZ18 MHz (Fig. 6B) and electrical diameter or (Fig. 6C).
Fig. 6.
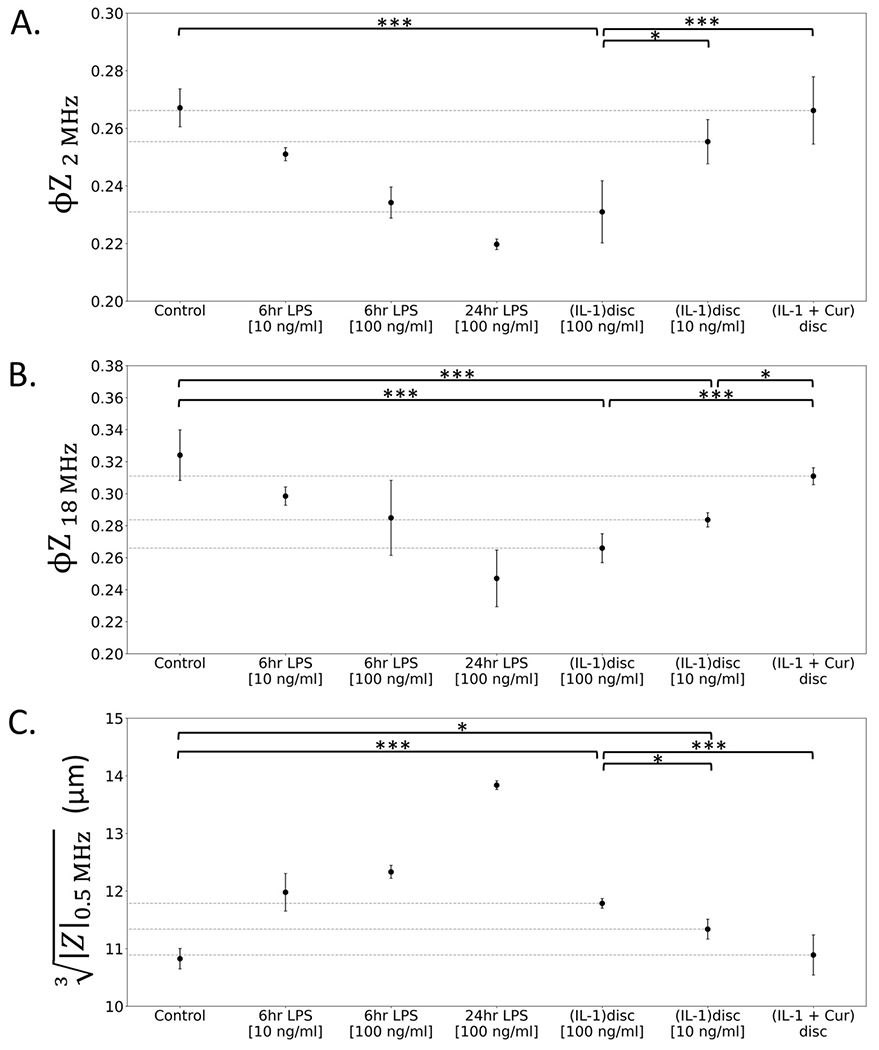
Macrophage activation at varying doses of IL-1 pretreatment and curcumin treatment to reverse the phenotype is benchmarked versus that obtained after stimulation with varying doses and duration levels of LPS, using the metrics of: A. φZ2 MHz, B. φZ18 MHz, and C. electrical diameter or to highlight the dynamic range of the sensor for quantitative comparisons (*p < 0.05 level, **p < 0.01, ***p < 0.001). The respective significance levels after LPS treatment are in Fig. 3.
All three metrics can use LPS stimulation over a range of dose and duration levels as the basis to create a progression of macrophage activation states to benchmark versus that obtained under stimulations from disc degeneration due to IL-1β. For instance, IL-1β treatment at 10 ng/mL and 100 ng/mL levels causes activation intensities that compare with LPS stimulation for 6 h at levels between 10 ng/mL and 100 ng/mL, with a good degree for correspondence for all three metrics. Systematic increases in electrical diameter are easily deduced under progressive activation with LPS (Fig. 3B–C) and this physical property can possibly be used to enrich for subpopulations with the highly activated phenotype. However, impedance phase information, which follows the RC time constant behavior of macrophage cells at each frequency is needed for subtle distinctions, such as between LPS stimulation at 10 ng/mL versus 100 ng/mL after 6 h stimulation (Fig. 3D for φZ2 MHz) and between untreated and IL-1 treated discs (Fig. 5F for φZ18 MHz). Similarly, while the metrics of electrical diameter in Fig. 6C) measuring the cell exterior, and φZ2 MHz in Fig. 6A measuring plasma membrane alterations can significantly detect differences in macrophage activation state under the two studied IL-1β doses used to cause disc degeneration (10 ng/mL and 100 ng/mL), only φZ18 MHz can detect recovery from the activated state at the lower dose (10 ng/mL) after curcumin pretreatment (Fig. 6B), likely due to the effect of macrophage polarization on organelles in the cell interior. To better understand this, we consider the dielectric simulations of φZ as a function of cytoplasmic conductivity changes (σcyto in SI: Fig. S5A), as would occur due to ion pile-up in the endoplasmic reticulum, or as a function of cytoplasmic permittivity changes (εcyto in SI: Fig. S5B), as would occur due to alterations in the mitochondrial phenotype. Based on this, φZ18 MHz is sensitive to σcyto at levels of >0.8 S/m, whereas φZ2 MHz is sensitive to σcyto at levels of <0.8 S/m. Furthermore, φZ18 MHz is sensitive to σcyto, whereas φZ2 MHz and opacity over the full frequency range (SI: Fig. S5D) do not show any sensitivity to εcyto. The φZ2 MHz and opacity levels over the full frequency range also depend on membrane properties (εmem and σmem); hence, φZ18 MHz is preferred if specificity to cell interior is required. These observations highlight the importance of the multifrequency approach to determine the appropriate set of impedance metrics that capture the full spectrum of activation for each type of stimulation, especially for cell types or stimulations with unknown activation response.
4. Conclusions and outlook
For screening immunomodulation therapies that can arrest inflammation due to macrophage infiltration for addressing chronic back pain, there is a need to quantify macrophage activation phenotypes under the relevant stimulations, with single-cell sensitivity, and in a dose and duration dependent manner. Since cytometry after staining for molecular markers relies on a particular signaling pathway to discern activation, we explore biophysical cytometry based on single-cell impedance metrics to quantify the activations in a multivariate manner over several frequencies that probe different subcellular regions. We infer that while the metric of cell electrical diameter can detect activation based on systematic increases, impedance phase metrics, particularly at high frequencies that detect phenotypes in the cell interior are needed for dose and duration dependent strategies to monitor macrophage activation by degenerated intervertebral discs and assess the effects of curcumin to reverse this activation. We envision the application of impedance cytometry to follow activation of macrophages under relevant biomimetic stimulations in a microfluidic device for in vitro screening of immunomodulation therapies to address the chronic problem of back pain and to assess immune responses to emerging transplants.
Supplementary Material
Funding sources
We acknowledge funding from University of Virginia’s Strategic Investment Fund to establish the Engineering in Medicine Program, the Launchpad Award from the Paul Manning Foundation, the University of Virginia’s Cancer Center through the NCI Cancer Center Support Grant P30 CA44579 and NIH R01AR078888.
Footnotes
CRediT authorship contribution statement
Armita Salahi: Conceptualization, Investigation, Methodology, Formal analysis, Data curation, Writing – original draft. Aditya Rane: Investigation, Methodology, Formal analysis, Data curation, Writing – original draft. Li Xiao: Investigation, Methodology, Formal analysis, Data curation, Writing – original draft. Carlos Honrado: Methodology, Data curation. Xudong Li: Supervision, Project administration, Funding acquisition. Li Jin: Conceptualization, Supervision, Project administration, Funding acquisition. Nathan S. Swami: Conceptualization, Resources, Supervision, Project administration, Funding acquisition, Writing – original draft, The manuscript was written through contributions of all authors. All authors have given approval to the final version of the manuscript.
Declaration of competing interest
The authors declare that they have no known competing financial interests or personal relationships that could have appeared to influence the work reported in this paper.
Appendix A. Supplementary data
Supplementary data to this article can be found online at https://doi.org/10.1016/j.bios.2022.114346.
References
- Abebayehu D, Spence A, Boyan BD, Schwartz Z, Ryan JJ, McClure MJ, 2017. Galectin-1 promotes an M2 macrophage response to polydioxanone scaffolds. J. Biomed. Mater. Res 105 (9), 2562–2571. [DOI] [PMC free article] [PubMed] [Google Scholar]
- An H, Yu Y, Zhang M, Xu H, Qi R, Yan X, Liu S, Wang W, Guo Z, Guo J, 2002. Involvement of ERK, p38 and NF-κB signal transduction in regulation of TLR2, TLR4 and TLR9 gene expression induced by lipopolysaccharide in mouse dendritic cells. Immunology 106 (1), 38–45. [DOI] [PMC free article] [PubMed] [Google Scholar]
- Andersson GB, 1999. Epidemiological features of chronic low-back pain. Lancet 354 (9178), 581–585. [DOI] [PubMed] [Google Scholar]
- Berghaus LJ, Moore JN, Hurley DJ, Vandenplas ML, Fortes BP, Wolfert MA, Boons GJ, 2010. Innate immune responses of primary murine macrophage-lineage cells and RAW 264.7 cells to ligands of Toll-like receptors 2, 3, and 4. Comp. Immunol. Microbiol. Infect. Dis 33 (5), 443–454. [DOI] [PMC free article] [PubMed] [Google Scholar]
- Burke JG, Watson RWG, McCormack D, Dowling FE, Walsh MG, Fitzpatrick JM, 2002. Spontaneous production of monocyte chemoattractant protein-1 and interleukin-8 by the human lumbar intervertebral disc. Spine 27 (13), 1402–1407. [DOI] [PubMed] [Google Scholar]
- Chen S, Liang H, Ji Y, Kou H, Zhang C, Shang G, Shang C, Song Z, Yang L, Liu L, Wang Y, 2021. Curcumin modulates the crosstalk between macrophages and bone mesenchymal stem cells to ameliorate osteogenesis. Front. Cell Dev. Biol 9, 27. [DOI] [PMC free article] [PubMed] [Google Scholar]
- Cheung KC, Di Berardino M, Schade-Kampmann G, Hebeisen M, Pierzchalski A, Bocsi J, Mittag A, Tárnok A, 2010. Microfluidic impedance-based flow cytometry. Cytometry 77 (7), 648–666. [DOI] [PubMed] [Google Scholar]
- Dai J, Xing Y, Xiao L, Li J, Cao R, He Y, Fang H, Periasamy A, Oberhozler J, Jin L, Landers JP, 2019. Microfluidic disc-on-a-chip device for mouse intervertebral disc—pitching a next-generation research platform to study disc degeneration. ACS Biomater. Sci. Eng 5 (4), 2041–2051. [DOI] [PMC free article] [PubMed] [Google Scholar]
- De Ninno A, Reale R, Giovinazzo A, Bertani FR, Businaro L, Bisegna P, Matteucci C, Caselli F, 2020. High-throughput label-free characterization of viable, necrotic and apoptotic human lymphoma cells in a coplanar-electrode microfluidic impedance chip. Biosens. Bioelectron 150, 111887. [DOI] [PubMed] [Google Scholar]
- Feuerer N, Marzi J, Brauchle EM, Berrio DAC, Billing F, Weiss M, Jakobi M, Schneiderhan-Marra N, Shipp C, Schenke-Layland K, 2021. Lipidome profiling with Raman microspectroscopy identifies macrophage response to surface topographies of implant materials. Proc. Natl. Acad. Sci. Unit. States Am 118 (52). [DOI] [PMC free article] [PubMed] [Google Scholar]
- Gordonov S, Hwang MK, Wells A, Gertler FB, Lauffenburger DA, Bathe M, 2016. Time series modeling of live-cell shape dynamics for image-based phenotypic profiling. Integr. Biol 8 (1), 73–90. [DOI] [PMC free article] [PubMed] [Google Scholar]
- Honrado C, Bisegna P, Swami NS, Caselli F, 2021. Single-cell microfluidic impedance cytometry: from raw signals to cell phenotypes using data analytics. Lab Chip 21 (1), 22–54. [DOI] [PMC free article] [PubMed] [Google Scholar]
- Honrado C, Michel N, Moore JH, Salahi A, Porterfield V, McConnell MJ, Swami NS, 2020. Label-free quantification of cell cycle synchronicity of human neural progenitor cells based on electrophysiology phenotypes. ACS Sens. 6 (1), 156–165. [DOI] [PubMed] [Google Scholar]
- Hoy D, March L, Brooks P, Blyth F, Woolf A, Bain C, Williams G, Smith E, Vos T, Barendregt J, 2014. The global burden of low back pain: estimates from the Global Burden of Disease 2010 study. Ann. Rheum. Dis 73 (6), 968–974. [DOI] [PubMed] [Google Scholar]
- Hu Y, Tang JS, Hou SX, Shi XX, Qin J, Zhang TS, Wang XJ, 2017. Neuroprotective effects of curcumin alleviate lumbar intervertebral disc degeneration through regulating the expression of iNOS, COX-2, TGF-β1/2, MMP-9 and BDNF in a rat model. Mol. Med. Rep 16 (5), 6864–6869. [DOI] [PubMed] [Google Scholar]
- Jacobs A, Ignarro L, 2001. LPS-induced expression of IFN-β mediates the timing of iNOS induction in RAW 264.7 macrophages. J. Biol. Chem 276, 47950–47957. [DOI] [PubMed] [Google Scholar]
- Jin L, Xiao L, Ding M, Pan A, Balian G, Sung S-SJ, Li XJ, 2021. Heterogeneous macrophages contribute to the pathology of disc herniation induced radiculopathy. Spine J. 10.1016/j.spinee.2021.10.014. [DOI] [PMC free article] [PubMed] [Google Scholar]
- Johnson ZI, Schoepflin ZR, Choi H, Shapiro IM, Risbud MV, 2015. Disc in flames: roles of TNF-α and IL-1β in intervertebral disc degeneration. Eur. Cell. Mater 30, 104. [DOI] [PMC free article] [PubMed] [Google Scholar]
- Kim H, Hong JY, Lee J, Jeon WJ, Ha IH, 2021. IL-1β promotes disc degeneration and inflammation through direct injection of intervertebral disc in a rat lumbar disc herniation model. Spine J. 21 (6), 1031–1041. [DOI] [PubMed] [Google Scholar]
- Langer R, 2010. In Islet Transplantation: Lessons Learned since the Edmonton Breakthrough, Transplantation Proceedings. Elsevier, pp. 1421–1424. [DOI] [PubMed] [Google Scholar]
- Le Maitre CL, Freemont AJ, Hoyland JA, 2005. The role of interleukin-1 in the pathogenesis of human intervertebral disc degeneration. Arthritis Res. Ther 7 (4), 1–14. [DOI] [PMC free article] [PubMed] [Google Scholar]
- Lee KC, Guck J, Goda K, Tsia KK, 2021. Toward deep biophysical cytometry: prospects and challenges. Trends Biotechnol. 39 (12), 1249–1262. [DOI] [PubMed] [Google Scholar]
- Li T, Xiao L, Yang J, Ding M, Zhou Z, LaConte L, Jin L, Dorn HC, Li X, 2017. Trimetallic nitride endohedral fullerenes carboxyl-Gd3N@ C80: a new theranostic agent for combating oxidative stress and resolving inflammation. ACS Appl. Mater. Interfaces 9 (21), 17681–17687. [DOI] [PMC free article] [PubMed] [Google Scholar]
- Lu Y, Xue Q, Eisele MR, Sulistijo ES, Brower K, Han L, Amir E.-a. D., Pe’er D, Miller-Jensen K, Fan R, 2015. Highly multiplexed profiling of single-cell effector functions reveals deep functional heterogeneity in response to pathogenic ligands. Proc. Natl. Acad. Sci. Unit. States Am 112 (7), E607–E615. [DOI] [PMC free article] [PubMed] [Google Scholar]
- McGrath JS, Honrado C, Moore JH, Adair SJ, Varhue WB, Salahi A, Farmehini V, Goudreau BJ, Nagdas S, Blais EM, Bauer TW, Swami NS, 2020. Electrophysiology-based stratification of pancreatic tumorigenicity by label-free single-cell impedance cytometry. Anal. Chim. Acta 1101, 90–98. [DOI] [PMC free article] [PubMed] [Google Scholar]
- Moore JH, Salahi A, Honrado C, Warburton C, Warren CA, Swami NS, 2020. Quantifying bacterial spore germination by single-cell impedance cytometry for assessment of host microbiota susceptibility to Clostridioides difficile infection. Biosens. Bioelectron 166, 112440. [DOI] [PMC free article] [PubMed] [Google Scholar]
- Mosser DM, Edwards JP, 2008. Exploring the full spectrum of macrophage activation. Nat. Rev. Immunol 8 (12), 958–969. [DOI] [PMC free article] [PubMed] [Google Scholar]
- Nomura F, Akashi S, Sakao Y, Sato S, Kawai T, Matsumoto M, Nakanishi K, Kimoto M, Miyake K, Takeda K, Akira S, 2000. Cutting edge: endotoxin tolerance in mouse peritoneal macrophages correlates with down-regulation of surface toll-like receptor 4 expression. J. Immunol 164 (7), 3476–3479. [DOI] [PubMed] [Google Scholar]
- Oyler-Yaniv A, Oyler-Yaniv J, Whitlock BM, Liu Z, Germain RN, Huse M, Altan-Bonnet G, Krichevsky O, 2017. A tunable diffusion-consumption mechanism of cytokine propagation enables plasticity in cell-to-cell communication in the immune system. Immunity 46 (4), 609–620. [DOI] [PMC free article] [PubMed] [Google Scholar]
- Pavillon N, Hobro AJ, Akira S, Smith NI, 2018. Noninvasive detection of macrophage activation with single-cell resolution through machine learning. Proc. Natl. Acad. Sci. Unit. States Am 115 (12), E2676–E2685. [DOI] [PMC free article] [PubMed] [Google Scholar]
- Petchakup C, Hutchinson PE, Tay HM, Leong SY, Li KHH, Hou HW, 2021. Label-free quantitative lymphocyte activation profiling using microfluidic impedance cytometry. Sensor. Actuator. B Chem 339, 129864. [Google Scholar]
- Purmessur D, Walter B, Roughley P, Laudier D, Hecht A, Iatridis J, 2013. A role for TNFα in intervertebral disc degeneration: a non-recoverable catabolic shift. Biochem. Biophys. Res. Commun 433 (1), 151–156. [DOI] [PMC free article] [PubMed] [Google Scholar]
- Salahi A, Honrado C, Rane A, Caselli F, Swami NS, 2022. Modified red blood cells as multimodal standards for benchmarking single-cell cytometry and separation based on electrical physiology. Anal. Chem 94 (6), 2865–2872. [DOI] [PMC free article] [PubMed] [Google Scholar]
- Satija R, Shalek AK, 2014. Heterogeneity in immune responses: from populations to single cells. Trends Immunol. 35 (5), 219–229. [DOI] [PMC free article] [PubMed] [Google Scholar]
- Saxena RK, Vallyathan V, Lewis DM, 2003. Evidence for lipopolysaccharideinduced differentiation of RAW264. 7 murine macrophage cell line into dendritic like cells. J. Biosci 28 (1), 129–134. [DOI] [PubMed] [Google Scholar]
- Shim S, Gascoyne P, Noshari J, Stemke Hale K, 2011. Dynamic physical properties of dissociated tumor cells revealed by dielectrophoretic field-flow fractionation. Integr. Biol 3 (8), 850–862. [DOI] [PMC free article] [PubMed] [Google Scholar]
- Silva AJ, Ferreira JR, Cunha C, Corte-Real JV, Bessa-Gonçalves M, Barbosa MA, Santos SG, Gonçalves RM, 2019. Macrophages down-regulate gene expression of intervertebral disc degenerative markers under a pro-inflammatory microenvironment. Front. Immunol 10, 1508. [DOI] [PMC free article] [PubMed] [Google Scholar]
- Spencer DC, Paton TF, Mulroney KT, Inglis TJ, Sutton JM, Morgan H, 2020. A fast impedance-based antimicrobial susceptibility test. Nat. Commun 11 (1), 1–11. [DOI] [PMC free article] [PubMed] [Google Scholar]
- Spencer D, Morgan H, 2020. High-speed single-cell dielectric spectroscopy. ACS Sens. 5 (2), 423–430. [DOI] [PubMed] [Google Scholar]
- Spiller DG, Wood CD, Rand DA, White MR, 2010. Measurement of single-cell dynamics. Nature 465 (7299), 736–745. [DOI] [PubMed] [Google Scholar]
- Sun T, Morgan H, 2010. Single-cell microfluidic impedance cytometry: a review. Microfluid. Nanofluidics 8 (4), 423–443. [Google Scholar]
- Taciak B, Białasek M, Braniewska A, Sas Z, Sawicka P, Kiraga Ł, Rygiel T, Król M, 2018. Evaluation of phenotypic and functional stability of RAW 264.7 cell line through serial passages. PLoS One 13 (6), e0198943. [DOI] [PMC free article] [PubMed] [Google Scholar]
- Takada T, Nishida K, Maeno K, Kakutani K, Yurube T, Doita M, Kurosaka M, 2012. Intervertebral disc and macrophage interaction induces mechanical hyperalgesia and cytokine production in a herniated disc model in rats. Arthritis Rheum. 64 (8), 2601–2610. [DOI] [PubMed] [Google Scholar]
- Vogel DY, Glim JE, Stavenuiter AW, Breur M, Heijnen P, Amor S, Dijkstra CD, Beelen RH, 2014. Human macrophage polarization in vitro: maturation and activation methods compared. Immunobiology 219 (9), 695–703. [DOI] [PubMed] [Google Scholar]
- Wang J, Tian Y, Phillips KL, Chiverton N, Haddock G, Bunning RA, Cross AK, Shapiro IM, Le Maitre CL, Risbud MV, 2013. Tumor necrosis factor α–and interleukin-1β–dependent induction of CCL3 expression by nucleus pulposus cells promotes macrophage migration through CCR1. Arthritis Rheum. 65 (3), 832–842. [DOI] [PMC free article] [PubMed] [Google Scholar]
- Xiao L, Ding M, Fernandez A, Zhao P, Jin L, Li X, 2017. Curcumin alleviates lumbar radiculopathy by reducing neuroinflammation, oxidative stress and nociceptive factors. Eur. Cell. Mater 33, 279. [DOI] [PMC free article] [PubMed] [Google Scholar]
- Zhou Y, Zhang T, Wang X, Wei X, Chen Y, Guo L, Zhang J, Wang C, 2015. Curcumin modulates macrophage polarization through the inhibition of the toll-like receptor 4 expression and its signaling pathways. Cell. Physiol. Biochem 36 (2), 631–641. [DOI] [PubMed] [Google Scholar]
Associated Data
This section collects any data citations, data availability statements, or supplementary materials included in this article.