

Abstract
Objective
Necrotizing enterocolitis (NEC) is the most prevalent gastrointestinal emergency in premature infants and is characterized by a dysfunctional gut microcirculation. Therefore, there is a dire need for in vivo methods to characterize NEC‐induced changes in the structure and function of the gut microcirculation, that is, its vascular phenotype. Since in vivo gut imaging methods are often slow and employ a single‐contrast mechanism, we developed a rapid multicontrast imaging technique and a novel analyses pipeline for phenotyping the gut microcirculation.
Methods
Using an experimental NEC model, we acquired in vivo images of the gut microvasculature and blood flow over a 5000 × 7000 μm2 field of view at 5 μm resolution via the following two endogenous contrast mechanisms: intrinsic optical signals and laser speckles. Next, we transformed intestinal images into rectilinear “flat maps,” and delineated 1A/V gut microvessels and their perfusion territories as “intestinal vascular units” (IVUs). Employing IVUs, we quantified and visualized NEC‐induced changes to the gut vascular phenotype.
Results
In vivo imaging required 60–100 s per animal. Relative to the healthy gut, NEC intestines showed a significant overall decrease (i.e. 64–72%) in perfusion, accompanied by vasoconstriction (i.e. 9–12%) and a reduction in perfusion entropy (19%)within sections of the vascular bed.
Conclusions
Multicontrast imaging coupled with IVU‐based in vivo vascular phenotyping is a powerful new tool for elucidating NEC pathogenesis.
Keywords: gut, imaging, intestinal vascular unit, intestine, intrinsic optical signals, IVU, laser speckle, microcirculation, multicontrast, necrotizing enterocolitis (NEC), widefield
1. INTRODUCTION
Necrotizing enterocolitis (NEC) is one of the most prevalent and devastating gastrointestinal (GI) emergencies in premature infants, 1 , 2 with an estimated mortality of 12%–42%. 3 , 4 NEC is characterized by the acute development of necrosis in portions of the small and large intestine, and a loss of intestinal blood flow. 5 While the pathogenic mechanisms that lead to NEC are not fully understood, it is thought to arise when intraluminal bacteria pass through an injured intestinal epithelial barrier and proliferate within the intestinal wall. 6 Hackam and colleagues have shown that disruption of the normally impermeant intestinal barrier occurs via the activation of the lipopolysaccharide (LPS) receptor toll like receptor 4 (TLR4) on the intestinal epithelium by colonizing bacteria, leading to intestinal epithelial apoptosis and necroptosis, and impaired repair mechanisms. TLR4 is expressed at significantly greater levels in the premature intestine when compared to the full‐term bowel, therefore, predisposing the neonatal intestine to excessive levels of inflammation that could lead to NEC after bacterial colonization. 7 Moreover, the activation of TLR4 on the endothelium of the blood vessels within the intestinal mesentery inhibits the production of endothelial nitric oxide synthase (eNOS), thus generating lower levels of the dominant intestinal vasodilator nitric oxide (NO), 8 , 9 which leads to profound vasoconstriction and the subsequent development of intestinal ischemia. 10 These alterations progressively worsen as diminishing blood flow creates a two‐pronged insult: it decreases eNOS levels and restricts production of the vasodilator NO 8 , 9 while increasing the production of endothelin‐1 (ET‐1), a potent intestinal vasoconstrictor. 11 , 12 These changes collectively result in a catastrophic loss of perfusion and the eventual necrosis of portions of the neonatal intestine. Given the vital role of the abnormal microvasculature and dysregulated perfusion in the initial steps that lead to NEC, in vivo techniques that enable structural and functional phenotyping of the intestinal microcirculation are crucial for understanding the origins of this complex disease, and may help identify novel preventative or treatment strategies.
Despite this need for accurate assessment of the vascular architecture and function in NEC, only single‐contrast imaging techniques have been used to phenotype NEC‐induced vascular dysregulation in vivo. Limited to interrogating a single physiological variable, such techniques must prioritize visualizing either the abnormal vascular morphology of the intestine or changes in perfusion. Consequently, these approaches broadly fall into two categories: those with high spatial resolution for imaging microvascular structure, and those with lower spatial resolution for assessing microvascular function. For example, the landmark studies by Downard et al 13 and Ito et al 14 used high spatial resolution (i.e., ~0.3–0.5 μm 14 ) epi‐illuminated optical microscopy to demonstrate that the NEC vascular phenotype was characterized by vasoconstriction of 1A and 3A gut vessels, and reduced functional microvessel density in 3A, capillary and CV vessels. Here, the 1A, 3A, and CV nomenclature refers to vascular segments of the intestinal microcirculation according to the convention developed by Gore and Bohlen. 15 While these studies used high spatial resolutions (e.g., 0.3–0.5 μm) to track individual erythrocytes within a network of intestinal microvessels and quantify their diameters, they only permitted a discrete classification of blood flow due to limitations of the erythrocyte counting technique. Moreover, this approach was incapable of quantifying blood flow in large microvessels (i.e., in 1A/V and larger) because erythrocyte crowding in such vessels can preclude useful perfusion quantification. In contrast, low spatial resolution approaches such as Doppler flowmetry techniques can quantify intestinal perfusion, 16 , 17 , 18 , 19 but cannot resolve microvascular morphology. Overall, single‐contrast imaging does not permit the direct correlation of morphological changes of the intestinal vasculature with changes in perfusion, thereby preventing a complete assessment of NEC pathogenesis. Additionally, erythrocyte‐tracking based techniques are labor‐, time‐ and equipment intensive, 13 , 14 which makes them unsuitable for high‐throughput experiments. Finally, the dearth of cutting‐edge image processing and visualization tools analogous to those used for neuroscience or cardiology research has limited our ability to efficiently assess and summarize NEC‐induced changes in the vascular phenotype.
To circumvent these limitations, we developed a two‐step approach that enabled high‐throughput in vivo vascular phenotyping in an experimental NEC model in mice. The key features of our imaging technique involved the following: (i) a fast (i.e., 100 s total acquisition time) multicontrast in vivo imaging technique that creates maps of vascular morphology and perfusion and (ii) a novel quantification and visualization pipeline dubbed “intestinal vascular unit (IVU) analysis” to efficiently characterize the NEC‐induced vascular alterations. To do this, we combined two complementary widefield optical imaging techniques for quantifying NEC‐induced changes in intestinal microvascular morphology and blood flow in vivo over a 5000 × 7000 μm field of view (FoV) at 5 μm spatial resolution. The first, “intrinsic optical signal (IOS)” imaging relies on the absorption of light by erythrocyte‐bound hemoglobin to visualize vessel morphology, 20 and the second, “laser speckle contrast (LSC)” imaging on the statistical properties of erythrocyte motion within blood vessels to map blood flow. 21 Both techniques rely on endogenous contrast mechanisms that do not require the administration of a contrast agent or dye, thereby simplifying the experimental protocol and minimizing physiological injury to the animal. Additionally, this multicontrast approach eliminates the need for labor‐intensive vessel tracking or erythrocyte counting and permits the acquisition of vessel morphology and blood flow images within 60–100 s per animal.
Next, to conveniently characterize the intestinal microcirculation, we introduced a novel visualization technique that transformed images of the convoluted intestine into a rectilinear “flat map.” Then, for the purposes of quantification, in accordance with intestinal vascular anatomy, we identified recurring microvascular units along the length of the flattened intestine which we dubbed “intestinal vascular units” or IVUs. Each IVU consists of an 1A/V artery–vein pair following the Gore and Bohlen convention, 15 and their vascular sprouts. Analogous to the concept of the “neurovascular unit” that identifies the smallest functional unit of the brain, 22 , 23 IVUs represent the smallest identifiable vascular unit responsible for maintaining the gut's perfusion and permit the characterization of NEC‐induced vascular dysfunction in a physiologically meaningful framework. Moreover, as NEC often manifests as patchy ischemic lesions in the intestine, 24 , 25 , 26 spatial mapping of morphological and functional vascular parameters into a common IVU‐space proved to be a useful tool for assessing the spatial heterogeneity of the vascular phenotype. Collectively, our rapid multicontrast imaging approach in conjunction the IVU‐based visualization and quantification pipeline constitute a powerful new tool for high‐throughput in vivo vascular phenotyping of NEC‐induced alterations. Moreover, this approach is easily applicable to other GI diseases characterized by a dysfunctional microcirculation.
2. MATERIALS AND METHODS
2.1. Animal preparation
All animal experiments were conducted in accordance with approved Johns Hopkins University Animal Care and Use Committee (JHU ACUC) protocols. The Johns Hopkins University animal facility is accredited by the American Association for the Accreditation of Laboratory Animal Care and meets the National Institutes of Health (NIH) standards as set forth in the “Guide for the Care and Use of Laboratory Animals.” Imaging was conducted on 11 C57/BL6 mouse pups weighing 3–4 g at 11 days of life (i.e., P11). The groups comprised of healthy (2 males, 3 females) and NEC (3 males and 3 females) mice. Mice in the healthy group were breast fed and separated from their dam 4 h before imaging to allow their GI tracts to empty. Mice in the NEC group underwent a 4‐day NEC induction protocol which included formula feeding in place of breast milk, intermittent hypoxia, and administration of bacteria cultured from the intestinal tract of a patient with severe NEC, on Days 7–10 from birth as described by us previously. 27
Prior to imaging, anesthesia was administered by placing each mouse in a transparent induction box infused with 3–5% isoflurane in room air. After the mouse was anesthetized (i.e., did not exhibit any spontaneous movements other than respiration), it was removed from the induction box and placed on an imaging stage and maintained at 1.5–2.5% isoflurane anesthesia administered via a nose cone. The mouse was then secured to the imaging platform and its abdomen swabbed with betadine antimicrobial solution. A 1 cm incision was then made in the abdomen along the midline using sterile surgical instruments. Next, using forceps and a cotton tip applicator, a single loop of the mouse's small intestine was eviscerated from the abdomen and placed flat on a glass coverslip for in vivo imaging. Widefield IOS and LSC imaging of the exposed intestine were conducted as described below. During the 60–100 s of image acquisition, the animal's respiration rate was monitored, and the anesthetic dose adjusted as necessary. Three mice (2 healthy and 1 NEC) were excluded from the study due to surgery‐related complications. Following in vivo imaging, all mice were euthanized by cervical dislocation.
2.2. In vivo imaging protocol
Figure 1A shows a schematic of the imaging system. A light emitting diode (LED, center wavelength = 570 nm; LEDSupply Inc.) coupled to a bandpass filter (570 ± 5 nm; Thorlabs Inc.), and a He‐Ne laser (LS, center wavelength = 632.8 nm; Thorlabs) provided the illumination for IOS and LSC imaging, respectively. Light back scattered or reflected from the exposed intestine was collected via a lens set (AF Micro Nikkor 60 mm 1:2.8D; Nikon Instruments Inc.) and focused onto a charge coupled device image sensor (CCD camera, Infinity 3; Lumenera). Images were acquired over a 5000 × 7000 μm FoV with an in‐plane resolution of 5 μm using a custom written MATLAB® program (MathWorks Inc) running on a PC. All acquired images were stored offline for subsequent post‐processing.
FIGURE 1.
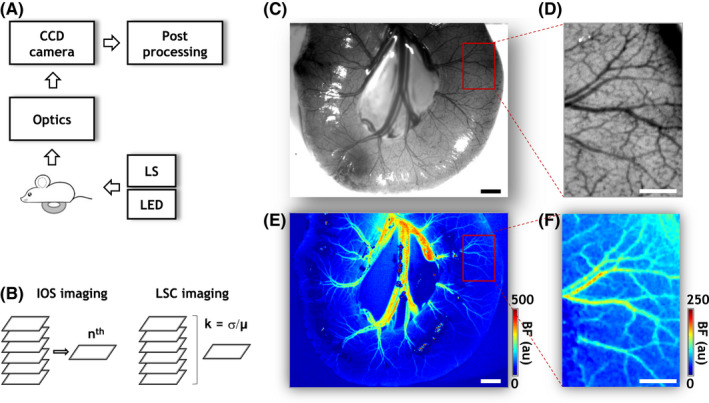
Rapid multicontrast in vivo imaging of intestinal vascular morphology and perfusion. (A) Schematic of the experimental setup. A portion of the intestine of an anesthetized mouse pup was surgically exposed and laid on a on a glass coverslip for in vivo imaging. Two light sources, a 570 nm LED, and a He‐Ne laser (LS), were used for sequentially illuminating the exposed intestine, and the backscattered light was collected through focusing optics onto a charge coupled device (CCD) image sensor. In vivo mages were acquired over a wide (5000 × 7000 μm) FoV at 5 μm spatial resolution and were stored and processed offline. (B) Illustration of the image acquisition strategy. Multiple images were acquired under LED and LS illumination. Images acquired under LED illumination are called “intrinsic optical signal” (IOS) images and enable visualizing the microvascular architecture via light absorption by erythrocyte‐bound hemoglobin acting as an endogenous contrast agent. Since microvasculature in an IOS image can be blurred by breathing related motion, multiple IOS images were acquired in quick succession, and a motion‐free IOS image (indicated by the n th image) selected. Images acquired under laser (LS) illumination allowed measurements of in vivo blood flow (BF) by exploiting the motion of erythrocytes within microvessels as an endogenous contrast agent. Here, orderly erythrocyte motion gave rise to fluctuations in the backscattered laser light which were then quantified via the ratio (k) of the time domain standard deviation (σ) and mean (μ) of light intensity at each pixel of the image stack acquired under LS illumination. Here, “k” is known as the laser speckle contrast (LSC) and is inversely proportional to the blood flow. (C, E) Maps of vascular architecture and blood flow in a portion of healthy intestine, respectively. (D, F) Magnified (×4) views of the microvascular architecture and in vivo blood flow for the ROI indicated in (C) and(E) (red rectangle). The contrast in (D) was normalized and scaled to enhance the vascular architecture for visualization purposes. “au” stands for arbitrary units. Scale bars in (C, E and D), (F) represent 500 and 200 μm, respectively
The intestinal microvasculature was brought into focus under LED illumination. Since the dominant light absorbing species in biological tissue, that is, oxy‐ and deoxy‐hemoglobin, exhibit similar levels of absorption at 570 nm, 20 the light intensity at each pixel in the IOS image was inversely proportional to its total hemoglobin concentration (HbT). Assuming a constant hematocrit, HbT can be employed as a surrogate of the underlying tissue blood volume and exploited for imaging the morphology of perfused intestinal microvessels. Since motion artifact due to breathing can blur IOS images, we acquired 20 IOS images in rapid succession at an exposure time of 100 ms each, so that we could select a motion‐free IOS image (Figure 1B).
Subsequently, a stack of 200 images was acquired in quick succession at an exposure time of 100 ms each, under 632.8 nm laser illumination. As shown schematically in Figure 1B, the relative intestinal blood flow was estimated on a continuous scale in arbitrary units (a.u.) using Equation 1, 21 :
| (1) |
where x and y are pixel co‐ordinates, and σ and μ the standard deviation and mean of the scattered laser light intensity computed from the 200 images for location (x, y).
2.3. Transformation of intestinal images into “flat maps”
Feeder vessels of the intestinal mesentery were manually identified as belonging to the intestinal macrocirculation based on their location and anatomical appearance. After these vessels branched and entered the intestinal wall, they were classified as belonging to the intestinal microcirculation (Figure 2A), and regions‐of‐interest (ROI) manually identified for each intestinal sample. Next, the “straighten” plugin in the image processing freeware FIJI 28 , 29 was used to “unwrap” the image of the convoluted intestine into a rectilinear space, which resulted in a “flat map” for visualizing the microvasculature (Figure 2B). To minimize motion‐induced misalignments, flat maps of the LSC‐derived blood flow were co‐registered with their IOS counterpart using a rigid body transformation (Figure 2C). Finally, masks were created for each IOS and LSC flat map to exclude any pixels that exhibited glare or bleeding from subsequent analyses.
FIGURE 2.
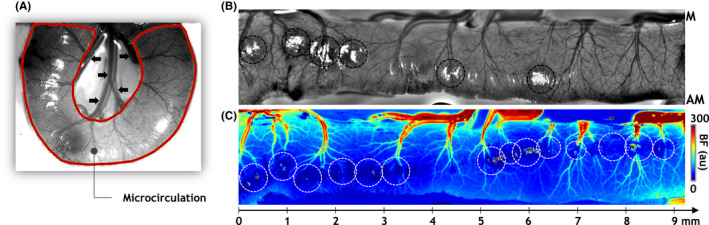
“Flat map” transformation of the intestinal microcirculation. (A) Using widefield images, the intestinal microcirculation was segmented. An IOS image of a section of healthy intestine is shown with the intestinal microcirculation ROI indicated by a brown outline. Here, the macrocirculation was defined as the collection of larger diameter vessels at the center of the convoluted intestine (black arrowheads). (B, C) A “flat map” transformation of microvascular architecture and in vivo blood flow (BF) for the microcirculation ROI identified in (A). A linear “x‐axis” with millimeter tick marks is also illustrated, highlighting our ability to visualize the vascular phenotype along the length of the flattened intestine. “M” and “AM” indicate the “mesenteric” and “anti‐mesenteric” ends of the intestine. The contrast in (B) was normalized and scaled to enhance the vascular architecture for visualization purposes. “au” stands for arbitrary units. Image pixels exhibiting glare or excessive noise (black and white hashed circles in (B) and (C)) were excluded from all analyses
2.4. Computation of structural and functional metrics for characterizing the vascular phenotype
Microvessels were segmented from IOS flat maps using the interactive machine learning‐based freeware, Ilastik. 30 To characterize vessel morphology, maps of blood vessel center lines (i.e., skeletonized images), and Euclidian distance from each intra‐vessel pixel to the nearest blood vessel boundary were generated using the appropriate FIJI functions. These two maps enabled the characterization of the morphology of each microvessel segment. Next, the spatial distribution of each morphological metric was assessed by overlaying a 150 × 150 μm resolution spatial grid on the flat map and for each grid element computing: (a) the average vessel diameter (Dia); (b) the vessel length density per mm2 (VLD); and (c) the vessel segment density per mm2 (VSD).
Analogously, the spatial distributions of the average blood flow (BF) and blood flow entropy (E BF) were assessed on the same spatial grid. Here, E BF was computed to illustrate the heterogeneity of the intestinal blood flow within each grid element. Initially, blood flow in the 0th–99th percentile range for each flat map was normalized and subdivided into 30 bins. For each grid element, the probability of observing a given blood flow within each bin was calculated. Finally, E BF was computed for each grid element using the Shannon entropy formula 31 :
| (2) |
where, P i is the probability of observing blood flow levels in the i th bin within that grid element, and log is the natural logarithm.
2.5. Identification and visualization of the intestinal vascular unit (IVU)
IVUs were defined as repetitive units of the gut microcirculation along the length of each IOS flat map. Each IVU consisted of a major vascular tree that traversed the intestinal flat map from the mesenteric (M) to anti‐mesenteric (AM) end, that is, it comprised of an 1A/V artery–vein pair as defined by the Gore and Bohlen nomenclature 15 and included their smaller vessel branches. Next, the “irrigation territory” of each IVU was identified within the 150 × 150 μm spatial grid using a seed‐based approach. In this approach, “seed points” corresponding to each IVU were manually identified (yellow dots, Figure 4A), with each grid element being ascribed to the IVU corresponding to the nearest seed‐point. IVUs exhibiting <5% of the area of the largest IVU in each animal were omitted from further analysis. Subsequently, IVUs were used to generate 2D maps illustrating the spatial distribution of morphological and functional vascular parameters for healthy and NEC intestines.
FIGURE 4.
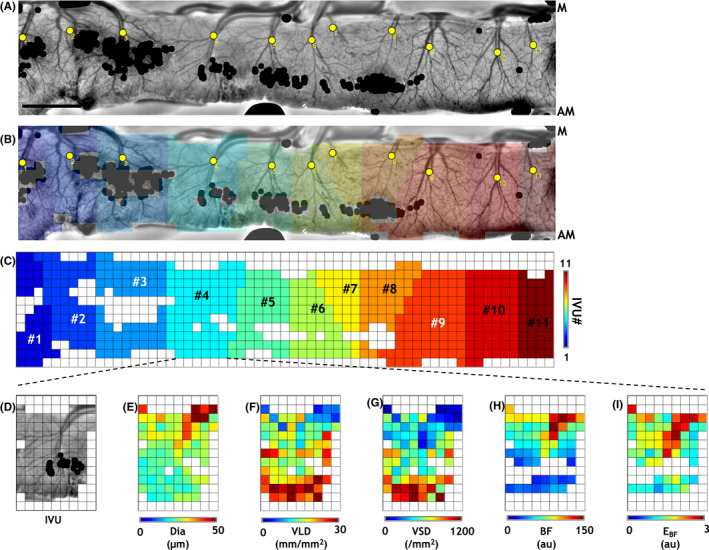
Identification and characterization of “intestinal vascular units” (IVUs). (A) For further analysis, we subdivided the intestinal flat maps into distinct “intestinal vascular units” (IVUs). Individual IVUs were identified by manually placing “seed points” (yellow dots in (A)) corresponding to each IVU and applying a spatial parcellation algorithm. (B) Flat map illustrating the IVUs (colors) identified in (A). (C) IVUs (colors) identified in (A) after resampling on a 150 × 150 μm spatial grid. For clarity, IVUs were separately illustrated in (C) and numbered from left to right. (D–I) IOS image illustrating a representative IVU (#4 in (C)), and corresponding parametric maps describing the morphological (Dia, diameter; VLD, vessel length density; and VSD, vessel segment density) and functional (BF, mean blood flow; E BF, blood flow entropy) vascular phenotypes. Pixels exhibiting glare or excessive noise in (A) were masked (black dots in (A, B)) and excluded from analyses. “M” and “AM” indicate the “mesenteric” and “anti‐mesenteric” ends of the intestine. Scale bar in (A) represents 1 mm. Please refer to Figure S1 for a detailed illustration of the workflow
2.6. Spatial alignment of IVUs and generation of radially computed parametric plots
For each IVU, the co‐ordinates of its largest diameter vessel segment were assigned as the origin on the 150 × 150 μm resolution spatial grid. Next, for each IVU, plots were generated to visualize the change in each vascular metric (i.e., Dia, VLD, VSD, BF, E BF) as a function of its radial distance from the origin. To enable intra‐ and inter‐IVU comparisons, the origins of all the IVUs were aligned and misregistration errors reduced by considering radial distances in steps of 300 μm from the origin.
2.7. Visualization of the IVU in NEC and healthy gut
Images of the IVUs within each group were combined and maps generated to visualize the average spatial distribution of each vascular metric for healthy and NEC IVUs. Using the NCSS2021 Data Analysis software (NCSS LLC, UT), statistical comparisons were performed to ascertain whether there was a significant difference between the vascular metrics of the healthy and NEC IVUs within each radial distance bin using an unbalanced two‐factor ANOVA test (⍺ = 0.05) where intra‐animal groupings were specified as a nested variable.
2.8. Hierarchical clustering of the gut's vascular phenotype using IVU‐derived vascular parameters
For each gut sample, we computed mean parametric plots based on their constituent IVUs. Next, vascular parameters that were significantly different between the healthy and NEC groups were converted to z‐scores, and clustered using an unsupervised, unweighted pair‐group approach (NCSS 2021 statistical analysis software) to determine if these vascular parameters were sufficient to stratify the gut samples based on their vascular phenotype. To visualize the results of the clustering, a double‐dendrogram was used in which the parameters characterizing the in vivo vascular phenotype were assigned to rows and gut samples to columns. The heat map aids in the visualization of the z‐scores for each gut sample and vascular parameter. Clustering of (i) gut samples based on their vascular phenotype; and (ii) vascular parameters based on their distributions among gut samples, are shown by the dendrograms above and to the left of the heat map, respectively.
2.9. Quantification of blood flow (BF) changes in the macrocirculation
Since we prioritized in vivo imaging of intestinal microvessels to characterize NEC‐induced changes in the microcirculation, the acquired images contained limited coverage of the macrocirculation. This limited our analysis to the computation of the average macrocirculatory BF in each animal. A two‐tailed Student's t‐test (⍺ = 0.05) was used to determine if differences in the macrocirculatory BF between healthy and NEC groups were significant.
3. RESULTS
3.1. A rapid multicontrast technique for imaging vessel morphology and perfusion
Our custom‐built imaging system (Figures 1A,B) and multicontrast imaging strategy enabled interrogation of both the microvascular morphology (Figures 1C,D) and blood flow (Figures 1E,F) of the intestine in a 5000 μm × 7000 μm FoV at 5 μm spatial resolution. In contrast to previous time‐intensive, single‐contrast in vivo imaging techniques, 13 , 14 only 60–100 s were needed for acquiring multicontrast images from each animal. Figure 1C shows a map of the vessel architecture in a healthy intestine acquired with IOS imaging, and an ROI within it shown at a higher (~4×) magnification (Figure 1D). These in vivo maps showcase our ability to identify aspects of the intestinal circulation over a wide class of vessels ranging from terminal small arteries of the superior mesenteric artery (SMA) and their corresponding small veins (~100–200 μm) all the way down to intestinal microvessels (~10 μm). In contrast to previous studies by Downard and Ito, 13 , 14 concurrent LSC imaging enabled the assessment of in vivo blood flow in large and small diameter vessels in the neonatal intestine without the need for laborious erythrocyte counting techniques (Figure 1E). For comparison, Figure 1F shows the in vivo blood flow map corresponding to the ROI in Figure 1D. While we cannot resolve microvessels with diameters below 5 μm due to the limits imposed by the spatial resolution of the imaging system (e.g., in Figure 1D), the perfusion in these unresolved smaller diameter microvessels was still quantifiable as the “background” blood flow in LSC‐derived blood flow maps (e.g., in Figure 1F). Overall, this multicontrast imaging approach enabled the comprehensive and rapid in vivo characterization of healthy and NEC intestinal vascular phenotypes without the need for administering any contrast agents or dyes.
3.2. A novel “flat map” approach for visualizing the intestinal microcirculation
We next sought to extract microcirculatory data across the length of the intestine using a “flat map” approach. As shown in Figure 2A, widefield images enabled convenient extraction of the intestinal microcirculation (i.e., the ROI identified by the brown outline). However, the heterogeneous, convoluted appearance of the eviscerated intestine loop posed a significant hurdle for comparing across multiple intestinal samples. Therefore, to successfully compare microcirculatory differences between healthy and NEC intestines, we developed a novel “flat map” visualization. Here, “flattening” each image of the convoluted intestine (Figure 2A) into a rectilinear map permitted an intuitive and convenient basis for subsequent analyses of its microvascular morphology and blood flow. Figures 2B,C illustrate representative “flat maps” of microvessel morphology and blood flow for a portion of healthy intestine, highlighting our ability to characterize the vascular phenotype along the length of the intestinal FoV. Importantly, these flat maps constituted a robust basis for quantifying the spatial distribution of structural and functional vascular parameters across the intestinal FoV. Figures 3A,B, summarize our flat map‐based workflow for computing morphological and functional metrics of the intestinal microcirculation. Briefly, the IOS flat map (Figure 3C) was first thresholded to generate a binary flat map of segmented vessels (Figure 3D), which was then eroded to create a vessel skeleton map (Figure 3E), and a map of the Euclidian distance from the vessel centerline to the nearest vessel edge for each vascular pixel (Figure 3F). Overlaying a 150 μm × 150 μm spatial grid on these images permitted the computation of maps showing the spatial distribution of vessel diameter (Dia, Figure 3G), vessel length density (VLD, Figure 3H), and vessel segment density (VSD, Figure 3I). Analogously, from the in vivo blood flow flat map (Figure 3J), we computed the spatial distribution of blood flow (BF, Figure 3K) and the entropy of the blood flow (E BF, Figure 3L) to characterize the functional phenotype of the intestinal vasculature.
FIGURE 3.
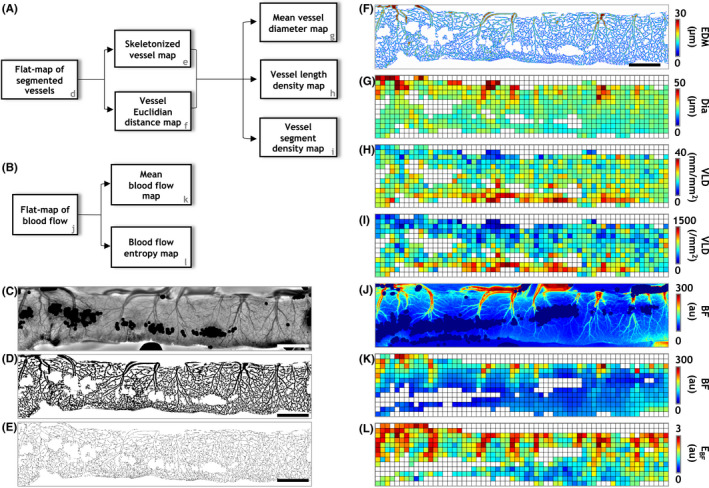
Computation of structural and functional vascular metrics. Image processing pipelines for quantifying the in vivo (A) structural and (B) functional vascular phenotypes. To quantify the structural phenotype, the IOS flat map (C) was used to generate (D) a binary vessel mask (i.e., a segmented vessel flat map), from which a vessel skeleton map (E) and Euclidian distance map (F) were generated. Next, the data from these maps was used to generate spatial distributions of mean vessel diameter (Dia, G), vessel length density (VLD, H) and vessel segment density (VSD, I) in a 150 × 150 μm grid to holistically characterize the structural vascular phenotype. Similarly, to characterize the functional phenotype, spatial distributions of mean blood flow (BF, K) and blood flow entropy (E BF, L) were computed after co‐registering the blood flow flat map to its IOS counterpart (J). Scale bars in (C‐E) represent 1 mm
3.3. The intestinal vascular unit (IVU)
To further characterize the intestinal vascular phenotype, we introduced the concept of the intestinal vascular units or IVUs, which were identified as repetitive units of the gut microcirculation along the length of the intestinal flat map (see workflow summarized in Figure S1). Figures 4A–C illustrate how the intestinal flat map was transformed into an ensemble of IVUs by overlaying a coarse (150 × 150 μm) spatial grid. Here, IVUs were identified (Figure 4C) by applying a spatial parcellation (Figure 4B) algorithm that relied on manually placed seed pixels (yellow dots, Figures 4A,B). Extracting the spatial distributions of vascular metrics (i.e., Dia, VLD, VSD, BF, and E BF) corresponding to each IVU constituted the basis for comparisons of the vascular phenotypes between healthy and NEC intestines. Figure 4E–I illustrate these parametric maps for a representative IVU (Figure 4D). Figure S1 illustrates the pipeline for IVU identification and quantification.
3.4. Morphological characteristics of healthy vs NEC IVUs
Combining healthy (n = 29) and NEC (n = 64) IVUs permitted us to visualize the average distribution of vascular metrics for the IVUs in each group (Figures 5A,B,D,E,G,H). Prior to computing the average, individual IVUs were aligned by making the co‐ordinates of their origins coincide. The IVU origin is indicated by the hashed crosshairs in each vessel metric map in Figure 5. Via these parametric maps one can immediately appreciate the reduction in vessel diameters (Dia) and increase in vessel lengths and segment densities (i.e., VLD and VSD) with increasing radial distance from the IVU origin. These parametric maps present a simple yet powerful tool for qualitatively comparing the vessel morphology phenotype between healthy and NEC IVUs. Plots quantifying the variation of each vessel metric as a function of its radial distance from the IVU origin are shown alongside their corresponding spatial maps (Figure 5C,F,I). Using a two‐factor ANOVA test that accounted for intra‐animal variations, we found that the NEC IVUs exhibited significantly lower vessel diameters than healthy IVUs closest to the IVU origin (Figure 5C). These corresponded to diameters of 30.4 ± 3.7 μm vs 34.6 ± 5.9 μm at 0–300 μm from the origin, and 24.5 ± 2.3 μm vs 27.0 ± 3.0 μm at 600–900 μm from the origin for NEC and healthy IVUs, respectively. However, NEC IVUs were indistinguishable from their healthy counterparts in terms of their vessel length density (Figure 5F) and vessel segment density (Figure 5I) distributions. Collectively, these results indicate that narrowing of microvessels was the predominant vascular change in NEC pathogenesis (see Table S1 for a summary of significant NEC‐induced changes in the vascular phenotype).
FIGURE 5.
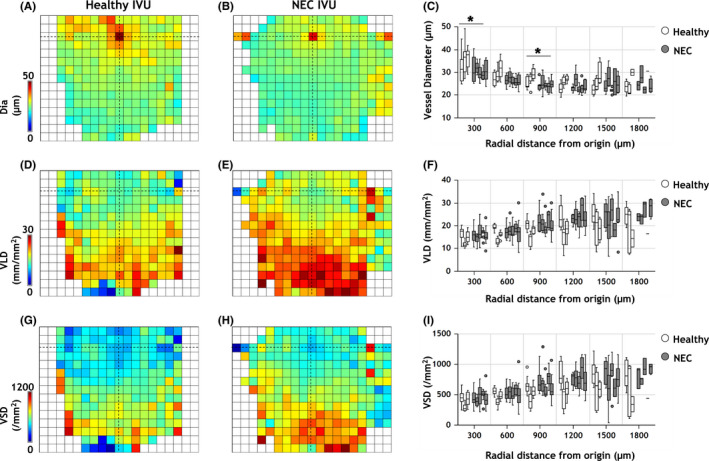
Morphological differences in the vascular phenotype of healthy versus NEC IVUs. Average parametric maps overlaid on a 150 × 150 μm grid illustrating the spatial distribution of morphological metrics: (A, B) vessel diameter (Dia); (D, E) vessel length density (VLD); and (G, H) vessel segment density (VSD) for healthy and NEC IVUs, respectively. The location of the IVU's origin is indicated by crosshairs in all panels. (C, F, I) Plots of each morphological parameter as a function of distance from the IVU origin. Box plots (white = healthy, gray = NEC) indicate the distribution of vascular metrics for IVUs belonging to each gut sample (n = 3 healthy, and n = 5 NEC). The horizontal bar on each box plot indicates its median. Outliers, that is, values beyond 1.5× the interquartile range for each sample, are shown as dots. Distance from the IVU origin was measured in steps of 300 μm. Statistical comparisons between the healthy and NEC groups were conducted using an unbalanced two‐factor ANOVA test with animal‐wise grouping (α = 0.05). Asterisks indicate radial distance bins for which the morphological vascular phenotype of NEC IVUs were significantly different from their healthy counterparts
3.5. Functional characteristics of healthy vs NEC IVUs
Average IVU‐based parametric maps illustrating the spatial distribution of blood flow (BF) and entropy (E BF) are shown in Figures 6A,B,D,E, respectively, and reveal the significant reduction in blood flow throughout the NEC IVU parametric map when compared to its healthy counterpart. The corresponding plot illustrating BF changes as a function of the radial distance from the IVU origin confirms this observation, with NEC IVUs exhibiting significantly attenuated blood flow at each radial distance (Figure 6C). In contrast, as is evident from the average parametric maps (Figure 6D,E) and the corresponding plot (Figure 6F), E BF which indicates the degree of spatial heterogeneity of the intestinal perfusion, was not significantly different between the two groups, except for the radial distance bin closest to the IVU origin (i.e., 0–300 μm) where it was significantly lower for the NEC IVUs (see Table S1 for a summary of significant NEC‐induced changes in the vascular phenotype).
FIGURE 6.

Functional differences in the vascular phenotype of healthy versus NEC IVUs. Average parametric maps overlaid on a 150 × 150 μm grid illustrating the spatial distribution of functional metrics: (A, B) blood flow (BF) and (D, E) blood flow entropy (E BF) for healthy and NEC IVUs, respectively. The location of the IVU's origin is indicated via crosshairs in all panels. (C, F) Plots of the functional parameters as a function of the distance from the IVU origin. Box plots (white = healthy, gray = NEC) indicate the distribution of vascular metrics for IVUs belonging to each gut sample (three healthy and 5 NEC). The horizontal bar on each box plot indicates its median. Outlier IVUs, i.e. those with vascular metrics beyond 1.5× the interquartile range for each sample, are shown as dots. Distance from the IVU origin was measured in steps of 300 μm. Statistical comparisons between the healthy and NEC groups were conducted using an unbalanced two‐factor ANOVA test with animal‐wise grouping (α = 0.05). Asterisks indicate radial distance bins for which the functional vascular phenotype of NEC IVUs were significantly different from their healthy counterparts
3.6. Classification of healthy and NEC guts based on their in vivo vascular phenotype
A double‐dendrogram and heat map illustrate the results of an unsupervised hierarchical cluster analysis of the in vivo vascular phenotype (Figure 7 ). Here, only parameters that showed significant differences between the healthy and NEC groups were employed for the clustering. These included vessel diameters (Dia) in the 0–300 μm and 600–900 μm radial distance bins, blood flow (BF) in all radial distance bins, and the entropy of blood flow (E BF) in the 0–300 μm radial distance bin. As indicated by the dendrogram above the heat map, every gut sample was correctly classified as belonging to either the healthy or NEC group on the basis of its in vivo vascular phenotype. Conversely, the dendrogram to the left of the heat map illustrates that the in vivo vascular phenotype itself was cleaved into two clusters, representing the morphological (i.e., Dia) and functional (i.e., BF and E BF) parameters based on variations in vascular parameters between the healthy and NEC gut samples. Additionally, the heat map enabled convenient visualization of trends in the in vivo vascular phenotype within the healthy and NEC groups.
FIGURE 7.
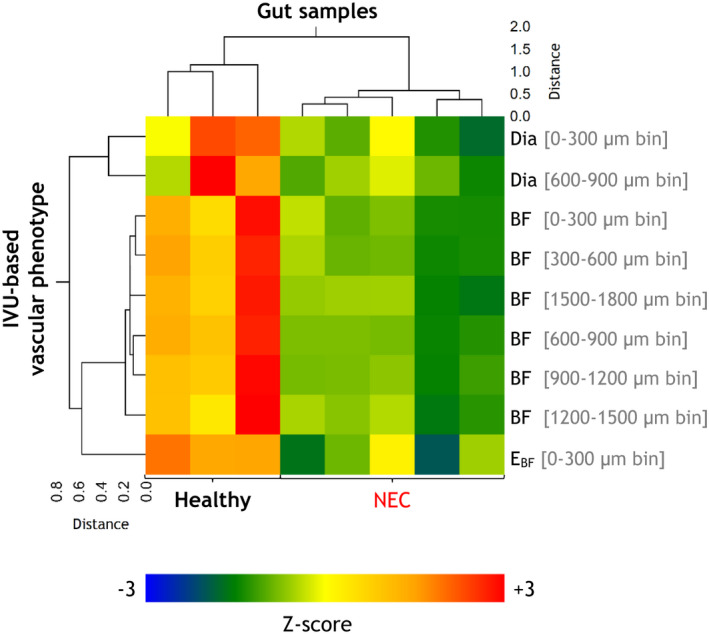
Unsupervised hierarchical cluster analyses of the in vivo vascular phenotype. A combined double‐dendrogram and clustered heat map illustrate the results of an unsupervised hierarchical cluster analysis using the unweighted pair‐group method. The clustering variables are organized by row and gut samples by column. For each gut sample, the clustering variables included the mean of the vascular parameters that were significantly different between the healthy and NEC groups, that is, vessel diameters (Dia) in the 0–300 μm and 600–900 μm radial distance bins, blood flow (BF) in all radial distance bins, and the entropy of blood flow (E BF) in the 0–300 μm radial distance bin. “Healthy” and “NEC” labels identifying to which group each gut sample belonged are specified at the bottom. The corresponding heat map illustrates the variation of each vascular parameter with respect to each of the gut samples
3.7. NEC‐induced perfusion loss in the gut macrocirculation
In contrast to IVU‐based phenotyping, we also assessed the overall perfusion status of the intestinal macrocirculation. As shown in Figure S2, the NEC group exhibited macrocirculatory BF that was on average lower than that in its healthy counterparts by ~58%. This observation, in conjunction with our IVU‐based characterization of the NEC‐induced microcirculatory phenotype, suggests that perfusion loss due to NEC pathogenesis was greater at the level of the intestinal microcirculation (i.e., 64–72%.) than at the macrocirculatory level.
4. DISCUSSION
The severity and prevalence of NEC 1 , 2 underscores the need for new technologies capable of elucidating its pathogenesis. The current work describes a rapid multicontrast imaging approach and a novel IVU‐based analysis that lays the groundwork for addressing this exigent need. We found that analogous to its neuroanatomical counterpart, “the neurovascular unit” that can undergo structural and functional changes in diseases such as brain tumors 32 and stroke, 33 the IVU too was remodeled during the steps leading to NEC. Our IVU‐based parametric maps facilitated characterization of the NEC phenotype by providing a detailed visualization of the vascular changes within the IVU. While differences in some IVU‐based morphological metrics were subtle, a significant loss of perfusion (>64–72%) was detected throughout the NEC IVU in contrast to its healthy counterpart. Since the plots quantifying NEC‐induced vascular changes as a function of radial distance approximate the gut vessel branching order, they reveal significant microvessel narrowing accompanied by a reduction in perfusion heterogeneity, that is, a more homogeneous perfusion distribution near the IVU origin. Collectively, these approaches could be adapted clinically to assess NEC‐induced vascular dysregulation “at‐a‐glance.” Results of the unsupervised hierarchical cluster analysis indicate that assessments of the in vivo vascular phenotype may also help diagnose NEC more accurately.
The current multicontrast imaging approach offers significant advantages over previously utilized single‐contrast imaging techniques. 13 , 14 For example, the IOS and LSC channels image microvascular structure and perfusion independently and enable both aspects of the gut microvasculature to be obtained concurrently. While the structural details measurable with the IOS channel were limited by the 5 μm spatial resolution, the LSC channel was still sensitive to perfusion in underlying capillaries, arterioles, and venules with diameters smaller than 5 μm. Therefore, by treating the prefusion in these unresolvable blood vessels as the “background” perfusion, LSC‐based blood flow measurements could successfully map perfusion throughout the microvascular hierarchy. The current multicontrast technique also reduced the total imaging time to 60–100 s per animal. In comparison, previous NEC studies that used erythrocyte counting techniques required tens of minutes to track erythrocytes in multiple microvessels within each intestinal FoV. 13 , 14 In the future, this rapid multicontrast strategy could pave the way for high‐throughput NEC experiments in which the efficacy of different therapeutic interventions can be rigorously tested in vivo.
The 2D multicontrast imaging approach employed in this study also has certain limitations. For example, the microvessel diameter changes at distances greater than 900 μm from the IVU origin were indistinguishable between healthy and NEC groups, which may be a consequence of the limited spatial resolution (i.e., 5 μm) of the current imaging system. Additionally, the imaging system used in these studies lacked the ability to vary the depth of focus (i.e., optical sectioning) and acquire 3D images. This prevented us from determining whether a particular microvessel resided in the muscularis, submucosal, mucosal, or epithelial layers of the intestinal wall. This limitation also prevented us from classifying all the microvessels visible in the FoV according to the Gore and Bohlen convention. 15 Additionally, our current approach did not permit arteriovenous differentiation because erythrocyte flow directions were not discernible at the 5 μm spatial resolution employed for this study. As a result, 1A/V vessel pairs were identified for IVU delineation based on morphological properties such as their vessel caliber, length, and 2D location. One could envision achieving arteriovenous differentiation in future experiments by imaging the transit of an intravenously (i.v.) administered fluorescent tracer. 34 However, i.v. administration of a fluorescent tracer would result in an additional physiological insult to an already fragile neonatal disease model and increase the acquisition time.
Despite these minor limitations, we anticipate several opportunities to improve the utility of our multicontrast imaging approach and IVU‐based analysis pipeline. For example, conducting another imaging session to acquire structural and functional images of the mesenteric circulation would enable a more comprehensive characterization of NEC‐induced abnormalities in the macrocirculation. This would also enable comparisons between changes in the micro‐ and macrovascular phenotype induced by NEC and help identify feeder vessels for each IVU. Since feeder vessels were manually identified for this study, having multiple observers label them in images or using automated machine learning‐based image segmentation would remove potential observer‐bias that could influence the IVU computations. Furthermore, a deformable image co‐registration scheme 35 would enhance the alignment of IOS‐based flat maps of microvessel architecture with their corresponding LSC‐based blood flow maps and enable a microscopic scale comparison between vessel morphology and blood flow changes. The use of advanced IVU parcellation and microvessel segmentation algorithms could also improve the accuracy of the computed vascular metrics. Additionally, using a 2D gray‐level co‐occurrence matrix and computing the blood flow entropy over multiple spatial scales 36 , 37 , 38 could provide a more detailed assessment of gut perfusion heterogeneity. Combining our in vivo characterization with ex vivo histopathological markers of NEC would enable a better understanding of the relationship between the NEC‐induced changes in the in vivo vascular phenotype and its underlying molecular pathophysiology. Moreover, incorporating an additional optical channel to map neuronal and/or glial activations within the enteric nervous system via the imaging of fluorescent calcium indicators 39 , 40 or electrophysiological recording, 41 would enable us to complement our IVU‐based analyses with such data. Since the enteric nervous system is widely considered a “second brain”, 42 , 43 and is known to exhibit abnormalities during NEC pathogenesis, 44 , 45 a combined “neuro‐vascular” characterization would enable broader insights into the gut‐brain nexus. 46 , 47
Collectively, we believe that this rapid multicontrast imaging approach and IVU‐based characterization is an exciting new tool for high‐throughput in vivo vascular phenotyping in experimental models of NEC. Such an approach could also find utility in other GI diseases characterized by a dysregulated microcirculation such as the inflammatory bowel disease, 48 acute pancreatitis, 49 and intestinal ischemia/reperfusion. 50 Finally, since the multicontrast techniques used in this study have already been approved by the United States Food and Drug Administration (FDA) for use in patients within the operating room (OR) setting, 24 , 51 our preclinical workflow provides a strong impetus for translating these IVU‐based vascular biomarkers into widespread clinical use. Such an approach would be analogous to neurologists' use of changes in the neurovascular unit to diagnose and treat brain diseases, 32 , 52 , 53 , 54 and would empower gastroenterologists to assess the progression of gastroenteric diseases and test the efficacy of novel treatment strategies.
PERSPECTIVES
Necrotizing Enterocolitis (NEC) is the most prevalent and lethal gastrointestinal emergency in premature infants and its pathogenesis ultimately involves impaired blood flow to the intestine. However, limitations of extant in vivo imaging techniques such as slow acquisition and lack of multi‐variable or multicontrast imaging capabilities preclude rigorous characterization of the NEC gut's vascular phenotype. To address this, we developed a rapid multicontrast in vivo imaging technique and a novel visualization and analysis pipeline based on the concept of “intestinal vascular units” or IVUs. IVUs were identified as 1A/V microvessels and their perfusion territories along the length of the gut and provided a convenient basis for quantifying and visualizing the NEC‐induced vascular changes. Using IVUs, we characterized the NEC‐induced loss of perfusion, vasoconstriction, and reduction in perfusion heterogeneity within the gut. This work establishes the foundation for new non‐invasive biomarkers of NEC progression and the development of translational imaging methods for use in the clinic.
AUTHOR CONTRIBUTIONS
JS, MK, DJH, NVT, and APP conceived the experiments. CPS, MK, and DJH developed the animal model. JS, MK, and APP performed the experiments. JS, AP, AB, and APP analyzed and interpreted the data. All authors drafted the manuscript.
CONFLICT OF INTEREST
The authors have no conflict of interest to declare with respect to research, authorship, and/or publication of this article.
CONSENT FOR PUBLICATION
All authors have read and approved the manuscript and consent to its publication.
Supporting information
Figure S1
Figure S2
Table S1 Summary of the NEC‐induced changes in the microvascular phenotype.
ACKNOWLEDGEMENTS
This work was supported by NIH grants 5R01CA196701‐05, 5R01CA237597‐03 and 5R01DE027957‐04 (APP), 5R01HL071568‐17 (NVT), and 5R01DK121824‐03 and 5R01DK117186‐04 (DJH).
Senarathna J, Kovler M, Prasad A, et al.. In vivo phenotyping of the microvasculature in necrotizing enterocolitis with multicontrast optical imaging. Microcirculation. 2022;29:e12768. doi: 10.1111/micc.12768
DATA AVAILABILITY STATEMENT
The data that support the findings of this study are available from the corresponding author upon reasonable request.
REFERENCES
- 1. Henry MC, Moss RL. Neonatal necrotizing enterocolitis. Semin Pediatr Surg. 2008;17:98‐109. [DOI] [PubMed] [Google Scholar]
- 2. Henry MC, Moss RL. Necrotizing enterocolitis. Annu Rev Med. 2009;60:111‐124. [DOI] [PubMed] [Google Scholar]
- 3. Fitzgibbons SC, Ching Y, Yu D, Carpenter J, Kenny M, Weldon C, Lillehei C, Valim C, Horbar JD, Jaksic T. Mortality of necrotizing enterocolitis expressed by birth weight categories. J Pediatr Surg 2009; 44: 1072–1075; discussion 1075–1076. [DOI] [PubMed] [Google Scholar]
- 4. Guthrie SO, Gordon PV, Thomas V, Thorp JA, Peabody J, Clark RH. Necrotizing enterocolitis among neonates in the United States. J Perinatol. 2003;23:278‐285. [DOI] [PubMed] [Google Scholar]
- 5. Watkins DJ, Besner GE. The role of the intestinal microcirculation in necrotizing enterocolitis. Semin Pediatr Surg. 2013;22:83‐87. [DOI] [PMC free article] [PubMed] [Google Scholar]
- 6. Alganabi M, Lee C, Bindi E, Li B, Pierro A. Recent advances in understanding necrotizing enterocolitis. F1000Res. 2019;8:1‐8. [DOI] [PMC free article] [PubMed] [Google Scholar]
- 7. Sodhi CP, Neal MD, Siggers R, Sho S, Ma C, Branca MF, Prindle T, Jr. , Russo AM, Afrazi A, Good M, Brower‐Sinning R, Firek B, Morowitz MJ, Ozolek JA, Gittes GK, Billiar TR, Hackam DJ. Intestinal epithelial Toll‐like receptor 4 regulates goblet cell development and is required for necrotizing enterocolitis in mice. Gastroenterology 2012; 143: 708–718 e705. [DOI] [PMC free article] [PubMed] [Google Scholar]
- 8. Nowicki PT. The effects of ischemia‐reperfusion on endothelial cell function in postnatal intestine. Pediatr Res. 1996;39:267‐274. [DOI] [PubMed] [Google Scholar]
- 9. Nowicki PT. Effects of sustained flow reduction on postnatal intestinal circulation. Am J Physiol. 1998;275:G758‐G768. [DOI] [PubMed] [Google Scholar]
- 10. Yazji I, Sodhi CP, Lee EK, et al. Endothelial TLR4 activation impairs intestinal microcirculatory perfusion in necrotizing enterocolitis via eNOS‐NO‐nitrite signaling. Proc Natl Acad Sci USA. 2013;110:9451‐9456. [DOI] [PMC free article] [PubMed] [Google Scholar]
- 11. Kourembanas S, Marsden PA, McQuillan LP, Faller DV. Hypoxia induces endothelin gene expression and secretion in cultured human endothelium. J Clin Invest. 1991;88:1054‐1057. [DOI] [PMC free article] [PubMed] [Google Scholar]
- 12. Kuchan MJ, Frangos JA. Shear stress regulates endothelin‐1 release via protein kinase C and cGMP in cultured endothelial cells. Am J Physiol. 1993;264:H150‐H156. [DOI] [PubMed] [Google Scholar]
- 13. Downard CD, Grant SN, Matheson PJ, et al. Altered intestinal microcirculation is the critical event in the development of necrotizing enterocolitis. J Pediatr Surg. 2011;46:1023‐1028. [DOI] [PubMed] [Google Scholar]
- 14. Ito Y, Doelle SM, Clark JA, Halpern MD, McCuskey RS, Dvorak B. Intestinal microcirculatory dysfunction during the development of experimental necrotizing enterocolitis. Pediatr Res. 2007;61:180‐184. [DOI] [PubMed] [Google Scholar]
- 15. Gore RW, Bohlen HG. Microvascular pressures in rat intestinal muscle and mucosal villi. Am J Physiol. 1977;233:H685‐H693. [DOI] [PubMed] [Google Scholar]
- 16. Gill RS, Manouchehri N, Lee TF, et al. Cyclosporine treatment improves mesenteric perfusion and attenuates necrotizing enterocolitis (NEC)‐like intestinal injury in asphyxiated newborn piglets during reoxygenation. Intensive Care Med. 2012;38:482‐490. [DOI] [PubMed] [Google Scholar]
- 17. Puiman PJ, Stoll B, van Goudoever JB, Burrin DG. Enteral arginine does not increase superior mesenteric arterial blood flow but induces mucosal growth in neonatal pigs. J Nutr. 2011;141:63‐70. [DOI] [PMC free article] [PubMed] [Google Scholar]
- 18. Downard CD, Matheson PJ, Shepherd JA, Maki AC, Garrison RN. Direct peritoneal resuscitation augments ileal blood flow in necrotizing enterocolitis via a novel mechanism. J Pediatr Surg. 2012;47:1128‐1134. [DOI] [PubMed] [Google Scholar]
- 19. Koike Y, Li B, Ganji N, et al. Remote ischemic conditioning counteracts the intestinal damage of necrotizing enterocolitis by improving intestinal microcirculation. Nat Commun. 2020;11:4950. [DOI] [PMC free article] [PubMed] [Google Scholar]
- 20. Hillman EM. Optical brain imaging in vivo: techniques and applications from animal to man. J Biomed Opt. 2007;12:051402. [DOI] [PMC free article] [PubMed] [Google Scholar]
- 21. Senarathna J, Rege A, Li N, Thakor NV. Laser Speckle Contrast Imaging: theory, instrumentation and applications. IEEE Rev Biomed Eng. 2013;6:99‐110. [DOI] [PubMed] [Google Scholar]
- 22. Iadecola C. The neurovascular unit coming of age: a journey through neurovascular coupling in health and disease. Neuron. 2017;96:17‐42. [DOI] [PMC free article] [PubMed] [Google Scholar]
- 23. Muoio V, Persson PB, Sendeski MM. The neurovascular unit – concept review. Acta Physiol. 2014;210:790‐798. [DOI] [PubMed] [Google Scholar]
- 24. Knudsen KBK, Thorup J, Strandby RB, Ambrus R, Ring LL, Ifaoui I. Laser speckle contrast imaging to evaluate bowel lesions in neonates with NEC. European J Pediatr Surg Rep. 2017;5:e43‐e46. [DOI] [PMC free article] [PubMed] [Google Scholar]
- 25. Janik JS, Ein SH, Mancer K. Intestinal stricture after necrotizing enterocolitis. J Pediatr Surg. 1981;16:438‐443. [DOI] [PubMed] [Google Scholar]
- 26. Krasna IH, Howell C, Vega A, Ziegler M, Koop CE. A mouse model for the study of necrotizing enterocolitis. J Pediatr Surg. 1986;21:26‐29. [DOI] [PubMed] [Google Scholar]
- 27. Nino DF, Zhou Q, Yamaguchi Y, et al. Cognitive impairments induced by necrotizing enterocolitis can be prevented by inhibiting microglial activation in mouse brain. Sci Transl Med. 2018;10:1‐11. [DOI] [PMC free article] [PubMed] [Google Scholar]
- 28. Schindelin J, Arganda‐Carreras I, Frise E, et al. Fiji: an open‐source platform for biological‐image analysis. Nat Methods. 2012;9:676‐682. [DOI] [PMC free article] [PubMed] [Google Scholar]
- 29. Schneider CA, Rasband WS, Eliceiri KW. NIH Image to ImageJ: 25 years of image analysis. Nat Methods. 2012;9:671‐675. [DOI] [PMC free article] [PubMed] [Google Scholar]
- 30. Berg S, Kutra D, Kroeger T, et al. ilastik: interactive machine learning for (bio)image analysis. Nat Methods. 2019;16:1226‐1232. [DOI] [PubMed] [Google Scholar]
- 31. Wu Y, Zhou YC, Saveriades G, Agaian S, Noonan JP, Natarajan P. Local Shannon entropy measure with statistical tests for image randomness. Inform Sciences. 2013;222:323‐342. [Google Scholar]
- 32. Pak RW, Hadjiabadi DH, Senarathna J, et al. Implications of neurovascular uncoupling in functional magnetic resonance imaging (fMRI) of brain tumors. J Cereb Blood Flow Metab. 2017;37:3475‐3487. [DOI] [PMC free article] [PubMed] [Google Scholar]
- 33. Dirnagl U. Pathobiology of injury after stroke: the neurovascular unit and beyond. Ann N Y Acad Sci. 2012;1268:21‐25. [DOI] [PubMed] [Google Scholar]
- 34. Senarathna J, Yu H, Deng C, et al. A miniature multi‐contrast microscope for functional imaging in freely behaving animals. Nat Commun. 2019;10:99. [DOI] [PMC free article] [PubMed] [Google Scholar]
- 35. Bhargava A, Monteagudo B, Aggarwal M, Pathak A. A novel vascular fiducials‐based approach (VASFID) for co‐registering multiscale imaging data for microcirculation systems biology. FASEB J. 2020;34:1. [Google Scholar]
- 36. Acharya UR, Raghavendra U, Fujita H, et al. Automated characterization of fatty liver disease and cirrhosis using curvelet transform and entropy features extracted from ultrasound images. Comput Biol Med. 2016;79:250‐258. [DOI] [PubMed] [Google Scholar]
- 37. Kyriacou E, Pavlopoulos S, Konnis G, Koutsouris D, Zoumpoulis P, Theotokas I. Computer assisted characterization of diffused liver disease using image texture analysis techniques on B‐scan images. 1997 IEEE Nuclear Science Symposium – Conference Record. 1998;1&2:1479‐1483. [Google Scholar]
- 38. Waugh SA, Purdie CA, Jordan LB, et al. Magnetic resonance imaging texture analysis classification of primary breast cancer. Eur Radiol. 2016;26:322‐330. [DOI] [PubMed] [Google Scholar]
- 39. Boesmans W, Martens MA, Weltens N, et al. Imaging neuron‐glia interactions in the enteric nervous system. Front Cell Neurosci. 2013;7:183. [DOI] [PMC free article] [PubMed] [Google Scholar]
- 40. Fung C, Vanden BP. Functional circuits and signal processing in the enteric nervous system. Cell Mol Life Sci. 2020;77:4505‐4522. [DOI] [PMC free article] [PubMed] [Google Scholar]
- 41. Rakhilin N, Barth B, Choi J, et al. Simultaneous optical and electrical in vivo analysis of the enteric nervous system. Nat Commun. 2016;7:11800. [DOI] [PMC free article] [PubMed] [Google Scholar]
- 42. Gershon MD. The enteric nervous system: a second brain. Hosp Pract (1995) 1999; 34: 31–32, 35–38, 41–32 passim. [DOI] [PubMed] [Google Scholar]
- 43. Goldstein AM, Hofstra RM, Burns AJ. Building a brain in the gut: development of the enteric nervous system. Clin Genet. 2013;83:307‐316. [DOI] [PMC free article] [PubMed] [Google Scholar]
- 44. Chandramowlishwaran P, Raja S, Maheshwari A, Srinivasan S. Enteric nervous system in neonatal necrotizing Enterocolitis. Curr Pediatr Rev. 2022;18:9‐24. [DOI] [PubMed] [Google Scholar]
- 45. Zhou Y, Yang J, Watkins DJ, et al. Enteric nervous system abnormalities are present in human necrotizing Enterocolitis: potential neurotransplantation therapy. Stem Cell Res Ther. 2013;4:157. [DOI] [PMC free article] [PubMed] [Google Scholar]
- 46. Flemming A. Deciphering the gut‐brain link in NEC. Nat Rev Immunol. 2019;19:70‐71. [DOI] [PubMed] [Google Scholar]
- 47. Niemarkt HJ, De Meij TG, van Ganzewinkel CJ, et al. Necrotizing Enterocolitis, gut microbiota, and brain development: role of the brain‐gut axis. Neonatology. 2019;115:423‐431. [DOI] [PMC free article] [PubMed] [Google Scholar]
- 48. Laroux FS, Grisham MB. Immunological basis of inflammatory bowel disease: role of the microcirculation. Microcirculation. 2001;8:283‐301. [DOI] [PubMed] [Google Scholar]
- 49. Hotz HG, Foitzik T, Rohweder J, et al. Intestinal microcirculation and gut permeability in acute pancreatitis: early changes and therapeutic implications. J Gastrointest Surg. 1998;2:518‐525. [DOI] [PubMed] [Google Scholar]
- 50. Vollmar B, Menger MD. Intestinal ischemia/reperfusion: microcirculatory pathology and functional consequences. Langenbecks Arch Surg. 2011;396:13‐29. [DOI] [PubMed] [Google Scholar]
- 51. de Bruin AF, Kornmann VN, van der Sloot K, et al. Sidestream dark field imaging of the serosal microcirculation during gastrointestinal surgery. Colorectal Dis. 2016;18:O103‐O110. [DOI] [PubMed] [Google Scholar]
- 52. Barber PA. Magnetic resonance imaging of ischemia viability thresholds and the neurovascular unit. Sensors (Basel). 2013;13:6981‐7003. [DOI] [PMC free article] [PubMed] [Google Scholar]
- 53. Jayachandran M, Miller VM, Lahr BD, et al. Peripheral markers of neurovascular unit integrity and amyloid‐beta in the brains of menopausal women. J Alzheimers Dis. 2021;80:397‐405. [DOI] [PMC free article] [PubMed] [Google Scholar]
- 54. Zhang L, Zhang ZG, Chopp M. The neurovascular unit and combination treatment strategies for stroke. Trends Pharmacol Sci. 2012;33:415‐422. [DOI] [PMC free article] [PubMed] [Google Scholar]
Associated Data
This section collects any data citations, data availability statements, or supplementary materials included in this article.
Supplementary Materials
Figure S1
Figure S2
Table S1 Summary of the NEC‐induced changes in the microvascular phenotype.
Data Availability Statement
The data that support the findings of this study are available from the corresponding author upon reasonable request.