

Abstract
Over one million cases of gastric cancer are diagnosed each year globally, and metastatic disease continues to have a poor prognosis. A significant proportion of gastric tumors have defects in the DNA damage response pathway, creating therapeutic opportunities through synthetic lethal approaches. Several small molecule inhibitors of ATR, a key regulator of the DNA damage response, are now in clinical development as targeted agents for gastric cancer. Here, we performed a large-scale CRISPR interference screen to discover genetic determinants of response and resistance to ATR inhibitors (ATRi) in gastric cancer cells. Among the top hits identified as mediators of ATRi response was UPF2 and other components of the nonsense-mediated decay (NMD) pathway. Loss of UPF2 caused ATRi resistance across multiple gastric cancer cell lines. Global proteomic, phosphoproteomic and transcriptional profiling experiments revealed that cell cycle progression and DNA damage responses were altered in UPF2 mutant cells. Further studies demonstrated that UPF2-depleted cells failed to accumulate in G1 following treatment with ATRi. UPF2 loss also reduced transcription-replication collisions which has previously been associated with ATRi response, thereby suggesting a possible mechanism of resistance. Our results uncover a novel role for NMD factors in modulating response to ATRi in gastric cancer, highlighting a previously unknown mechanism of resistance that may inform clinical use of these drugs.
Keywords: Stomach cancer, drug resistance, DNA damage, cell cycle
INTRODUCTION
Gastric cancer is one of the most common and deadly cancers worldwide and was responsible for more than 500,000 deaths in 2020 [1]. While surgical intervention can be curative, conventional chemotherapeutic strategies have shown limited efficacy at controlling advanced disease and targeted therapies are only indicated for a small fraction of cases [2] underscoring the need for new treatment options and targeted therapeutics to treat advanced disease. Inhibitors of DNA damage and repair (DDR) processes are attracting considerable attention as potential cancer therapeutics for a variety of solid tumors [3]. This interest has been fueled by the regulatory approval and routine clinical use of PARP inhibitors (PARPi). Five PARPi are now approved for the treatment of ovarian, breast, pancreatic or prostate cancer with BRCA1/2 mutations or harboring evidence of BRCA pathway defects (BRCAness). BRCA1/2 mutant tumors and those with BRCAness [4] are deficient in DNA double strand break repair by homologous recombination and this defect underlies their sensitivity to inhibition of the base excision repair/ single stand break component, PARP, through synthetic lethality [3]. The success of PARPi provides the impetus to explore the therapeutic effects of the inhibition of other components the DDR machinery. Clinical trials are underway to investigate inhibitors of the DDR proteins including ATR, WEE1, CHK1, ATM and DNAPK. Several other DDR targets are being explored pre-clinically [5, 6]. ATR is a DNA damage activated serine/threonine protein kinase that orchestrates cell cycle and DNA responses to a variety of DNA insults particularly replicative stress. ATR activation requires single stranded DNA coated with the heterotrimeric Replication Protein A (RPA) [7]. In addition to resected DSBs, ATR can also be activated by R-loops that arise during transcription [8, 9] and DNA replication stresses induced by stalled replication forks [7]. Upon activation, ATR phosphorylates multiple targets including the effector kinase CHK1 which in turn phosphorylates and inactivates CDC25 phosphatases that inhibit cell cycle progression by engaging the G2/M cell cycle checkpoint [7].
Several ATR inhibitors, berzosertib (VX-970/M6620, Merck KGA), ceralasertib (AZD6738, AstraZeneca), elimusertib (BAY1895344, Bayer), RP-3500 (Repare) and ART0380 (Artios), have entered clinical trials in a variety of cancer disease contexts. Although inhibition of DDR processes shows considerable promise, as with other targeted therapies, multiple resistance mechanisms are likely to be operative, especially in advanced disease. This has been shown to be the case with PARPi where with multiple resistance mechanisms have been described both preclinically and in patients after progressing on treatment [10–12]. Here, we performed a CRISPR interference (CRISPRi) screen to explore mechanisms of resistance to ATRi in gastric cancer cell lines that are ATRi sensitive. We identify loss of nonsense mediated mRNA decay proteins and specifically UPF2 as a novel resistance mechanism which allows cells to attenuate DDR signaling and bypass an ATRi-induced cell cycle checkpoint.
Nonsense-mediated mRNA decay (NMD) is a highly conserved and selective RNA turnover pathway. It promotes the decay of specific mRNAs, both normal mRNA transcripts [13] and those harboring premature termination codons (PTCs) which may be created by diverse types of mutations including nonsense mutations and frameshift mutations [14, 15]. Though NMD is often associated with cancer suppression by degrading pro-tumor RNAs, it has also been associated with promoting cancer progression by inactivating tumor suppressor genes [16, 17]. The human UPF proteins, UPF1, UPF2, UPF3A and UPF3B, act at the core of the NMD pathway. Other factors involved include the phosphatidylinositol 3-kinase -related protein kinase, SMG1, and its regulators, SMG8 and SMG9, alongside other NMD cofactors, SMG5, SMG6 and SMG7 [16, 18]. mRNA processing and transcription are coupled and, in addition to promoting turnover of aberrant transcripts, NMD proteins can also influence Pol II phosphorylation and transcription [19, 20].
MATERIALS AND METHODS
Lentiviral packaging, western blotting, real-time quantitative PCR, RNA interference and immunofluorescence were performed using standard methods and as previously described [21]. Additional detailed materials and methods are included in the online Supplementary Methods. Antibodies used are listed in Supplementary Table S1 and real-time quantitative PCR primer sequences used are described in Supplementary Table S2.
Cell culture
AGS (RRID:CVCL_0139)(link) and HGC27 (RRID:CVCL_1279)(link) cells were obtained from the American Type Culture Collection (ATCC, Manassas VA, USA). AGS cells were grown in Dulbecco’s Modified Eagle’s Medium Nutrient Mixture F-12 (DMEM/F12) with 10% fetal bovine serum and 1% penicillin-streptomycin. HGC27 cells were grown in Dulbecco’s Modified Eagle’s Medium (DMEM) with 10% fetal bovine serum and 1% penicillin-streptomycin. YCC6 cells were provided by Dr. Sun Young Rha at Yonsei University College of Medicine. YCC6 cells were grown in Eagle’s Modified Eagle’s Medium (EMEM) with 10% fetal bovine serum and 1% penicillin-streptomycin. Cell line identity was authenticated by short tandem repeat (STR) profiling and cells were confirmed negative for Mycoplasma at Genetica.
CRISPR interference screen
The CRISPRi plasmids, accompanying library and analysis software was provided by Dr. Luke Gilbert and Dr. Max Horlbeck (UCSF). AGS cell lines with stable expression of dCas9-KRAB were generated by transduction with the plasmid, pHR-SFFV-dCas9-BFP-KRAB (RRID:Addgene_46911)(link) [22]. Cells were selected with 2 μg/mL puromycin, and multiple rounds of fluorescent sorting was carried out using the FACSAria3 (BD). dCas9-KRAB cells were functionally validated by transducing cells with an sgRNA targeting CD59 expression and assessing CD59 protein levels by flow cytometry (Figure 1A). The libraries used were the Kinases, Phosphatases, and Drug Targets (RRID:Addgene_83971)(link) and Cancer and Apoptosis (RRID:Addgene_83972)(link) sublibraries from the human CRISPRi v2 (hCRISPRi-v2) library [23]. Further protocol details are described in the Supplementary Methods. Data was analyzed using publicly available code described in Horlbeck et al. (https://github.com/mhorlbeck/ScreenProcessing) [23]. GO enrichment analysis was performed and visualized using the R package clusterProfiler [24].
Figure 1: A CRISPRi screen identifies mediators of ATRi resistance.
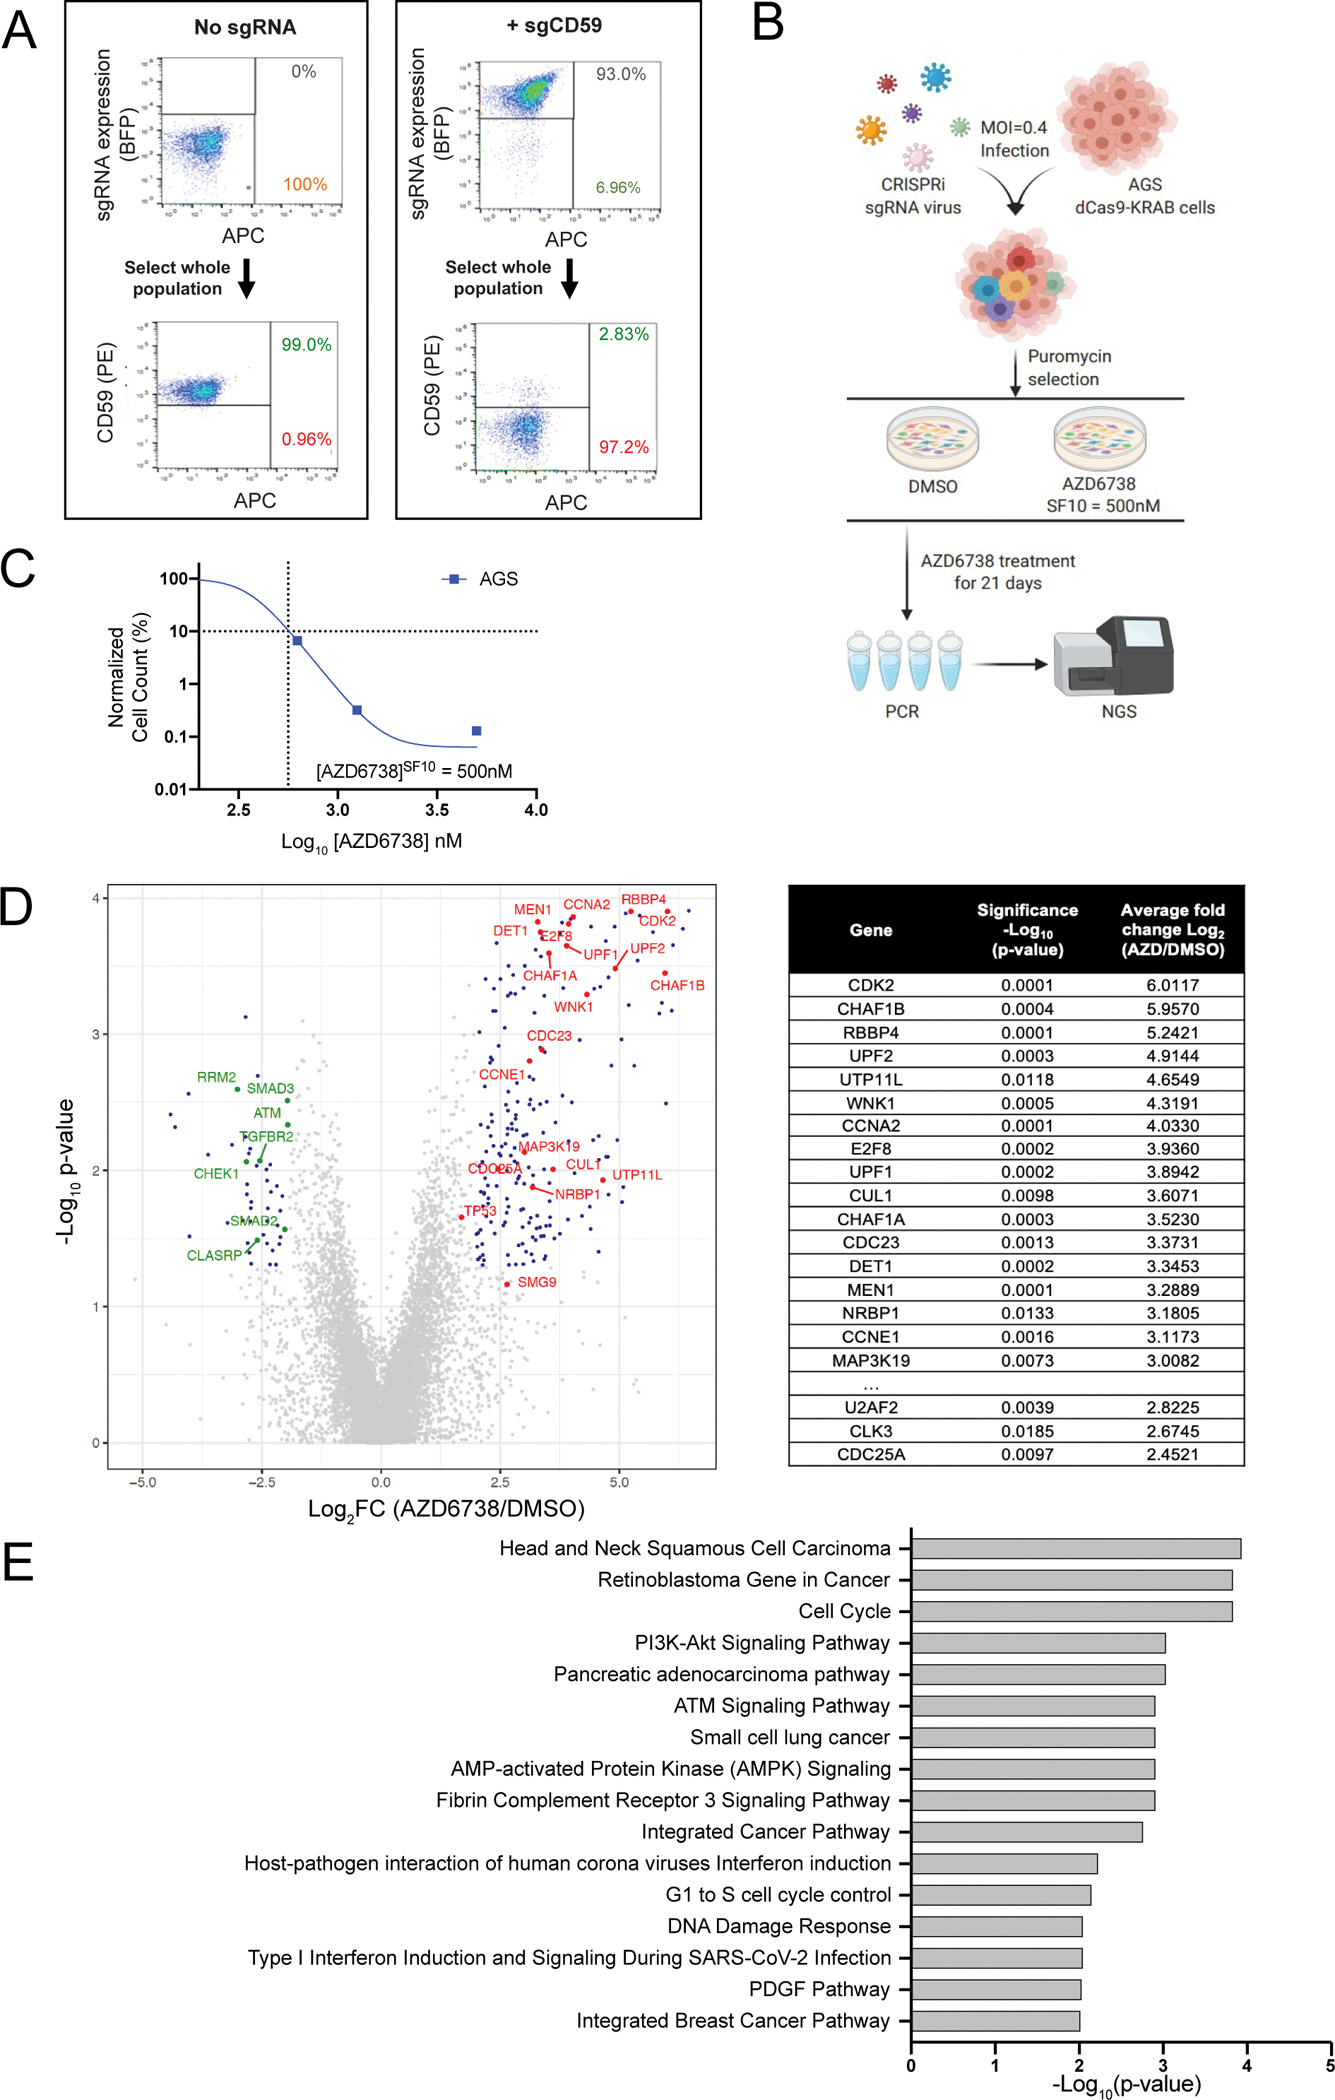
A. FACS plots showing knockdown of the control gene CD59 in dCas9-KRAB expressing AGS cells transduced with CD59 sgRNAs. B. Graphical overview of the CRISPRi screen in AGS cells. C. Survival curve of AGS parental cells exposed to increasing concentrations of AZD6738 over an 18-day assay. The SF10 is represented with a dotted line. D. Volcano plot comparing sgRNA counts in cells treated with AZD6738 or DMSO control. Data is plotted as log2-fold change (Log2FC) for each gene (mean Log2FC of the top 3 performing sgRNAs) vs −log10 (p-value) as calculated by Mann Whitney test. Top resistance hits ranked by the average Log2FC (AZD6738/DMSO) values shown in table. E. The top 10 Gene Ontology (GO) terms of significantly enriched resistance hits.
CRISPR Cas9 ribonucleotide protein (CRISPR RNP) preparation, delivery and mini-screen
CRISPR RNP knockout was performed using Cas9 protein (Berkeley MacroLab) and Dharmacon tracrRNA and crRNA for each target (Supplementary Table S3). To form the RNP complex, 1 μl of 160 μM crRNA was mixed with 1 μl 160 μM tracrRNA and incubated for 30 minutes at 37°C. 2 μl of 40 μM Cas9 protein was added to the sgRNA complex and incubated at 37°C for 15 min. Finally, this Cas9-crRNA-tracrRNA complex was electroporated into cells using the Lonza 4D-Nucleofector and 96 Well Shuttle System before the cells were seeded into a relevant plate size. For the CRISPR RNP mini-screen, electroporated cells were seeded into 96 and 384 well plates (Figure 2A). After 24 hours, the 384 well plates were treated either with a DMSO control or the SF50, SF25 and SF10 concentrations of AZD6738 or M6620. After 72 hours, DNA was extracted from the cells in the 96 well plates to confirm editing by TIDE analysis.
Figure 2: UPF2-deficient cells are resistant to ATRi.

A. Graphical overview of the RNP-based orthogonal target validation workflow. B. Waterfall plot showing the relative ratio of cells from RNP target validation studies for indicated targets. Data is plotted as the ratio of cells remaining in wells treated with 200 nM M6620 compared to DMSO control wells. Each bar is the mean ± SD, n = 3. NTC sgRNAs are highlighted in blue, UPF2 sgRNAs highlighted in red, and positive control (CDK2) sgRNAs highlighted in purple *p <0.05, ****p< 0.0001). C. Western blot analyses of cell lysates from AGS, HGC27 and YCC6 gastric cancer cells and UPF2 knockout clones. ß-actin is shown as a loading control. D. Survival curves of AGS, HGC27 and YCC6 parental and UPF2KO cells treated with indicated concentrations of M6620 or AZD6738. Cell counts or confluence was measured using an Incucyte Zoom system and normalized to DMSO control. Data is plotted as mean ± SD; n = 8. Related table shows the concentration of M6620 or AZD6738 required to cause a 50% reduction in survival (SF50) for parental and UPF2KO AGS, YCC6 and HGC27 cells. E. Survival curves as in (D) for AGS parental and heterozygous UPF1KO cells treated with M6620. F. Survival curves as in (D) for AGS cells treated with AZD6738 or M6620 after RNP-mediated knockout of SMG5, SMG6 or SMG7. Three independent sgRNAs were pooled for each gene KO.
Establishment of CRISPR Knockout Cells
To knockout SMG5, SMG and SMG7, cells were electroporated with a pool of three RNPs targeting SMG5, SGM6 or SMG7, and follow-up assays were carried out on this pool of cells. To generate knockout clones for UPF1 and UPF2, cells were electroporated with a pool of three RNPs targeting UPF1 or UPF2. Cells were single cell cloned into 96 well plates using the FACSAria3 cytometer (BD). Individual clones were screened and validated by PCR/TIDE analysis and Western Blotting.
Drug response assay
Short-term dose response assays were performed on the Incucyte® ZOOM Live-Cell Analysis System (Sartorius). In brief, cells were seeded into 384-well plates at a concentration of 250 cells per well. The next day, cells were treated with AZD6738, M6620, AZD1775, AZD0156, PF477736 (all Selleckchem) or NMDI-14 (EMD Millipore) at the indicated concentrations. Twice daily, confluency and/or cell number (Nuclight-RFP) was assessed by the Incucyte. For all data, the 96-hour timepoint is shown unless described differently in individual figure legends.
RNA sequencing
AGS parental and UPF2KO cells were seeded in 10 cm2 plates. The following day, cells were treated either with a DMSO control or 1000 nM AZD6738. 24 hours later, the cells were trypsinized, washed with PBS and snap frozen. All samples were prepared in three biological replicates. Total RNA was extracted with the RNeasy Mini Kit (Qiagen). Samples were processed using DNBSeq transcriptome strand-specific sequencing (30M reads, PE150) and Fastq files, BAM files, and differential gene expression and pathway analysis files data were generated by BGI (https://www.bgi.com/us/home). DEG Venn diagram figures and bubble plots were generated using the Dr. Tom Data Visualization software (BGI).
Proteomics
Differential proteome expression was assessed in parental and UPF2 knockout (UPF2KO) AGS cells treated with 24 hours of 1000 nM AZD6738 or a DMSO control. Triplicate samples were analyzed. Additional details are described in online Supplementary Methods.
Quantification of cell cycle
Two orthogonal approaches were used to analyze the cell cycle: EdU incorporation: Two hours prior to harvesting, the cells were treated with 10 μM EdU. After harvesting, EdU incorporation levels were quantified as per manufacturer’s protocol using the Click-iT EdU Alexa Fluor 488 Flow Cytometry Assay Kit (Invitrogen C10420) or the Click-iT Plus EdU Alexa Fluor 647 Flow Cytometry Assay Kit (Invitrogen C10634). The Attune NxT Flow Cytometer (Thermo Fisher) was used to determine the percentage of EdU-positive S-phase cells in the population. Quantitative FastFUCCI assay: 250,000 AGS, HGC27 or YCC6 cells were seeded in a 6 well dish and transduced with pBOB-EF1-FastFUCCI-Puro lentivirus (RRID:Addgene_86849)(link) in the presence of 8 μg/mL polybrene. After 24 hours, the media was changed and after 48 hours fresh medium containing 2 μg/ml puromycin was added to select infected cells. Cells were selected for 72 hours and then expanded. Red fluorescent cells (i.e. cells in G1) were enriched by flow cytometry using a FACSAria 3 (BD). FastFUCCI expressing cells were seeded into 96 well plates and treated with the indicated concentrations of drug. After 24 hours, fluorescent cells were scanned using an IN Cell Analyzer 6500 System (Cytiva) and analyzed by IN Cell Developer (Cytiva).
Generation of RNaseH1 plasmid
The plasmid encoding human RNAseH1 (RRID:Addgene_65783) was Gateway cloned into the pDONR221 vector using BP clonase according the manufacturer’s protocol (ThermoFisher). pENTR-RNAseH1 was then Gateway cloned into the pLV-TetON-FLAG vector [25]. Plasmids were validated by sequencing. Lentivirus was generated using standard protocols and supernatants were collected at 48 and 72 hours post transfection.
Detection of transcription-replication collisions
The PLA assay was carried out as described in Matos et al. [26]. Cells were seeded at 30,000 cells/well in Ibidi μ-Slide 8 Well slides (#80806) and allowed to adhere overnight before treatment. At the end of the experiment, cells were washed twice with PBS and then treated with CSK extraction buffer (0.2% Triton X-100, 20 mM HEPES-KOH pH 7.9, 100 mM NaCl, 3 mM MgCl2, 300 mM sucrose, 1 mM EGTA) on ice for 3 minutes. Cells were then fixed on ice with 4% PFA for 5 minutes followed by ice-cold methanol treatment at −20°C for 20 minutes. Cells were permeabilized with 1x PBS containing 0.5% Triton-X100 (PBST) for 4 minutes and then blocked with 3% BSA in PBST buffer at room temperature for 1 hour. Cells were washed with 1x PBS between each step. Afterward, cells were incubated with the indicated primary antibodies diluted at 1:500 (PCNA) and 1:1000 (p-RNAPII Ser2) at 4°C overnight. After three washes with 1x PBST, cells were incubated with anti-mouse minus and anti-rabbit plus PLA probes (PLA kit from Sigma) at 37°C for 1 hour. Following the manufacturer’s instructions, the PLA reaction was performed with the Duolink In Situ Detection Reagents (PLA kit). After a wash with Buffer B (PLA kit), cells were blocked again with 3% BSA in PBST and incubated with Alexafluor 488 antimouse secondary antibody at room temperature for 1 hour. Finally, cells were washed four times, stained with DAPI during the third wash, and stored in 1X PBS at 4°C. Images were captured with a Nikon 90i microscope and quantified using CellProfiler.
Data analysis and statistics
A detailed description of the bioinformatics methods and software used is provided in the online Supplementary Methods [24, 27–30]. CellProfiler Image Analysis Software (RRID:SCR_007358) was used to quantify staining for S9.6 and PLA experiments [31]. InCarta software (Cytiva) was used for the pH2AX staining quantification. All data were plotted as mean value with variances as SD using GraphPad Prism 8 software (RRID:SCR_002798)(link) and R Project for Statistical Computing RRID:SCR_001905)(link). A two-tailed Student’s t-test was used for statistical analysis of comparison of two samples. P < 0.05 was considered statistically significant. Statistical analysis from the CRISPRi screen, RNA sequencing and proteomics datasets are described in the relevant sections.
Data availability
All mass spectrometry raw data files and search parameters/results have been deposited to the ProteomeXchange Consortium via the PRIDE partner repository [32] and can be accessed under the dataset identifier PXD034887. Other datasets generated and/or analyzed during the current study are available in the extended data file or from the corresponding author on reasonable request.
RESULTS
A pooled CRISPR interference screen for determinants of ATR inhibition in the AGS gastric cancer cell line
To identify genes associated with resistance to ATR inhibition, we carried out a pooled CRISPR interference (CRISPRi) screen in the gastric cancer cell line, AGS, treated with the highly selective ATRi, AZD6738 (Figure 1B). Pooled CRISPR screening is a well-established, powerful method for the large-scale discovery of functional biology. In pooled screens, genetic perturbations are introduced in bulk allowing for larger scale and scope than arrayed screens, however they require a sequencing readout. In contrast, arrayed screens introduce perturbations on a sgRNA-per-well basis and the readout can use a simpler imaging approach, making them more suited to validation and follow-up investigation [33]. AGS cells were selected as the screening cell line as they are particularly sensitive to ATR inhibition (AZD6738SF10 = ~500nM) (Figure 1C). To prepare for the screen, we first stably transduced a dCas9-KRAB expression plasmid into AGS cells and performed multiple rounds of FACS sorting to enrich for a population of cells stably expressing the dCas9-KRAB-transgene (Supplementary Figure S1A). AGS-dCas9-KRAB cells were then functionally validated by lentiviral transduction of an sgRNA targeting CD59 which resulted in robust knockdown of CD59 expression (Figure 1A).
The sgRNA library we screened contained 29,350 sgRNAs targeting 5234 genes from the Kinases, Phosphatases, Drug Targets and Cancer & Apoptosis hCRISPRi-v2 sub-libraries [23]. AGS-dCas9-KRAB cells were infected with lentivirus sgRNA pools and, 7 days after infection, a sample of cells was collected (T0) and the remaining cells were divided into two experimental arms and treated with either 500 nM AZD6738 (SF10: the concentration at which 10% of cells survived) or vehicle for 21 days (Supplementary Figure S1B, S1C). Surviving cells were collected, genomic DNA was extracted and sgRNAs were amplified by PCR and subjected to NGS sequencing. Over 250 million reads were sequenced across the three experimental arms with an average sequencing depth of ~2500 reads/sgRNA. The screen processing pipeline of Horlbeck et al. [23] was used to determine the guide frequency and identify enriched genes in each arm. To evaluate the screen performance, we confirmed dropout of sgRNAs targeting essential genes in the DMSO-treated arm compared to the T0 sample and found that sgRNAs targeting TERT, ABCE1, MUS81 and ATR itself all had a significant Log2FC reduction of <−2 (p < 0.05) (Supplementary Figure S2, Supplementary Table S4). Additionally, non-targeting sgRNAs were not significantly altered between these samples, suggesting good performance characteristics of the screen. To define differentially enriched genes, we first filtered out essential genes. We then selected genes showing enrichment or depletion in ATRi treated cells by filtering Rho Log2FC scores of above 2.0 or below −2.0 in the ATRi treated cells compared to DMSO treated cells (Rho p-value < 0.05). Using these criteria, 57 genes were significantly associated with ATRi resistance, while 19 genes were associated with sensitivity.
After filtering, the top gene hits associated with resistance to ATRi were the cell cycle associated genes, CDK2, E2F8, CCNE1 and CDC25A, all of which have been previously implicated in ATR inhibitor resistance [34–36]. Other notable genes whose loss caused AGS cells to become resistant to ATRi were Cyclin A2 (CCNA2) which interacts with CDK2, members of the CAF-1 complex, CHAF1A, CHAF1B and Retinoblastoma Binding Protein 4 (RBBP4), and the nonsense-mediated decay (NMD) factors UPF1 and UPF2 (Figure 1D). The drug concentration used in our positive selection screen was primarily designed to detect sgRNAs that cause ATRi resistance. However, we noted several genes whose loss caused sensitivity to ATRi including those involved in TGFβ signaling: TGFBR2, SMAD2, and SMAD3 [37]; ATM [38, 39] and CHEK1 [40], all of which are reported to be synthetically lethal with ATR inhibitors. The RNA processing factor, BCLAF1, was also associated with sensitivity to ATR inhibition, and loss of this gene was previously reported to cause sensitivity to DNA damaging agents [41]. We next performed gene ontology (GO) enrichment analysis of the differentially enriched sgRNAs to identify pathways that are essential for response to an ATRi. This analysis highlighted “Retinoblastoma Gene in Cancer”, “Cell Cycle”, “ATM Signaling Pathway”, “G1 to S cell cycle control” and “DNA Damage Response” as important pathways in ATRi response in AGS cells (Figure 1E).
Validation of UPF2 and other hits from the CRISPRi ATRi resistance screen
To orthogonally validate the most significant hits from the screen, we used CRISPR/Cas9 ribonucleoproteins (RNPs) to knock out selected hits in AGS cells (Figure 2A). We designed three independent sgRNAs for each of 8 target genes, assembled Cas9 RNPs in vitro and delivered them into cells by electroporation. Knockout pools were then seeded into 384 well plates and treated with varying concentrations of the ATRi, AZD6738, or a DMSO control to evaluate ATRi sensitivity. Knockout of five of these genes, CDK2, CCNA2, WNK1, NPAT or UPF2, each conferred resistance to both M6620 and AZD6738 in AGS cells (Figure 2B, Supplementary Figure S3). Because our initial validation studies were not performed in single cell clones or cells selected for gene loss, we subsequently isolated single cell clones of the UPF2KO cells and used western blot analysis to identify single cell clones that had lost UPF2 expression (Figure 2C). Two UPF2KO clones (UPF2KO3 and UPF2KO20) showed loss of UPF2 and were selected for further characterization. Exome sequencing confirmed that both UPF2KO3 and UPF2KO20 had biallelic deletion of UPF2. Both UPF2KO clones also showed a 10-fold change in resistance to both AZD6738 and M6620 in 96-hour dose response assays (Figure 2D). We also attempted knockout of UPF1 but were only able to recover clones with heterozygous loss of UPF1, indicating that homozygous loss may be lethal in AGS cells. The heterozygous UPF1KO clones showed a 2 to 4-fold shift in ATRi resistance in short-term assays (Figure 2E, Supplementary Figure S4). Using the same strategy employed for AGS cells, we also knocked out UPF2 in two additional gastric cancer cell lines, HGC27 and YCC6. Loss of UPF2 in these cell lines also conferred resistance to both ATR inhibitors (Figure 2D) providing support that UPF2 mediates response to ATRi in multiple genetic contexts and is not exclusive to AGS cells. To assess whether loss of other NMD-associated proteins could also alter ATRi sensitivity, we inactivated SMG5, SMG6 or SMG7 in AGS cells and found that loss of each was also associated with resistance to the ATR inhibitors, M6620 or AZD6738 (Figure 2F). Additionally, SMG9 had a Rho score of 2.65 in our ATRi resistance screen (Figure 1D), however the Rho p-value was just outside our significance threshold (p = 0.069). Together these results suggest that NMD factors may play a key role in ATRi sensitivity. We noted that AGS and HGC27 cells depleted for the NMD factors UPF2, UPF1, SMG5, SMG6 or SMG7 all had elevated SMG1 expression and phosphorylation, raising the possibility that increased SMG1 activity might drive the resistance phenotype (Supplementary Figure S5A, S5B, S6). To assess whether elevated SMG1 levels contributed to the ATRi resistance phenotype, we used SMG1-targeting siRNAs to knockdown SMG1 in UPF2-deficient AGS, HGC27 and YCC6 cell lines. Our initial experiments found that siRNAs targeting SMG1 were highly toxic to AGS cells. Reducing the amount of siSMG1 to non-toxic concentrations (5 nM) did not significantly resensitize UPF2KO cells to ATRi (Supplementary Figure S7A–C). While this result cannot formally exclude a role for SMG1 in ATRi response and additional experiments are needed to evaluate the role of SMG1 in ATRi resistance in UPF1, SMG5, SMG6 or SMG7 knockout cells, loss of SMG1 did not reverse the ATRi resistance observed in UPF2KO AGS cells arguing that in these cell line models the resistance phenotype is likely not driven by elevated SMG1.
UPF2 knockout cells show altered DDR and cell cycle transcriptional profiles upon ATRi
To explore how loss of UPF2 confers resistance to ATR inhibition, we compared the transcriptional profiles of UPF2KO and parental AGS cells treated with either DMSO or 1000 nM AZD6738 (Supplementary Table S5). Comparing the transcript abundance in untreated UPF2KO and parental cells, we identified 7255 differentially expressed genes (DEG; q value < 0.05). Of these, 3640 genes were differentially expressed between the parental AGS cell line and both the UPF2KO clones (q value < 0.05; Supplementary Figure S8A). UPF2 transcripts were significantly reduced in both clones, while SMG1 expression was upregulated in both knockout clones suggesting that SMG1 expression differences occur, at least in part, at the RNA level. Notably, UPF1 and UPF3B transcripts were also elevated in the UPF2KO clones (Supplementary Figure S6). To confirm the loss of UPF2 function in these KO clones, we assessed the expression of GADD45B, a well characterized marker of NMD [13, 42]. GADD45B mRNA expression was strongly increased (q value < 0.05) in the KO clones versus the WT cells (Supplementary Figure S6). Additional qPCR experiments confirmed elevated expression of NMD targets in UPF2KO clones (Supplementary Figure S9A). NMD factors may be themselves targets of NMD [43–45]. In both our RNA-seq and qPCR data, we also observed that NMD factors were upregulated in UPF2-deficient AGS cells (Supplementary Figures S6, S9B). Pathway analysis of parental and UPF2KO cells identified “Ribosome”, “Spliceosome”, “Metabolic pathways” and “mRNA surveillance pathways” as the most differentially regulated pathways (Supplementary Figure S8B). Additional transcriptomic analysis of cells treated for 24 hours with 1000 nM AZD6738 found 1522 genes that were differentially expressed in ATRi-treated parental AGS cells, but unchanged in the UPF2KO cells upon ATRi treatment (Figure 3A). Pathway analysis of these genes identified “DNA replication”, “Cell Cycle” and “p53 signaling pathway” as the most enriched pathways. Concurrent pathway analysis of the 132 dysregulated genes in ATRi-treated UPF2KO3 and/or UPF2KO20 did not show enrichment for these pathways (Figure 3B, 3C). These transcriptional changes highlight cell cycle and DNA damage responses that are induced by ATRi in parental AGS cells, but not in UPF2 knockout clones.
Figure 3: UPF2 loss disrupts DNA damage response signaling and prevents cells from activating a G1/S checkpoint upon ATR inhibition.

A. Venn diagram of genes with altered expression in parental compared to UPF2KO AGS cells treated with 24 hours of 1000 nM AZD6738 compared to untreated cells. B. GO analysis of genes that show altered expression in parental AGS cells treated with 24 hours of 1000 nM AZD6738 compared to untreated control cells. C. GO analysis of genes that show altered expression in UPF2KO AGS cells treated with 24 hours of 1000 nM AZD6738 compared to untreated UPF2KO cells. D. Heat map of kinases that show increased or decreased substrate phosphorylation (>5 targets) in ATRi-treated AGS parental and UPF2KO clones by global phosphoproteomic analyses. An asterisk (*) indicates FDR<0.05. E. Bar graphs showing the % EdU positive parental and UPF2KO AGS, YCC6 and HGC27 cells after treatment with the indicated concentrations of AZD6738. Each cell line is normalized to the DMSO control. F. Schematic of the FastFUCCI cell cycle reporter system. Red, yellow and green fluorescent cells correspond to the cells in G1, G1/S and S/G2-M, respectively. G. Cell cycle analysis bar graphs of FastFUCCI labeled AGS parental and UPF2KO cells treated with either DMSO or 1000 nM AZD6738 for 24 h. Data are shown as mean ± SD; n = 3. p<0.05, **p<0.01, ***p<0.001, ****p<0.0001, ns = non-significant.
Global and phospho-proteomic analyses reveal attenuated DDR signaling and cell cycle alterations in UPF2KO cells compared to UPF2WT cells
We next performed quantitative phosphoproteomic analyses of the two UPF2KO clones and parental AGS cells with or without treatment with AZD6738. Comparison of UPF2KO and parental AGS cells reveals 1597 phosphopeptides that were significantly altered in UPF2KO cells, while 2031 phosphopeptides were altered across the cell lines when comparing with and without AZD6738 treatment (Supplementary Figure S10A, S10B). Many known ATR substrates showed decreased phosphorylation upon treatment with ATRi, including CHEK1, FANCD2, KAT7, MCM2, STAT3 (Supplementary Figure S11). Our analysis also showed elevated phosphorylation levels of some ATR substrates after ATRi treatment (Figure 3D). Because ATM and ATR share many substrates, we reasoned that the increase in Chk1 pS345 may be caused by compensatory activity of ATM. To assess the influence of both the ATM and ATR pathway on Chk1 phosphorylation, we treated parental and UPF2KO AGS cells with ATRi, ATMi (AZD0156) or a combination of both drugs. In ATRi-treated parental cells, we observe an increase in Chk1 phosphorylation which is not relieved in cells treated with both an ATR inhibitor and ATM inhibitor (Supplementary Figure S12). Because Chk1 phosphorylation is still detected in the cells co-treated with an ATM inhibitor, we conclude that the increased Chk1 phosphorylation in ATRi treated cells is unlikely the result of ATM activity. We also performed global proteomic studies in the parental cells and UPF2KO clones. GO analysis of the top altered proteins revealed that “Spliceosome” and “Ribosome biogenesis in eukaryotes” were the most downregulated pathways in UPF2KO clones compared to parental cells, while the “Cell cycle” GO term was increased in the UPF2KO clones (Supplementary Figure S10C). Taken together, the RNA sequencing and proteomic studies suggest that in AGS cells, an ATRi-induced cell cycle checkpoint alteration requires the key NMD component UPF2.
Loss of UPF2 disrupts ATM signaling and allows cells to bypass G1/S checkpoint
Our proteomic analyses suggested that UPF1 and UPF2 loss affected cell cycle dynamics and prompted us to investigate cell cycle changes in UPF1KO and UPF2KO cells. To this end, we labeled cells with EdU and stained them with FxCycle DNA content stain, and then used flow cytometry to measure the proportion of cells in each phase of the cell cycle. These experiments showed that loss of UPF1 or UPF2 had little impact on cell cycle progression in untreated AGS gastric cancer cells (Supplementary Figure S13). Upon treatment with AZD6738, parental AGS, HGC27 and YCC6 cells activate a G1/S checkpoint and accumulate in G1, but UPF2KO cells treated with AZD6738 fail to accumulate at G1/S (Figure 3E). To further explore cell cycle dynamics of parental and UPF2KO cells after ATRi treatment, we employed a two-color fluorescent protein FUCCI cell cycle reporter, which allows quantification of cells in G1, G1/early S and S/G2/M (Figure 3F) [46]. Consistent with what we observed in our initial EdU experiments, AGS parental cells treated with AZD6738 accumulated in the G1 phase, AZD6738-treated UPF2KO cells proceeded out of G1 into early S phase (Figure 3G).
Loss of the phosphatase CDC25A was previously shown to make cells resistant to ATR inhibition [34] so we hypothesized that UPF2 loss may incur its G1/S effect through modulation of CDC25A, or its homolog, CDC25B. Disproving this model, mRNA expression of CDC25A or CDC25B were comparable between parental and UPF2KO cells (Supplementary Figure S14A). We also asked if hyperphosphorylation of CDK2 might underlie the observed sensitivity to ATR and CHK1 inhibitors [47]. However, western blots of extracts from both AGS and HCG27 cells showed similar levels of CDK2 phosphorylation across the parental and UPF2KO clones (Supplementary Figure S14A) leading us to conclude that ATRi resistance in UPF2KO cells is likely not driven by changes in CDC25A or CDK2 phosphorylation.
To investigate changes in the DDR between parental and UPF2KO cells, we used immunofluorescence to visualize pH2AX-Ser139 formation. While parental AGS and HGC27 cells treated with ATRi formed γH2AX foci, UPF2KO cells failed to form γH2AX foci after ATRi treatment (Figure 4A). Western blot profiling of other DNA damage response markers showed an increase in pATM-Ser1981, pH2AX-Ser139, and pCHK2-Thr68 in parental cells treated with AZD6738 indicating that the ATM-CHK2 pathway is activated when the ATR-CHK1 pathway is inhibited. This activation of the ATM-CHK2 axis was not evident in UPF2KO AGS and HGC27 cells (Figure 4B, Supplementary Figure S14B, Supplementary Figure S15).
Figure 4: UPF2KO cells fail to activate the ATM-regulated DNA damage response pathway.

A. Plots showing mean intensity of γH2AX-Ser139 staining in the nuclei of parental and UPF2KO AGS and HGC27 cells treated with the indicated concentrations of AZD6738. Mean values and SD are indicated with a black dot and bar, respectively, and p-values were calculated using a Welch two sample t-test. B. Western blot analyses of lysates from parental and UPF2KO AGS cells treated with the indicated concentrations of AZD6738. ß-actin is shown as a loading control. C. Survival curves of parental and UPF2KO AGS cells treated with AZD1775 (WEE1i), PF477736 (CHK1i) or AZD0156 (ATMi). Cell counts were determined using an Incucyte Zoom system and normalized to DMSO control. Data is plotted as mean ± SD; n = 8. D. Plots showing mean intensity of pH2AX-Ser139 staining in nuclei of parental and UPF2KO AGS cells treated with 1000 nM AZD6738, 500 nM AZD1775, 500 nM AZD0156 or a DMSO control. Mean values and SD are indicated with a black dot and bar, respectively, and p-values were calculated using a Welch two sample t-test. E. Cell cycle analysis bar graphs showing the percentage of FastFUCCI labeled parental and UPF2KO AGS cells treated with either DMSO or the indicated nM concentrations of AZD1775 (WEE1i), PF477736 (CHK1i) or AZD0156 (ATMi) for 24 hours. Data are shown as mean ± SD; n = 3. p<0.05, **p<0.01, ***p<0.001, ****p<0.0001, ns = non-significant.
We next tested the effects of WEE1 (AZD1775; adavosertib), CHK1 (PF-477736) and ATM (AZD0156) inhibitors on parental and UPF2 knockout cells and found that UPF2KO cells are resistant to WEE1i and CHK1i, but not ATMi (Figure 4C). Notably, cells deficient in SMG5, SMG6 or SMG7 were also resistant to CHK1i (Supplementary Figure S16). UPF2KO cells also fail to phosphorylate H2AX after WEE1i or CHK1i treatment (Figure 4D, Supplementary Figure S14B). Using our FUCCI reporter lines, we noted that AGS parental cells treated with WEE1i or CHK1i accumulated in the G1 phase, while WEE1- and CHK1-treated UPF2KO cells proceeded out of G1 into early S phase (Figure 4E). However, we did not see a G1 accumulation of cells treated with the ATM inhibitor, AZD0156. Taken together these data argue that UPF2KO cells fail to activate ATM and a G1/S checkpoint upon ATR inhibition.
The ATR/CHK1 pathway is primarily activated in response to replication stress [7] so we next investigated if loss of UPF2 changed how cells responded to replication stress. For this, we treated parental and UPF2KO cells with hydroxyurea (HU) which induces replication stress by selectively inhibiting ribonucleoside diphosphate reductase and depleting nucleotide pools. Loss of UPF2 did not alter the response of AGS cells to HU treatment (Supplementary Figure S17A), suggesting that UPF2KO and parental cells respond similarly to stalled replication forks and that the resistance phenotype in UPF2KO cells is not due to an attenuated response to replication stress. This conclusion is further supported by combination studies with HU with ATRi which show an additive effect suggesting that the two inhibitors are acting on different pathways (Supplementary Figure S17B).
UPF2 loss associated with a reduction in replication-transcription collisions
After confirming that UPF2KO cells had intact DDR, we next explored how loss of UPF2 affected DDR signaling. UPF1 was recently identified as a factor involved in the formation of R-loops [48], and the ATR/CHK1 pathway is involved in sensing and protecting against R-loops through a MUS81-triggered and ATR-mediated feedback loop [26]. Therefore, it seemed possible that UPF2 may also affect R-loop formation, and that this may impact the response to ATR inhibition. To test this hypothesis, we used an antibody commonly used to detect RNA:DNA hybrids, including R-loops (S9.6) to measure RNA:DNA hybrids across all cell lines in response to ATRi. Consistent with previously published data, we saw an increase in staining in cells treated with ATRi (Supplementary Figure S18). Using this same antibody, we failed to find a significant difference in RNA:DNA hybrids between untreated parental and UPF2KO AGS cells. To further explore whether R-loop burden affected ATRi response, we tested ATRi sensitivity in AGS cells expressing a dox-inducible RNase H1 transgene and found that ectopic expression of RNase H1 had no effect on ATRi sensitivity (Figure 5A, Supplementary Figure S19). Lloyd et al. similarly found that RNA:DNA hybrids were not directly responsible for ATRi/Chk1i sensitivity in CCNC-deficient cells [35]. We conclude that ATR inhibitor resistance is independent of changes in RNA:DNA hybrid levels.
Figure 5: UPF2KO cells have reduced levels of replication-transcription collisions.

A. Survival curves of AGS cells treated with ATRi after doxycycline induction of RNase H1 expression. B. Representative images of AGS parental and UPF2KO cells that were fixed and subjected to a proximity ligation assay (PLA) between PCNA and RNA polymerase II (RNAPII). UPF2WT cells treated with a transcription inhibitor, DRB, and no antibody controls are also shown. C. Plots showing the number of PLA nuclear foci in AGS parental and UPF2KO cells as shown in (B). D. Plots showing the number of PLA nuclear foci in YCC6 UPF2WT and UPF2KO cells that were fixed and subjected to a proximity ligation assay (PLA) between PCNA and RNA polymerase II (RNAPII). Parental cells treated with a transcription inhibitor, DRB, and CDC7 inhibitor, XL413, and no antibody controls are also shown. Data are shown as mean ± SD. p<0.05, **p<0.01, ***p<0.001, ****p<0.0001, ns = non-significant.
Lloyd et al. showed that transcription-associated replication stress was the predominant driver of ATRi-induced cell death and that cell death was relieved in the CCNC-deficient models [35]. They reasoned that the RNA:DNA hybrids themselves were likely not directly responsible for ATRi-induced replication stress and cell death, but instead suggested that transcription-replication conflicts (TRC), the upstream physical collisions between transcription and replication machinery, were the cause of cell death. Loss of CDK8 induces ATRi resistance by suppressing transcription-induced replication stress and Matos et al. report that ATR plays a key role in promoting fork recovery at stalled replication forks [26]. We hypothesized that in UPF2-deficient cells, there are reduced levels of these collisions and that this leads to resistance to ATR inhibition. To quantify TRCs, we utilized a proximity-ligation assay (PLA) measuring the colocalization of the transcription protein, RNA Pol II, and the DNA replication protein, PCNA. We showed evidence for reduced conflicts across all UPF2KO clones in both the AGS and YCC6 gastric cancer cell lines. These results suggest that ATRi resistance in UPF2KO cells is the result of less transcription-induced replication stress and reduced ATR activation (Figure 5B–D).
DISCUSSION
Gastric cancer is a devastating disease with limited treatment options. Surgery and chemotherapy remain the standard of care for most patients with limited exceptions for tumors with specific biomarkers and there is a clear need for additional targeted therapies. The success of PARPi in treating tumors with DDR defects has led to interest in developing small molecule inhibitors targeting other DNA repair proteins, including ATR. ATR is a key DNA damage response regulator and acts as one of the core sensors of replication stress. It is activated by the presence of single stranded DNA (ssDNA) and upon activation, phosphorylates a series of substrates including CHK1, and WEE1 to trigger cell cycle checkpoints, block replication, in some cases, induce mitotic arrest and apoptosis. Clinical responses to ATRi in solid tumors have been encouraging, particularly in patients with mutations in ATM and ARID1A, both of which are frequently altered in gastric cancer. As these drugs gain traction, it will be important to understand the mechanisms of response, both to identify the subset of patients that might benefit and to predict potential paths for acquired resistance.
In this study, we identified loss of UPF2 and other NMD factors as a novel ATRi resistance pathway across multiple gastric cancer models. In addition to ATRi resistance, NMD-deficient cells also displayed resistance to CHEK1 and WEE1 inhibitors suggesting that NMD proteins are important mediators of the cytotoxic effect of small molecule inhibitors targeting the ATR/CHK1 axis. Extensive global proteomic, phosphoproteomic and genome-wide RNA seq experiments revealed cell cycle and DDR differences between parental and UPF2 mutant cells. Upon treatment with ATR inhibitors, AGS, YCC6 and HGC27 cells all activate a G1/S checkpoint. In contrast, UPF2 depleted cells show suppressed DDR signaling and can progress through the cell cycle in the presence of ATRi. Our observation that the ATM-CHK2 pathway is activated when the ATR-CHK1 pathway is inhibited in parental cells but not UPF2KO cells suggests that UPF2 plays an important role in activating ATM to trigger a G1/S checkpoint upon ATR inhibition.
Given recent reports linking UPF1 to R-loop formation, it seemed possible that UPF2 may affect R-loop formation, and that this may impact the response to ATR inhibition. However, induction of a transgene of the R-loop resolver, RNase H1, did not affect ATRi response in AGS cells suggesting that changes in R-loops do not mediate ATRi sensitivity. Instead, we find evidence for reduced transcription-replication conflicts in UPF2-deficient cells. These conflicts occur upon encounters between transcription and replication machinery leading to RNA:DNA hybrid formation, DNA damage and genomic instability [49]. We propose that, in UPF2WT cells, TRCs lead to stalled replication forks which require ATR activity to recover [26]. Reduced levels of TRCs and stalled replication forks in UPF2KO cells reduce the need for ATR-mediated fork recovery, leading to ATRi resistance. A similar association between these conflicts and ATRi sensitivity has been previously documented in Cyclin C or CDK8-deficient cancer cells [35].
In conclusion, our study defines a novel role for UPF2 in replication-transcription collisions and establishes loss of NMD proteins as a novel mechanism by which cancer cells can acquire resistance to ATRi. As ATRi block DDR signaling pathways that are necessary to resolve the DNA damage induced by replication-transcription collisions, it is possible that these drugs will be effective in selectively killing cancer cells that harbor high levels of these collisions [26]. Future work should examine the importance of UPF2 and other NMD factors in determining clinical response and resistance to ATRi.
Supplementary Material
STATEMENT OF SIGNIFICANCE.
Loss of nonsense-mediated decay proteins promotes resistance to ATR inhibitors in gastric cancer cells, which may provide combination therapeutic targets and biomarkers to improve the clinical utility of these drugs.
ACKNOWLEDGMENTS
The YCC6 cells were a gift from Woo Sun Kwon at the Songdang Institute for Cancer Research, Yonsei University College of Medicine and pBOB-EF1-FastFUCCI-Puro was a gift from Kevin Brindle & Duncan Jodrell (Addgene plasmid # 86849). We also thank Mark O’Connor and Josep Forment for insightful discussions. Data for this study were acquired using instruments in the Small Molecule Discovery Center at UCSF, UCSF Nikon Imaging Center, and the UCSF Helen Diller Family Comprehensive Cancer Center Laboratory for Cell Analysis (LCA) which is supported by NIH grant P30CA082103. This research was supported by DOD CA150647P4 (to A. Ashworth), NIH U54 CA209891 (to N.J. Krogan and A. Ashworth), and a research grant from AstraZeneca (ECHO10034065 to A. Ashworth). Additional funding was received from the Breast Cancer Research Foundation, The Susan G. Komen Breast Cancer Foundation, the V foundation for Cancer Research, the Gray Foundation, Emerson Collective, the UCSF Benioff Initiative for Prostate Cancer Research, NIH R01CA230516 (to A. Ashworth), and the Martha and Bruce Atwater Breast Cancer Research Program via UCSF Helen Diller Family Comprehensive Cancer Center and UCSF Prostate Cancer Program Research Pilot Funding (to M. Kim) and a gift from the Run for Amma (www.runforamma.org).
Footnotes
COMPETING INTERESTS: A.A. is a co-founder of Tango Therapeutics, Azkarra Therapeutics, Ovibio Corporation and Kytarro, a member of the board of Cytomx and Cambridge Science Corporation, a member of the scientific advisory board of Genentech, GLAdiator, Circle, Bluestar, Earli, Ambagon, Phoenix Molecular Designs and Trial Library, a consultant for SPARC, ProLynx, and GSK, receives grant or research support from SPARC and AstraZeneca, and holds patents on the use of PARP inhibitors held jointly with AstraZeneca from which he has benefited financially (and may do so in the future). The Laboratory of NJK has received research support from Vir Biotechnology, F. Hoffmann-La Roche, and Rezo Therapeutics. NJK has financially compensated consulting agreements with the Icahn School of Medicine at Mount Sinai, New York, Maze Therapeutics, Interline Therapeutics, Rezo Therapeutics, GEn1E Lifesciences, Inc. and Twist Bioscience Corp. He is on the Board of Directors of Rezo Therapeutics and is a shareholder in Tenaya Therapeutics, Maze Therapeutics, Rezo Therapeutics, and Interline Therapeutics. DLS has a consulting agreement with Maze Therapeutics.
REFERENCES
- 1.Sung H, Ferlay J, Siegel RL, Laversanne M, Soerjomataram I, Jemal A, et al. Global Cancer Statistics 2020: GLOBOCAN Estimates of Incidence and Mortality Worldwide for 36 Cancers in 185 Countries. CA Cancer J Clin 71, 209–249 (2021). [DOI] [PubMed] [Google Scholar]
- 2.Apicella M, Corso S and Giordano S Targeted therapies for gastric cancer: failures and hopes from clinical trials. Oncotarget 8, 57654–57669 (2017). [DOI] [PMC free article] [PubMed] [Google Scholar]
- 3.Ashworth A and Lord CJ Synthetic lethal therapies for cancer: what’s next after PARP inhibitors? Nat Rev Clin Oncol 15, 564–576 (2018). [DOI] [PubMed] [Google Scholar]
- 4.Tutt AN, Lord CJ, McCabe N, Farmer H, Turner N, Martin NM, et al. Exploiting the DNA repair defect in BRCA mutant cells in the design of new therapeutic strategies for cancer. Cold Spring Harb Symp Quant Biol 70, 139–148 (2005). [DOI] [PubMed] [Google Scholar]
- 5.Yap TA, Plummer R, Azad NS and Helleday T The DNA Damaging Revolution: PARP Inhibitors and Beyond. Am Soc Clin Oncol Educ Book 39, 185–195 (2019). [DOI] [PubMed] [Google Scholar]
- 6.Minchom A, Aversa C and Lopez J Dancing with the DNA damage response: next-generation anti-cancer therapeutic strategies. Ther Adv Med Oncol 10, 1758835918786658 (2018). [DOI] [PMC free article] [PubMed] [Google Scholar]
- 7.Saldivar JC, Cortez D and Cimprich KA The essential kinase ATR: ensuring faithful duplication of a challenging genome. Nat Rev Mol Cell Biol 18, 622–636 (2017). [DOI] [PMC free article] [PubMed] [Google Scholar]
- 8.Crossley MP, Bocek M and Cimprich KA R-Loops as Cellular Regulators and Genomic Threats. Mol Cell 73, 398–411 (2019). [DOI] [PMC free article] [PubMed] [Google Scholar]
- 9.Rinaldi C, Pizzul P, Longhese MP and Bonetti D Sensing R-Loop-Associated DNA Damage to Safeguard Genome Stability. Front Cell Dev Biol 8, 618157 (2020). [DOI] [PMC free article] [PubMed] [Google Scholar]
- 10.Barber LJ, Sandhu S, Chen L, Campbell J, Kozarewa I, Fenwick K, et al. Secondary mutations in BRCA2 associated with clinical resistance to a PARP inhibitor. J Pathol 229, 422–429 (2013). [DOI] [PubMed] [Google Scholar]
- 11.Quigley D, Alumkal JJ, Wyatt AW, Kothari V, Foye A, Lloyd P, et al. Analysis of Circulating Cell-Free DNA Identifies Multiclonal Heterogeneity of BRCA2 Reversion Mutations Associated with Resistance to PARP Inhibitors. Cancer Discov 7, 999–1005 (2017). [DOI] [PMC free article] [PubMed] [Google Scholar]
- 12.Pettitt SJ, Krastev DB, Brandsma I, Drean A, Song F, Aleksandrov R, et al. Genome-wide and high-density CRISPR-Cas9 screens identify point mutations in PARP1 causing PARP inhibitor resistance. Nat Commun 9, 1849 (2018). [DOI] [PMC free article] [PubMed] [Google Scholar]
- 13.Nelson JO, Moore KA, Chapin A, Hollien J and Metzstein MM Degradation of Gadd45 mRNA by nonsense-mediated decay is essential for viability. Elife 5 (2016). [DOI] [PMC free article] [PubMed] [Google Scholar]
- 14.Lewis BP, Green RE and Brenner SE Evidence for the widespread coupling of alternative splicing and nonsense-mediated mRNA decay in humans. Proc Natl Acad Sci U S A 100, 189–192 (2003). [DOI] [PMC free article] [PubMed] [Google Scholar]
- 15.Mendell JT and Dietz HC When the message goes awry: disease-producing mutations that influence mRNA content and performance. Cell 107, 411–414 (2001). [DOI] [PubMed] [Google Scholar]
- 16.Tan K, Stupack DG and Wilkinson MF Nonsense-mediated RNA decay: an emerging modulator of malignancy. Nat Rev Cancer (2022). [DOI] [PMC free article] [PubMed] [Google Scholar]
- 17.Jung H, Lee D, Lee J, Park D, Kim YJ, Park WY, et al. Intron retention is a widespread mechanism of tumor-suppressor inactivation. Nat Genet 47, 1242–1248 (2015). [DOI] [PubMed] [Google Scholar]
- 18.Kervestin S and Jacobson A NMD: a multifaceted response to premature translational termination. Nat Rev Mol Cell Biol 13, 700–712 (2012). [DOI] [PMC free article] [PubMed] [Google Scholar]
- 19.De S, Edwards DM, Dwivedi V, Wang J, Varsally W, Dixon HL, et al. Genome-wide chromosomal association of Upf1 is linked to Pol II transcription in Schizosaccharomyces pombe. Nucleic Acids Res 50, 350–367 (2022). [DOI] [PMC free article] [PubMed] [Google Scholar]
- 20.Lee KM and Tarn WY Coupling pre-mRNA processing to transcription on the RNA factory assembly line. RNA Biol 10, 380–390 (2013). [DOI] [PMC free article] [PubMed] [Google Scholar]
- 21.Shifrut E, Carnevale J, Tobin V, Roth TL, Woo JM, Bui CT, et al. Genome-wide CRISPR Screens in Primary Human T Cells Reveal Key Regulators of Immune Function. Cell 175, 1958–1971 e1915 (2018). [DOI] [PMC free article] [PubMed] [Google Scholar]
- 22.Gilbert LA, Larson MH, Morsut L, Liu Z, Brar GA, Torres SE, et al. CRISPR-mediated modular RNA-guided regulation of transcription in eukaryotes. Cell 154, 442–451 (2013). [DOI] [PMC free article] [PubMed] [Google Scholar]
- 23.Horlbeck MA, Gilbert LA, Villalta JE, Adamson B, Pak RA, Chen Y, et al. Compact and highly active next-generation libraries for CRISPR-mediated gene repression and activation. Elife 5 (2016). [DOI] [PMC free article] [PubMed] [Google Scholar]
- 24.Wu T, Hu E, Xu S, Chen M, Guo P, Dai Z, et al. clusterProfiler 4.0: A universal enrichment tool for interpreting omics data. Innovation (N Y) 2, 100141 (2021). [DOI] [PMC free article] [PubMed] [Google Scholar]
- 25.Kim M, Park J, Bouhaddou M, Kim K, Rojc A, Modak M, et al. A protein interaction landscape of breast cancer. Science 374, eabf3066 (2021). [DOI] [PMC free article] [PubMed] [Google Scholar]
- 26.Matos DA, Zhang JM, Ouyang J, Nguyen HD, Genois MM and Zou L ATR Protects the Genome against R Loops through a MUS81-Triggered Feedback Loop. Mol Cell 77, 514–527 e514 (2020). [DOI] [PMC free article] [PubMed] [Google Scholar]
- 27.Choi M, Chang CY, Clough T, Broudy D, Killeen T, MacLean B, et al. MSstats: an R package for statistical analysis of quantitative mass spectrometry-based proteomic experiments. Bioinformatics 30, 2524–2526 (2014). [DOI] [PubMed] [Google Scholar]
- 28.Yu G, Wang LG, Han Y and He clusterProfiler QY: an R package for comparing biological themes among gene clusters. OMICS 16, 284–287 (2012). [DOI] [PMC free article] [PubMed] [Google Scholar]
- 29.Hernandez-Armenta C, Ochoa D, Goncalves E, Saez-Rodriguez J and Beltrao P Benchmarking substrate-based kinase activity inference using phosphoproteomic data. Bioinformatics 33, 1845–1851 (2017). [DOI] [PMC free article] [PubMed] [Google Scholar]
- 30.Casado P, Rodriguez-Prados JC, Cosulich SC, Guichard S, Vanhaesebroeck B, Joel S, et al. Kinase-substrate enrichment analysis provides insights into the heterogeneity of signaling pathway activation in leukemia cells. Sci Signal 6, rs6 (2013). [DOI] [PubMed] [Google Scholar]
- 31.Stirling DR, Swain-Bowden MJ, Lucas AM, Carpenter AE, Cimini BA and Goodman CellProfiler A 4: improvements in speed, utility and usability. BMC Bioinformatics 22, 433 (2021). [DOI] [PMC free article] [PubMed] [Google Scholar]
- 32.Perez-Riverol Y, Csordas A, Bai J, Bernal-Llinares M, Hewapathirana S, Kundu DJ, et al. The PRIDE database and related tools and resources in 2019: improving support for quantification data. Nucleic Acids Res 47, D442–D450 (2019). [DOI] [PMC free article] [PubMed] [Google Scholar]
- 33.Bock C, Datlinger P, Chardon F et al. High-content CRISPR screening. Nat Rev Methods Primers 2, 8 (2022). (2022). [DOI] [PMC free article] [PubMed] [Google Scholar]
- 34.Ruiz S, Mayor-Ruiz C, Lafarga V, Murga M, Vega-Sendino M, Ortega S, et al. A Genome-wide CRISPR Screen Identifies CDC25A as a Determinant of Sensitivity to ATR Inhibitors. Mol Cell 62, 307–313 (2016). [DOI] [PMC free article] [PubMed] [Google Scholar]
- 35.Lloyd RL, Urban V, Munoz-Martinez F, Ayestaran I, Thomas JC, de Renty C, et al. Loss of Cyclin C or CDK8 provides ATR inhibitor resistance by suppressing transcription-associated replication stress. Nucleic Acids Res 49, 8665–8683 (2021). [DOI] [PMC free article] [PubMed] [Google Scholar]
- 36.Jones SE, Fleuren EDG, Frankum J, Konde A, Williamson CT, Krastev DB, et al. ATR Is a Therapeutic Target in Synovial Sarcoma. Cancer Res 77, 7014–7026 (2017). [DOI] [PMC free article] [PubMed] [Google Scholar]
- 37.Schleicher EM, Dhoonmoon A, Jackson LM, Clements KE, Stump CL, Nicolae CM, et al. Dual genome-wide CRISPR knockout and CRISPR activation screens identify mechanisms that regulate the resistance to multiple ATR inhibitors. PLoS Genet 16, e1009176 (2020). [DOI] [PMC free article] [PubMed] [Google Scholar]
- 38.Williamson CT, Miller R, Pemberton HN, Jones SE, Campbell J, Konde A, et al. ATR inhibitors as a synthetic lethal therapy for tumours deficient in ARID1A. Nat Commun 7, 13837 (2016). [DOI] [PMC free article] [PubMed] [Google Scholar]
- 39.Min A, Im SA, Jang H, Kim S, Lee M, Kim DK, et al. AZD6738, A Novel Oral Inhibitor of ATR, Induces Synthetic Lethality with ATM Deficiency in Gastric Cancer Cells. Mol Cancer Ther 16, 566–577 (2017). [DOI] [PubMed] [Google Scholar]
- 40.Sanjiv K, Hagenkort A, Calderon-Montano JM, Koolmeister T, Reaper PM, Mortusewicz O, et al. Cancer-Specific Synthetic Lethality between ATR and CHK1 Kinase Activities. Cell Rep 14, 298–309 (2016). [DOI] [PMC free article] [PubMed] [Google Scholar]
- 41.Vohhodina J, Barros EM, Savage AL, Liberante FG, Manti L, Bankhead P, et al. The RNA processing factors THRAP3 and BCLAF1 promote the DNA damage response through selective mRNA splicing and nuclear export. Nucleic Acids Res 45, 12816–12833 (2017). [DOI] [PMC free article] [PubMed] [Google Scholar]
- 42.Tani H, Imamachi N, Salam KA, Mizutani R, Ijiri K, Irie T, et al. Identification of hundreds of novel UPF1 target transcripts by direct determination of whole transcriptome stability. RNA Biol 9, 1370–1379 (2012). [DOI] [PMC free article] [PubMed] [Google Scholar]
- 43.Sanderlin EJ, Keenan MM, Mense M, Revenko AS, Monia BP, Guo S, et al. CFTR mRNAs with nonsense codons are degraded by the SMG6-mediated endonucleolytic decay pathway. Nat Commun 13, 2344 (2022). [DOI] [PMC free article] [PubMed] [Google Scholar]
- 44.Huang L, Lou CH, Chan W, Shum EY, Shao A, Stone E, et al. RNA homeostasis governed by cell type-specific and branched feedback loops acting on NMD. Mol Cell 43, 950–961 (2011). [DOI] [PMC free article] [PubMed] [Google Scholar]
- 45.Yepiskoposyan H, Aeschimann F, Nilsson D, Okoniewski M and Muhlemann O Autoregulation of the nonsense-mediated mRNA decay pathway in human cells. RNA 17, 2108–2118 (2011). [DOI] [PMC free article] [PubMed] [Google Scholar]
- 46.Koh SB, Mascalchi P, Rodriguez E, Lin Y, Jodrell DI, Richards FM, et al. A quantitative FastFUCCI assay defines cell cycle dynamics at a single-cell level. J Cell Sci 130, 512–520 (2017). [DOI] [PubMed] [Google Scholar]
- 47.Ditano JP, Donahue KL, Tafe LJ, McCleery CF and Eastman A Sensitivity of cells to ATR and CHK1 inhibitors requires hyperactivation of CDK2 rather than endogenous replication stress or ATM dysfunction. Sci Rep 11, 7077 (2021). [DOI] [PMC free article] [PubMed] [Google Scholar]
- 48.Ngo GHP, Grimstead JW and Baird DM UPF1 promotes the formation of R loops to stimulate DNA double-strand break repair. Nat Commun 12, 3849 (2021). [DOI] [PMC free article] [PubMed] [Google Scholar]
- 49.Garcia-Muse T and Aguilera A Transcription-replication conflicts: how they occur and how they are resolved. Nat Rev Mol Cell Biol 17, 553–563 (2016). [DOI] [PubMed] [Google Scholar]
Associated Data
This section collects any data citations, data availability statements, or supplementary materials included in this article.
Supplementary Materials
Data Availability Statement
All mass spectrometry raw data files and search parameters/results have been deposited to the ProteomeXchange Consortium via the PRIDE partner repository [32] and can be accessed under the dataset identifier PXD034887. Other datasets generated and/or analyzed during the current study are available in the extended data file or from the corresponding author on reasonable request.