

Abstract
Expansive Arp2/3 actin networks and contractile actomyosin networks can be spatially and temporally segregated within the cell, but the networks also interact closely at various sites, including adherens junctions. However, molecular mechanisms coordinating these interactions remain unclear. We found that the SCAR/WAVE complex, an Arp2/3 activator, is enriched at adherens junctions of the leading edge actomyosin cable during Drosophila dorsal closure. Myosin activators were both necessary and sufficient for SCAR/WAVE accumulation at leading edge junctions. The same myosin activators were previously shown to recruit the cytohesin Arf-GEF Steppke to these sites, and mammalian studies have linked Arf small G protein signaling to SCAR/WAVE activation. During dorsal closure, we find that Steppke is required for SCAR/WAVE enrichment at the actomyosin-linked junctions. Arp2/3 also localizes to adherens junctions of the leading edge cable. We propose that junctional actomyosin activity acts through Steppke to recruit SCAR/WAVE and Arp2/3 for regulation of the leading edge supracellular actomyosin cable during dorsal closure.
INTRODUCTION
Epithelial morphogenesis depends on actin cytoskeletal forces integrated with cadherin-catenin complexes. Rac-GTP–induced expansive Arp2/3 actin networks underlie exploratory lamellipodia that initiate cadherin-based cell–cell contacts between migratory cells. As epithelia mature, Rho-GTP–induced contractile actomyosin networks gain prominence and draw cadherin-based adherens junctions (AJs) into tissue-wide networks with tensile strength (McNeill et al., 1993; Adams et al., 1998; Yamada and Nelson, 2007; Harris and Tepass, 2010; Charras and Yap, 2018). Actomyosin networks also act locally to alter cell–cell interactions during tissue remodeling (Lecuit et al., 2011; Martin and Goldstein, 2014; Takeichi, 2014; Pinheiro and Bellaïche, 2018; Paré and Zallen, 2020).
Many studies highlight independent roles of Arp2/3 and actomyosin networks, but network coordination also occurs at AJs in various context-dependent ways. Arp2/3 networks can promote junctional myosin accumulation and junctional tension (Verma et al., 2012). Along cell contacts, Arp2/3 networks can sandwich between AJs and the sides of actomyosin cables to maintain adhesion (Efimova and Svitkina, 2018), adherent Arp2/3-based “microspikes” can reach across cell contacts and prevent actomyosin contractility from pulling cells apart (Li et al., 2020), and sequential actomyosin-mediated contractions and Arp2/3-based expansions can promote junctional remodeling (Del Signore et al., 2018). At end-on connections with punctate AJs, actin cables are composed of a distal actomyosin bundle and a proximal Arp2/3 network (Indra et al., 2020), and interdigitating Arp2/3-based cell protrusions form each AJ puncta (Li et al., 2021). Cryptic lamellipodia can also emerge from AJ-associated actin cables and extend basolaterally (Ozawa et al., 2020). A major unknown of this emerging area is the local signaling that coordinates actomyosin and Arp2/3 networks at AJs.
A potential mediator of junctional actomyosin and Arp2/3 network coordination is Arf small G protein signaling via cytohesin Arf-GEFs. Actomyosin activity at AJs induces local accumulation of the sole Drosophila cytohesin, Steppke (Step; West et al., 2017; Rauskolb et al., 2019), and cytohesin activity regulates junctional actomyosin activity during Drosophila dorsal closure (DC; West et al., 2017), Drosophila wing disk development (Rauskolb et al., 2019), and Zebrafish epiboly (West et al., 2017). Additionally, excessive Arf small G protein activation promotes epithelial-to-mesenchymal transition and invasive cell migration, in coordination with Rac small G protein signaling and Arp2/3 network induction (D’Souza-Schorey and Chavrier, 2006; Myers and Casanova, 2008; Casalou et al., 2016; Singh et al., 2019). Through direction interactions, Arf1 and Arf6 cooperate with Rac1 to activate the SCAR/WAVE complex (Koronakis et al., 2011; Humphreys et al., 2013; Singh et al., 2020), a five-subunit assembly, also known as the WAVE regulatory complex, that directly activates the Arp2/3 complex (Rottner et al., 2021). The SCAR/WAVE complex is functionally conserved in Drosophila (Kunda et al., 2003), where it forms from SCAR, Abi, HSPC300, Cyfip, and Hem (FlyBase).
During Drosophila DC, contraction of the dorsal amnioserosa tissue pulls the epidermis of each side of the embryo to the dorsal midline (Figure 1A). A taut supracellular actomyosin cable forms around the full leading edge (LE) of the epidermis by end-to-end integration of individual actomyosin cables via AJs (Figure 1A; Kiehart et al., 2017), and coordinates dorsally directed movement of the epidermis (Ducuing and Vincent, 2016; Pasakarnis et al., 2016). Suggesting sarcomere-like organization, myosin accumulates centrally within the individual cable of each cell, whereas an F-actin plus-end marker enriches at each end of the cable near LE AJs (Figure 1A; Manning et al., 2019). Cable assembly involves planar polarity signaling, Rho small G protein activation, and myosin phosphoregulation (Harden et al., 1999; Bloor and Kiehart, 2002; Jacinto et al., 2002; Kaltschmidt et al., 2002; Mizuno et al., 2002). Assembly also involves Rac small G proteins (Woolner et al., 2005) and the cytohesin Arf-GEF Step (West and Harris, 2020), but involvement of the SCAR/WAVE and Arp2/3 complexes is unknown.
FIGURE 1:

SCAR/WAVE complex components enriched at LE junctions between epidermal cells. (A) Left to right, schematics of Drosophila embryo dorsal side at DC, cell organization at amnioserosa (as)–epidermis (epi) interface, and molecular organization of one-cell segment of LE supracellular actomyosin cable. (B) SCAR antibody staining with AJ-marker Cno at mid-DC. Hereafter, amnioserosa at top and epidermis at bottom. White arrow shows LE. Yellow arrowheads show SCAR enrichments at LE junctions between epidermal cells. White arrowheads show SCAR enrichments at TCJs of rear epidermis. (B′,B′′) Magnifications of boxes in B with Z-sections spanning upper and lower bounds of junctional Cno (above) and showing SCAR (below) at LE junctions (B′) or TCJs (B″). (B′′′) Line scans of SCAR signal along single cell–cell contacts of two dorsalmost epidermal cells and extending past LE (e.g., blue line in B) on single confocal sections at level of Cno-stained AJs. Data background corrected and normalized to the LE junction signal. Single line scans shown from five embryos. (B′′′′) Line scans of SCAR signal along the LE encompassing three LE cell–cell junctions (e.g., red line in B) on single confocal sections at level of AJs. Data background corrected and normalized to center LE junction signal. Single line scans shown from five embryos. (C–C′′′′) As in B–B′′′′, Abi #1 antibody staining at DE-cad–positive AJs.
RESULTS AND DISCUSSION
The SCAR/WAVE complex is enriched at LE cell–cell junctions between epidermal cells
To localize the SCAR/WAVE complex during DC, we began by immunostaining two of its components, SCAR and Abi (“Abi #1” and “Abi #2” indicate different Abi antibodies; see Materials and Methods for sources). To compare with AJs, we costained for the AJ components Drosophila E-cadherin (DE-cad) or Canoe (Cno). SCAR, Abi #1, and Abi #2 antibody staining revealed enrichment at LE AJs between epidermal cells (Figure 1, B and C, and Supplemental Figure S1A; yellow arrowheads), at tricellular junctions (TCJs) of epidermal cells to the rear (Figure 1, B and C, and Supplemental Figure S1A; white arrowheads), and less so at bicellular junctions of epidermal cells to the rear. For both the LE AJs and the TCJs, the degree of SCAR and Abi colocalization with the AJ markers is shown in magnified views of sequential confocal sections starting at the apical surface of the cells and passing through the AJs (Figure 1, B′ and B″, and C′ and C″). Individual LE distributions were compared across different embryos with line scans (see Materials and Methods). Line scans of signal intensity along the bicellular contact between neighboring dorsalmost epidermal cells (see example blue line in Figure 1B) showed that the highest SCAR and Abi #1 signal was consistently at the LE of the contact (Figure 1, B′′′ and C′′′). Line scans of signal intensity along the LE (see example red line in Figure 1B) showed that the highest SCAR and Abi #1 signal was consistently at LE cell–cell junctions between epidermal cells, with lower levels between the junctions along the LE (Figure 1, B′′′′ and C′′′′). Signal ratios between the LE and rear of single cell–cell junctions between dorsalmost epidermal cells were averaged for 10 junctions per embryo (see Materials and Methods), and from the averaged values of 5 embryos for each antibody we calculated (5.01±2.04)-fold and (4.32±0.49)-fold enrichments at LE junctions for the SCAR and Abi#1 signals, respectively (mean ± SD).
To confirm SCAR/WAVE complex localization in live embryos, we used two probes. Live imaging of mCherry-tagged Abi overexpressed from a UAS construct revealed an enrichment of mCherry-Abi to LE junctions (Supplemental Figure S1B; yellow arrowheads), to TCJs of epidermal cells to the rear (Supplemental Figure S1B; white arrowheads), and less so to bicellular junctions. Live imaging of endogenously expressed SCAR–neon green also revealed enrichment at LE junctions (Supplemental Figure S1C). Overall, multiple distinct probes detected SCAR/WAVE complex enrichment at LE AJs between epidermal cells, where the supracellular actomyosin cable is found. Notably, all probes displayed variable levels across LE junctions of individual embryos, suggesting SCAR/WAVE complex recruitment by local effects.
Actomyosin activators promote SCAR/WAVE complex accumulation at LE junctions
To test whether SCAR/WAVE complex recruitment to LE AJs is influenced by actomyosin activators, we conducted gain-of-function and loss-of-function experiments known to affect myosin activity at the LE. We increased myosin activity by overexpressing a constitutively active form of myosin light chain kinase (MLCKCA) previously shown to induce constriction of dorsalmost epidermal cells during DC (West et al., 2017). UAS-MLCKCA was expressed in epidermal stripes perpendicular to the LE using paired-GAL4. Cno and DE-cad staining showed a segmental pattern of hyperconstricted LE epidermal cells and abnormal scalloping of the LE at these sites (Figure 2, A and B; yellow brackets). Strikingly, SCAR and Abi accumulated at LE cell–cell junctions in the hyperconstricted regions compared with neighboring regions without constriction (Figure 2, A and B; yellow brackets). The SCAR and Abi increases occurred specifically at LE junctions, whereas Cno and DE-cad levels increased around the full junctional circumference of the constricted cells, suggesting the SCAR and Abi responses were due to local junctional myosin activity rather than a general concentration by the reduction of junctional circumference. The induced accumulation was quantified across embryos as a ratio of SCAR or Abi signal at LE junctions of constricted cells versus neighboring normal cells (Figure 2C). Thus, elevated actomyosin activity can increase SCAR and Abi accumulation at LE junctions.
FIGURE 2:
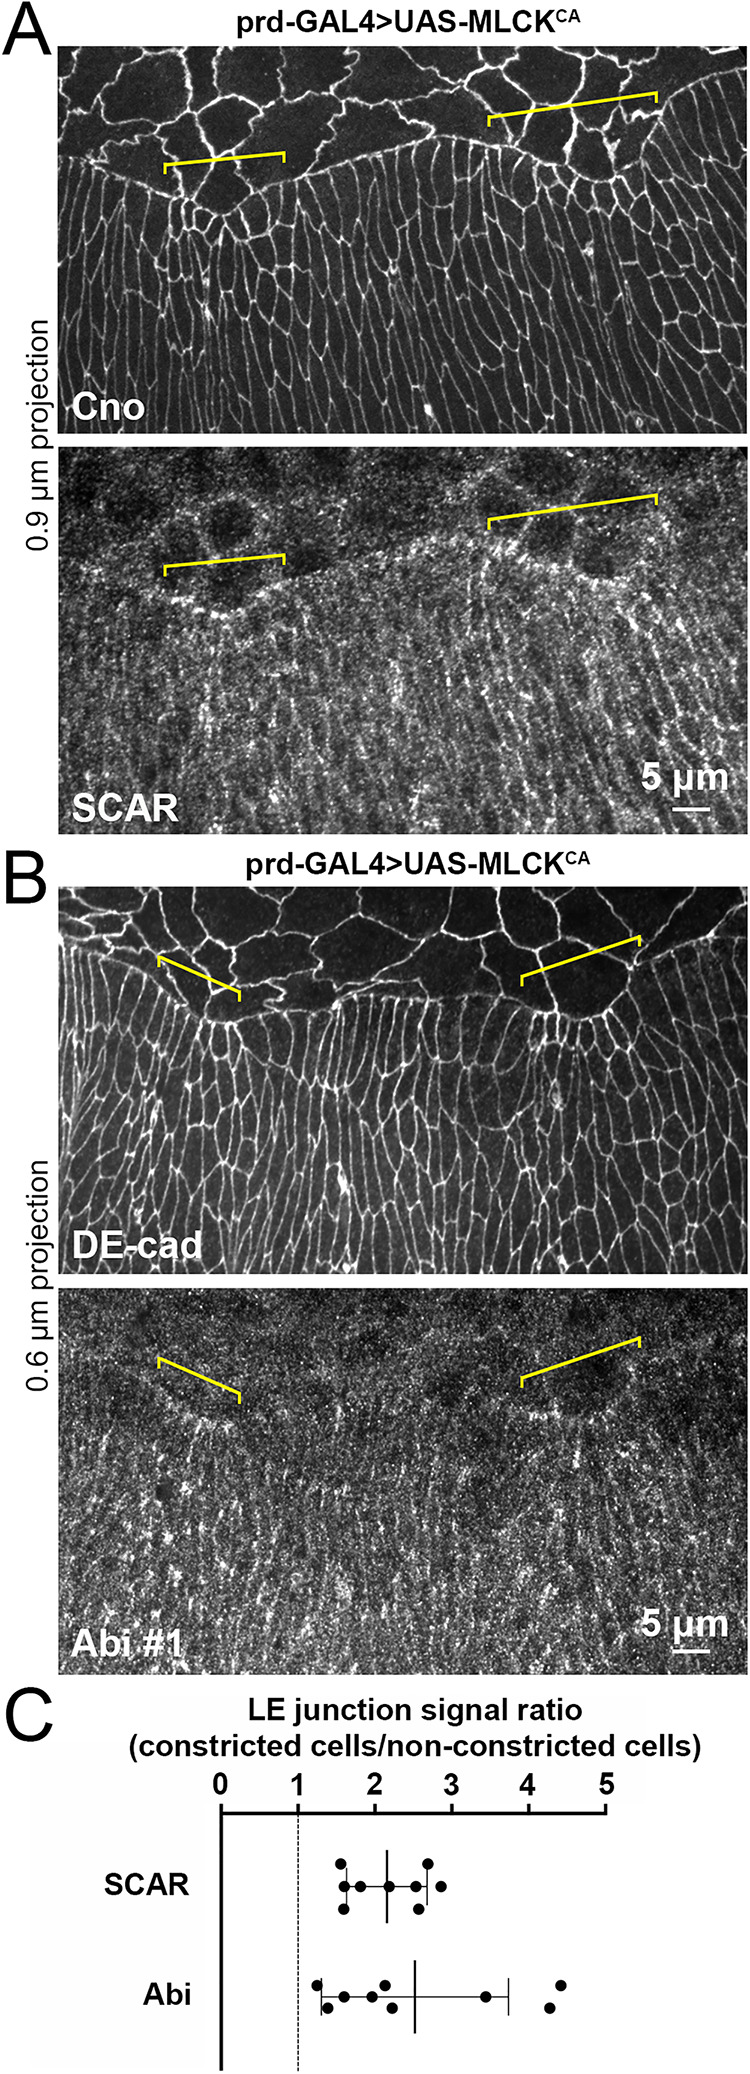
Expression of constitutively active MLCK induces LE constriction and increased accumulation of SCAR and Abi at LE junctions. SCAR antibody (A) and Abi #1 antibody (B) staining of mid-DC embryos overexpressing constitutively active MLCK (MLCKCA) in stripes with paired-GAL4 (prd-GAL4). Cno or DE-Cad show AJs. Yellow brackets show induced constrictions of LE cells. (C) Ratios of SCAR and Abi #1 signals at LE junctions of constricted versus nonconstricted cells. For each embryo, an average of five highest signals of constricted LE contacts divided by five highest signals of nonconstricted LE contacts. Measured after background corrections on single sections at level of AJs, using Cno or DE-Cad. One embryo ratio is one dot. Mean ± SD of embryo ratios shown as lines.
To reduce actomyosin activity, we targeted the actomyosin activator and small G protein Rho1 by producing homozygous mutants of a loss-of-function allele (Rho1720) previously shown to have a disorganized LE actomyosin cable during DC (Jacinto et al., 2002). Compared to costained sibling controls, SCAR and Abi levels at LE AJs were generally reduced, whereas levels at TCJs of epidermal cells to the rear seemed unaffected (Figure 3, A and B). Measurements of SCAR and Abi signals in the Rho1 mutants and sibling controls showed a significant reduction of SCAR and Abi levels at LE junctions of the mutants (Figure 3, A′ and B′), and a significant increase to the SD of the LE junctional signals in the mutants (Figure 3, A″ and B″). In contrast, signals at TCJs of cells to the rear were indistinguishable (Figure 3, A′′′ and B′′′). These data indicate that actomyosin activation is required for the enrichment of SCAR and Abi at LE junctions, but not at TCJs of cells to the rear. Taken together, these actomyosin gain-of-function and loss-of-function manipulations argue that the SCAR/WAVE complex associates with LE AJs in response to actomyosin activation.
FIGURE 3:

Rho1 mutants have reduced SCAR and Abi localization at LE junctions. (A) SCAR antibody staining of sibling controls and Rho1720 homozygous mutants at mid-DC. In controls, yellow arrowheads show LE enrichments, which were reduced in mutants. White arrows show LE. Cno shows AJs. (A′, A″) SCAR signal measurements in sibling controls (blue) and Rho1 mutants (red). To assess signal levels and variability across junctions, 10 consecutive LE junctions measured per embryo from single sections at level of AJs, using Cno. Background-corrected measurements normalized to the average of all LE measurements of costained and comounted sibling controls. Eight embryos analyzed per genotype. (A′) Each mean of 10 LE measurements per embryo shown as one dot. Mean ± SD of all embryo values shown as lines. (A″) Each SD of 10 LE measurements per embryo divided by the mean of the 10 measurements and shown as one dot. Means of all embryo values shown as lines. (A′′′′) Each mean of 10 rear TCJ measurements per embryo shown as one dot. Mean ± SD of all embryo values shown as lines. (B–B′′′) Analyses of A–A′′′ conducted for Abi #1 antibody staining. AJs detected by DE-cad. Ten embryos analyzed. ns, not significant; **, p < 0.01 for both Student’s t test and Mann-Whitney U test.
LE SCAR/WAVE complex enrichments partly colocalize with Step and require Step
The Arf-GEF Step has a similar wild-type localization pattern as the SCAR/WAVE complex during DC, and responds similarly to MLCKCA overexpression and Rho1 loss of function (West et al., 2017; Zheng et al., 2019). Furthermore, Arf small G protein signaling promotes SCAR/WAVE complex activity in other systems (Koronakis et al., 2011; Humphreys et al., 2013; Singh et al., 2020). Thus, we hypothesized that Step mediates SCAR/WAVE complex recruitment by actomyosin activation at the LE.
To directly compare the spatial relationship of Step, SCAR, and Abi at DC, we immunostained SCAR and Abi in embryos homozygous for a GFP-insertion step allele (stepGFP). Along the LE of dorsalmost epidermal cells, the accumulations of all three proteins overlapped at cell–cell junctions, although Step-GFP accumulations were more focused at the extreme front of the cell–cell contacts and the SCAR and Abi accumulations extended slightly rearward along the contacts (Figure 4A; yellow arrowheads; white signal in merged image shows colocalization of all three proteins). Coaccumulation of all three proteins was also evident at TCJs of epidermal cells to the rear (Figure 4A; white arrowheads).
FIGURE 4:

Step partly colocalizes with SCAR and Abi at LE junctions and is required for their LE junction localization. (A) Antibody staining of SCAR (blue) and Abi #1 (red) in embryos expressing Step-GFP (green) from a homozygous GFP-insertion allele at mid-DC. Yellow arrowheads show colocalization at LE junctions. White arrowheads show colocalization at TCJs of rear epidermis. White in merged image shows colocalization. Images representative of 15 embryos. (B, C) Antibody staining of SCAR and Abi #1 in sibling controls and step mutants at mid-DC. White arrows show LE. Black brackets show rear cells. (B′–B′′′) Comparisons of SCAR signals in sibling controls (blue) and step mutants (red; 10 embryos each), as done for Rho1 mutant analyses (see Figure 3 legend) using Cno as an AJ marker. (C′–C′′′) Analyses of B′–B′′′ conducted for Abi #1 signals, using DE-cad as an AJ marker and 10 embryos of each genotype. ns, not significant; *, p < 0.05 for Student’s t test and p < 0.01 for Mann-Whitney U test; **, p < 0.01 for both Student’s t test and Mann-Whitney U test.
To test whether Step affects the localization of the SCAR/WAVE complex during DC, we immunostained SCAR and Abi in step mutant embryos trans-heterozygous for two loss-of-function step alleles (stepKG09493 and stepK08110; Figure 4, B and C). Compared to costained sibling controls, the LE junction localizations of SCAR and Abi were reduced in step mutants (Figure 4, B and C; arrows; quantified in Figure 4, B′ and C′), and were more variable in the step mutants (quantified in Figure 4, B″ and C″). In contrast, enrichments at TCJs of epidermal cells to the rear were indistinguishable between mutants and controls (Figure 4, B and C; black brackets; quantified in Figure 4, B′′′ and C′′′). Thus, Step is specifically required for accumulation of the SCAR/WAVE complex at AJs of the supracellular actomyosin cable along the LE, but not for SCAR/WAVE complex enrichment to TCJs of cells to the rear. The requirement of Rho1 for SCAR/WAVE complex accumulation was also specific for the LE (Figure 3). Compared to cell–cell contacts to the rear, the LE is also where the highest levels of myosin accumulate (Kiehart et al., 2017), where Step is most strongly enriched (Figure 4A; West et al., 2017; Zheng et al., 2019), and where Step is specifically required for F-actin accumulation (West and Harris, 2020). Thus, Step seems specifically needed for SCAR/WAVE recruitment and F-actin accumulation where junctional actomyosin levels are high. Elsewhere, Rac-GEFs and/or other Arf-GEFs may recruit and activate SCAR/WAVE at AJs. Additionally, the TCJ transmembrane protein Sidekick was recently shown to recruit SCAR/WAVE (Malin et al., 2022). Importantly, not all junctional proteins are enriched at LE junctions. For example, LE junctions are depleted of the transmembrane protein Echinoid, the scaffold protein Bazooka/Par-3, and the phosphatase PTEN2 (Laplante and Nilson, 2011; Pickering et al., 2013).
Arp3 accumulates at LE junctions
To assess where the Arp2/3 complex might act during dorsal closure, we compared the localizations of endogenously expressed Arp3-GFP and DE-cad-mTomato in live embryos. Arp3-GFP enrichment was focused at subsets of LE cell–cell junctions (Figure 5; yellow arrowheads), similar to the probes from SCAR and Abi (Figure 1). Arp3-GFP signal was minimal along the length of the cable where epidermal cells adhere to amnioserosa cells. Arp3-GFP also localized to bicellular junctions of epidermal cells to the rear, with occasional enrichment in proximity to TCJs (Figure 5; white arrowheads). This live imaging indicates that Arp3 specifically accumulates where the ends of actomyosin cables connect with AJs of the supracellular actomyosin cable, perhaps akin to Arp2/3-actomyosin associations at spot AJs of mammalian cells (Indra et al., 2020; Li et al., 2021). Its nonuniform localization across LE junctions suggests induction by local events.
FIGURE 5:
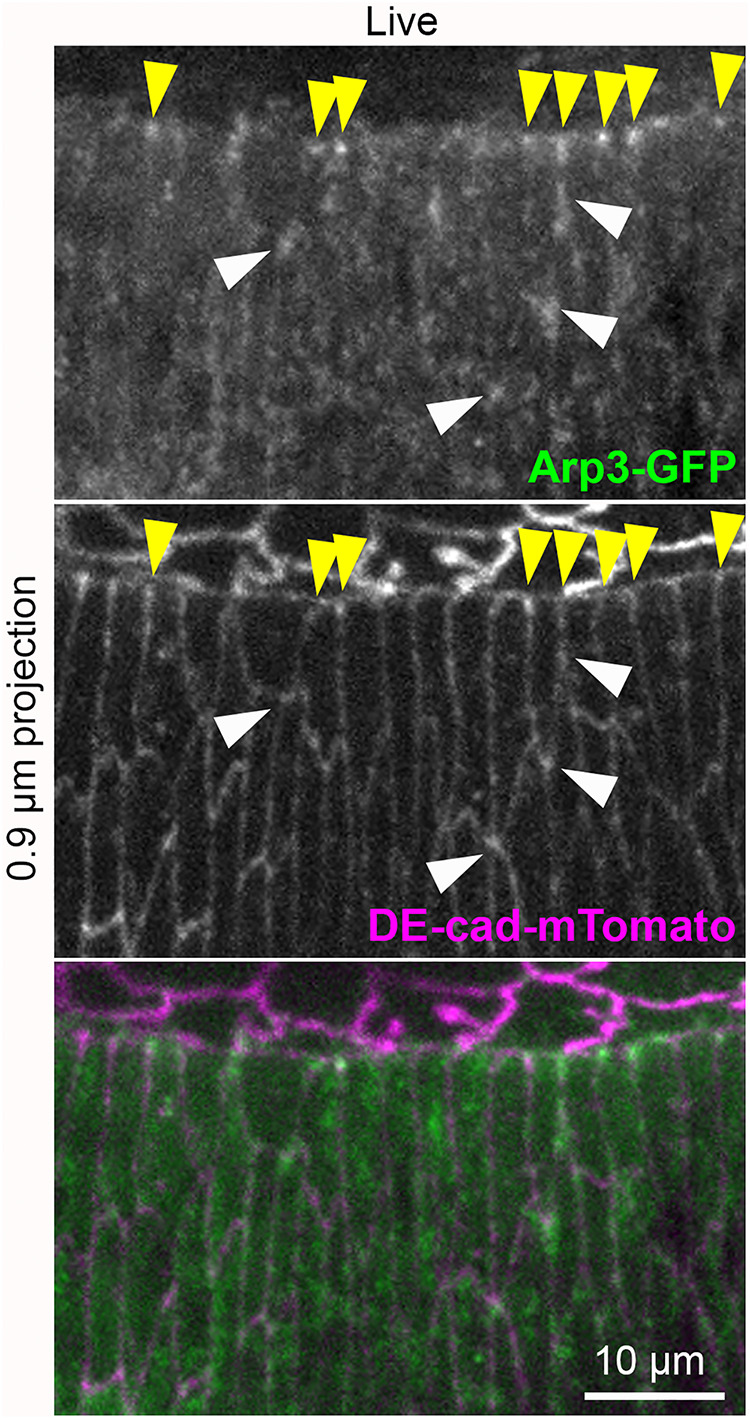
Arp3 localization to LE junctions. Arp3-GFP live imaging at DC. DE-cad-mTomato shows AJs. Embryo heterozygous for each insertion allele expressing tagged proteins endogenously. Yellow arrowheads show Arp3-GFP enrichments at LE junctions between epidermal cells. White arrowheads show Arp3-GFP accumulations near TCJs of rear epidermis. Image representative of 6 embryos dual imaged for Arp3-GFP and DE-cad-mTomato, and 13 embryos expressing Arp3-GFP alone.
Concluding remarks and limitations of the study
Once viewed as distinct, Arp2/3 and actomyosin networks have recently been shown to have close relationships at AJs. Our study identified that this relationship exists along the supracellular actomyosin cable of the LE during DC of the Drosophila embryo. We found that Arp2/3 and its upstream activator, the SCAR/WAVE complex, are enriched at AJs of this cable, and that SCAR/WAVE complex accumulation is promoted by actomyosin activators. The Arf-GEF Steppke, a factor previously shown to be recruited to the same sites by the same activators, is also specifically required for the local SCAR/WAVE complex accumulation. Our results suggest that crosstalk between junctional actomyosin and Arp2/3 networks can occur by the combined effect of two established aspects of Arf small G protein signaling: an actomyosin→cytohesin Arf-GEF connection and a cytohesin Arf-GEF→Arf small G protein→SCAR/WAVE→Arp2/3 pathway.
We hypothesize that development and homeostasis of the supracellular actomyosin cable involves dynamic interplay between junctional actomyosin activity and Arp2/3 activity, regulated by Step and SCAR/WAVE. An interesting parallel occurs during mammalian cell podosome assembly, during which the cytohesin ARNO is recruited to an actomyosin- and integrin-enriched outer ring of the podosome and induces an Arp2/3-based actin network that supports the podosome core (Rafiq et al., 2017). The degree and location of Arf small G protein signaling has implications, because excessive Arf signaling leads to EMT, individual cell migration, and cell invasion, most likely due to increased Arp2/3 activity (D’Souza-Schorey and Chavrier, 2006; Myers and Casanova, 2008; Casalou et al., 2016; Singh et al., 2019). The implicated actomyosin→Step→SCAR/WAVE pathway might help confine Arf signaling to specific AJs for local crosstalk between actomyosin and Arp2/3 networks.
Our study has three main limitations. Although the connection between Arf small G protein signaling and the SCAR/WAVE complex is well documented in other systems, and the players are conserved in Drosophila, the requirement of Step for SCAR/WAVE complex localization might be based on a distinct, and possibly indirect, effect. How the myosin activators affect Step and the SCAR/WAVE complex is unknown and could involve biochemical and/or mechanical signal transduction. Finally, roles of the SCAR/WAVE and Arp2/3 complexes at the LE supracellular actomyosin cable remain to be tested.
MATERIALS AND METHODS
Request a protocol through Bio-protocol.
Drosophila stocks
Stocks used were as follows: UASp-mCherry-Abi (Bloomington Drosophila Stock Center [BDSC]; #58730); UAS-MLCKCA (Kim et al., 2002); Rho172O (BDSC #7325; Strutt et al., 1997); stepGFP (Zheng et al., 2019); stepKG09493 and stepK08110 (abbreviated as stepKG and stepK0; gifts of M. Hoch, Life and Medical Science Institute of Bonn, Germany); daughterless-GAL4 (gift of U. Tepass, University of Toronto, Canada); paired-GAL4 (BDSC #1947); SCARNG (Dobramysl et al., 2021); and Arp3GFP (Xie et al., 2021); shgmTomato (Huang et al., 2009). To distinguish mutants by fluorescence microscopy, alleles were balanced over CyO, twi-GAL4, UAS-GFP (BDSC #6662) or TM3, twi-GAL4, UAS-GFP (BDSC #6663) and selected by the absence of GFP.
Embryo staging, fixation, staining, and imaging
To analyze dorsal closure, embryos were collected 12–14 h after egg laying. Mid-DC embryos were stage matched according to the degree of epidermal cell elongation, the size of the amnioserosa cells, and a lack of dorsal midline sealing at the canthi. All analyses were confirmed in at least two separate replicates.
Embryos were dechorionated with 50% bleach, fixed for 25 min in 1:1 3.7% formaldehyde/phosphate-buffered saline (PBS):heptane and devitellinized by methanol. Blocking and staining was with PBS/1% goat serum/0.1% Triton X-100. The following antibodies were used: rabbit, Cno (1:10,000; gift of M. Peifer, UNC Chapel Hill, NC; Choi et al., 2011) and Abi #1 (1:1000; gift of S. Bogdan, Institute for Physiology and Pathophysiology, Germany; Bogdan et al., 2005); mouse, SCAR (P1C1-SCAR, 1:50; Developmental Studies Hybridoma Bank [DSHB]; Rodriguez-Mesa et al., 2012); rat, DE-Cad (DCAD2, 1:100; DSHB; Oda et al., 1994) and Abi #2 (1:500; gift of S. Lee, Seoul National University, Republic of Korea; Kim et al., 2019). Secondary antibodies were conjugated with Alexa Fluor 546 or 647 (Invitrogen). Fixed and stained embryos were mounted in Aqua Polymount (Polysciences).
For live imaging, dechorionated embryos were glued to a coverslip using tape adhesive dissolved in heptane and mounted in halocarbon oil (series 700; Halocarbon Products). The coverslip, with the embryos facing up, was set into the bottom of a glass-bottom culture dish with its original coverslip removed.
Most imaging was done with a spinning-disk confocal system from Quorum Technologies at RT with a 63X Plan Apochromat NA 1.4 objective (Carl Zeiss), a piezo top plate, an EM CCD camera (Hamamatsu Photonics), and Volocity software (Quorum Technologies). Additional imaging was done at RT with Nikon Ti2 inverted microscopes equipped with Yokogawa CSU-X1 spinning disks and a CCD camera (Photometrics CoolSNAP Myo) or an sCMOS camera (Photometrics Prime 95B), a 60X Plan Apochromat lambda NA 1.4 oil-immersion objective (Nikon), and NIS-elements software (Nikon). In all cases, Z stacks had 300-nm step sizes.
Postacquisition analyses
All quantifications were from at least two separate replicates.
Fluorescence measurements with line scans: Using the line tool in ImageJ (National Institutes of Health), cell–cell junctions of LE epidermal cells were traced (line width of 0.6 µm) and intensities along the lines were collected with the measure tool. For line scans along bicellular contacts between neighboring dorsalmost epidermal cells (see example blue line in Figure 1B), three background measurements were taken in the cytoplasm on each side of the junction. For line scans along the LE (see example red line in Figure 1B), background measurements were taken in the cytoplasm of the four LE cells quantified. Each background measurement was taken with a circle with a diameter of 1.3 µm, and these background measurements were averaged to obtain a single background measurement per embryo and subtracted from the line scan measurements of each corresponding embryo. The background-corrected data were normalized to the value of the single or center LE junction (see the legend of Figure 1 for further details).
Fluorescence measurements with circles: For comparisons between samples, data were collected with the same microscope settings from the same slides. Fluorescence levels were measured at epidermal LE junctions, TCJs, and bicellular junctions in ImageJ using the circle tool, with a diameter of 1.3–1.5 µm, in combination with the measure tool. Background measurements were taken using a circle with a diameter of 1.3–1.5 µm in the cytoplasm of the cells whose junctions were measured, and then subtracted from LE contact measurements. Background-corrected bicellular junction measurements occasionally had negative values, and were excluded from analyses if so.
Statistical analysis
Dot plots showed that most datasets had relatively normal distributions (see figures). Statistical significance was determined both by Student’s t tests (two-tailed, unpaired) using Excel (Microsoft) and by using a Mann-Whitney U test calculator (www.socscistatistics.com/tests/mannwhitney/).
Supplementary Material
Acknowledgments
We thank Rodrigo Fernandez-Gonzalez and Rudi Winklbauer for discussions, and community members listed in the Materials and Methods section for reagents. Stocks used were from the Bloomington Drosophila Stock Center (National Institutes of Health [NIH] P40OD-018537). Monoclonal antibodies used were from the Developmental Studies Hybridoma Bank, created by the NICHD of the NIH, and maintained at The University of Iowa. This research is supported by a CIHR operating grant (Grant no. 82829) and a CIHR project grant (Grant no. PJT-173502) to T.H.
Abbreviations used:
- AJs
adherens junctions
- DC
dorsal closure
- LE
leading edge
- TCJs
tricellular junctions.
Footnotes
This article was published online ahead of print in MBoC in Press (http://www.molbiolcell.org/cgi/doi/10.1091/mbc.E22-03-0107) on April 27, 2022.
REFERENCES
- Adams CL, Chen YT, Smith SJ, Nelson WJ (1998). Mechanisms of epithelial cell-cell adhesion and cell compaction revealed by high-resolution tracking of E-cadherin-green fluorescent protein. J Cell Biol 142, 1105–1119. [DOI] [PMC free article] [PubMed] [Google Scholar]
- Bloor JW, Kiehart DP (2002). Drosophila RhoA regulates the cytoskeleton and cell-cell adhesion in the developing epidermis. Development 129, 3173–3183. [DOI] [PubMed] [Google Scholar]
- Bogdan S, Stephan R, Löbke C, Mertens A, Klämbt C (2005). Abi activates WASP to promote sensory organ development. Nat Cell Biol 7, 977–984. [DOI] [PubMed] [Google Scholar]
- Casalou C, Faustino A, Barral DC (2016). Arf proteins in cancer cell migration. Small GTPases 7, 270–282. [DOI] [PMC free article] [PubMed] [Google Scholar]
- Charras G, Yap AS (2018). Tensile forces and mechanotransduction at cell-cell junctions. Curr Biol 28, R445–R457. [DOI] [PubMed] [Google Scholar]
- Choi W, Jung KC, Nelson KS, Bhat MA, Beitel GJ, Peifer M, Fanning AS (2011). The single Drosophila ZO-1 protein Polychaetoid regulates embryonic morphogenesis in coordination with Canoe/afadin and Enabled. Mol Biol Cell 22, 2010–2030. [DOI] [PMC free article] [PubMed] [Google Scholar]
- D’Souza-Schorey C, Chavrier P (2006). ARF proteins: roles in membrane traffic and beyond. Nat Rev Mol Cell Biol 7, 347–358. [DOI] [PubMed] [Google Scholar]
- Del Signore SJ, Cilla R, Hatini V (2018). The WAVE regulatory complex and branched F-actin counterbalance contractile force to control cell shape and packing in the Drosophila eye. Dev Cell 44, 471–483.e474. [DOI] [PMC free article] [PubMed] [Google Scholar]
- Dobramysl U, Jarsch IK, Inoue Y, Shimo H, Richier B, Gadsby JR, Mason J, Szałapak A, Ioannou PS, Correia GP, et al. (2021). Stochastic combinations of actin regulatory proteins are sufficient to drive filopodia formation. J Cell Biol 220, e202003052. [DOI] [PMC free article] [PubMed] [Google Scholar]
- Ducuing A, Vincent S (2016). The actin cable is dispensable in directing dorsal closure dynamics but neutralizes mechanical stress to prevent scarring in the Drosophila embryo. Nat Cell Biol 18, 1149–1160. [DOI] [PubMed] [Google Scholar]
- Efimova N, Svitkina TM (2018). Branched actin networks push against each other at adherens junctions to maintain cell-cell adhesion. J Cell Biol 217, 1827–1845. [DOI] [PMC free article] [PubMed] [Google Scholar]
- Harden N, Ricos M, Ong YM, Chia W, Lim L (1999). Participation of small GTPases in dorsal closure of the Drosophila embryo: distinct roles for Rho subfamily proteins in epithelial morphogenesis. J Cell Sci 112 (Pt 3), 273–284. [DOI] [PubMed] [Google Scholar]
- Harris TJ, Tepass U (2010). Adherens junctions: from molecules to morphogenesis. Nat Rev Mol Cell Biol 11, 502–514. [DOI] [PubMed] [Google Scholar]
- Huang J, Zhou W, Dong W, Watson AM, Hong Y (2009). From the cover: directed, efficient, and versatile modifications of the Drosophila genome by genomic engineering. Proc Natl Acad Sci USA 106, 8284–8289. [DOI] [PMC free article] [PubMed] [Google Scholar]
- Humphreys D, Davidson AC, Hume PJ, Makin LE, Koronakis V (2013). Arf6 coordinates actin assembly through the WAVE complex, a mechanism usurped by Salmonella to invade host cells. Proc Natl Acad Sci USA 110, 16880–16885. [DOI] [PMC free article] [PubMed] [Google Scholar]
- Indra I, Troyanovsky RB, Shapiro L, Honig B, Troyanovsky SM (2020). Sensing actin dynamics through adherens junctions. Cell Rep 30, 2820–2833.e2823. [DOI] [PMC free article] [PubMed] [Google Scholar]
- Jacinto A, Wood W, Woolner S, Hiley C, Turner L, Wilson C, Martinez-Arias A, Martin P (2002). Dynamic analysis of actin cable function during Drosophila dorsal closure. Curr Biol 12, 1245–1250. [DOI] [PubMed] [Google Scholar]
- Kaltschmidt JA, Lawrence N, Morel V, Balayo T, Fernández BG, Pelissier A, Jacinto A, Martinez Arias A (2002). Planar polarity and actin dynamics in the epidermis of Drosophila. Nat Cell Biol 4, 937–944. [DOI] [PubMed] [Google Scholar]
- Kiehart DP, Crawford JM, Aristotelous A, Venakides S, Edwards GS (2017). Cell sheet morphogenesis: dorsal closure in Drosophila melanogaster as a model system. Annu Rev Cell Dev Biol 33, 169–202. [DOI] [PMC free article] [PubMed] [Google Scholar]
- Kim YS, Fritz JL, Seneviratne AK, VanBerkum MF (2002). Constitutively active myosin light chain kinase alters axon guidance decisions in Drosophila embryos. Dev Biol 249, 367–381. [DOI] [PubMed] [Google Scholar]
- Kim N, Kim S, Nahm M, Kopke D, Kim J, Cho E, Lee MJ, Lee M, Kim SH, Broadie K, Lee S (2019). BMP-dependent synaptic development requires Abi-Abl-Rac signaling of BMP receptor macropinocytosis. Nat Commun 10, 684. [DOI] [PMC free article] [PubMed] [Google Scholar]
- Koronakis V, Hume PJ, Humphreys D, Liu T, Hørning O, Jensen ON, McGhie EJ (2011). WAVE regulatory complex activation by cooperating GTPases Arf and Rac1. Proc Natl Acad Sci USA 108, 14449–14454. [DOI] [PMC free article] [PubMed] [Google Scholar]
- Kunda P, Craig G, Dominguez V, Baum B (2003). Abi, Sra1, and Kette control the stability and localization of SCAR/WAVE to regulate the formation of actin-based protrusions. Curr Biol 13, 1867–1875. [DOI] [PubMed] [Google Scholar]
- Laplante C, Nilson LA (2011). Asymmetric distribution of Echinoid defines the epidermal leading edge during Drosophila dorsal closure. J Cell Biol 192, 335–348. [DOI] [PMC free article] [PubMed] [Google Scholar]
- Lecuit T, Lenne PF, Munro E (2011). Force generation, transmission, and integration during cell and tissue morphogenesis. Annu Rev Cell Dev Biol 27, 157–184. [DOI] [PubMed] [Google Scholar]
- Li JXH, Tang VW, Boateng KA, Brieher WM (2021). Cadherin puncta are interdigitated dynamic actin protrusions necessary for stable cadherin adhesion. Proc Natl Acad Sci USA 118, e2023510118. [DOI] [PMC free article] [PubMed] [Google Scholar]
- Li JXH, Tang VW, Brieher WM (2020). Actin protrusions push at apical junctions to maintain E-cadherin adhesion. Proc Natl Acad Sci USA 117, 432–438. [DOI] [PMC free article] [PubMed] [Google Scholar]
- Malin J, Rosa Birriel C, Astigarraga S, Treisman JE, Hatini V (2022). Sidekick dynamically rebalances contractile and protrusive forces to control tissue morphogenesis. J Cell Biol 221, e202107035. [DOI] [PMC free article] [PubMed] [Google Scholar]
- Manning LA, Perez-Vale KZ, Schaefer KN, Sewell MT, Peifer M (2019). The Drosophila Afadin and ZO-1 homologs Canoe and Polychaetoid act in parallel to maintain epithelial integrity when challenged by adherens junction remodeling. Mol Biol Cell 30, 1938–1960. [DOI] [PMC free article] [PubMed] [Google Scholar]
- Martin AC, Goldstein B (2014). Apical constriction: themes and variations on a cellular mechanism driving morphogenesis. Development 141, 1987–1998. [DOI] [PMC free article] [PubMed] [Google Scholar]
- McNeill H, Ryan TA, Smith SJ, Nelson WJ (1993). Spatial and temporal dissection of immediate and early events following cadherin-mediated epithelial cell adhesion. J Cell Biol 120, 1217–1226. [DOI] [PMC free article] [PubMed] [Google Scholar]
- Mizuno T, Tsutsui K, Nishida Y (2002). Drosophila myosin phosphatase and its role in dorsal closure. Development 129, 1215–1223. [DOI] [PubMed] [Google Scholar]
- Myers KR, Casanova JE (2008). Regulation of actin cytoskeleton dynamics by Arf-family GTPases. Trends Cell Biol 18, 184–192. [DOI] [PMC free article] [PubMed] [Google Scholar]
- Oda H, Uemura T, Harada Y, Iwai Y, Takeichi M (1994). A Drosophila homolog of cadherin associated with armadillo and essential for embryonic cell-cell adhesion. Dev Biol 165, 716–726. [DOI] [PubMed] [Google Scholar]
- Ozawa M, Hiver S, Yamamoto T, Shibata T, Upadhyayula S, Mimori-Kiyosue Y, Takeichi M (2020). Adherens junction regulates cryptic lamellipodia formation for epithelial cell migration. J Cell Biol 219, e202006196. [DOI] [PMC free article] [PubMed] [Google Scholar]
- Paré AC, Zallen JA (2020). Cellular, molecular, and biophysical control of epithelial cell intercalation. Curr Top Dev Biol 136, 167–193. [DOI] [PMC free article] [PubMed] [Google Scholar]
- Pasakarnis L, Frei E, Caussinus E, Affolter M, Brunner D (2016). Amnioserosa cell constriction but not epidermal actin cable tension autonomously drives dorsal closure. Nat Cell Biol 18, 1161–1172. [DOI] [PubMed] [Google Scholar]
- Pickering K, Alves-Silva J, Goberdhan D, Millard TH (2013). Par3/Bazooka and phosphoinositides regulate actin protrusion formation during Drosophila dorsal closure and wound healing. Development 140, 800–809. [DOI] [PubMed] [Google Scholar]
- Pinheiro D, Bellaïche Y (2018). Mechanical force-driven adherens junction remodeling and epithelial dynamics. Dev Cell 47, 3–19. [DOI] [PubMed] [Google Scholar]
- Rafiq NB, Lieu ZZ, Jiang T, Yu CH, Matsudaira P, Jones GE, Bershadsky AD (2017). Podosome assembly is controlled by the GTPase ARF1 and its nucleotide exchange factor ARNO. J Cell Biol 216, 181–197. [DOI] [PMC free article] [PubMed] [Google Scholar]
- Rauskolb C, Cervantes E, Madere F, Irvine KD (2019). Organization and function of tension-dependent complexes at adherens junctions. J Cell Sci 132, cs224063. [DOI] [PMC free article] [PubMed] [Google Scholar]
- Rodriguez-Mesa E, Abreu-Blanco MT, Rosales-Nieves AE, Parkhurst SM (2012). Developmental expression of Drosophila Wiskott-Aldrich Syndrome family proteins. Dev Dyn 241, 608–626. [DOI] [PMC free article] [PubMed] [Google Scholar]
- Rottner K, Stradal TEB, Chen B (2021). WAVE regulatory complex. Curr Biol 31, R512–R517. [DOI] [PMC free article] [PubMed] [Google Scholar]
- Singh V, Davidson AC, Hume PJ, Humphreys D, Koronakis V (2019). Arf GTPase interplay with Rho GTPases in regulation of the actin cytoskeleton. Small GTPases 10, 411–418. [DOI] [PMC free article] [PubMed] [Google Scholar]
- Singh V, Davidson AC, Hume PJ, Koronakis V (2020). Arf6 can trigger wave regulatory complex-dependent actin assembly independent of Arno. Int J Mol Sci 21, 2457. [DOI] [PMC free article] [PubMed] [Google Scholar]
- Strutt DI, Weber U, Mlodzik M (1997). The role of RhoA in tissue polarity and Frizzled signalling. Nature 387, 292–295. [DOI] [PubMed] [Google Scholar]
- Takeichi M (2014). Dynamic contacts: rearranging adherens junctions to drive epithelial remodelling. Nat Rev Mol Cell Biol 15, 397–410. [DOI] [PubMed] [Google Scholar]
- Verma S, Han SP, Michael M, Gomez GA, Yang Z, Teasdale RD, Ratheesh A, Kovacs EM, Ali RG, Yap AS (2012). A WAVE2-Arp2/3 actin nucleator apparatus supports junctional tension at the epithelial zonula adherens. Mol Biol Cell 23, 4601–4610. [DOI] [PMC free article] [PubMed] [Google Scholar]
- West JJ, Harris TJC (2020). The Arf-GEF Steppke promotes F-actin accumulation, cell protrusions and tissue sealing during Drosophila dorsal closure. PLoS One 15, e0239357. [DOI] [PMC free article] [PubMed] [Google Scholar]
- West JJ, Zulueta-Coarasa T, Maier JA, Lee DM, Bruce AEE, Fernandez-Gonzalez R, Harris TJC (2017). An actomyosin-Arf-GEF negative feedback loop for tissue elongation under stress. Curr Biol 27, 2260–2270.e2265. [DOI] [PubMed] [Google Scholar]
- Woolner S, Jacinto A, Martin P (2005). The small GTPase Rac plays multiple roles in epithelial sheet fusion–dynamic studies of Drosophila dorsal closure. Dev Biol 282, 163–173. [DOI] [PubMed] [Google Scholar]
- Xie Y, Budhathoki R, Blankenship JT (2021). Combinatorial deployment of F-actin regulators to build complex 3D actin structures in vivo. Elife 10, doi: 10.7554/eLife.63046. [DOI] [PMC free article] [PubMed] [Google Scholar]
- Yamada S, Nelson WJ (2007). Localized zones of Rho and Rac activities drive initiation and expansion of epithelial cell-cell adhesion. J Cell Biol 178, 517–527. [DOI] [PMC free article] [PubMed] [Google Scholar]
- Zheng S, West JJ, Yu CG, Harris TJC (2019). Arf-GEF localization and function at myosin-rich adherens junctions via coiled-coil heterodimerization with an adaptor protein. Mol Biol Cell 30, 3090–3103. [DOI] [PMC free article] [PubMed] [Google Scholar]
Associated Data
This section collects any data citations, data availability statements, or supplementary materials included in this article.