

Abstract
Highly energy dense foods are often synonymous with high palatability, excess intake and weight gain. However, food preferences show individual differences. Food preferences are closely related to food intake, which can impact weight change over time. We examined whether the energy density of food images rated as appetizing and unappetizing foods related to baseline BMI and change in BMI over 3-year follow-up (n=117; 45% Male, Baseline BMI: . 21.1±1.9. Participants completed hedonic visual analog scales (−100 to 100) ratings of 103 food images, and reported dietary intake at baseline, and had their height and weight directly measured over 3-year follow-up. Energy density (ED) of the food depicted in each image was calculated. For each participant, food images (kcal/g) were categorized into appetizing (32 images) and unappetizing foods (32 images) based on each individual’s hedonic ratings. We observed significant interaction between energy density and hedonic value driven by an inverse relation between unappetizing food energy density and BMI change (p = 0.008). Specifically, participants who rated higher energy dense foods as unappetizing showed less weight gain (β = −0.83; p = 0.00052). There was no significant relation between the energy density of appetizing foods and weight change (p = 0.67), suggesting that dislike of highly energy dense foods more strongly associates with lower weight gain than preference for low energy dense foods. Post-hoc analyses revealed that individuals with a higher preference for low energy density foods showed less weight gain over 3-years (β = - 0.007, p = 0.02). Results support the idea that individual hedonic ratings for foods varying in energy density is a determinant of weight change in adolescents and may represent an important intervention target for obesity prevention programs.
Keywords: Food Preferences, Hedonic Ratings, Energy Density, Weight Gain, Liking, Wanting, Obesity, Hedonic value
Introduction
Adolescence is a time of increasing independence over lifestyle and dietary decisions and is a critical period in the lifecycle to investigate obesogenic behaviors (Bassett, Chapman, & Beagan, 2008). This time is particularly important because overweight versus healthy-weight adolescents are at a greater risk to become overweight or obese adults (Alberga, Sigal, Goldfield, Prud’ homme, & Kenny, 2012; Singh, Mulder, Twisk, van Mechelen, & Chinapaw, 2008). The consumption of foods that are high in fat and sugar elicit potent reward-related brain response (e.g., dopaminergic) that are thought to impact weight regulation (Berridge, Ho, Richard, & DiFeliceantonio, 2010; Burger & Stice, 2011). Data support the notion that overconsumption of energy-dense foods is associated with greater responsivity of brain reward circuitry during exposure to food cues (Burger & Stice, 2014; Gearhardt et al., 2011). Repeated exposure to these cues may override the homeostatic mechanisms that control dietary intake, increasing risk for repeated consumption and excess weight gain (Burger, 2017; Burger & Stice, 2012, 2013; Finlayson, King, & Blundell, 2007). Objective food traits such as energy density, fat content, and sugar content can influence dietary intake, yet these traits do not necessarily capture subjective hedonic value of foods.
Explicit hedonic value of foods is typically assessed on an individual basis by rating foods on constructs such as ‘liking’, ‘appeal’, and ‘desire to consume’ via visual analog scales (VAS). Similar to the objective characteristics of food mentioned above, subjective hedonic value of foods has been found to predict energy intake and/or the amount of food consumed at a meal (Adam Drewnowski & Hann, 1999; Hetherington, Bell, & Rolls, 2000; Hetherington & Rolls, 1996). As such, hedonic value of food is theorized to be a potent determinant of dietary intake and weight regulation (Lowe & Butryn, 2007; Mela, 2006). Further, desire to consume palatable foods is a known barrier to healthy eating in adolescents and may contribute to excess weight gain (Diepenbroek et al., 2017; Stevenson, Doherty, Barnett, Muldoon, & Trew, 2007). Although studies have examined the influence of subjective hedonic value foods on dietary intake, there remains a gap in the literature. Commonly, a positive subjective hedonic value is assumed when participants are being presented with high-fat/high-sugar foods, but hedonic valuation of food and food preferences vary across individuals (Lanfer et al., 2012). Individual differences in genetics, culture, and environment contribute to differences in taste preferences (Birch, 1999; A Drewnowski, 1997). Also, preference for foods, in particular low energy density foods, can be learned (Yeomans, 2006). For example, in children, vegetables may initially be rejected, but acceptance can occur after repeated exposure (Birch, 1999; Johnson, McPhee, & Birch, 1991). It is reasonable to hypothesize that new, energy dense foods would be accepted for consumption at a faster rate than foods that are have lower energy density, as they tend to be less palatable (Adam Drewnowski, 1998), but preferences of all types of foods can be developed over time (Yeomans, 2006). Assuming that all energy dense foods are preferred overlooks individual variance in hedonic valuation. This assumption can be particularly detrimental to interpretation of studies that use stimuli varied on energy density, and do not measure hedonic ratings of food to assess the impact of weight and/or dietary restraint on response.
To date, a few studies have explored the relationship between hedonic ratings of foods varied in energy density with weight status, with mixed results (Nederkoorn, Houben, Hofmann, Roefs, & Jansen, 2010; Potter, Griggs, Ferriday, Rogers, & Brunstrom, 2017). In children, high hedonic valuation of energy dense foods was not related to cross-sectional BMI (Potter et al., 2017). While in adults, preference for energy dense foods was associated with 1-year prospective weight gain in individuals with low inhibitory control (Nederkoorn et al., 2010). Investigating the independent effects of objective caloric density and individual subjective hedonic ratings of foods may provide meaningful information regarding future dietary intake and weight change. Given the known impact of repeated consumption on the development of food preferences, it is prudent to also attempt to capture habitual dietary intake. As such, the primary goal of this study was to test if hedonic ratings of food images and the energy density of the foods predicts baseline BMI and BMI change over 3-year follow-up. Based on prior research (Nederkoorn, Guerrieri, Havermans, Roefs, & Jansen, 2009; Potter et al., 2017), we hypothesized that preference for highly energy dense foods would not be associated with baseline weight status, but would predict weight gain at 3-year follow-up.
Materials & Methods
Participants
Participants were recruited from the Portland, Oregon area to participate in a study of brain response to a chocolate beverage and food images. Participants were recruited to be 14 to 16 years old and have a BMI within the 25th – 75th BMI-for-age percentile, making the sample all healthy-weight. Further details about the sample, recruitment, and complete study procedures are detailed in prior reports (Stice, Burger, & Yokum, 2013). In total, 133 participants completed baseline measures including anthropometrics, questionnaires, and the image rate paradigm. Over the 3 years of follow-up, 117 completed at least one year of anthropometric measures. Individuals who reported binge eating or compensatory behavior in the past 3 months, use of psychotropic medications or illicit drugs, head injury with a loss of consciousness, or Axis I psychiatric disorder in the past year (including anorexia nervosa, bulimia nervosa, or binge eating disorder) were excluded. All parents provided written informed consent and adolescents provided written assent. Oregon Research Institute’s Institutional Review Board approved all methods, registration can be seen at clinicaltrials.gov as NCT01949636.
Image Presentation and Hedonic ratings
Food images were presented one at a time, in a random order, using Presentation (Version 9.81, www.neuro-bs.com) on a 17-inch computer monitor in a quiet, private room where participants progressed at their own pace. Participants were instructed on how to use the ImageRate® computer program to rate the hedonics of the food images, and then were given the opportunity to practice with the assistance of the researcher to ensure complete understanding of the procedures. Participants rated how appealing (‘How appealing is this food’) each food appeared using a response scale ranging from −100 (‘Not appealing at all/disgusting’) to 100 (‘Extremely appealing’) on a sliding visual analog scale (VAS). Participants did not see the numerical rating. This approach is similar to previous reported methods (Burger et. al, 2011).
Food images & Energy density
A total of 127 food images were presented. The foods depicted in the images were pretested to ensure that each was easily and consistently identified. A wide variety of foods (without overrepresentation of one kind of food item) were presented in a state that was representative of typical consumption (i.e., prepared to eat). Images were selected to represent a variety of ethnic foods and foods for all eating occasions, such as snack, meal, individual foods and combinations. All images were matched for brightness and contrast using Microsoft Office Picture Manager® (Microsoft, Seattle WA, 2007), sized to be at least 800 × 600 pixels, and were converted to JPEG files. No food logos or product advertisements were used to prevent confounding or influencing the rating of the food. Liquids were excluded from the image set due to difficulty in visually differentiating among different types of beverages. Additional detail regarding the development of the image set has been previously published (Burger et al., 2011). Energy density of each food image was calculated using the USDA Food Composition Data Databases (NDB; https://ndb.nal.usda.gov/ndb/; Accessed in May 2016). Foods were searched for in the NDB by two individuals, a registered dietitian and research assistant. Classification was then compared to insure reliability. In the case the selected item was not the same (via NDB number), consensus was reached via discussion. The energy density was determined using the NDB calorie amount per 100g of food.
Anthropometrics
Height was measured to the nearest mm using a stadiometer. Weight was assessed to the nearest 0.1 kg using digital scales with participants wearing light clothing without shoes at each assessment. BMI (kg/m2) correlates with measures of body fat (r = 0.80–0.90) and with biomarkers of health in young adult samples (Dietz & Robinson, 1998). BMI z-score was also calculated based on the Center for Disease Control (CDC) growth charts (Cole, Bellizzi, Flegal, & Dietz, 2000). BMI was assessed at baseline to confirm the present effects were not driven by differences in body mass, and at 1-, 2-, and 3-year follow-ups to create weight change slopes and intercepts. Raw BMI scores were used to assess BMI changes, as they are superior to BMI-for-age percentiles or BMI z-scores for modeling change over time in longitudinal analyses (C S Berkey & Colditz, 2007).
Perceived Dietary Intake
The 60-item Block Food Frequency Questionnaire (BFFQ; (Block, Hartman, & Naughton, 1990)) asks about the frequency of consumption of 60 specific food types. In the question prompt, participants are given a definition of a medium portion of that food item and asked to indicate the frequency of consumption over the previous 2-week period. Response options ranged from 1 – “never” in the last 2 weeks” to 6 – “daily or more in the last 2 weeks”. In adults, the BFFQ values correlated (r = 0.57) with 4-day food record estimates for total energy intake and most nutrients, and show 2-wk test-retest reliability (M r = 0.69 (Block & Subar, 1992; Klohe et al., 2005)). While there are FFQs that are aimed specifically at assessing diets in adolescents (Frank et al., 1992), the investigative team selected the adult version given the longitudinal nature of the primary study and the aging of the sample into adulthood. Daily caloric intake, percent daily caloric intake from fat, and percent daily caloric intake from sugar were estimated from BFFQ responses. Percent daily caloric intake from fat and sugar were examined as they relate most closely to the energy density of foods. To examine possible reporting bias, analyses using reported total intake and percentage of kcal from fat and sugar where run with only participants meeting the Goldberg cutoff (reported intake > 1.35* [estimated] resting metabolic rate) (Goldberg et al., 1991). Adjustments to sample based on the Goldberg cutoff did not significantly impact the presented results.
Hunger
Participants were asked to consume their regular meals but to refrain from eating or drinking (other than water) for 4 hours immediately preceding their assessment for standardization of subjective feelings of hunger, as described in (Stice et al., 2013). Prior to image rating, hunger was assessed via a VAS anchored by: 0 -’not hungry at all to 100 - ‘Extremely hungry’.
Dietary restraint
The Dutch Restrained Eating Scale (DRES; van Strien et al., 1986) assesses dietary behaviors designed to produce weight loss and weight maintenance (sample item: Do you deliberately eat less in order not to become too heavy?). This scale has shown internal consistency (α = 0.94) and temporal reliability: r = .85 in adolescents (Banasiak, Wertheim, Koerner, & Voudouris, 2001).
Pubertal Stage
Pubertal development is related to % body fat (Sun et al, 2001), and may confound change in BMI. Stage of pubertal development was assessed using the Pubertal Development Scale, which asks a series of sex-specific questions to assess pubertal stage (Petersen, Crockett, Richards, & Boxer, 1988). Responses are averaged, and the resulting scores range from 0–5. A score of ≥2 is indicative of pubertal onset. Self-rated pubertal development shows adequate internal consistency in adolescent boys and girls (α’s = 0.76 – 0.84) and correlates with physician ratings of development (r’s = 0.61 – 0.67) (Petersen et al., 1988).
Statistical analyses
Statistical analyses were performed using R (v.3.3.2, The R Foundation for Statistical Computing). Descriptive statistics to summarize means, standard deviation, and percentages were generated for variables of interest including age, biological sex, BMI, BMI-for-age percentile (which accounts for age and sex), perceived dietary patterns, hunger and dietary restraint. Two groups of food images were derived from ImageRate hedonic ratings. Appetizing and unappetizing food image groups were determined by selecting the top 32 rated images as appetizing and the lowest 32 rated images (excluding images rated as disgusting [−100]) for each participant. The average hedonic rating and energy density of each image group was calculated per participant.
The main outcome of interest was BMI change over three years. This was modeled using hierarchal linear modeling techniques to capture measurements across time. Per participant, a linear line was fit to measurements of raw BMI at baseline, years 1, 2, and 3 of follow-up. The resulting trendline was considered BMI slope, or the change in BMI over 4 years.
Pearson’s correlations were used to examine the relationship between continuous baseline measures including energy density of the appetizing and unappetizing image groups, self-reported hunger, dietary restraint, and PDS score. Significant correlations were considered Holm’s corrected p < 0.05. Independent samples t-tests were used to test for differences between male and female participants in baseline measures including age, BMI z-score, hunger, PDS score, average rating of all images, average rating of appetizing images, average rating of unappetizing image, average ED of appetizing images, and average ED of unappetizing images. Significant differences were considered at Bonferroni-corrected p < 0.005.
Multivariate linear regression was used to test if hedonic ratings and energy density predict baseline BMI and change in BMI. Two regression models were tested. The first model tested if baseline BMI z-score (outcome) is predicted by the average ED of appetizing food images (predictor) and the average ED of unappetizing food images (predictor), controlling for dietary restraint, hunger, and pubertal development (covariates). The second model tested if 3-year change in BMI (outcome) is predicted by the average ED of appetizing food images (predictor) and the average ED of unappetizing food images (predictor), controlling for baseline dietary restraint, baseline hunger, and baseline pubertal development, biological sex, and baseline BMI (covariates). Model significance was considered at Bonferroni-corrected p < 0.025, and predictors significance was considered at p < 0.05.
Post hoc analyses.
We completed additional multivariate regression models test for interaction of characteristics previously demonstrated to affect the relationship between energy density, hedonic ratings, and weight change (Nederkoorn et al., 2010; Potter et al., 2017). In model 3, we tested if there was an interaction between dietary restraint and the average energy density of unappetizing food images to predict 3-year change in BMI. In model 4, we tested if there was an interaction between biological sex and the average energy density of unappetizing food images to predict 3-year change in BMI.
Further, two additional models were tested to explore other potential predictors of BMI change within the present sample. Perceived dietary intake as measured by self-report is directly related to prospective weight gain risk (Catherine S Berkey et al., 2000). As such, multivariate linear regression was used to test if perceived dietary intake, including daily caloric intake (predictor), daily percent kilocalories from fat (predictor), and daily percent kilocalories from sugar (predictor) predicted BMI change (outcome), controlling for baseline BMI (covariate). Additionally, to further characterize the relationship between hedonic ratings of food images, energy density, and BMI change, and to determine if effects were driven by the individualization the images sets, we tested a model that used the same set of stimuli for all participants. For this analysis, we selected a set of 32 high ED food images (ED > 2.9 kcal/g, mean ED = 3.9 kcal/g) and 32 low ED food images (ED < 0.7 kcal/g, mean ED = 0.42 kcal/g) from the ImageRate set. Participant’s average hedonic rating of the high ED images and the low ED images were calculated. Multivariate linear regression was used to test if change in BMI (outcome) is predicted by average hedonic rating of the high ED images (predictor) and the low ED images (predictor), controlling for baseline BMI (covariate).
Results
Participant demographics and general characteristics of hedonic food ratings can be seen in Table 1. The sample included 53 male and 64 female healthy-weight adolescents (age = 15.0 ± 0.9; BMI = 21.2 ± 2.3). Of the total sample, 77% reported being White, 9% Black, 6% Asian, 3% Native American, and 2% Native Hawaiian/Pacific Islander. Eight percent of the sample identified as Hispanic. The average weight change in the sample across 3 years was an increase of 0.5 ± 0.65 kg/m2 per year. On average, participants reported experiencing onset of puberty (PDS-score 2.6 ± 0.4). Additionally, there was a significant difference between male and female participants in a number of baseline characteristics, including DRES score (female = 18.2 male = 14.1; t = 3.8; p = 0.0002), PDS score (female = 2.9 male = 2.3; t = 8.6; p < 0.0001), average energy density of appetizing foods (female = 1.9 male = 2.2; t = −3.3; p = 0.001), and average energy density of unappetizing foods (female = 2.0 male = 1.8; t = 3.8; p = 0.002).
Table 1.
Participant Characteristics and ImageRate Results
| Female (n=64) |
Male (n=53) |
Total (n =117) |
|
|---|---|---|---|
| Age (y) | 15.1 ± 0.9 | 14.8 ± 0.8 | 15.0 ± 0.9 |
| Baseline BMI z-score | 0.4 ± 0.7 | 0.3 ± 0.7 | 0.3 ± 0.7 |
| BMI Slope (ΔBMI/year) | 0.5 ± 0.6 | 0.5 ± 0.8 | 0.5 ± 0.7 |
| Hunger (range, 0–100) | 11.2 ± 3.6 | 10.7 ± 4.4 | 11.0 ± 4.0 |
| Dietary restraint (0–50) * | 18.2 ± 7.0 | 14.2 ± 4.3 | 16.4 ± 6.3 |
| Pubertal Development Stage (0–5) * | 2.9 ± 0.3 | 2.3 ± 0.4 | 2.6 ± 0.4 |
| Mean Hedonic Ratings (−100–100) | |||
| All images | 11.6 ± 17.2 | 20.3 ± 17.5 | 15.6 ± 17.8 |
| Appetizing foods | 70.6 ± 19.2 | 72.3 ± 17.5 | 71.4 ± 18.4 |
| Unappetizing foods | −46.6 ± 26.5 | −35.6 ± 22.6 | −41.6 ± 25.2 |
| Mean Energy Density (kcal/g) | |||
| Appetizing foods * | 1.9 ± 0.4 | 2.2 ± 0.4 | 2.0 ± 0.4 |
| Unappetizing foods * | 2.0 ± 0.3 | 1.8 ± 0.4 | 1.9 ± 0.4 |
Significant difference between female and male groups assessed via two-samples t-test (p < 0.005)
ImageRate Results and Baseline Correlations
As expected based on the selection criteria, appetizing food images were related significantly higher on hedonic scales than unappetizing food images (mean appetizing rating: 71.4 ± 18.4; mean unappetizing rating: −41.6 ± 25.2; t = 37.37, p <0.001). However, appetizing food image group was only marginally higher in energy density than the unappetizing food image group (mean appetizing food ED: 1.80 kcal/g; mean unappetizing food ED: 1.64 kcal/g; t = 1.77, p = 0.079). Foods most commonly included in participant’s appetizing image set included mixed berries, chocolate candies, and french fries; while foods most commonly included in participant’s unappetizing image set included grilled vegetable skewers, mixed nuts, and wild rice. While the ED of the appetizing food images and unappetizing food images was significantly correlated (r = −0.7, p < 0.01), there were no significant correlations between the ED of appetizing images or unappetizing images with hunger or pubertal development [r’s: −0.19 – 0.19; p’s 0.68 – 1.0]. The ED of appetizing food images was moderately correlated with dietary restraint (r = −0.28), and the relationship was trending towards significance (p = 0.05).
Predictive effects of energy density of appetizing and unappetizing food images on current and future body mass
Multivariate linear regression was used to test if the average ED of appetizing food images and the average ED of unappetizing food images predicts baseline BMI, controlling for dietary restraint, hunger, and pubertal development (Table 3). The model explained 4.2% of the variance in baseline BMI z-score, and the model did not significantly predict of baseline BMI z-score (F[5, 111] = 2.02, p = 0.08). While the overall model was not significant, dietary restraint was significantly related to baseline BMI z-score (β = 0.03, p = 0.015).
Table 3:
Linear regressions predicting BMI z-score and change in BMI.
| Model 1: BMI z-score = EDunappetizing + EDappetizing + DRES + hunger + PDS | |||||
|---|---|---|---|---|---|
| β | SE | t-value | p-value | Model fit | |
| EDunappetizing | 0.21 | 0.24 | 0.89 | 0.38 | R2 = 0.08 adjusted R2 = 0.04 intercept = −0.95 p = 0.08 |
| EDappetizing | 0.12 | 0.22 | 0.52 | 0.61 | |
| DRES | 0.027 | 011 | 2.48 | 0.015* | |
| hunger | −0.012 | 0.016 | −0.78 | 0.44 | |
| PDS | 0.13 | 0.15 | 0.87 | 0.39 | |
| Model 2: BMI change = EDunappetizing + EDappetizing + baseline BMI + DRES + hunger + PDS + Sex | |||||
| β | SE | t-value | p-value | Model fit | |
| EDunappetizing | −0.83 | 0.23 | −3.58 | 0.00052* | R2 = 0.16 adjusted R2 = 0.11 intercept = 1.76 p = 0.007^ |
| EDappetizing | −0.38 | 0.21 | −1.81 | 0.072 | |
| baseline BMI | 0.076 | 0.027 | 2.82 | 0.0057* | |
| DRES | −0.0081 | 0.011 | −0.76 | 0.45 | |
| hunger | −0.014 | 0.014 | −0.95 | 0.34 | |
| PDS | −0.069 | 0.17 | −0.40 | 0.69 | |
| Sex | −0.17 | 0.16 | −1.09 | 0.28 | |
Significant predictor (p-value < 0.05) DRES: Dutch Restrained Eating Subscale Score
Significant model (p-value < 0.025) PDS: Pubertal Development Scale Score
DRES: Dutch Restrained Eating Subscale Score
PDS: Pubertal Development Scale Score
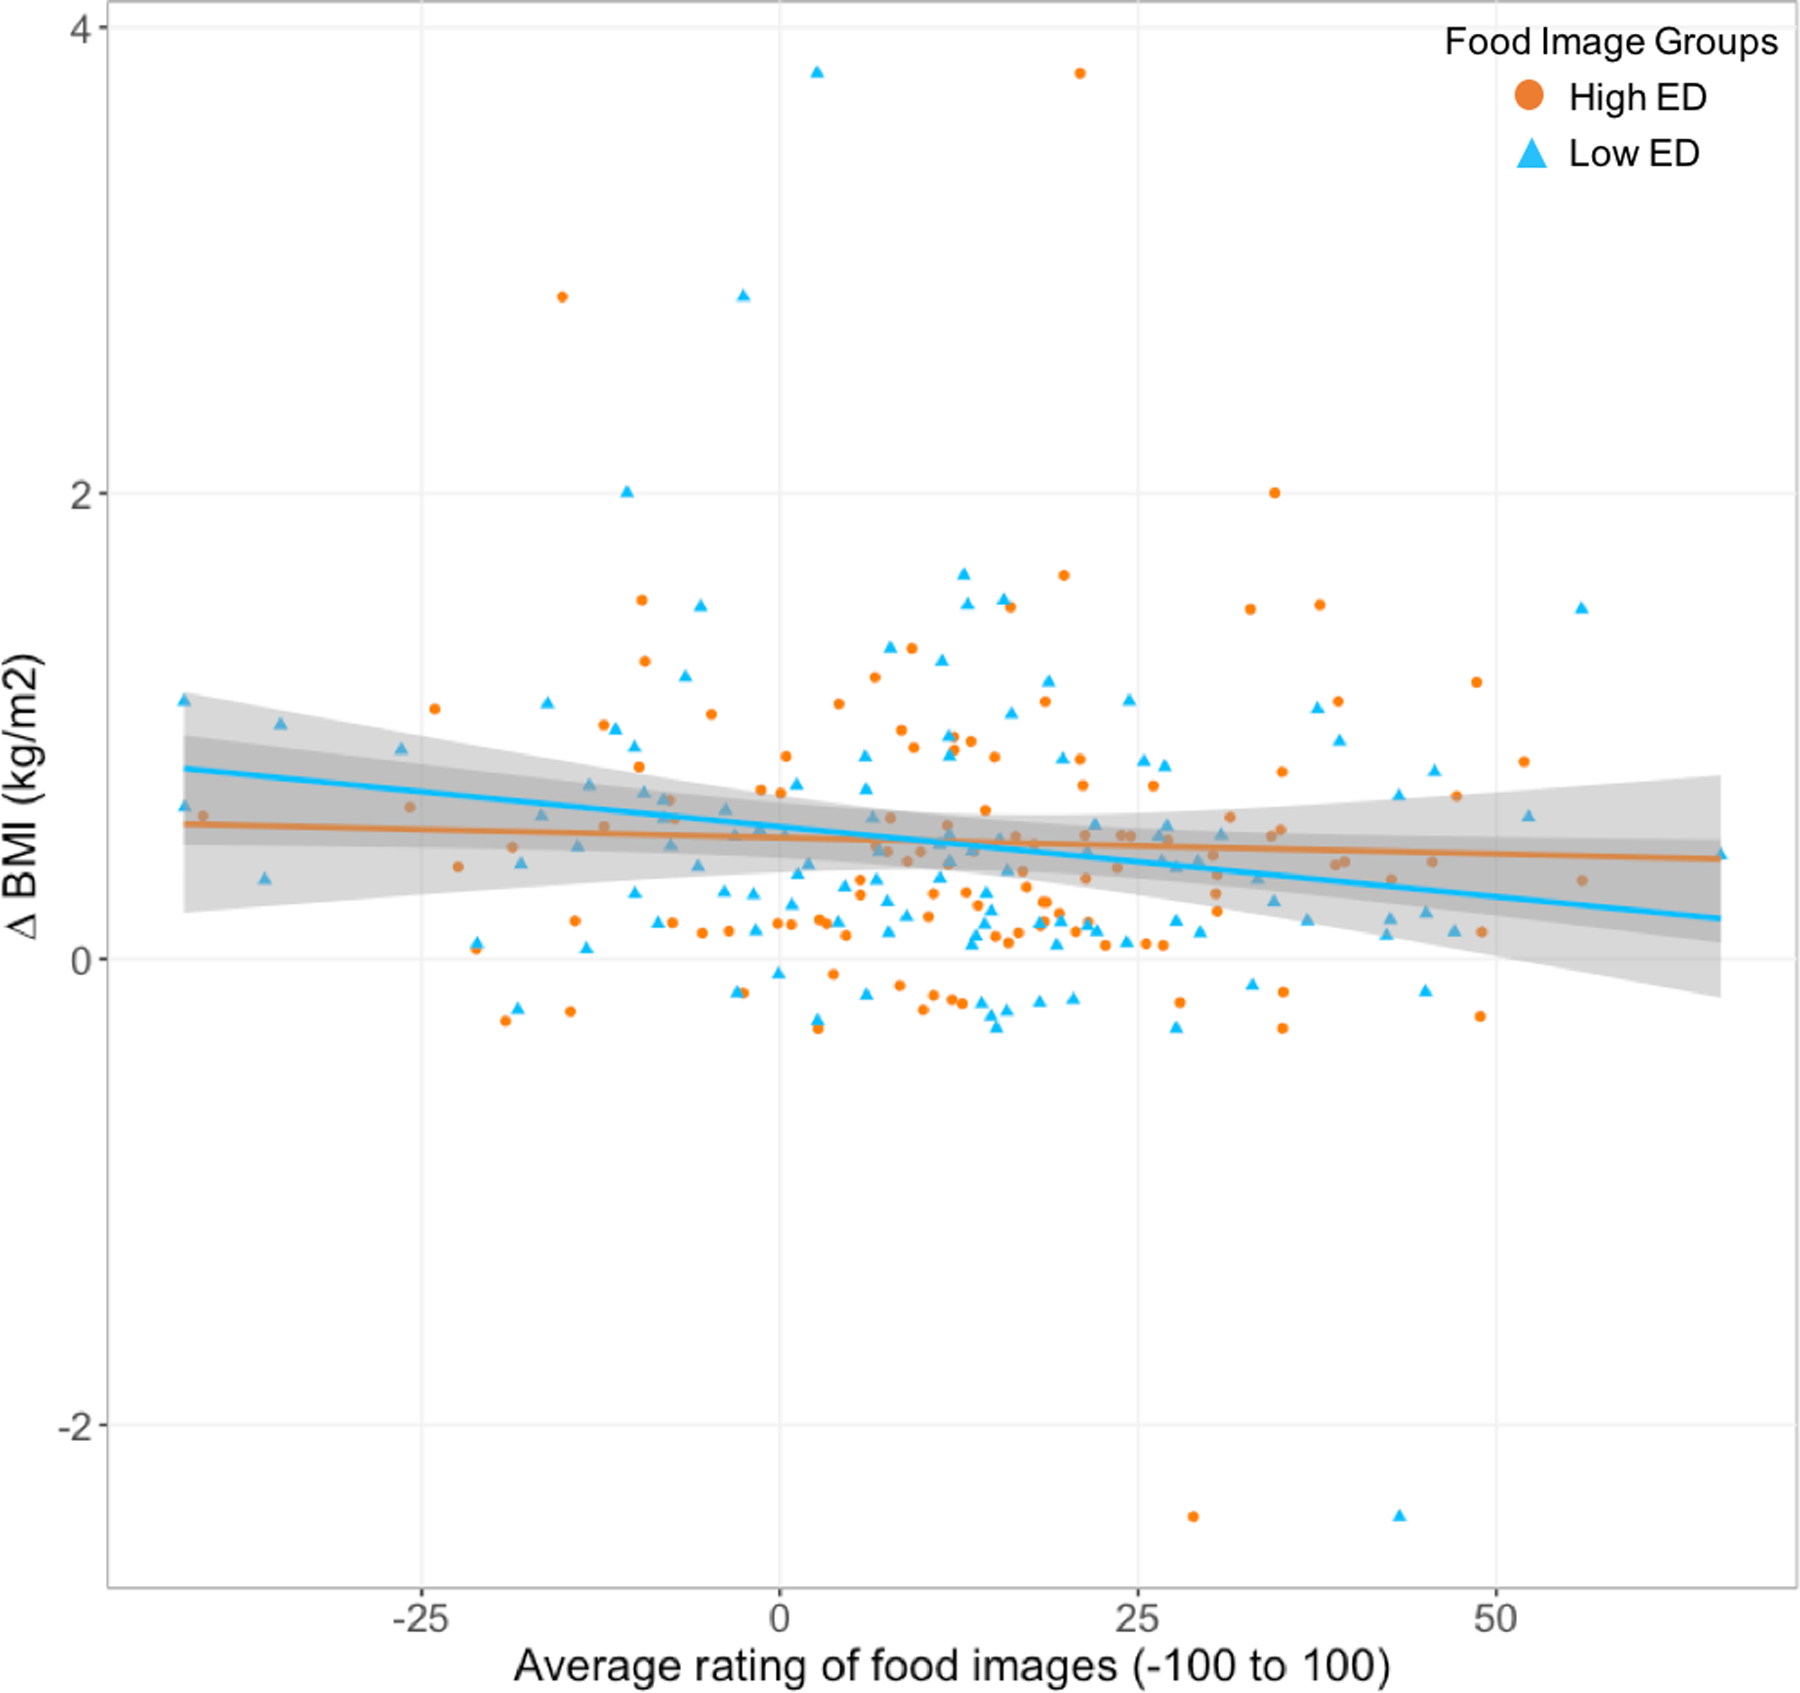
The second model tested if 3-year change in BMI is predicted by the average ED of appetizing food images and the average ED of unappetizing food images, controlling for baseline dietary restraint, baseline hunger, and baseline pubertal development, biological sex, and baseline BMI (Table 3). The model explained 10.6% of the variance in BMI change, and the model significantly predicted change in BMI (F[7,109] = 3.0, p = 0.007). BMI change was significantly predicted by the average ED of unappetizing food images (β = −0.83, p = 0.0005, Figure 1), as well as baseline BMI (β = 0.08, p = 0.006). The average ED of appetizing food images was not significantly related to BMI change, but was trending towards significance (β = −0.37, p = 0.07, Figure 1).
Figure 1.

Relation between energy density of unappetizing food images and appetizing food images and change in BMI
Post hoc analyses
Interaction with dietary restraint.
Multivariate linear regression was used to test of the relationship between ED of unappetizing food images and BMI change was moderated by baseline dietary restraint. While the overall model significantly predicted change in BMI (F[4,112] = 4.7, p = 0.002), the interaction term (unappetizing ED * dietary restraint) did not significantly predict BMI change.
Moderation by biological sex.
Multivariate linear regression was used to test if biological sex moderated the relationship between ED of unappetizing food images and BMI change was moderated. The model explained 14.5% of the variance in BMI change and was significant (F[4,112] = 5.9, p = 0.0002, Figure 2). The interaction term (unappetizing ED * sex) significantly predicted change in BMI (β = −0.84, p = 0.01). Additionally, baseline BMI (β = 1.5, p = 0.02) and sex (β = 0.07, p = 0.006) significantly predicted BMI change, while the ED of unappetizing foods did not (β = −0.09, p = 0.71).
Figure 2.
Relation between ratings of high energy density food images and low energy density food images and change in BMI
Prediction of BMI change by perceived dietary intake.
Multivariate linear regression was used to test if perceived dietary intake, including daily caloric intake, daily percent kilocalories from fat, and daily percent kilocalories from sugar predicted BMI change, controlling for baseline BMI. The model explained 6.1% of the variance in BMI change and was significant (F[4,112] = 2.9, p = 0.02). Of the perceived dietary intake predictors, only daily percent kilocalories from fat significantly predicted change in BMI (β = −0.04, p = 0.03). Additionally, baseline BMI (β = −0.06, p = 0.01) significantly predicted BMI change.
Prediction of BMI change by ratings of high ED and low ED foods.
Multivariate linear regression was applied to test if change in BMI is predicted by average hedonic rating of the high ED images and the low ED images, controlling for baseline BMI. The model was significant (F[3,113] = 3.7, p = 0.01; Figure 3) and explained 6.4% of the variance in BMI change. As with other models, baseline BMI (β = 0.06, p = 0.01) significantly predicted BMI change. Average hedonic rating of the low ED images significantly predicted BMI change (β = - 0.007, p = 0.02), while the average hedonic rating of high ED images was not related to BMI change (β = 0.002, p = 0.44).
Figure 3.
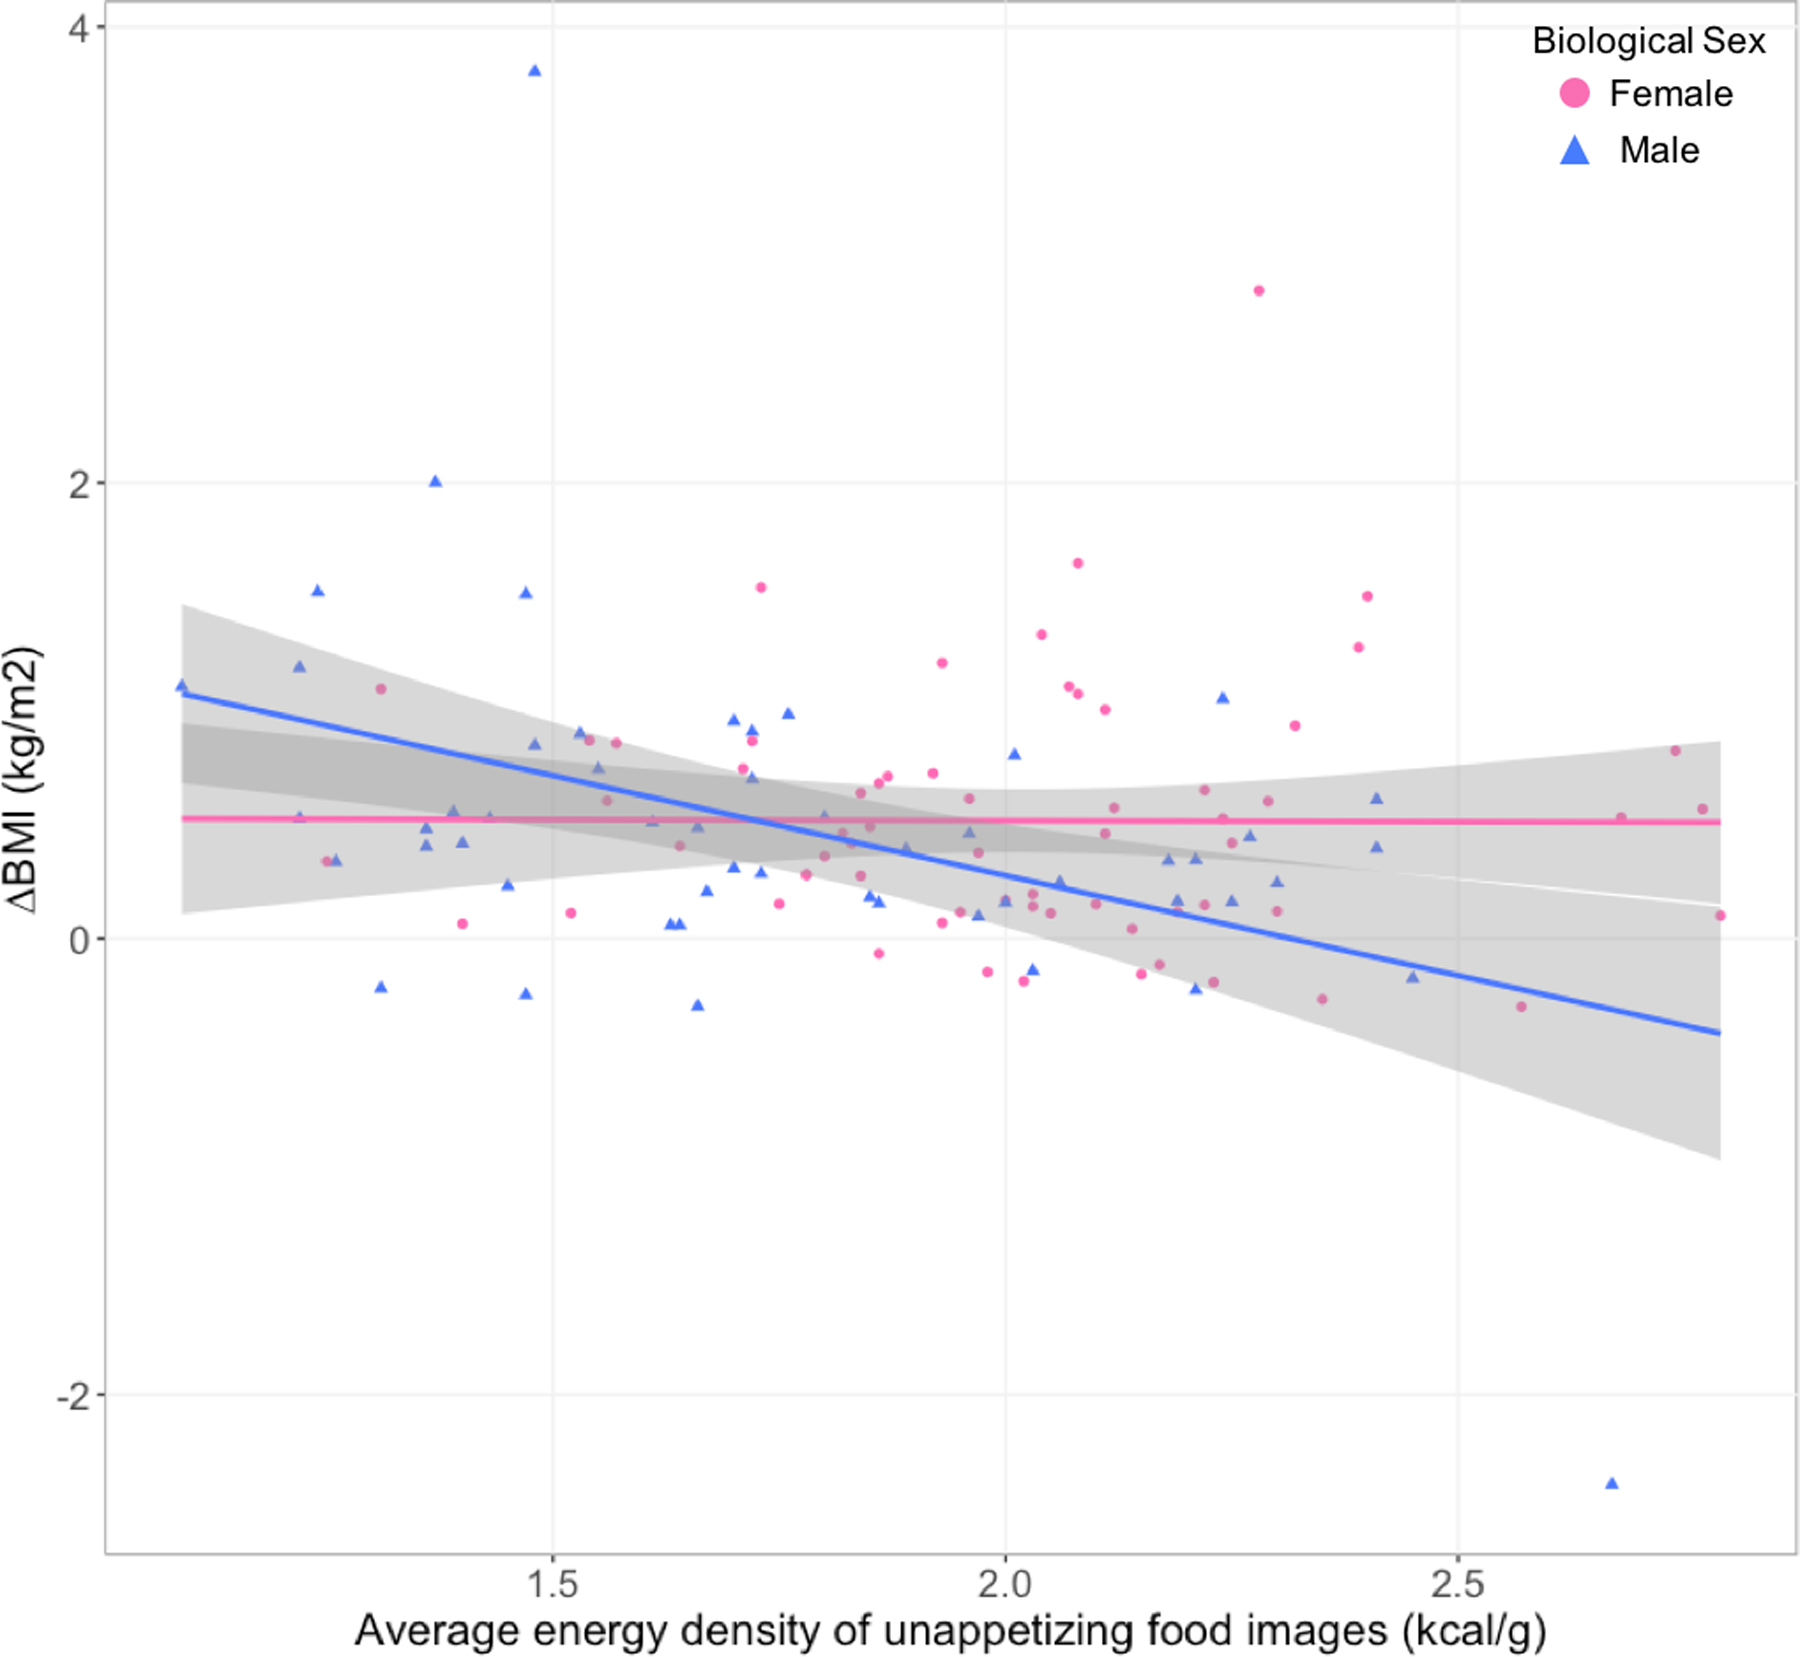
Moderation of the relation between energy density of unappetizing food images and change in BMI by biological sex.
Discussion
The present study sought to determine the relation of subjective hedonic value and the energy density of foods to BMI change. Here, we demonstrate that the energy density of foods rated as unappetizing predicted BMI change over 3-year follow-up, wherein participants who rated energy dense foods as unappetizing showed less BMI gain. Contrary to our hypothesis, the energy density of food images rated as appetizing did not significantly predict weight change. To date, the majority of research that examines hedonically motivated food intake focuses on increased preference of energy dense foods as a driver of weight gain. However, the present findings suggest that decreased appeal of high energy dense foods is protective against weight gain, providing insight to the importance of the valence of perceived hedonic value as it relates to energy density.
Increased appeal and hedonic value of energy dense foods is theoretically a risk factor for future weight gain (Lowe & Butryn, 2007). However, here, we found a small, but significant, negative relationship between the energy density of unappetizing foods and 3-year BMI change. Similar to the idea that liking energy dense foods could place individuals at risk for weight gain, dislike of energy dense foods should result in decreased consumption of those foods, which would protect against excessive weight gain. The trend line representing this relationship suggests that, if extrapolated out, dislike of highly energy dense foods may be associated with absolute weight loss. However, this interpretation is beyond the existing data, and should be considered with caution. Yet, to date, few studies have tested the relation between food dislikes and prospective weight change, however some data suggests what individuals avoid eating can have impact on weight status (Galloway, Fiorito, Lee, & Birch, 2005). Adolescent girls who are “picky” eaters, defined by parental reports, are more likely to consume fewer fruits, vegetables, and high ED foods, be at a lower BMI and have less body fat than unpicky eaters (Galloway et al., 2005). While pickiness was not assessed in the present study, picky eaters in the present study would be more likely to rate energy dense foods as unappetizing, and would be less likely to gain weight over time. Also, experimentally inducing an association between high ED foods and feelings of disgust can significantly reduce ad libitum intake and hedonic ratings of high calorie foods, with persistent effects on ratings for 3–5 days post manipulation (Legget, Cornier, Rojas, Lawful, & Tregellas, 2015), suggesting that dislike of foods can be a strong motivator in eating behavior. While, other interventions using negative reinforcement to decrease liking of palatable foods show mixed effectiveness (Lascelles, Field, & Davey, 2003; Lebens et al., 2011), the above results suggest that dislike can be intervened upon to alter eating behavior. These initial findings point towards the importance of negative hedonic valence on eating behavior and weight change.
Post hoc findings show that the relation between ED of unappetizing foods and BMI change is moderated by biological sex, such that in males, there is a strong negative relation between ED of unappetizing foods and BMI change, while in females, the relation between ED of unappetizing foods and BMI change is weakly negative. Gender differences in food preference is well established in adolescents, such that females tend to prefer low ED foods, while males prefer high ED foods (Caine‐Bish & Scheule, 2009; Cooke & Wardle, 2005; Nu, MacLeod, & Barthelemy, 1996). In the present data, similar effects are found; the ED of appetizing foods was significantly lower in female participants than male participants, and the ED of unappetizing foods was significantly higher in females. Sex-based difference in food appeal may explain the moderation of the relation between ED of unappetizing foods and BMI change, as male participants had greater variability in ED of unappetizing foods, thereby contributing to a stronger negative relationship with BMI change.
Additionally, post hoc analyses identified a small, but significant predictive effect of baseline perceived dietary intake on BMI change, such daily percent kilocalories from fat was negatively related to BMI change. This effect is in conflict with the predictive effect of unappetizing food ED on BMI change, as dislike of high ED foods should theoretically contribute to lower intake of high fat foods, and less weight gain. Instead, the negative relation between daily percent kilocalories from fat and to BMI change suggests greater proportion of fat in the diet at baseline predicts less weight gain over time. Other measures of perceived dietary intake, including overall daily caloric intake and daily percent kilocalories from sugar, were not related to change in BMI. Of note, biases in perceived dietary intake reporting reduce the validity of such measures (Macdiarmid & Blundell, 1998), which could have affected the present results.
Foods in the appetizing and unappetizing image groups are unique for each participant, based on their own hedonic ratings. This approach allows for more specificity, as appeal varies across individuals, but this approach decreases the generalizability of results. As such, we completed a post hoc analysis using the same images for all participants to examine the relation between hedonic ratings and ED of food images with BMI change. Using the same set of high ED and low ED food images, we tested if participant’s hedonic ratings of the two image groups predicted BMI change, controlling for baseline BMI. Hedonic ratings of high ED foods did not significantly predict BMI change. Dovetailing with the analysis using individualized image sets, ratings of low ED food images significantly predicted BMI change, such that higher ratings of low ED food images was related to less weight gain over 3 years. Together with the individualized ratings, these results support that increase appeal of low energy density foods, and decreased appeal of high ED foods both are protective against weight gain.
Foods rated as appetizing only showed marginally higher energy density than foods rated as unappetizing, suggesting that energy-dense foods are only considered slightly more appetizing by the adolescent participants compared to low ED foods. Typically, there is a positive relation between hedonics and energy density, however, results across studies are somewhat mixed (Cox, Hendrie, & Carty, 2016). When consumed, energy dense foods are typically considered more palatable (Adam Drewnowski, 1998), so the use of food images in our study may contribute to variation in hedonic ratings across energy density levels.
Further, our study did not find a significant relation between energy density of appetizing and unappetizing foods and baseline BMI. At baseline, participants were selected to be at a healthy weight, reducing the range of baseline BMI values (16–26). Additionally, this null effect is supported by prior studies, which also report no relation between current weight status and appeal of high ED foods (Cox, Perry, Moore, Vallis, & Mela, 1999; Mela, 2001; Potter et al., 2017). Together, results suggest that individuals vary in appeal of energy dense foods, which is independent of current weight status.
Conclusions
We observed significant interaction between energy density and hedonic value driven by an inverse relation between unappetizing food energy density and BMI change; specifically, participants who rated higher energy dense foods as unappetizing showed less weight gain. This relationship was moderated by sex, such that male participants showed a stronger negative relationship between energy density of unappetizing food images and BMI change. Post-hoc analyses revealed that individuals with a higher hedonic ratings of low ED foods reported also showed less weight gain. Results support the idea that individual differences in the appeal of foods varied on energy density impacts weight regulation.
Table 2:
Pearson’s correlations (r) between continuous variables.
| Unappetizing ED |
Appetizing ED |
PDS Score | DRES Score |
Hunger | |
|---|---|---|---|---|---|
| BMI z-score | 0.10 | −0.10 | 0.15 | 0.25 | −0.04 |
| BMI change | −0.23 | 0.04 | 0.03 | 0.07 | −0.10 |
| Unappetizing ED | - | −0.70* | 0.19 | 0.07 | 0.05 |
| Appetizing ED | - | −0.19 | −0.28 | −0.02 | |
| PDS Score | - | 0.27 | 0.11 | ||
| DRES Score | - | 0.07 | |||
| Hunger | - |
Significant correlation (p < 0.05; adjusted for multiple comparisons)
Acknowledgments
Support for this work was provided by National Institutes of Health grants DK080760 & DK112317.
References
- Alberga AS, Sigal RJ, Goldfield G, Prud’ homme D, & Kenny GP (2012). Overweight and obese teenagers: why is adolescence a critical period? Pediatric Obesity, 7(4), 261–273. 10.1111/j.2047-6310.2011.00046.x [DOI] [PubMed] [Google Scholar]
- Banasiak SJ, Wertheim EH, Koerner J, & Voudouris NJ (2001). Test‐retest reliability and internal consistency of a variety of measures of dietary restraint and body concerns in a sample of adolescent girls. International Journal of Eating Disorders, 29(1), 85–89. [DOI] [PubMed] [Google Scholar]
- Bassett R, Chapman GE, & Beagan BL (2008). Autonomy and control: the co-construction of adolescent food choice. Appetite, 50(2–3), 325–32. 10.1016/j.appet.2007.08.009 [DOI] [PubMed] [Google Scholar]
- Berkey CS, & Colditz GA (2007). Adiposity in Adolescents: Change in Actual BMI Works Better Than Change in BMI z Score for Longitudinal Studies. Ann Epidemiol, 17(1), 44–50. [DOI] [PubMed] [Google Scholar]
- Berkey CS, Rockett HRH, Field AE, Gillman MW, Frazier AL, Camargo CA, & Colditz GA (2000). Activity, dietary intake, and weight changes in a longitudinal study of preadolescent and adolescent boys and girls. Pediatrics, 105(4), e56–e56. [DOI] [PubMed] [Google Scholar]
- Berridge KC, Ho C-Y, Richard JM, & DiFeliceantonio AG (2010). The tempted brain eats: pleasure and desire circuits in obesity and eating disorders. Brain Research, 1350, 43–64. [DOI] [PMC free article] [PubMed] [Google Scholar]
- Birch LL (1999). Development of food preferences. Annual Review of Nutrition, 19(1), 41–62. [DOI] [PubMed] [Google Scholar]
- Block G, Hartman AM, & Naughton D (1990). A reduced dietary questionnaire: development and validation. Epidemiology, 58–64. [DOI] [PubMed] [Google Scholar]
- Block G, & Subar AF (1992). Estimates of nutrient intake from a food frequency questionnaire: the 1987 National Health Interview Survey. Journal of the American Dietetic Association, 92(8), 969. [PubMed] [Google Scholar]
- Burger KS (2017). Frontostriatal and behavioral adaptations to daily sugar-sweetened beverage intake: a randomized controlled trial. The American Journal of Clinical Nutrition, 105(3), 555–563. [DOI] [PMC free article] [PubMed] [Google Scholar]
- Burger KS, & Stice E (2011). Variability in reward responsivity and obesity: evidence from brain imaging studies. Current Drug Abuse Reviews, 4(3), 182. [DOI] [PMC free article] [PubMed] [Google Scholar]
- Burger KS, & Stice E (2012). Frequent ice cream consumption is associated with reduced striatal response to receipt of an ice cream-based milkshake. American Journal of Clinical Nutrition, 95(4), 810–817. 10.3945/ajcn.111.027003 [DOI] [PMC free article] [PubMed] [Google Scholar]
- Burger KS, & Stice E (2014). Greater striatopallidal adaptive coding during cue-reward learning and food reward habituation predict future weight gain. Neuroimage, 99, 122–128. 10.1016/j.neuroimage.2014.05.066 [DOI] [PMC free article] [PubMed] [Google Scholar]
- Burger, & Stice. (2013). Elevated energy intake is correlated with hyperresponsivity in attentional, gustatory, and reward brain regions while anticipating palatable food receipt. The American Journal of Clinical Nutrition, 97(6), 1188–1194. [DOI] [PMC free article] [PubMed] [Google Scholar]
- Caine‐Bish NL, & Scheule B (2009). Gender differences in food preferences of school‐aged children and adolescents. Journal of School Health, 79(11), 532–540. [DOI] [PubMed] [Google Scholar]
- Cole TJ, Bellizzi MC, Flegal KM, & Dietz WH (2000). Establishing a standard definition for child overweight and obesity worldwide: international survey. Bmj, 320(7244), 1240. [DOI] [PMC free article] [PubMed] [Google Scholar]
- Cooke LJ, & Wardle J (2005). Age and gender differences in children’s food preferences. British Journal of Nutrition, 93(5), 741–746. [DOI] [PubMed] [Google Scholar]
- Cox DN, Hendrie GA, & Carty D (2016). Sensitivity, hedonics and preferences for basic tastes and fat amongst adults and children of differing weight status: A comprehensive review. Food Quality and Preference, 48, 359–367. [Google Scholar]
- Cox, Perry, Moore, Vallis, & Mela. (1999). Sensory and hedonic associations with macronutrient and energy intakes of lean and obese consumers. International Journal of Obesity, 23(4), 403. [DOI] [PubMed] [Google Scholar]
- Diepenbroek C, Eggels L, Ackermans MT, Fliers E, Kalsbeek A, Serlie MJ, & la Fleur SE (2017). Differential effects of hypercaloric choice diets on insulin sensitivity in rats. The Journal of Endocrinology, 232(1), 49–57. 10.1530/JOE-16-0265 [DOI] [PubMed] [Google Scholar]
- Dietz WH, & Robinson TN (1998). Use of the body mass index (BMI) as a measure of overweight in children and adolescents. The Journal of Pediatrics, 132(2), 191–193. [DOI] [PubMed] [Google Scholar]
- Drewnowski A (1997). Taste preferences and food intake. Annual Review of Nutrition, 17, 237–253. 10.1146/annurev.nutr.17.1.237 [DOI] [PubMed] [Google Scholar]
- Drewnowski A (1998). Energy density, palatability, and satiety: implications for weight control. Nutrition Reviews, 56(12), 347–353. [DOI] [PubMed] [Google Scholar]
- Drewnowski A, & Hann C (1999). Food preferences and reported frequencies of food consumption as predictors of current diet in young women. The American Journal of Clinical Nutrition, 70(1), 28–36. [DOI] [PubMed] [Google Scholar]
- Finlayson G, King N, & Blundell JE (2007). Liking vs. wanting food: Importance for human appetite control and weight regulation. Neuroscience and Biobehavioral Reviews, 31(7), 987–1002. 10.1016/j.neubiorev.2007.03.004 [DOI] [PubMed] [Google Scholar]
- Frank GC, Nicklas TA, Webber LS, Major C, Miller JF, & Berenson GS (1992). A food frequency questionnaire for adolescents: defining eating patterns. Journal of the American Dietetic Association, 92(3), 313–318. [PubMed] [Google Scholar]
- Galloway AT, Fiorito L, Lee Y, & Birch LL (2005). Parental pressure, dietary patterns, and weight status among girls who are “picky eaters.” Journal of the American Dietetic Association, 105(4), 541–548. [DOI] [PMC free article] [PubMed] [Google Scholar]
- Gearhardt AN, Yokum S, Orr PT, Stice E, Corbin WR, & Brownell KD (2011). Neural Correlates of Food Addiction. Archives of General Psychiatry, 68(8), 808–816. 10.1001/archgenpsychiatry.2011.32 [DOI] [PMC free article] [PubMed] [Google Scholar]
- Goldberg GR, Black AE, Jebb SA, Cole TJ, Murgatroyd PR, Coward WA, & Prentice AM (1991). Critical evaluation of energy intake data using fundamental principles of energy physiology: 1. Derivation of cut-off limits to identify under-recording. European Journal of Clinical Nutrition, 45(12), 569–581. [PubMed] [Google Scholar]
- Hetherington MM, Bell A, & Rolls BJ (2000). Effects of repeat consumption on pleasantness, preference and intake. British Food Journal, 102(7), 507–521. [Google Scholar]
- Hetherington MM, & Rolls BJ (1996). Sensory-specific satiety: Theoretical frameworks and central characteristics [Google Scholar]
- Johnson SL, McPhee L, & Birch LL (1991). Conditioned preferences - Young-children prefer flavors associated with high dietary-fat. Physiology {&} Behavior, 50(6), 1245–1251. 10.1016/0031-9384(91)90590-k [DOI] [PubMed] [Google Scholar]
- Klohe DM, Clarke KK, George GC, Milani TJ, Hanss-Nuss H, & Freeland-Graves J (2005). Relative validity and reliability of a food frequency questionnaire for a triethnic population of 1-year-old to 3-year-old children from low-income families. Journal of the American Dietetic Association, 105(5), 727–734. [DOI] [PubMed] [Google Scholar]
- Lanfer A, Knof K, Barba G, Veidebaum T, Papoutsou S, De Henauw S, … Lissner L (2012). Taste preferences in association with dietary habits and weight status in European children: results from the IDEFICS study. International Journal of Obesity, 36(1), 27. [DOI] [PubMed] [Google Scholar]
- Lascelles KRR, Field AP, & Davey GCL (2003). Using foods as CSs and body shapes as UCSs: A putative role for associative learning in the development of eating disorders. Behavior Therapy, 34(2), 213–235. [Google Scholar]
- Lebens H, Roefs A, Martijn C, Houben K, Nederkoorn C, & Jansen A (2011). Making implicit measures of associations with snack foods more negative through evaluative conditioning. Eating Behaviors, 12(4), 249–253. [DOI] [PubMed] [Google Scholar]
- Legget KT, Cornier M-A, Rojas DC, Lawful B, & Tregellas JR (2015). Harnessing the power of disgust: a randomized trial to reduce high-calorie food appeal through implicit priming. The American Journal of Clinical Nutrition, 102(2), 249–255. [DOI] [PMC free article] [PubMed] [Google Scholar]
- Lowe MR, & Butryn ML (2007). Hedonic hunger: a new dimension of appetite? Physiology {&} Behavior, 91(4), 432–439. 10.1016/j.physbeh.2007.04.006 [DOI] [PubMed] [Google Scholar]
- Macdiarmid J, & Blundell J (1998). Assessing dietary intake: who, what and why of under-reporting. Nutrition Research Reviews, 11(2), 231–253. [DOI] [PubMed] [Google Scholar]
- Mela DJ (2001). Determinants of food choice: relationships with obesity and weight control. Obesity, 9(S11). [DOI] [PubMed] [Google Scholar]
- Mela DJ (2006). Eating for pleasure or just wanting to eat? Reconsidering sensory hedonic responses as a driver of obesity. Appetite, 47(1), 10–17. Retrieved from http://www.sciencedirect.com/science/article/pii/S0195666306002066 [DOI] [PubMed] [Google Scholar]
- Nederkoorn C, Guerrieri R, Havermans RC, Roefs A, & Jansen A (2009). The interactive effect of hunger and impulsivity on food intake and purchase in a virtual supermarket. International Journal of Obesity, 33(8), 905–912. 10.1038/ijo.2009.98 [DOI] [PubMed] [Google Scholar]
- Nederkoorn C, Houben K, Hofmann W, Roefs A, & Jansen A (2010). Control yourself or just eat what you like? Weight gain over a year is predicted by an interactive effect of response inhibition and implicit preference for snack foods. Health Psychology, 29(4), 389–393. [DOI] [PubMed] [Google Scholar]
- Nu CT, MacLeod P, & Barthelemy J (1996). Effects of age and gender on adolescents’ food habits and preferences. Food Quality and Preference, 7(3–4), 251–262. [Google Scholar]
- Petersen AC, Crockett L, Richards M, & Boxer A (1988). A self-report measure of pubertal status: Reliability, validity, and initial norms. Journal of Youth and Adolescence, 17(2), 117–133. [DOI] [PubMed] [Google Scholar]
- Potter C, Griggs RL, Ferriday D, Rogers PJ, & Brunstrom JM (2017). Individual variability in preference for energy-dense foods fails to predict child BMI percentile. Physiology & Behavior, 176, 3–8. [DOI] [PMC free article] [PubMed] [Google Scholar]
- Singh AS, Mulder C, Twisk JWR, van Mechelen W, & Chinapaw MJM (2008). Tracking of childhood overweight into adulthood: a systematic review of the literature. Obesity Reviews : An Official Journal of the International Association for the Study of Obesity, 9(5), 474–88. 10.1111/j.1467-789X.2008.00475.x [DOI] [PubMed] [Google Scholar]
- Stevenson C, Doherty G, Barnett J, Muldoon OT, & Trew K (2007). Adolescents’ views of food and eating: Identifying barriers to healthy eating. Journal of Adolescence, 30(3), 417–434. 10.1016/j.adolescence.2006.04.005 [DOI] [PubMed] [Google Scholar]
- Stice E, Burger KS, & Yokum S (2013). Relative ability of fat and sugar tastes to activate reward, gustatory, and somatosensory regions. The American Journal of Clinical Nutrition, 98(6), 1377–1384. 10.3945/ajcn.113.069443 [DOI] [PMC free article] [PubMed] [Google Scholar]
- Yeomans MR (2006). The role of learning in development of food preferences. Frontiers in Nutritional Science, 3, 93. [Google Scholar]