

Abstract
Growth in the global development of cities, and increasing public interest in beekeeping, has led to increase in the numbers of urban apiaries. Towns and cities can provide an excellent diet for managed bees, with a diverse range of nectar and pollen available throughout a long flowering season, and are often more ecologically diverse than the surrounding rural environments. Accessible urban honeybee hives are a valuable research resource to gain insights into the diet and ecology of wild pollinators in urban settings. We used DNA metabarcoding of the rbcL and ITS2 gene regions to characterize the pollen community in Apis mellifera honey, inferring the floral diet, from 14 hives across an urban gradient around Greater Manchester, UK. We found that the proportion of urban land around a hive is significantly associated with an increase in the diversity of plants foraged and that invasive and non‐native plants appear to play a critical role in the sustenance of urban bees, alongside native plant species. The proportion of improved grassland, typical of suburban lawns and livestock farms, is significantly associated with decreases in the diversity of plant pollen found in honey samples. These findings are relevant to urban landscape developers motivated to encourage biodiversity and bee persistence, in line with global bio‐food security agendas.
Keywords: diet, honey bees, landscape, metabarcoding, pollen, urban ecosystems
Using 2‐barcode metabarcoding, we identified the floral diet of honeybees across an urban gradient in Greater Manchester. Bees foraging in more urbanized environments had access to a greater diversity of plants than those foraging in more rural environments. Non native and naturalized species comprised an important part of the diet of urban foraging bees along side native species.

1. INTRODUCTION
The highly publicized decline in wild bees, among other pollinators, has been brought into sharp focus for scientists, policy makers, and increasingly for the general public in recent decades (Sánchez‐Bayo & Wyckhuys, 2019; Wagner, 2020). Wild bees and managed honey bees are important components of the pollinator community, providing vital ecosystem services that help sustain our food supply, other crops, and native ecosystems (Hung et al., 2018). As such, a decline in the amount of pollination services provided by wild or managed bees could have serious global consequences (Breeze et al., 2014; Gallai et al., 2009; Klein et al., 2007). Habitat loss and widespread pesticide use are among the most powerful drivers of pollinator decline globally (Gill et al., 2012; Goulson et al., 2015; Jachuła et al., 2022). In the case of honey bees, rates of infection and colony collapse have been attributed to several interacting factors, of which loss of plant forage diversity and abundance has been identified to be an important cause (Branchiccela et al., 2019; Requier et al., 2018; Smith et al., 2013; Vanbergen & The Insect Pollinators Initiative, 2013).
The main sources of nutrition for honey bees are the floral rewards including nectar, which is the primary source of carbohydrate, and pollen, which is the main source of protein, both of which are collected by worker bees (Brodschneider & Crailsheim, 2010). Nutritional requirements of individuals vary by role in the colony, as foragers and nurse bees require different nutrition, and overall foraging intensity is modulated at the colony level (Altaye et al., 2010; Seeley, 1986). Efficient colony maintenance and brood rearing require not only a sufficient quantity of pollen and associated nutrients, but there are also notable benefits associated with a diverse pollen diet. Colonies reliant upon a single monofloral crop, such as those often found in agricultural habitats, experience a brief glut of pollen. However, they may struggle for sufficient nutrition at other times and are particularly susceptible to a failed crop or inclement weather (Dolezal et al., 2019; Topitzhofer et al., 2019; Vanbergen & The Insect Pollinators Initiative, 2013). A diverse diet of plants with flowering times spread throughout the season offers security against these risks, allowing increased temporal stability of nutrient availability (Avni et al., 2014). It also has a direct nutritional benefit compared to a mono‐floral diet, with a diverse diet better able to meet differential nutritional requirements of the different roles within the colony (Paoli et al., 2014). In addition, a poly‐floral diet can increase the immunocompetence of bees and is indirectly associated with an increased number of female offspring and reduced disease and pesticide susceptibility of the colony (Alaux et al., 2010; Centrella et al., 2020). While diet diversity is important for health, it is not the only factor, and total pollen and nectar are also critical. A sufficient biomass of collected pollen is clearly fundamentally important for growth and development, particularly in the spring when stored pollen stocks are low and foraging levels can be inconsistent (DeGrandi‐Hoffman et al., 2016).
Urban intensification and expansion may provide a relatively novel opportunity for wild bees and other pollinators (Ayers & Rehan, 2021; Hall et al., 2017; Turo & Gardiner, 2019; Wenzel et al., 2020). Further increases in the development of urban environments are projected to continue (Chen et al., 2020; Gao & O'Neill, 2020; Seto et al., 2012), and understanding pollinator ecology and behavior in response to changing habitat is necessary. There has been a recent increase in the number of urban beekeepers, with many utilizing gardens and rooftops for their hives (Lorenz & Stark, 2015). Reduced colony mortality, fewer parasitic invasions, and increased colony longevity and reproductive output are all characteristics reported for bee colonies in more urban, compared to rural, environments (Baldock et al., 2019). These benefits are largely attributed to the availability of floral resources and the lower concentration of pesticides (Botías et al., 2017; Samuelson et al., 2018). Agricultural landscapes are often capable of providing comparable or larger quantities of pollen than urban areas, leading to high food accumulation in a hive (Sponsler & Johnson, 2015). However, the diversity of diet is likely to be lower than that collected when foragers are able to access urban landscapes. Urban areas are known to support diverse populations of wild native bees (Baldock et al., 2015; Casanelles‐Abella et al., 2022) alongside honey bees, which like many other bee species, are generalist foragers able to take advantage of the floral diversity available in urban areas. Studying accessible, managed honey bee colonies as models for their wild counterparts is therefore a powerful tool to better understand urban pollinator ecology (Giannini et al., 2015; Lowenstein et al., 2019).
Urban environments, in general, can be considered to be rich in plant diversity, including a mixture of native, those widespread and not introduced by human activity, neophyte, those not native but in the wild and naturalized, and non‐native species, which may include garden plants, recent non‐naturalized escapees, and contemporarily invasive species (Aronson et al., 2017; Baldock et al., 2015; Gaertner et al., 2017; Grimm et al., 2008). This richness is due to the spatial heterogeneity of the areas, which provide niches for opportunistic seedlings, and also the presence of a broad range of cultivated plants in private gardens, parks, allotments, urban food production, and across green infrastructure (Frankie et al., 2005; Garbuzov & Ratnieks, 2014; Knapp et al., 2012; Matteson & Langellotto, 2009).
The degree of urbanization and habitat fragmentation can greatly alter the availability and diversity of floral resources for pollinators (Levé et al., 2019; McKinney, 2002). Even generalist species, such as honey bees, exhibit selectivity in the plant species visited depending upon the needs of the colony at specific times and the availability of resources (Hawkins et al., 2015; Lowenstein et al., 2019; Nottebrock et al., 2017; Requier et al., 2015; Ruedenauer et al., 2020; Salisbury et al., 2015; Vaudo et al., 2015). Foraging distances vary depending on the level of landscape complexity surrounding hives and have been reported to often be shorter in complex and urban or suburban landscapes when foraging for pollen, but the pattern does not continue when foraging for nectar (Garbuzov et al., 2015; Steffan‐Dewenter & Kuhn, 2003). Longer foraging flights of over 9.5 km are known to occur, with foraging strategy theorized to be linked to patch size and quality (Beekman & Ratnieks, 2000).
Plant taxa contributing to the forage of a hive are generally characterized by identification of pollen sourced from hive pollen traps, isolated from honey, or through physically tracking foraging bees (Carvell et al., 2007; Dimou et al., 2006; Valentini et al., 2010). Metabarcoding of DNA; species identification through the analysis of complex, mixed community DNA (Deiner et al., 2017; Hebert et al., 2003; Statnikov et al., 2013), has benefits over methods based on morphology and was popularized for bee forage analysis as DNA barcoding became more prevalent in plants (Dunning & Savolainen, 2010; Kress et al., 2005; Newmaster et al., 2006). While plant species identified from pollen loads give a direct measure of the plants visited by bees when collecting pollen, information from honey‐extracted plant DNA can be used to describe plants visited for both pollen and nectar collection over a longer period (de Vere et al., 2017; Hawkins et al., 2015; Louveaux et al., 1978). Some foraging is known to target pollen only and may therefore be missed when honey‐based sampling is used (Synge, 1947). A number of gene regions (e.g. rbcL, trnL and ITS2) have been identified for use as metabarcodes in plants and a multi‐gene region metabarcoding approach has been recommended to increase the discriminatory power and broaden the range of species detection, as specific gene regions show biases in detection range and level of plant taxon identification (Bell et al., 2016; Burgess et al., 2011; Hollingsworth et al., 2011; Kress et al., 2009).
In this study, we used DNA metabarcoding of honey samples to determine the diet diversity of honey bees in and around Greater Manchester, UK, and asked how the surrounding landscape composition might influence the diversity and composition of the community of plants visited.
Our aims were to use the data from DNA metabarcoding along with GIS analysis of land cover to address three questions:
Does land cover diversity surrounding an apiary predict honey bee diet diversity?
Does the proportion of a specific type of land cover surrounding an apiary predict honey bee diet diversity?
Does the proportion of urban land cover surrounding an apiary predict the proportions of native, non‐native, and neophyte plants in the honey bee diet?
2. MATERIALS AND METHODS
2.1. Sample collection
Honey samples were sourced from 14 Apis mellifera (European honey bee) hives; 12 from Greater Manchester, one from Warrington in Cheshire, and one from Rossendale in Lancashire, across an urban gradient (Figure 1). Extraction of honey varied by the apiary, but the majority of samples were processed with a standard honey extraction method whereby cells are uncapped, the honey is removed from cells by centrifugation in a tangential extractor, and finally filtered to remove large particulates in the honey. Generally, samples were taken from pools of extracted honey collected from multiple frames, but in some instances, comb, chunk, or unfiltered honey were sampled (Table 1). Comb‐honey is honey that has not been removed from the cells, chunk‐honey is a blend of extracted honey and comb‐honey, and unfiltered honey follows the traditional extraction methodology with the omission of the final filtering stage. A single sample was procured from each apiary in 2014/15, although the extraction date is unknown. Honey was sourced from small, independent apiaries that often produce a single harvest per year, with harvest typically occurring in late summer.
FIGURE 1.
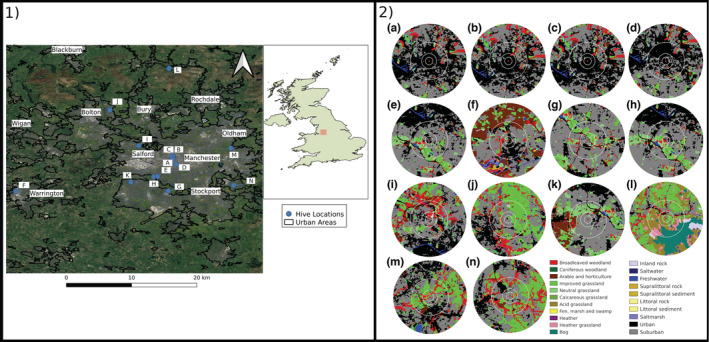
Panel (1) Locations of 14 Apis mellifera apiaries (A‐N) from which honey was sampled in the northwest of England. Major towns and cities of the region are labeled. Panel (2) The land cover types surrounding each of the 14 apiaries. Apiaries are located at the central red dot with buffer sizes of 500, 1000, 2500 and 5000 m (outer ring) radius depicted.
TABLE 1.
Names, abbreviated identifiers, sample type, latitude, longitude, and proportion of urban land cover in the 500‐m, 1000‐m, 2500m‐ and 5000‐m buffers surrounding the postcode of the apiary calculated by GIS analysis of the 14 hives used in the study.
| Hive name | Hive code | Sample type | Latitude | Longitude | % Urban land cover (500 m) | % Urban land cover (1000 m) | % Urban land cover (2500 m) | % Urban land cover (5000 m) |
|---|---|---|---|---|---|---|---|---|
| Art Gallery | A | Trad. | 53.478848 | −2.241449 | 100.0 | 99.0 | 69.0 | 49.0 |
| Printworks | B | Trad. | 53.485179 | −2.240747 | 99.2 | 96.3 | 65.0 | 47.2 |
| Manchester Cathedral | C | Trad. | 53.485109 | −2.244227 | 98.5 | 93.1 | 65.0 | 47.3 |
| Manchester Museum | D | Trad. | 53.466753 | −2.233674 | 84.7 | 75.3 | 67.0 | 48.0 |
| Chorlton | E | Chunk | 53.439583 | −2.276330 | 55.0 | 28.0 | 21.3 | 32.0 |
| Warrington | F | Trad. | 53.404419 | −2.601781 | 48.1 | 38.5 | 30.2 | 13.6 |
| Northenden | G | Trad. | 53.405705 | −2.251699 | 18.8 | 2155 | 12.3 | 14.5 |
| Chorlton Meadow | H | Trad. | 53.438089 | −2.285144 | 16.3 | 21.6 | 21.1 | 30.2 |
| Pendlebury | I | Trad. | 53.509781 | −2.319582 | 14.6 | 18.0 | 21.0 | 27.2 |
| Bury | J | Trad. | 53.591346 | −2.385633 | 5.9 | 2.2 | 8.9 | 15.0 |
| Sale | K | Comb | 53.426212 | −2.337615 | 1.8 | 8.7 | 9.1 | 19.0 |
| Cowpe | L | Trad. | 53.686795 | −2.250133 | 0.8 | 6.7 | 3.4 | 2.5 |
| Oldham | M | Unfiltered | 53.503820 | −2.108313 | 0.6 | 6.3 | 20.0 | 27.3 |
| Stockport | N | Trad. | 53.418710 | −2.102141 | 0.2 | 9.4 | 10.6 | 16.0 |
Note: Sample type refers to the process by which the honey was collected from the hive with traditional methods referring to the standard multi‐frame method used by beekeepers.
2.2. Landscape analysis
The hive locations were identified by postcode of apiaries, at the request of the beekeepers. Latitude and longitude were derived based upon the full UK postcode and therefore have a limited precision (an average UK postcode covers an area of approximately 0.135 km2). Locations of apiaries were mapped using QGIS v.2.14.0 (QGIS Geographic Information System, 2020) based on the geographic coordinates (Table 1). To adequately describe land cover across a range of spatial scales most typically used by foraging bees (Garbuzov et al., 2015; Sponsler & Johnson, 2015), the landscape surrounding each apiary was characterized using buffers with radii of 500, 1000, 2500, and 5000 m. The majority of foraging flights for both pollen and nectar occur within a radius of ≤5000 m, although less foraging behavior has been known to occur further afield when necessary (Beekman & Ratnieks, 2000; Couvillon et al., 2015). The GB 25m raster land cover data set for the study area was obtained that identifies 21 landscape classes (Rowland et al., 2017). The proportion of each of the 21 land cover class at the different spatial scales was determined using LECOS (Jung, 2013), a QGIS plugin for calculating patch‐based landscape metrics (Tables 1 and 2 and Figure 1). To test for associations between proportions of land cover types in the buffer zones, a Spearman's correlation coefficient was calculated for each pair using the R “psych” package (Revelle, 2017).
TABLE 2.
Details of the LCM2015 land cover map land classes used in the analysis
| LCM2015 class number | Land use abbreviation | Land use name |
|---|---|---|
| 1 | Broadleaved woodland | BW |
| 2 | Coniferous woodland | CW |
| 3 | Arable and horticulture | AH |
| 4 | Improved grassland | IG |
| 5 | Neutral grassland | NG |
| 6 | Calcareous grassland | CG |
| 7 | Acid grassland | AG |
| 8 | Fen, marsh, and swamp | FS |
| 9 | Heather | HR |
| 10 | Heather grassland | HG |
| 11 | Bog | BO |
| 12 | Inland rock | IR |
| 13 | Saltwater | SW |
| 14 | Freshwater | FW |
| 15 | Supra‐littoral rock | SLR |
| 16 | Supra‐littoral sediment | SLS |
| 17 | Littoral rock | RO |
| 18 | Littoral sediment | LS |
| 19 | Saltmarsh | SM |
| 20 | Urban | UB |
| 21 | Suburban | SB |
2.3. Total DNA extraction
Total DNA was extracted from 40 g honey using a modified protocol for the DNeasy Plant Mini Extraction Kit (Qiagen) described in Hawkins et al. (2015). Each honey sample was homogenized by stirring with a sterile stirrer. Four subsamples of 10 g were diluted in 25 ml molecular biology–grade H2O (Sigma Aldrich) and incubated at 65°C with periodic shaking. Once completely dissolved, each tube of dissolved honey was centrifuged at 15,000 g for 30 min and the supernatant discarded. Parallel centrifugation of the subsamples allows for a larger volume and therefore quantity of honey and pollen to be effectively sampled. Dilution in H2O reduced the specific gravity of the resulting solution sufficiently for pollen to be concentrated in a high‐speed centrifuge. The ratio of honey:water is comparable to that in other recent honey metabarcoding research (Jones et al., 2021). The pellet was suspended in 400 μl AP1 buffer (Qiagen DNeasy Plant Mini Extraction Kit) and 4 μl proteinase K added (20 mg/ml) (Bioline). To mechanically disrupt the pollen, two 3‐mm tungsten carbide beads (Qiagen) were added to each sample prior to processing (4× 1 min cycles at 30 Hz) with a Retsch MM400 mixer mill (Retsch) before a further incubation at 65°C for 30 min. Each set of four subsamples were pooled in a single DNeasy Plant Mini kit spin column (Qiagen), and the extraction continued as directed by the manufacturer's manual but with the omission of the QIA shredder column step and the second wash stage (AW2 wash buffer). Extracted DNA was frozen for long‐term storage at −80°C.
2.4. DNA amplification and sequencing
DNA was amplified using two sets of PCR primers, one amplifying the chloroplastic rbcL gene (Hollingsworth et al., 2009) and one amplifying a plant‐specific variant of the internal transcribed spacer region 2 (ITS2) of the nuclear ribosomal region (Chen et al., 2010). Herein, they are referred to as rbcL and ITS2 pLant (ITS2p), respectively (Table 3). Control amplifications using negative control DNA extractions as the DNA template produced no visible bands on 2% electrophoresis gels and were not progressed further. The PCR products were prepared for sequencing using a two‐stage PCR protocol detailed in the Illumina 16S Library Preparation workflow adapted for use with non‐16S regions. The initial PCR amplifies the region of interest using locus‐specific primers to which the 5′ Illumina adapter overhangs have been added. This PCR used a final volume of 25 μl:2 μl template DNA; 12.5 μl of 2× KAPA HotStart Ready Mix; 0.5 μl (10 μM) forward primer; 0.5 μl (10 μM) reverse primer, and 9.5 μl of molecular biology–grade H2O. Samples were amplified by an initial denaturation at 95°C for 3 min, 30 (rbcL) or 27 (ITS2p) cycles of denaturation (98°C for 20 s), annealing (rbcL: 60°C, ITS2p: 62°C for 30 s), and extension (72°C for 30 s), with a final extension (72°C for 10 min). The PCR products generated were submitted to the Centre for Genomic Research (CGR) at the University of Liverpool where the remaining steps in the workflow were completed (inclusion of Illumina Nextera molecular identifiers by a second round of PCR and pooling in equimolar concentrations) and sequenced on a lane of an Illumina HiSeq 2500 as a 2 × 300 bp rapid run using a V2 flowcell. Raw DNA sequence data are available from the N.C.B.I. sequence read archive under accessions SRR16143791 to SRR16143818.
TABLE 3.
Details of PCR primers used to amplify the two metabarcoding gene regionsmarkers.
2.5. DNA sequence data analysis
Low‐quality regions of sequence data, along with very short reads, were removed with Trimmomatic (parameters used: LEADING:3 TRAILING:3 SLIDINGWINDOW:4:30 MINLEN:50) (Bolger et al., 2014) and adapters removed using Cutadapt (Martin, 2011). Denoising of sequence data, removal of chimeric sequences, and generation of amplicon sequence variants (ASVs) were performed using the DADA2 (Callahan et al., 2016) functionality in the QIIME2 package (Bolyen et al., 2019). Taxonomic assignment of ASVs was performed by the naïve Bayesian classifier in QIIME2 using the “q2‐feature‐classifier” Python script, against either the “rbcL reference library” (https://doi.org/10.6084/m9.figshare.c.3466311.v1) or “Pollen/Plant ITS2 reference set for the RDP/UTAX classifier (2015)” database (Bell & Brosi, 2016; Sickel et al., 2015) as appropriate, against which the classifier had previously been trained. Any ASVs assigned a taxonomy outside the plant kingdom were removed. Any ASV lacking species‐level resolution was searched against the N.C.B.I. nucleotide database using megablasts for highly similar sequences (Camacho et al., 2009). Species‐level taxonomy was assigned where the best match was achieved against a voucher specimen of a single species. If multiple species in the same genus were equally probable, then genus‐level taxonomy was assigned. If multiple genera were equally probable, then family‐level taxonomy was assigned, and so on. In the data of each gene region, ASVs with identical taxonomic assignments were collapsed together and ASV counts combined.
Low‐frequency incidences of collapsed ASVs were removed from individual samples; where the percentage of reads associated with an ASV in a single sample was <0.03% of total reads associated with that ASV. Low‐frequency ASVs within each sample (<1% of total sample reads) were also subsequently removed (Taberlet et al., 2018).
2.6. Pollen taxonomy
Species or genus assignments were checked for plausibility of their presence in the UK against several databases: the Royal Horticultural Society Horticultural Database (Royal Horticultural Society, 2018) based upon the BG‐BASE database v7.3 (BG‐BASE Collections Management Software, 2018); the Biological Records Centre Atlas of the British and Irish Flora (Biological Records Centre, 2018); and the Plants For A Future database (Plants For A Future, 2018), and against a guide to British flora (Stace, 2010) (Appendices A, B, C). Species missing from these sources were checked for availability in online, UK‐based garden centers and assigned UK plausibility accordingly. Genus‐level assignments were filtered based on the plausibility of the genus being present in the UK based on the same records as the species‐level data. Implausible taxa were removed, and abundance matrices from the two gene regions were combined into a single, unweighted presence–absence matrix to maximize the detection range. Only ASVs achieving genus‐level assignment or better were retained. Species‐level assignments were assigned a category based upon their status in the UK, as either native, non‐native, or neophyte.
2.7. Statistical analysis
All analyses were performed using R (version 4.0.4) (R Core Team, 2021), in the RStudio environment (version 2021.09.0, Build 351) (RStudio Team, 2021), all plots produced using “ggplot2” (Wickham, 2016) and FDR corrections performed using the “p.adj” function in the base R package “stats.” QIIME2 output was imported into R using the package “qiime2R” (Bisanz, 2018). The R package “vegan” (Oksanen et al., 2020) was used to calculate rarefaction curves and Shannon diversity indices of plant taxa and land cover in buffers. Fisher's exact test was used to test the independence of the apiary from proportions of native, neophyte, and non‐native species. To test for differences between native, neophyte, and non‐native groups, one‐way ANOVAs upon the proportions of each, per hive were run and subsequently the pairwise group means tested for significant differences using the Tukey HSD posthoc test from the R package “stats” (R Core Team, 2021). For investigation into the relationships between types and diversity of plants in the honey and land cover surrounding an apiary, we elected to focus on the 5000‐m buffer surrounding each apiary, which covers the majority of foraging flights. Proportions of native, non‐native, and neophyte plants were tested for significant associations with proportion of urban land cover in the 5000‐m buffer through calculation of Pearson's correlation coefficient. Pearson's correlation coefficient was used to describe the relationship between Shannon diversity of the plant taxa in each honey and the Shannon diversity of land cover surrounding each hive in the 5000 m buffer as well as the relationships between Shannon diversity of plant taxa in each sample and the proportions of each land cover type in the 5000‐m buffers.
3. RESULTS
3.1. Land cover composition around hives
Of the 21 landscape components defined in the UK Landcover map 2015, 11 classes were identified in the 500‐m and 1000‐m buffer zones around at least one of the 14 hives studied. This increased to 16 classes in the 2500‐m and 18 classes in the 5000‐m buffer zones. The most common landscape components captured were urban, suburban, neutral grassland, improved grassland, and broadleaved woodland. Four hives were located in Manchester city center with >84% urban land cover in the 500‐m buffer and >47% urban in the 5000‐m buffer (Table 1). One hive (A) was represented by a single class (urban) within the 500‐m buffer zone. The remaining hives were distributed across Greater Manchester and surrounding area with increasing proportions of suburban, natural and semi‐natural grasslands, and broadleaf woodland as distance from the city center increased (Figure 1). The predominant classes within the 500‐m buffer zones were urban and suburban, except for one hive (L) which had improved grassland as the dominant class. Proportions of land cover types were mostly independent of one another. In the 500‐m buffers, we observed a significant negative correlation between proportions of SB (suburban) and UB (urban) (r [12] = −.83, p = .01). In the 5000‐m buffers, there were no significant associations between classes of land cover.
3.2. Plant community composition
Per‐apiary, mean rbcL reads passing quality trimming and denoising were 120,773.6 (SD: 59,371.8) and mean ITS2p reads were 345,796.4 (SD: 130,395.2). The UK plausibility filter removed 1.17% reads of these reads assigned to a species and 0.56% reads assigned to a genus only in rbcL and 0.43% assigned to a species and 0.64% assigned to a genus only in ITS2p. After removal of very low‐frequency taxa, 24 species and 42 genera plausible to be present in the UK were detected across all honey samples (Appendixes D and E). In rbcL, 95.08% of reads were assigned a genus and 56.60% assigned a species, while in ITS2p, 84.51% were assigned a genus and 46.50% were assigned a species. The number of unique taxa per hive ranged from 3 to 21. Species‐level identification was possible for 40% of ASVs. Rarefaction curves showed that every sample had reached a detection plateau, sufficient for confident detection of all taxa. Diversity varied among hives (Appendix F), with the two least diverse samples characterized by the presence of a single species (Impatiens glandulifera) and two unresolved genera. Shannon diversity ranged from a minimum of 1.1 to a maximum of 3.14 (Table 4). Taxonomic resolution differed between the two gene regions with entire genera unable to be resolved to species in both. Due to the different specificities of each gene region, only Hydrangea and Juglans were unable to be classified to species level in either region, and as such the combination of data from both regions gives broad spectrum taxonomic detection. Unspecified Hydrangea spp. and Juglans spp. reads accounted for 0.97% and 0.37% of raw reads, respectively.
TABLE 4.
Shannon diversity indices for each of the 14 hives using taxa derived from both rbcL and ITS2p.
| Hive | Shannon diversity |
|---|---|
| A | 3.04 |
| B | 2.56 |
| C | 2.40 |
| D | 3.00 |
| E | 2.20 |
| F | 2.08 |
| G | 2.64 |
| H | 3.14 |
| I | 2.20 |
| J | 1.79 |
| K | 2.30 |
| L | 1.10 |
| M | 1.10 |
| N | 1.79 |
Considering the ASVs with species‐level assignment, native, non‐native, and neophyte species were each found in most, but not all hives, and the number of species in each category was independent of the hive (Fisher's exact test, p = .9984). There were significant differences between each group as determined by one‐way ANOVA (F 2,39 = 11.4, p = .0001) with Tukey HSD pairwise post‐hoc tests revealing a significant difference between native and neophyte species (p = .0001, 95% C.I. = 0.19, 0.59), with neophytes exceeding natives, and a significant difference between non‐native and neophyte species (p = .022, 95% C.I. = 0.03, 0.43), with neophytes exceeding non‐native but no significant difference between native and non‐native species (p = .133, 95% C.I. = −0.04, 0.36).
The most common plant species was Impatiens glandulifera, a neophyte, which was found in honey from every apiary. Also very common were Olea europaea and Rubus armeniacus, both non‐natives, and Trifolium repens, a native, as well as Impatiens spp. and Rubus spp. which did not achieve species‐level resolution. These common ASVs were all found in honey from >50% apiaries. Other trees and shrubs detected included those frequently found in towns and cities such as Quercus spp., Tilia spp., Malus spp., Buddleja spp., Prunus spp., Caragana spp., Salix spp., Hydrangea spp., and Sorbus spp. Another taxon of note is Cannabis sativa which was detected in a single honey. Raw sequence counts assigned at genera and species in each gene region, along with appropriate metadata, are found in the appendices.
A significant negative relationship was observed between Shannon diversity of plant communities in honey and Shannon diversity of the surrounding landscape in the 5000‐m buffers (r [12] = −.73, p = .02) (Figure 2). Plant communities include all taxa detected, including those ASVs achieving only genus‐level assignment.
FIGURE 2.
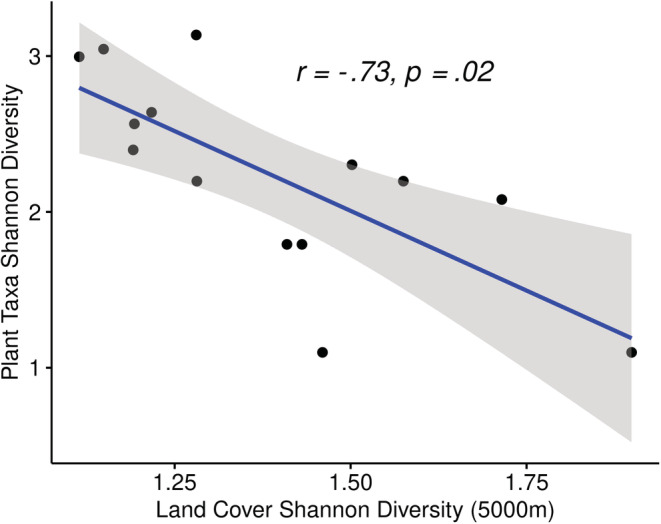
Shannon diversity of plant taxa within a hive is significantly negatively correlated with Shannon diversity of land cover in the surrounding 5000 m, a distance likely to cover the majority of foraging flights by bees. Each data point represents a single hive. Pearson's correlation coefficient is presented along with the linear regression line. The shaded area represents the 95% confidence interval.
A significant positive association was observed between plant diversity and the proportion of urban land cover in the 5000‐m buffers surrounding hives (r [12] = .62, p = .02) (Figure 3). Furthermore, a significant negative association was reported between the proportion of improved grassland and plant diversity (r [12] = −.68, p = .01) (Figure 4). Urban land cover typically includes town and city centers of very little vegetation cover and also includes areas such as docks, car parks, and industrial estates. Improved grassland includes high production grassland, characterized by a lack of winter senescence and is sometimes heavily grazed.
FIGURE 3.
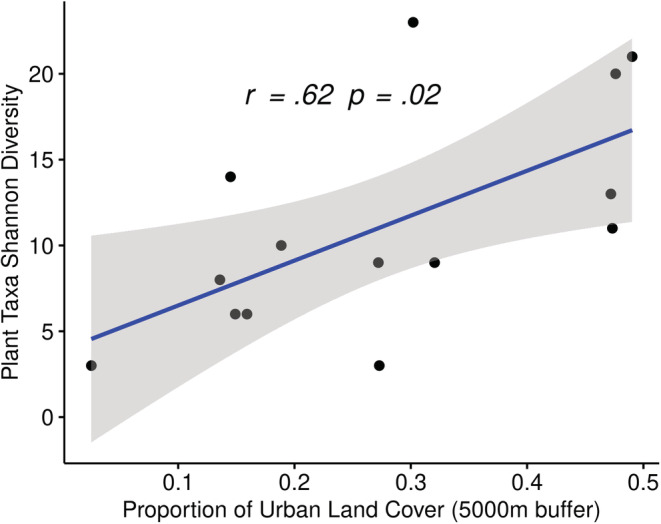
Proportion of urban land in the 5000‐m buffer surrounding a hive (a distance likely to cover the majority of foraging flights by bees) is significantly positively correlated with the Shannon diversity of the plant taxa detected in the honey of the hive. Pearson's correlation coefficient is presented along with the linear regression line. Each data point represents a single hive. The p‐value has been adjusted to control for false discovery. The shaded area represents the 95% confidence interval.
FIGURE 4.
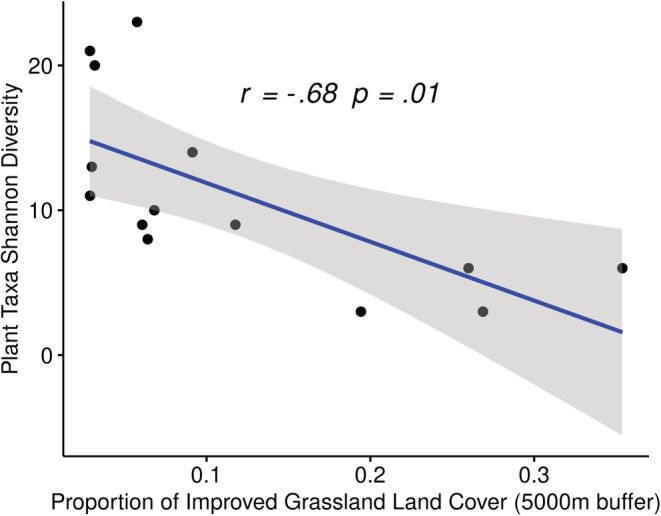
Analysis of the relationship between the proportion of improved grassland (IG) in the 5000‐m buffer surrounding a hive (a distance likely to cover the majority of foraging flights by bees) and the Shannon diversity of the plant taxa detected in the honey showed a significant negative correlation. Pearson's correlation coefficient is presented along with the linear regression line. The p‐value has been adjusted to control for false discovery rate. Each data point represents a single hive.
The proportion of urban land cover in the 5000‐m buffers was not significantly associated with the proportions of native, non‐native, and neophyte plant species detected in the diet. The proportion of urban land cover in the 500‐m buffer was significantly positively associated with the proportion of native species (r [12] = .71, p = .02) and marginally significantly negatively correlated with neophyte species (r [12] = −.61, p = .08). There was no significant relationship between the proportion of urban land cover and the proportion of non‐native plants (r [12] = .37, p = .48).
4. DISCUSSION
We used next‐generation DNA sequencing and a bioinformatics workflow to describe plant taxa in honey and analyzed the plant community data in the context of land cover in the areas surrounding 14 A. mellifera hives. Diverse wild pollinator populations are common in heavily urbanized areas (Baldock et al., 2015; Casanelles‐Abella et al., 2022) and our findings suggest that wild bees are likely to have access to a diverse diet in these areas, alongside managed honey bees. Further work to investigate the influence of land cover on wild generalist bees would undoubtedly be beneficial to support their conservation and to inform efforts to manage some of the global threats to pollinators. While our findings suggest urban areas are a valuable resource for wild bees and honey bees alike, among other pollinators, we are not promoting further uptake in urban beekeeping. Managed A. mellifera colonies can transfer parasites to wild bee colonies and are known to compete with wild bees for resources, potentially mitigating the opportunity that urban areas present and even further exacerbating their declines (Goulson & Sparrow, 2009; Pirk et al., 2017).
4.1. Influence of landscape components on honey bee diet
We found plant taxa richness to be significantly negatively correlated with diversity of land cover surrounding apiaries. Habitat heterogeneity theory tells us that a larger, more heterogeneous environment provides a greater number and wider variety of available habitats or niches and is therefore likely able to support a more diverse flora and fauna (Kallimanis et al., 2008) in apparent contradiction to this finding. In terms of diversity of plant forage available, highly heterogeneous urban landscapes can, in some instances, host more diverse plant communities than landscapes consisting of more diverse but homogenous, land cover types. In this, they can offer an attractive refuge for a diverse community of bees and other pollinators (Daniels et al., 2020; Hall et al., 2017; Hülsmann et al., 2015; Kowarik, 2011; Lowenstein et al., 2019; Somme et al., 2016; Theodorou et al., 2020). This is further supported by our findings as we recorded a significant positive association between the proportion of urban land cover surrounding apiaries and the diversity of plants detected in the honey. Manchester city center has a disproportionately large number of high‐density residential properties (62.6% of all housing in the city) (Baker et al., 2018), and we see that in other comparable cities, the presence of many smaller gardens, cultivated or left wild, provide a diverse forage for bees (Gaston et al., 2005; Lowenstein & Minor, 2016). The post‐industrial cityscape also contains many brownfield sites described as being characteristically long‐term derelict, vacant, and/or contaminated (Dixon et al., 2010), as well as verges, canal towpaths, and other unmanaged areas. Unmanaged areas, urban meadows, and private gardens are very often occupied by native “weed” species, many of which are highly prized sources of pollen and nectar (Sponsler & Johnson, 2015; Turo & Gardiner, 2019; Weaver, 1965). These species often provide their floral rewards either very early or very late in the bee foraging season, providing high value nutrition when forage availability might otherwise be low (Hicks et al., 2016). Garden escapees, alongside wild opportunistic seedlings in urban areas, have the added advantage of being unlikely to be treated with pesticides common in agricultural, horticultural, and floricultural trades (Goulson et al., 2018; Lentola et al., 2017). Studies in other urban areas have shown higher plant diversity in the private gardens of diverse areas with both ornamental and weed species contributing to the complexity, and there is ample scope for high‐density vertical planting (green walls, planters on balconies of high‐rise buildings) alongside relatively little use of ornamental lawns in highly urbanized municipal planting schemes and domestic gardens (Aronson et al., 2017; Knapp et al., 2012; Lowenstein & Minor, 2016). Several studies now show that urban and suburban environments appear to support a greater diversity of pollen in the diet than that provided by other surrounding land cover types (Lucek et al., 2019; Richardson et al., 2021). Our study adds to and supports this body of work, expanding it to include other sites.
Every hive in our study had multiple types of land cover in the surrounding buffers, with larger buffers more likely to capture a diverse range of land cover types. As such, even those hives in which the smallest (500 m) buffer was dominated by a single land cover type, the proportion of that dominant type was reduced at larger buffers. In the cases of four hives with very high proportions of urban land cover in the 500‐m buffer, the proportion of urban land decreased as the buffer size around the hive increased. Foragers from these hives, therefore, have ample scope to access other types of land cover on foraging flights, most commonly suburban areas, the secondary land cover type surrounding these hives. Previous studies have demonstrated that urban bees in the UK can access ample floral resources at close proximity and forage mostly within a smaller range (500 m to 1.2 km) than the maximum distances recorded by foraging bees (~12 km); however, this does appear to be seasonal and not universal to all urban areas (Beekman & Ratnieks, 2000; Garbuzov et al., 2015; Sponsler & Johnson, 2015; Steffan‐Dewenter & Kuhn, 2003).
Honey sampling is recognized to provide detection of plants over a broad temporal range and here enabled the detection of a wide range of plants (de Vere et al., 2017; Hawkins et al., 2015; Louveaux et al., 1978). It is reasonable to argue that our analysis describes forage collected in highly urbanized areas at some point of the foraging year, but we are unable to describe the foraging range of bees from these hives conclusively. The pooling of honey from multiple combs during a traditional extraction, albeit from within an apiary, will very likely increase pollen diversity in a given sample due to honey being made at different stages of the foraging season. While our samples were a mixture of extraction types, removal of non‐traditional (single frame) samples did not yield any notable differences in our results, and as such all samples were included in analyses. The patterns we report in the data may well be specific to samples collected at a particular time of the foraging season, as forage diversity is known to vary throughout the year (Requier et al., 2015). Further sampling of honey from similar hives across the temporal range of the foraging period would further elucidate the apparent relationship between diet diversity and surrounding land use.
We have shown a significant negative relationship between the proportion of improved grassland surrounding an apiary and the diversity of plants in the honey. The hive with the highest proportion of improved grassland in the 500‐m buffer (L) is by far the most rural in the simple terms of proximity to a large town or city and has one of the smallest proportions of urban land in its immediate surroundings (0.8% UB in 500 m buffer). This particular hive showed very low plant diversity, containing only I. glandulifera, Impatiens spp. (very likely Impatiens glandulifera, but species resolution not possible for this ASV), and Rhododendron spp., all of which are known to be rich sources of pollen (Hicks et al., 2016). Clearly absent from this rural hive are some of the woody species that make up a large component of the diet of other hives. Notable by their absence are the Oleaceae, Fabaceae, Fagaceae, and Brassicaceae, which although not uniformly present in every other hive, are all common families across the data set. The reliance of bees from this rural hive on a very small number of taxa is of concern. The loss of flower resources due to farming intensification is recognized as an important driver in pollinator declines (Potts et al., 2010). Furthermore, the importance of the introduction or restoration of flower‐rich habitats in improved grasslands in order to enhance biodiversity for pollinators has also been established previously (Orford et al., 2016).
4.2. Plant metabarcoding technical considerations
We found that the combination of laboratory and bioinformatics methods employed produced many false positive results at the taxon assignment stage, in common with many metabarcoding studies (Ficetola et al., 2016; Porter & Hajibabaei, 2018; Zinger et al., 2019). For example, the data described plant species in our samples that were unlikely to be growing in the region. A database of plausible taxa in the ecosystem is therefore invaluable for quality control and should be generated and evaluated with the highest possible level of stringency. In the British Isles, we have an extremely well‐characterized and barcoded native flora (Ratnasingham & Herbert, 2007; Stace, 2010), but the range of plants visited by bees and other pollinators is often much more diverse. A generalist forager such as a honey bee will forage exotic cultivars in gardens, and some invasive species are known to provide the majority of nectar and pollen to a hive when available (Donkersley et al., 2017), as we found in the present study. Where research is focused upon urban and suburban ecosystems, in particular, it is important to adjust the criteria by which plausible plant taxa are filtered, as a simple filter which only passes native, or naturalized, plant species will not suffice. Initial exploratory analysis of the data revealed that implausible taxonomies were much more likely to be assigned to ASVs present at extremely low relative abundances. This is potentially due to errors inserted at a low frequency into amplicons during PCR amplification, DNA sequencing or as other artifacts of the data analysis method. To handle these low‐frequency, implausible taxa, we removed any low‐frequency ASVs during data processing (Taberlet et al., 2018). After this blunt‐edged, but highly effective, data processing step, relatively few implausible ASVs remained, and any that remained were also subsequently removed by our filter against the database of plausible taxa.
5. CONCLUSION
The combination of DNA metabarcoding and GIS analyses provides a powerful tool to describe the influence of land cover on the pollen diet of bees. The managed A. mellifera colonies are a valuable resource for wider pollinator research and can also be used as a model to infer important concepts to the conservation of wild bees. Urban environments can provide an abundant and diverse pollen diet, suitable for a generalist pollinator such as A. mellifera, as well as other wild pollinators. The highly heterogeneous habitats characteristic of urban settings provide ample opportunities for a diverse array of pollen‐ and nectar‐rich plants including native, non‐native, and neophyte species. Improved grassland, including the lawns typical of suburban habitats and of agricultural environments, provides forage with far less plant diversity. These pollen‐poor areas could be improved by allowing the common lawn weeds T. repens, T. officinali, or B. perennis to prosper and flower. In farm agri‐environmental schemes, this often takes the form of strip planting of pollen‐ and nectar‐rich flower mixes in edges and the improvement of grassland by the introduction of legumes such as the Trifolium spp. (Carreck & Williams, 2002; Requier et al., 2015; Wood et al., 2015). Given the previously stated ecological and financial importance of bees and other pollinators, the relative merits of urban and agricultural spaces as providers of a healthy diverse forage are not in balance. Considering our samples and analyses, we conclude that urban spaces currently represent a valuable, diverse pollen and nectar resource for pollinators. While a valuable member of the global pollinator community, A. mellifera are not under threat and although urban colonies such as those in the present study can be a valuable research resource, increasing density of apiaries may in fact negatively impact wild bees further (Goulson & Sparrow, 2009; Pirk et al., 2017). Non‐native and neophyte species play a critical role in expanding the diet diversity beyond native species and also in increasing the foraging season, allowing the generation of large honey reserves for the colony.
AUTHOR CONTRIBUTIONS
Graeme Fox: Conceptualization (supporting); formal analysis (lead); investigation (equal); methodology (equal); project administration (supporting); writing – original draft (equal); writing – review and editing (lead). Latha R. Vellaniparambil: Conceptualization (supporting); formal analysis (supporting); funding acquisition (equal); investigation (equal); methodology (equal); project administration (supporting); writing – original draft (equal); writing – review and editing (supporting). Joshua Sammy: Investigation (supporting); methodology (supporting); writing – review and editing (supporting). Loreto Ros: Investigation (supporting); methodology (supporting); writing – review and editing (supporting). Richard F. Preziosi: Conceptualization (supporting); formal analysis (supporting); funding acquisition (equal); supervision (supporting); writing – review and editing (supporting). Jennifer K. Rowntree: Conceptualization (lead); formal analysis (supporting); funding acquisition (equal); project administration (lead); supervision (lead); writing – original draft (supporting); writing – review and editing (supporting).
CONFLICT OF INTEREST
The authors declare no conflicts of interest.
ACKNOWLEDGMENTS
We are very grateful to all the beekeepers who kindly collected and donated honey samples from their hives, as well as the Manchester and District Beekeepers Association (MDBKA) for facilitating connections. Special thanks also go to Yan Guo who assisted with much of the laboratory work and processing of samples. Funding for the sample collection, preparation, and sequencing was received from a Daphne Jackson Trust Research Fellowship (Daphne Jackson Trust) grant in Latha R. Vellaniparambil's name. We thank Dr Bradley Cain and Prof. Phill Watts and several members of the Ecology and Environment Research Centre at MMU, for helpful comments on an earlier version of the study and the manuscript.
APPENDIX A.
Metadata relating to each species identified in at least one of 14 Apis mellifera hives in northwest England. Information includes the species name, status (native, non‐native or neophyte), a habitat descriptor, and whether it is a species plausibly found within the UK
| Species | Status | Habit | Habitat |
|---|---|---|---|
| Impatiens glandulifera | Neophyte | Annual | Manmade, moist soils |
| Rubus armeniacus | Non_native | Shrub | Manmade |
| Olea europaea | Non_native | Tree | Manmade |
| Melilotus officinalis | Neophyte | Biennial | Wide range |
| Citrus sinensis | Non_native | Tree | Manmade |
| Viburnum acerifolium | Neophyte | Shrub | Manmade |
| Cannabis sativa | Non_native | Annual | Manmade |
| Salix babylonica | Non_native | Tree | Manmade |
| Trifolium repens | Native | Perennial herb | Wide range |
| Phormium tenax | Non_native | Perennial | Manmade |
| Zanthoxylum piperitum | Non_native | Shrub | Manmade |
| Papaver somniferum | Non_native | Annual | Manmade |
| Lavatera thuringiaca | Non_native | Perennial herb | Manmade |
| Actinidia chinensis | Non_native | Vine | Manmade |
| Ailanthus altissima | Neophyte | Tree | Manmade |
| Papaver rhoeas | Native | Annual | Manmade, disturbed habitats |
| Leontodon hispidus | Native | Perennial herb | Wide range, calcareous soils |
| Ligustrum ovalifolium | Neophyte | Shrub | Manmade |
| Filipendula ulmaria | Native | Perennial herb | Wetland |
| Prunus avium | Native | Tree | Wide range |
| Phaseolus coccineus | Non_native | Vine | Manmade |
| Sinapis arvensis | Native | Annual | Disturbed habitats |
| Castanea sativa | Neophyte | Tree | Manmade, woodland |
| Melilotus altissimus | Neophyte | Biennial | Disturbed habitats |
APPENDIX B.
List of sources from which each species status was identified. Sources are either online databases, books of native flora, or specialist websites devoted to a taxon
APPENDIX C.
List of sources from which each species' habit was identified. Sources are either online databases, books of native flora, or specialist websites devoted to a taxon
APPENDIX D.
rbcL read counts attributed to taxa plausibly detected in the UK assigned genus or species, per apiary
| Order | Family | Genus | Species | A | B | C | D | E | F | G | H | I | J | K | L | M | N |
|---|---|---|---|---|---|---|---|---|---|---|---|---|---|---|---|---|---|
| Ericales | Balsaminaceae | Impatiens | Impatiens glandulifera | 0 | 3597 | 13,982 | 245 | 18,419 | 0 | 6005 | 8142 | 0 | 1002 | 117,419 | 78,123 | 47,140 | 83,885 |
| Rosales | Rosaceae | Rubus | Rubus armeniacus | 35,405 | 98,362 | 65,554 | 4433 | 0 | 24,856 | 6538 | 8068 | 0 | 0 | 0 | 0 | 0 | 0 |
| Lamiales | Oleaceae | Olea | Olea europaea | 10,807 | 4265 | 10,164 | 8737 | 8714 | 0 | 5561 | 34,799 | 0 | 60,948 | 0 | 0 | 0 | 0 |
| Fabales | Fabaceae | Melilotus | Melilotus officinalis | 0 | 0 | 7149 | 0 | 0 | 68,779 | 0 | 0 | 0 | 0 | 0 | 0 | 0 | 0 |
| Sapindales | Rutaceae | Citrus | Citrus sinensis | 0 | 0 | 0 | 0 | 0 | 0 | 0 | 0 | 63,728 | 0 | 0 | 0 | 0 | 0 |
| Dipsacales | Adoxaceae | Viburnum | Viburnum acerifolium | 0 | 0 | 0 | 0 | 0 | 0 | 0 | 0 | 0 | 20,690 | 0 | 0 | 0 | 0 |
| Rosales | Cannabaceae | Cannabis | Cannabis sativa | 0 | 0 | 0 | 0 | 0 | 0 | 0 | 0 | 0 | 0 | 12,107 | 0 | 0 | 0 |
| Malpighiales | Salicaceae | Salix | Salix babylonica | 0 | 0 | 0 | 0 | 0 | 0 | 5963 | 1269 | 0 | 0 | 0 | 0 | 0 | 0 |
| Fabales | Fabaceae | Trifolium | Trifolium repens | 0 | 1323 | 0 | 0 | 0 | 0 | 1391 | 0 | 0 | 910 | 0 | 0 | 0 | 0 |
| Asparagales | Xanthorrhoeaceae | Phormium | Phormium tenax | 3513 | 0 | 0 | 0 | 0 | 0 | 0 | 0 | 0 | 0 | 0 | 0 | 0 | 0 |
| Sapindales | Rutaceae | Zanthoxylum | Zanthoxylum piperitum | 0 | 0 | 0 | 2396 | 0 | 0 | 0 | 0 | 0 | 0 | 0 | 0 | 0 | 0 |
| Ranunculales | Papaveraceae | Papaver | Papaver somniferum | 0 | 0 | 0 | 0 | 0 | 0 | 0 | 1139 | 0 | 0 | 0 | 0 | 0 | 0 |
| Malvales | Malvaceae | Lavatera | Lavatera thuringiaca | 0 | 0 | 0 | 452 | 0 | 0 | 0 | 0 | 0 | 0 | 0 | 0 | 0 | 0 |
| Ericales | Actinidiaceae | Actinidia | Actinidia chinensis | 0 | 0 | 0 | 0 | 0 | 0 | 0 | 594 | 0 | 0 | 0 | 0 | 0 | 0 |
| Sapindales | Simaroubaceae | Ailanthus | Ailanthus altissima | 0 | 0 | 0 | 176 | 0 | 0 | 0 | 0 | 0 | 0 | 0 | 0 | 0 | 0 |
| Ranunculales | Papaveraceae | Papaver | Papaver rhoeas | 0 | 0 | 0 | 193 | 0 | 0 | 0 | 0 | 0 | 0 | 0 | 0 | 0 | 0 |
| Rosales | Rosaceae | Rubus | NA | 17,270 | 64,271 | 3559 | 1225 | 0 | 14,038 | 14,021 | 10,975 | 0 | 0 | 0 | 0 | 0 | 20,439 |
| Rosales | Rosaceae | Sorbus | NA | 26,708 | 0 | 92,585 | 0 | 13,587 | 0 | 0 | 0 | 0 | 0 | 0 | 0 | 0 | 0 |
| Fagales | Fagaceae | Quercus | NA | 1758 | 0 | 20,225 | 0 | 0 | 5569 | 3724 | 0 | 0 | 0 | 19,054 | 0 | 0 | 11,249 |
| Sapindales | Rutaceae | Citrus | NA | 0 | 0 | 0 | 0 | 0 | 0 | 0 | 0 | 534 | 0 | 0 | 0 | 0 | 0 |
| Apiales | Araliaceae | Hydrangea | NA | 0 | 0 | 0 | 0 | 13,049 | 0 | 0 | 671 | 0 | 46,135 | 0 | 0 | 0 | 0 |
| Rosales | Rosaceae | Prunus | NA | 11,186 | 1628 | 0 | 17,350 | 0 | 0 | 0 | 12,576 | 0 | 0 | 0 | 0 | 0 | 0 |
| Ericales | Theaceae | Camellia | NA | 0 | 0 | 0 | 0 | 0 | 0 | 27,499 | 0 | 0 | 0 | 1895 | 0 | 0 | 0 |
| Rosales | Rosaceae | Crataegus | NA | 0 | 0 | 0 | 0 | 22,495 | 0 | 0 | 680 | 0 | 0 | 0 | 0 | 0 | 0 |
| Ericales | Ericaceae | Rhododendron | NA | 0 | 0 | 0 | 0 | 0 | 0 | 0 | 0 | 0 | 0 | 8008 | 20,585 | 0 | 0 |
| Rosales | Rosaceae | Mespilus | NA | 2209 | 16,971 | 0 | 0 | 0 | 0 | 0 | 0 | 0 | 0 | 0 | 0 | 0 | 0 |
| Rosales | Rosaceae | Fragaria | NA | 0 | 0 | 8106 | 0 | 0 | 0 | 0 | 9882 | 0 | 0 | 0 | 0 | 0 | 0 |
| Lamiales | Scrophulariaceae | Buddleja | NA | 2632 | 14,726 | 0 | 664 | 0 | 0 | 0 | 592 | 0 | 0 | 0 | 0 | 0 | 0 |
| Rosales | Rosaceae | Malus | NA | 6547 | 0 | 0 | 410 | 0 | 0 | 0 | 1714 | 655 | 0 | 0 | 0 | 0 | 0 |
| Malvales | Malvaceae | Tilia | NA | 0 | 7094 | 0 | 355 | 3230 | 0 | 0 | 940 | 0 | 0 | 0 | 0 | 0 | 0 |
| Dipsacales | Caprifoliaceae | Dipsacus | NA | 0 | 0 | 0 | 0 | 0 | 0 | 0 | 0 | 0 | 0 | 0 | 0 | 0 | 9852 |
| Malpighiales | Salicaceae | Salix | NA | 0 | 0 | 0 | 1866 | 0 | 0 | 0 | 4128 | 0 | 0 | 0 | 0 | 0 | 0 |
| Sapindales | Sapindaceae | Acer | NA | 4865 | 1659 | 0 | 0 | 0 | 0 | 0 | 0 | 0 | 0 | 0 | 0 | 0 | 0 |
| Cucurbitales | Begoniaceae | Begonia | NA | 0 | 0 | 0 | 0 | 0 | 0 | 7052 | 0 | 0 | 0 | 4078 | 0 | 0 | 0 |
| Rosales | Rosaceae | Pyrus | NA | 0 | 0 | 0 | 2545 | 0 | 0 | 0 | 1172 | 0 | 0 | 0 | 0 | 0 | 0 |
| Myrtales | Myrtaceae | Eucalyptus | NA | 0 | 0 | 0 | 0 | 0 | 0 | 0 | 0 | 0 | 0 | 2847 | 0 | 0 | 0 |
| Rosales | Rosaceae | Rosa | NA | 1869 | 0 | 0 | 0 | 0 | 0 | 0 | 0 | 0 | 0 | 0 | 0 | 0 | 0 |
| Fagales | Juglandaceae | Juglans | NA | 0 | 0 | 0 | 0 | 0 | 0 | 0 | 0 | 1659 | 0 | 0 | 0 | 0 | 0 |
| Lamiales | Lamiaceae | Salvia | NA | 0 | 1494 | 0 | 0 | 0 | 0 | 0 | 0 | 0 | 0 | 0 | 0 | 0 | 0 |
| Geraniales | Geraniaceae | Geranium | NA | 0 | 0 | 0 | 0 | 0 | 0 | 0 | 1407 | 0 | 0 | 0 | 0 | 0 | 0 |
| Aquifoliales | Aquifoliaceae | Ilex | NA | 0 | 0 | 0 | 0 | 0 | 0 | 0 | 0 | 0 | 0 | 1014 | 0 | 0 | 0 |
| Rosales | Rhamnaceae | Ceanothus | NA | 0 | 0 | 0 | 0 | 0 | 0 | 0 | 741 | 0 | 0 | 0 | 0 | 0 | 0 |
| Magnoliales | Magnoliaceae | Magnolia | NA | 0 | 0 | 0 | 0 | 0 | 0 | 0 | 0 | 0 | 0 | 401 | 0 | 0 | 0 |
| Solanales | Convolvulaceae | Calystegia | NA | 0 | 0 | 0 | 0 | 0 | 0 | 0 | 627 | 0 | 0 | 0 | 0 | 0 | 0 |
| Poales | Poaceae | Triticum | NA | 0 | 0 | 0 | 0 | 0 | 0 | 0 | 0 | 58 | 0 | 0 | 0 | 0 | 0 |
| Solanales | Solanaceae | Nicotiana | NA | 0 | 0 | 0 | 0 | 0 | 0 | 0 | 0 | 33 | 0 | 0 | 0 | 0 | 0 |
APPENDIX E.
ITS2p read counts attributed to taxa plausibly detected in the UK assigned genus or species, per apiary
| Order | Family | Genus | Species | A | B | C | D | E | F | G | H | I | J | K | L | M | N |
|---|---|---|---|---|---|---|---|---|---|---|---|---|---|---|---|---|---|
| Ericales | Balsaminaceae | Impatiens | Impatiens glandulifera | 35,988 | 122,419 | 195,927 | 41,772 | 124,400 | 105,386 | 209,250 | 212,860 | 1897 | 300,533 | 290,665 | 163,508 | 151,696 | 165,628 |
| Fabales | Fabaceae | Trifolium | Trifolium repens | 4244 | 1848 | 0 | 888 | 0 | 1166 | 0 | 0 | 0 | 0 | 0 | 0 | 0 | 0 |
| Asterales | Asteraceae | Leontodon | Leontodon hispidus | 0 | 0 | 0 | 0 | 0 | 0 | 0 | 9631 | 0 | 0 | 0 | 0 | 0 | 0 |
| Lamiales | Oleaceae | Ligustrum | Ligustrum ovalifolium | 0 | 0 | 0 | 24,897 | 0 | 0 | 6968 | 7105 | 0 | 0 | 0 | 0 | 0 | 0 |
| Rosales | Rosaceae | Filipendula | Filipendula ulmaria | 0 | 0 | 0 | 0 | 0 | 0 | 0 | 17,128 | 0 | 0 | 0 | 0 | 0 | 0 |
| Rosales | Rosaceae | Prunus | Prunus avium | 0 | 0 | 0 | 11,109 | 0 | 0 | 0 | 0 | 0 | 0 | 0 | 0 | 0 | 0 |
| Fabales | Fabaceae | Phaseolus | Phaseolus coccineus | 0 | 0 | 0 | 0 | 0 | 0 | 19,337 | 0 | 0 | 0 | 0 | 0 | 0 | 0 |
| Brassicales | Brassicaceae | Sinapis | Sinapis arvensis | 3634 | 2038 | 3908 | 1561 | 0 | 0 | 0 | 0 | 0 | 0 | 0 | 0 | 0 | 0 |
| Fagales | Fagaceae | Castanea | Castanea sativa | 0 | 0 | 0 | 0 | 2014 | 0 | 0 | 0 | 1114 | 0 | 0 | 0 | 0 | 0 |
| Fabales | Fabaceae | Melilotus | Melilotus altissimus | 7230 | 0 | 0 | 1664 | 0 | 0 | 0 | 0 | 0 | 0 | 0 | 0 | 0 | 0 |
| Ericales | Balsaminaceae | Impatiens | NA | 19,606 | 74,375 | 121,599 | 24,606 | 94,358 | 66,455 | 138,572 | 119,756 | 3455 | 179,160 | 181,049 | 80,596 | 111,081 | 87,524 |
| Rosales | Rosaceae | Rubus | NA | 21,719 | 107,815 | 3492 | 77,654 | 8417 | 1332 | 8075 | 22,460 | 0 | 0 | 0 | 0 | 1275 | 2501 |
| Fabales | Fabaceae | Melilotus | NA | 4592 | 0 | 1297 | 0 | 0 | 0 | 0 | 0 | 0 | 0 | 0 | 0 | 0 | 0 |
| Sapindales | Rutaceae | Citrus | NA | 0 | 0 | 0 | 0 | 0 | 0 | 0 | 0 | 123,240 | 0 | 0 | 0 | 0 | 0 |
| Apiales | Araliaceae | Hydrangea | NA | 0 | 0 | 0 | 0 | 3816 | 0 | 0 | 0 | 0 | 0 | 0 | 0 | 0 | 0 |
| Rosales | Rosaceae | Prunus | NA | 1084 | 0 | 0 | 19,995 | 0 | 0 | 0 | 2619 | 0 | 0 | 0 | 0 | 0 | 0 |
| Malpighiales | Salicaceae | Salix | NA | 547 | 0 | 0 | 17,756 | 0 | 0 | 0 | 1641 | 0 | 0 | 0 | 0 | 0 | 0 |
| Fabales | Fabaceae | Trifolium | NA | 2825 | 0 | 0 | 0 | 0 | 0 | 0 | 0 | 0 | 0 | 0 | 0 | 0 | 0 |
| Fagales | Juglandaceae | Juglans | NA | 0 | 0 | 0 | 0 | 0 | 0 | 0 | 0 | 22,445 | 0 | 0 | 0 | 0 | 0 |
| Malpighiales | Salicaceae | Populus | NA | 0 | 0 | 0 | 0 | 0 | 0 | 0 | 0 | 0 | 0 | 0 | 0 | 0 | 43,523 |
| Fabales | Fabaceae | Phaseolus | NA | 0 | 0 | 0 | 0 | 0 | 0 | 32,027 | 0 | 0 | 0 | 0 | 0 | 0 | 0 |
| Fabales | Fabaceae | Caragana | NA | 3364 | 0 | 0 | 0 | 0 | 2089 | 1885 | 0 | 0 | 0 | 0 | 0 | 0 | 0 |
APPENDIX F.
Total numbers of genus and species detected by each marker (rbcL or ITS2p) in each of 14 Apis mellifera hives in north west England
| Hive | rbcL Genera | rbcL Species | ITS2p Genera | ITS2p Species |
|---|---|---|---|---|
| A | 11 | 3 | 8 | 4 |
| B | 10 | 4 | 4 | 3 |
| C | 7 | 4 | 4 | 2 |
| D | 13 | 7 | 8 | 6 |
| E | 6 | 2 | 4 | 2 |
| F | 3 | 2 | 4 | 2 |
| G | 8 | 5 | 5 | 3 |
| H | 17 | 6 | 7 | 4 |
| I | 5 | 1 | 4 | 2 |
| J | 5 | 4 | 1 | 1 |
| K | 9 | 2 | 1 | 1 |
| L | 2 | 1 | 1 | 1 |
| M | 1 | 1 | 2 | 1 |
| N | 4 | 1 | 3 | 1 |
Fox, G. , Vellaniparambil, L. R. , Ros, L. , Sammy, J. , Preziosi, R. F. , & Rowntree, J. K. (2022). Complex urban environments provide Apis mellifera with a richer plant forage than suburban and more rural landscapes. Ecology and Evolution, 12, e9490. 10.1002/ece3.9490
DATA AVAILABILITY STATEMENT
Next‐generation sequencing data are available for public download from the N.C.B.I sequence read archive (SRA) database under identifiers SRR16143791 to SRR16143818. The associated R analysis script, intermediary data files, plant metadata, and QGIS land use data are all available to download from GitHub (https://github.com/graemefox/Mancester_honey) and from Dryad (DOI: https://doi.org/10.5061/dryad.5hqbzkh91).
REFERENCES
- Alaux, C. , Ducloz, F. , Crauser, D. , & Le Conte, Y. (2010). Diet effects on honeybee immunocompetence. Biology Letters, 6(4), 562–565. 10.1098/rsbl.2009.0986 [DOI] [PMC free article] [PubMed] [Google Scholar]
- Altaye, S. Z. , Pirk, C. W. W. , Crewe, R. M. , & Nicolson, S. W. (2010). Convergence of carbohydrate‐biased intake targets in caged worker honeybees fed different protein sources. Journal of Experimental Biology, 213(19), 3311–3318. 10.1242/jeb.046953 [DOI] [PubMed] [Google Scholar]
- Aronson, M. F. , Lepczyk, C. A. , Evans, K. L. , Goddard, M. A. , Lerman, S. B. , MacIvor, J. S. , Nilon, C. H. , & Vargo, T. (2017). Biodiversity in the city: Key challenges for urban green space management. Frontiers in Ecology and the Environment, 15(4), 189–196. 10.1002/fee.1480 [DOI] [Google Scholar]
- Avni, D. , Hendriksma, H. P. , Dag, A. , Uni, Z. , & Shafir, S. (2014). Nutritional aspects of honey bee‐collected pollen and constraints on colony development in the eastern Mediterranean. Journal of Insect Physiology, 69, 65–73. 10.1016/j.jinsphys.2014.07.001 [DOI] [PubMed] [Google Scholar]
- Ayers, A. C. , & Rehan, S. M. (2021). Supporting bees in cities: How bees are influenced by local and landscape features. Insects, 12(2), 128. 10.3390/insects12020128 [DOI] [PMC free article] [PubMed] [Google Scholar]
- Baker, F. , Smith, C. L. , & Cavan, G. (2018). A combined approach to classifying land surface cover of urban domestic gardens using citizen science data and high resolution image analysis. Remote Sensing, 10(4), 537. 10.3390/rs10040537 [DOI] [Google Scholar]
- Baldock, K. C. R. , Goddard, M. A. , Hicks, D. M. , Kunin, W. E. , Mitschunas, N. , Morse, H. , Osgathorpe, L. M. , Potts, S. G. , Robertson, K. M. , Scott, A. V. , Staniczenko, P. P. A. , Stone, G. N. , Vaughan, I. P. , & Memmott, J. (2019). A systems approach reveals urban pollinator hotspots and conservation opportunities. Nature Ecology and Evolution, 3(3), 363–373. 10.1038/s41559-018-0769-y [DOI] [PMC free article] [PubMed] [Google Scholar]
- Baldock, K. C. R. , Goddard, M. A. , Hicks, D. M. , Kunin, W. E. , Mitschunas, N. , Osgathorpe, L. M. , Potts, S. G. , Robertson, K. M. , Scott, A. V. , Stone, G. N. , Vaughan, I. P. , & Memmott, J. (2015). Where is the UK's pollinator biodiversity? The importance of urban areas for flower‐visiting insects. Proceedings of the Royal Society B: Biological Sciences, 282(1803), 20142849. 10.1098/rspb.2014.2849 [DOI] [PMC free article] [PubMed] [Google Scholar]
- Beekman, M. , & Ratnieks, F. L. W. (2000). Long‐range foraging by the honey‐bee, Apis mellifera L. Functional Ecology, 14(4), 490–496. 10.1046/j.1365-2435.2000.00443.x [DOI] [Google Scholar]
- Bell, K. L. , & Brosi, B. (2016). RbcL reference library . Figshare. 10.6084/m9.figshare.c.3466311.v1 [DOI] [PMC free article] [PubMed]
- Bell, K. L. , de Vere, N. , Keller, A. , Richardson, R. T. , Gous, A. , Burgess, K. S. , & Brosi, B. J. (2016). Pollen DNA barcoding: Current applications and future prospects. Genome, 59(9), 629–640. 10.1139/gen-2015-0200 [DOI] [PubMed] [Google Scholar]
- BG‐BASE Collections Management Software . (2018). BG‐BASE collections management software (7.3) . http://www.bg‐base.com/
- Biological Records Centre . (2018). Biological Records Centre Atlas of the British and Irish Flora . https://www.brc.ac.uk/plantatlas/
- Bisanz, J. E. (2018). Qiime2R: Importing QIIME2 artefacts and associated data into R sessions . https://github.com/jbisanz/qiime2R
- Bolger, A. M. , Lohse, M. , & Usadel, B. (2014). Trimmomatic: A flexible trimmer for Illumina sequence data. Bioinformatics, 30(15), 2114–2120. 10.1093/bioinformatics/btu170 [DOI] [PMC free article] [PubMed] [Google Scholar]
- Bolyen, E. , Rideout, J. R. , Dillon, M. R. , Bokulich, N. A. , Abnet, C. C. , Al‐Ghalith, G. A. , Alexander, H. , Alm, E. J. , Arumugam, M. , Asnicar, F. , Bai, Y. , Bisanz, J. E. , Bittinger, K. , Brejnrod, A. , Brislawn, C. J. , Brown, C. T. , Callahan, B. J. , Caraballo‐Rodríguez, A. M. , Chase, J. , … Caporaso, J. G. (2019). Reproducible, interactive, scalable and extensible microbiome data science using QIIME 2. Nature Biotechnology, 37(8), 852–857. 10.1038/s41587-019-0209-9 [DOI] [PMC free article] [PubMed] [Google Scholar]
- Botías, C. , David, A. , Hill, E. M. , & Goulson, D. (2017). Quantifying exposure of wild bumblebees to mixtures of agrochemicals in agricultural and urban landscapes. Environmental Pollution, 222, 73–82. 10.1016/j.envpol.2017.01.001 [DOI] [PubMed] [Google Scholar]
- Branchiccela, B. , Castelli, L. , Corona, M. , Díaz‐Cetti, S. , Invernizzi, C. , Martínez de la Escalera, G. , Mendoza, Y. , Santos, E. , Silva, C. , Zunino, P. , & Antúnez, K. (2019). Impact of nutritional stress on the honeybee colony health. Scientific Reports, 9, 10156. 10.1038/s41598-019-46453-9 [DOI] [PMC free article] [PubMed] [Google Scholar]
- Breeze, T. D. , Vaissière, B. E. , Bommarco, R. , Petanidou, T. , Seraphides, N. , Kozák, L. , Scheper, J. , Biesmeijer, J. C. , Kleijn, D. , Gyldenkærne, S. , Moretti, M. , Holzschuh, A. , Steffan‐Dewenter, I. , Stout, J. C. , Pärtel, M. , Zobel, M. , & Potts, S. G. (2014). Agricultural policies exacerbate honeybee pollination service supply‐demand mismatches across Europe. PLoS One, 9(1), e82996. 10.1371/journal.pone.0082996 [DOI] [PMC free article] [PubMed] [Google Scholar]
- Brodschneider, R. , & Crailsheim, K. (2010). Nutrition and health in honey bees. Apidologie, 41(3), 278–294. 10.1051/apido/2010012 [DOI] [Google Scholar]
- Burgess, K. S. , Fazekas, A. J. , Kesanakurti, P. R. , Graham, S. W. , Husband, B. C. , Newmaster, S. G. , Percy, D. M. , Hajibabaei, M. , & Barrett, S. C. H. (2011). Discriminating plant species in a local temperate flora using the rbcL+matK DNA barcode. Methods in Ecology and Evolution, 2(4), 333–340. 10.1111/j.2041-210X.2011.00092.x [DOI] [Google Scholar]
- Callahan, B. J. , McMurdie, P. J. , Rosen, M. J. , Han, A. W. , Johnson, A. J. A. , & Holmes, S. P. (2016). DADA2: High‐resolution sample inference from Illumina amplicon data. Nature Methods, 13(7), 581–583. 10.1038/nmeth.3869 [DOI] [PMC free article] [PubMed] [Google Scholar]
- Camacho, C. , Coulouris, G. , Avagyan, V. , Ma, N. , Papadopoulos, J. , Bealer, K. , & Madden, T. L. (2009). BLAST+: Architecture and applications. BMC Bioinformatics, 10(1), 421. 10.1186/1471-2105-10-421 [DOI] [PMC free article] [PubMed] [Google Scholar]
- Carreck, N. L. , & Williams, I. H. (2002). Food for insect pollinators on farmland: Insect visits to flowers of annual seed mixtures. Journal of Insect Conservation, 6(1), 13–23. 10.1023/A:1015764925536 [DOI] [Google Scholar]
- Carvell, C. , Meek, W. R. , Pywell, R. F. , Goulson, D. , & Nowakowski, M. (2007). Comparing the efficacy of agri‐environment schemes to enhance bumble bee abundance and diversity on arable field margins. Journal of Applied Ecology, 44(1), 29–40. 10.1111/j.1365-2664.2006.01249.x [DOI] [Google Scholar]
- Casanelles‐Abella, J. , Müller, S. , Keller, A. , Aleixo, C. , Alós Orti, M. , Chiron, F. , Deguines, N. , Hallikma, T. , Laanisto, L. , Pinho, P. , Samson, R. , Tryjanowski, P. , Van Mensel, A. , Pellissier, L. , & Moretti, M. (2022). How wild bees find a way in European cities: Pollen metabarcoding unravels multiple feeding strategies and their effects on distribution patterns in four wild bee species. Journal of Applied Ecology, 59(2), 457–470. 10.1111/1365-2664.14063 [DOI] [Google Scholar]
- Centrella, M. , Russo, L. , Ramírez, N. M. , Eitzer, B. , van Dyke, M. , Danforth, B. , & Poveda, K. (2020). Diet diversity and pesticide risk mediate the negative effects of land use change on solitary bee offspring production. Journal of Applied Ecology, 57(6), 1031–1042. 10.1111/1365-2664.13600 [DOI] [Google Scholar]
- Chen, G. , Li, X. , Liu, X. , Chen, Y. , Liang, X. , Leng, J. , Xu, X. , Liao, W. , Qiu, Y. , Wu, Q. , & Huang, K. (2020). Global projections of future urban land expansion under shared socioeconomic pathways. Nature Communications, 11(1), 537. 10.1038/s41467-020-14386-x [DOI] [PMC free article] [PubMed] [Google Scholar]
- Chen, S. , Yao, H. , Han, J. , Liu, C. , Song, J. , Shi, L. , Zhu, Y. , Ma, X. , Gao, T. , Pang, X. , Luo, K. , Li, Y. , Li, X. , Jia, X. , Lin, Y. , & Leon, C. (2010). Validation of the ITS2 region as a novel DNA barcode for identifying medicinal plant species. PLoS One, 5(1), e8613. 10.1371/journal.pone.0008613 [DOI] [PMC free article] [PubMed] [Google Scholar]
- Couvillon, M. J. , Riddell Pearce, F. C. , Accleton, C. , Fensome, K. A. , Quah, S. K. L. , Taylor, E. L. , & Ratnieks, F. L. W. (2015). Honey bee foraging distance depends on month and forage type. Apidologie, 46(1), 61–70. 10.1007/s13592-014-0302-5 [DOI] [Google Scholar]
- Daniels, B. , Jedamski, J. , Ottermanns, R. , & Ross‐Nickoll, M. (2020). A “plan bee” for cities: Pollinator diversity and plant‐pollinator interactions in urban green spaces. PLoS One, 15(7), e0235492. 10.1371/journal.pone.0235492 [DOI] [PMC free article] [PubMed] [Google Scholar]
- de Vere, N. , Jones, L. E. , Gilmore, T. , Moscrop, J. , Lowe, A. , Smith, D. , Hegarty, M. J. , Creer, S. , & Ford, C. R. (2017). Using DNA metabarcoding to investigate honey bee foraging reveals limited flower use despite high floral availability. Scientific Reports, 7(1), 42838. 10.1038/srep42838 [DOI] [PMC free article] [PubMed] [Google Scholar]
- DeGrandi‐Hoffman, G. , Chen, Y. , Rivera, R. , Carroll, M. , Chambers, M. , Hidalgo, G. , & de Jong, E. W. (2016). Honey bee colonies provided with natural forage have lower pathogen loads and higher overwinter survival than those fed protein supplements. Apidologie, 47(2), 186–196. 10.1007/s13592-015-0386-6 [DOI] [Google Scholar]
- Deiner, K. , Bik, H. M. , Mächler, E. , Seymour, M. , Lacoursière‐Roussel, A. , Altermatt, F. , Creer, S. , Bista, I. , Lodge, D. M. , de Vere, N. , Pfrender, M. E. , & Bernatchez, L. (2017). Environmental DNA metabarcoding: Transforming how we survey animal and plant communities. Molecular Ecology, 26(21), 5872–5895. 10.1111/mec.14350 [DOI] [PubMed] [Google Scholar]
- Dimou, M. , Thrasyvoulou, A. , & Tsirakoglou, V. (2006). Efficient use of pollen traps to determine the pollen flora used by honey bees. Journal of Apicultural Research, 45, 42–46. 10.3896/IBRA.1.45.1.10 [DOI] [Google Scholar]
- Dixon, P. T. , Otsuka, D. N. , & Abe, P. H. (2010). Cities in recession: Urban regeneration in Manchester (England) and Osaka (Japan) and the case of ‘hardcore’ brownfield sites (p. 151). http://oisd.brookes.ac.uk/news/resources/REPORTDRAFTv8.pdf
- Dolezal, A. G. , St. Clair, A. L. , Zhang, G. , Toth, A. L. , & O'Neal, M. E. (2019). Native habitat mitigates feast–famine conditions faced by honey bees in an agricultural landscape. Proceedings of the National Academy of Sciences of the United States of America, 116(50), 25147–25155. 10.1073/pnas.1912801116 [DOI] [PMC free article] [PubMed] [Google Scholar]
- Donkersley, P. , Rhodes, G. , Pickup, R. W. , Jones, K. C. , Power, E. F. , Wright, G. A. , & Wilson, K. (2017). Nutritional composition of honey bee food stores vary with floral composition. Oecologia, 185(4), 749–761. 10.1007/s00442-017-3968-3 [DOI] [PMC free article] [PubMed] [Google Scholar]
- Dunning, L. T. , & Savolainen, V. (2010). Broad‐scale amplification of matK for DNA barcoding plants, a technical note. Botanical Journal of the Linnean Society, 164(1), 1–9. 10.1111/j.1095-8339.2010.01071.x [DOI] [Google Scholar]
- Ficetola, G. F. , Taberlet, P. , & Coissac, E. (2016). How to limit false positives in environmental DNA and metabarcoding? Molecular Ecology Resources, 16(3), 604–607. 10.1111/1755-0998.12508 [DOI] [PubMed] [Google Scholar]
- Frankie, G. W. , Thorp, R. W. , Schindler, M. , Hernandez, J. , Ertter, B. , & Rizzardi, M. (2005). Ecological patterns of bees and their host ornamental flowers in two northern California cities. Journal of the Kansas Entomological Society, 78(3), 227–246. 10.2317/0407.08.1 [DOI] [Google Scholar]
- Gaertner, M. , Wilson, J. R. U. , Cadotte, M. W. , MacIvor, J. S. , Zenni, R. D. , & Richardson, D. M. (2017). Non‐native species in urban environments: Patterns, processes, impacts and challenges. Biological Invasions, 19(12), 3461–3469. 10.1007/s10530-017-1598-7 [DOI] [Google Scholar]
- Gallai, N. , Salles, J.‐M. , Settele, J. , & Vaissière, B. E. (2009). Economic valuation of the vulnerability of world agriculture confronted with pollinator decline. Ecological Economics, 68(3), 810–821. 10.1016/j.ecolecon.2008.06.014 [DOI] [Google Scholar]
- Gao, J. , & O'Neill, B. C. (2020). Mapping global urban land for the 21st century with data‐driven simulations and Shared Socioeconomic Pathways. Nature Communications, 11(1), 2302. 10.1038/s41467-020-15788-7 [DOI] [PMC free article] [PubMed] [Google Scholar]
- Garbuzov, M. , & Ratnieks, F. L. W. (2014). Quantifying variation among garden plants in attractiveness to bees and other flower‐visiting insects. Functional Ecology, 28(2), 364–374. 10.1111/1365-2435.12178 [DOI] [Google Scholar]
- Garbuzov, M. , Schürch, R. , & Ratnieks, F. L. W. (2015). Eating locally: Dance decoding demonstrates that urban honey bees in Brighton, UK, forage mainly in the surrounding urban area. Urban Ecosystem, 18(2), 411–418. 10.1007/s11252-014-0403-y [DOI] [Google Scholar]
- Gaston, K. J. , Warren, P. H. , Thompson, K. , & Smith, R. M. (2005). Urban domestic gardens (IV): The extent of the resource and its associated features. Biodiversity and Conservation, 14(14), 3327–3349. 10.1007/s10531-004-9513-9 [DOI] [Google Scholar]
- Giannini, T. C. , Garibaldi, L. A. , Acosta, A. L. , Silva, J. S. , Maia, K. P. , Saraiva, A. M. , Guimarães, P. R., Jr. , & Kleinert, A. M. P. (2015). Native and non‐native supergeneralist bee species have different effects on plant‐bee networks. PLoS One, 10(9), e0137198. 10.1371/journal.pone.0137198 [DOI] [PMC free article] [PubMed] [Google Scholar]
- Gill, R. J. , Ramos‐Rodriguez, O. , & Raine, N. E. (2012). Combined pesticide exposure severely affects individual‐ and colony‐level traits in bees. Nature, 491(7422), 105–108. 10.1038/nature11585 [DOI] [PMC free article] [PubMed] [Google Scholar]
- Goulson, D. , Nicholls, E. , Botías, C. , & Rotheray, E. L. (2015). Bee declines driven by combined stress from parasites, pesticides, and lack of flowers. Science, 347(6229), 1435. [DOI] [PubMed] [Google Scholar]
- Goulson, D. , & Sparrow, K. R. (2009). Evidence for competition between honeybees and bumblebees; Effects on bumblebee worker size. Journal of Insect Conservation, 13(2), 177–181. 10.1007/s10841-008-9140-y [DOI] [Google Scholar]
- Goulson, D. , Thompson, J. , & Croombs, A. (2018). Rapid rise in toxic load for bees revealed by analysis of pesticide use in Great Britain. PeerJ, 6, e5255. 10.7717/peerj.5255 [DOI] [PMC free article] [PubMed] [Google Scholar]
- Grimm, N. B. , Faeth, S. H. , Golubiewski, N. E. , Redman, C. L. , Wu, J. , Bai, X. , & Briggs, J. M. (2008). Global change and the ecology of cities. Science, 319(5864), 756–760. 10.1126/science.1150195 [DOI] [PubMed] [Google Scholar]
- Hall, D. M. , Camilo, G. R. , Tonietto, R. K. , Ollerton, J. , Ahrné, K. , Arduser, M. , Ascher, J. S. , Baldock, K. C. R. , Fowler, R. , Frankie, G. , Goulson, D. , Gunnarsson, B. , Hanley, M. E. , Jackson, J. I. , Langellotto, G. , Lowenstein, D. , Minor, E. S. , Philpott, S. M. , Potts, S. G. , … Threlfall, C. G. (2017). The city as a refuge for insect pollinators. Conservation Biology, 31(1), 24–29. 10.1111/cobi.12840 [DOI] [PubMed] [Google Scholar]
- Hawkins, J. , de Vere, N. , Griffith, A. , Ford, C. R. , Allainguillaume, J. , Hegarty, M. J. , Baillie, L. , & Adams‐Groom, B. (2015). Using DNA metabarcoding to identify the floral composition of honey: A new tool for investigating honey bee foraging preferences. PLoS One, 10(8), e0134735. 10.1371/journal.pone.0134735 [DOI] [PMC free article] [PubMed] [Google Scholar]
- Hebert, P. D. N. , Cywinska, A. , Ball, S. L. , & deWaard, J. R. (2003). Biological identifications through DNA barcodes. Proceedings of the Royal Society of London. Series B: Biological Sciences, 270(1512), 313–321. 10.1098/rspb.2002.2218 [DOI] [PMC free article] [PubMed] [Google Scholar]
- Hicks, D. M. , Ouvrard, P. , Baldock, K. C. R. , Baude, M. , Goddard, M. A. , Kunin, W. E. , Mitschunas, N. , Memmott, J. , Morse, H. , Nikolitsi, M. , Osgathorpe, L. M. , Potts, S. G. , Robertson, K. M. , Scott, A. V. , Sinclair, F. , Westbury, D. B. , & Stone, G. N. (2016). Food for pollinators: Quantifying the nectar and pollen resources of urban flower meadows. PLoS One, 11(6), e0158117. 10.1371/journal.pone.0158117 [DOI] [PMC free article] [PubMed] [Google Scholar]
- Hollingsworth, P. M. , Forrest, L. L. , Spouge, J. L. , Hajibabaei, M. , Ratnasingham, S. , van der Bank, M. , Chase, M. W. , Cowan, R. S. , Erickson, D. L. , Fazekas, A. J. , Graham, S. W. , James, K. E. , Kim, K.‐J. , Kress, W. J. , Schneider, H. , van AlphenStahl, J. , Barrett, S. C. H. , van den Berg, C. , Bogarin, D. , … Little, D. P. (2009). A DNA barcode for land plants. Proceedings of the National Academy of Sciences of the United States of America, 106(31), 12794–12797. [DOI] [PMC free article] [PubMed] [Google Scholar]
- Hollingsworth, P. M. , Graham, S. W. , & Little, D. P. (2011). Choosing and using a plant DNA barcode. PLoS One, 6(5), e19254. 10.1371/journal.pone.0019254 [DOI] [PMC free article] [PubMed] [Google Scholar]
- Hülsmann, M. , von Wehrden, H. , Klein, A.‐M. , & Leonhardt, S. D. (2015). Plant diversity and composition compensate for negative effects of urbanization on foraging bumble bees. Apidologie, 46(6), 760–770. 10.1007/s13592-015-0366-x [DOI] [Google Scholar]
- Hung, K.‐L. J. , Kingston, J. M. , Albrecht, M. , Holway, D. A. , & Kohn, J. R. (2018). The worldwide importance of honey bees as pollinators in natural habitats. Proceedings of the Royal Society B: Biological Sciences, 285(1870), 20172140. 10.1098/rspb.2017.2140 [DOI] [PMC free article] [PubMed] [Google Scholar]
- Jachuła, J. , Denisow, B. , Wrzesień, M. , & Ziółkowska, E. (2022). The need for weeds: Man‐made, non‐cropped habitats complement crops and natural habitats in providing honey bees and bumble bees with pollen resources. Science of the Total Environment, 840, 156551. 10.1016/j.scitotenv.2022.156551 [DOI] [PubMed] [Google Scholar]
- Jones, L. , Brennan, G. L. , Lowe, A. , Creer, S. , Ford, C. R. , & de Vere, N. (2021). Shifts in honeybee foraging reveal historical changes in floral resources. Communications Biology, 4(1), 1–10. 10.1038/s42003-020-01562-4 [DOI] [PMC free article] [PubMed] [Google Scholar]
- Jung, M. (2013). Leco S‐A QGIS plugin for automated landscape ecology analysis. PeerJ, 1, e116v2. 10.7287/peerj.preprints.116v2 23904994 [DOI] [Google Scholar]
- Kallimanis, A. S. , Mazaris, A. D. , Tzanopoulos, J. , Halley, J. M. , Pantis, J. D. , & Sgardelis, S. P. (2008). How does habitat diversity affect the species–area relationship? Global Ecology and Biogeography, 17(4), 532–538. 10.1111/j.1466-8238.2008.00393.x [DOI] [Google Scholar]
- Klein, A.‐M. , Vaissière, B. E. , Cane, J. H. , Steffan‐Dewenter, I. , Cunningham, S. A. , Kremen, C. , & Tscharntke, T. (2007). Importance of pollinators in changing landscapes for world crops. Proceedings of the Royal Society B: Biological Sciences, 274(1608), 303–313. 10.1098/rspb.2006.3721 [DOI] [PMC free article] [PubMed] [Google Scholar]
- Knapp, S. , Dinsmore, L. , Fissore, C. , Hobbie, S. E. , Jakobsdottir, I. , Kattge, J. , King, J. Y. , Klotz, S. , McFadden, J. P. , & Cavender‐Bares, J. (2012). Phylogenetic and functional characteristics of household yard floras and their changes along an urbanization gradient. Ecology, 93(sp8), S83–S98. 10.1890/11-0392.1 [DOI] [Google Scholar]
- Kowarik, I. (2011). Novel urban ecosystems, biodiversity, and conservation. Environmental Pollution, 159(8), 1974–1983. 10.1016/j.envpol.2011.02.022 [DOI] [PubMed] [Google Scholar]
- Kress, W. J. , Erickson, D. L. , Jones, F. A. , Swenson, N. G. , Perez, R. , Sanjur, O. , & Bermingham, E. (2009). Plant DNA barcodes and a community phylogeny of a tropical forest dynamics plot in Panama. Proceedings of the National Academy of Sciences of the United States of America, 106(44), 18621–18626. [DOI] [PMC free article] [PubMed] [Google Scholar]
- Kress, W. J. , Wurdack, K. J. , Zimmer, E. A. , Weigt, L. A. , & Janzen, D. H. (2005). Use of DNA barcodes to identify flowering plants. Proceedings of the National Academy of Sciences of the United States of America, 102(23), 8369–8374. [DOI] [PMC free article] [PubMed] [Google Scholar]
- Lentola, A. , David, A. , Abdul‐Sada, A. , Tapparo, A. , Goulson, D. , & Hill, E. M. (2017). Ornamental plants on sale to the public are a significant source of pesticide residues with implications for the health of pollinating insects. Environmental Pollution, 228, 297–304. 10.1016/j.envpol.2017.03.084 [DOI] [PubMed] [Google Scholar]
- Levé, M. , Baudry, E. , & Bessa‐Gomes, C. (2019). Domestic gardens as favorable pollinator habitats in impervious landscapes. Science of the Total Environment, 647, 420–430. 10.1016/j.scitotenv.2018.07.310 [DOI] [PubMed] [Google Scholar]
- Lorenz, S. , & Stark, K. (2015). Saving the honeybees in Berlin? A case study of the urban beekeeping boom. Environmental Sociology, 1(2), 116–126. 10.1080/23251042.2015.1008383 [DOI] [Google Scholar]
- Louveaux, J. , Maurizio, A. , & Vorwohl, G. (1978). Methods of melissopalynology. Bee World, 59(4), 139–157. 10.1080/0005772X.1978.11097714 [DOI] [Google Scholar]
- Lowenstein, D. M. , Matteson, K. C. , & Minor, E. S. (2019). Evaluating the dependence of urban pollinators on ornamental, non‐native, and ‘weedy’ floral resources. Urban Ecosystem, 22(2), 293–302. 10.1007/s11252-018-0817-z [DOI] [Google Scholar]
- Lowenstein, D. M. , & Minor, E. S. (2016). Diversity in flowering plants and their characteristics: Integrating humans as a driver of urban floral resources. Urban Ecosystem, 19(4), 1735–1748. 10.1007/s11252-016-0563-z [DOI] [Google Scholar]
- Lucek, K. , Galli, A. , Gurten, S. , Hohmann, N. , Maccagni, A. , Patsiou, T. , & Willi, Y. (2019). Metabarcoding of honey to assess differences in plant‐pollinator interactions between urban and non‐urban sites. Apidologie, 50(3), 317–329. 10.1007/s13592-019-00646-3 [DOI] [Google Scholar]
- Martin, M. (2011). Cutadapt removes adapter sequences from high‐throughput sequencing reads. EMBnet.Journal, 17(1), 10–12. 10.14806/ej.17.1.200 [DOI] [Google Scholar]
- Matteson, K. C. , & Langellotto, G. A. (2009). Bumble bee abundance in New York city community gardens: Implications for urban agriculture. Cities and the Environment, 2(1), 1–12. 10.15365/cate.2152009 [DOI] [Google Scholar]
- McKinney, M. L. (2002). Urbanization, biodiversity, and conservation: The impacts of urbanization on native species are poorly studied, but educating a highly urbanized human population about these impacts can greatly improve species conservation in all ecosystems. Bioscience, 52(10), 883–890. 10.1641/0006-3568(2002)052[0883:UBAC]2.0.CO;2 [DOI] [Google Scholar]
- Newmaster, S. G. , Fazekas, A. J. , & Ragupathy, S. (2006). DNA barcoding in land plants: Evaluation of rbcL in a multigene tiered approach. Canadian Journal of Botany, 84(3), 335–341. 10.1139/b06-047 [DOI] [Google Scholar]
- Nottebrock, H. , Schmid, B. , Mayer, K. , Devaux, C. , Esler, K. J. , Böhning‐Gaese, K. , Schleuning, M. , Pagel, J. , & Schurr, F. M. (2017). Sugar landscapes and pollinator‐mediated interactions in plant communities. Ecography, 40(9), 1129–1138. 10.1111/ecog.02441 [DOI] [Google Scholar]
- Oksanen, J. , Guillaume, B. F. , Friendly, M. , Kindt, R. , Legendre, P. , McGlinn, D. , Minchin, P. R. , O'Hara, R. B. , Simpson, G. L. , Solymos, P. , Stevens, M. H. H. , Szoecs, E. , & Wagner, H. (2020). vegan: Community ecology package (2.5‐6) . https://cran.r‐project.org/package=vegan
- Orford, K. A. , Murray, P. J. , Vaughan, I. P. , & Memmott, J. (2016). Modest enhancements to conventional grassland diversity improve the provision of pollination services. Journal of Applied Ecology, 53(3), 906–915. 10.1111/1365-2664.12608 [DOI] [PMC free article] [PubMed] [Google Scholar]
- Paoli, P. P. , Donley, D. , Stabler, D. , Saseendranath, A. , Nicolson, S. W. , Simpson, S. J. , & Wright, G. A. (2014). Nutritional balance of essential amino acids and carbohydrates of the adult worker honeybee depends on age. Amino Acids, 46(6), 1449–1458. 10.1007/s00726-014-1706-2 [DOI] [PMC free article] [PubMed] [Google Scholar]
- Pirk, C. W. W. , Crewe, R. M. , & Moritz, R. F. A. (2017). Risks and benefits of the biological interface between managed and wild bee pollinators. Functional Ecology, 31(1), 47–55. 10.1111/1365-2435.12768 [DOI] [Google Scholar]
- Plants For A Future . (2018). Plants For A Future Database . https://pfaf.org/user/Default.aspx
- Porter, T. M. , & Hajibabaei, M. (2018). Automated high throughput animal CO1 metabarcode classification. Scientific Reports, 8(1), 4226. 10.1038/s41598-018-22505-4 [DOI] [PMC free article] [PubMed] [Google Scholar]
- Potts, S. G. , Biesmeijer, J. C. , Kremen, C. , Neumann, P. , Schweiger, O. , & Kunin, W. E. (2010). Global pollinator declines: Trends, impacts and drivers. Trends in Ecology & Evolution, 25(6), 345–353. 10.1016/j.tree.2010.01.007 [DOI] [PubMed] [Google Scholar]
- QGIS Association . (2020). QGIS Geographic Information System (2.14.0) . http://www.qgis.com
- R Core Team . (2021). R: A language and environment for statistical computing. R Foundation for Statistical Computing. https://www.R‐project.org/ [Google Scholar]
- Ratnasingham, S. , & Herbert, P. D. N. (2007). bold: The barcode of life data system (http://www.barcodinglife.org). Molecular Ecology Notes, 7(3), 355–364. 10.1111/j.1471-8286.2007.01678.x [DOI] [PMC free article] [PubMed] [Google Scholar]
- Requier, F. , Antúnez, K. , Morales, C. L. , Sánchez, P. A. , Castilhos, D. , Garrido, P. M. , Giacobino, A. , Reynaldi, F. J. , Londoño, J. M. R. , Santos, E. , & Garibaldi, L. A. (2018). Trends in beekeeping and honey bee colony losses in Latin America. Journal of Apicultural Research, 57(5), 657–662. 10.1080/00218839.2018.1494919 [DOI] [Google Scholar]
- Requier, F. , Odoux, J.‐F. , Tamic, T. , Moreau, N. , Henry, M. , Decourtye, A. , & Bretagnolle, V. (2015). Honey bee diet in intensive farmland habitats reveals an unexpectedly high flower richness and a major role of weeds. Ecological Applications, 25(4), 881–890. 10.1890/14-1011.1 [DOI] [PubMed] [Google Scholar]
- Revelle, W. R. (2017). psych: Procedures for personality and psychological research . https://www.scholars.northwestern.edu/en/publications/psych‐procedures‐for‐personality‐and‐psychological‐research
- Richardson, R. T. , Eaton, T. D. , Lin, C.‐H. , Cherry, G. , Johnson, R. M. , & Sponsler, D. B. (2021). Application of plant metabarcoding to identify diverse honeybee pollen forage along an urban–agricultural gradient. Molecular Ecology, 30(1), 310–323. 10.1111/mec.15704 [DOI] [PubMed] [Google Scholar]
- Rowland, C. S. , Morton, R. D. , Carrasco, L. , McShane, G. , O'Neil, A. W. , & Wood, C. M. (2017). Land cover map 2015 (vector, GB) . NERC Environmental Information Data Centre (Dataset). 10.5285/6c6c9203-7333-4d96-88ab-78925e7a4e73 [DOI]
- Royal Horticultural Society . (2018). Royal Horticultural Society Horticultural Database . https://www.rhs.org.uk/plants/search‐form
- RStudio Team . (2021). RStudio: Integrated development for R. PBC. http://www.rstudio.com [Google Scholar]
- Ruedenauer, F. A. , Sydow, D. , Spaethe, J. , & Leonhardt, S. D. (2020). Young bumblebees may rely on both direct pollen cues and early experience when foraging. Proceedings of the Royal Society B: Biological Sciences, 287(1933), 20201615. 10.1098/rspb.2020.1615 [DOI] [PMC free article] [PubMed] [Google Scholar]
- Salisbury, A. , Armitage, J. , Bostock, H. , Perry, J. , Tatchell, M. , & Thompson, K. (2015). Enhancing gardens as habitats for flower‐visiting aerial insects (pollinators): Should we plant native or exotic species? Journal of Applied Ecology, 52(5), 1156–1164. [Google Scholar]
- Samuelson, A. E. , Gill, R. J. , Brown, M. J. F. , & Leadbeater, E. (2018). Lower bumblebee colony reproductive success in agricultural compared with urban environments. Proceedings of the Royal Society B: Biological Sciences, 285(1881), 20180807. 10.1098/rspb.2018.0807 [DOI] [PMC free article] [PubMed] [Google Scholar]
- Sánchez‐Bayo, F. , & Wyckhuys, K. A. G. (2019). Worldwide decline of the entomofauna: A review of its drivers. Biological Conservation, 232, 8–27. 10.1016/j.biocon.2019.01.020 [DOI] [Google Scholar]
- Seeley, T. D. (1986). Social foraging by honeybees: How colonies allocate foragers among patches of flowers. Behavioral Ecology and Sociobiology, 19(5), 343–354. [Google Scholar]
- Seto, K. C. , Guneralp, B. , & Hutyra, L. R. (2012). Global forecasts of urban expansion to 2030 and direct impacts on biodiversity and carbon pools. Proceedings of the National Academy of Sciences of the United States of America, 109(40), 16083–16088. 10.1073/pnas.1211658109 [DOI] [PMC free article] [PubMed] [Google Scholar]
- Sickel, W. , Ankenbrand, M. J. , Grimmer, G. , Holzschuh, A. , Härtel, S. , Lanzen, J. , Steffan‐Dewenter, I. , & Keller, A. (2015). Increased efficiency in identifying mixed pollen samples by meta‐barcoding with a dual‐indexing approach. BMC Ecology, 15(1), 20. 10.1186/s12898-015-0051-y [DOI] [PMC free article] [PubMed] [Google Scholar]
- Smith, K. M. , Loh, E. H. , Rostal, M. K. , Zambrana‐Torrelio, C. M. , Mendiola, L. , & Daszak, P. (2013). Pathogens, pests, and economics: Drivers of honey bee colony declines and losses. EcoHealth, 10(4), 434–445. 10.1007/s10393-013-0870-2 [DOI] [PubMed] [Google Scholar]
- Somme, L. , Moquet, L. , Quinet, M. , Vanderplanck, M. , Michez, D. , Lognay, G. , & Jacquemart, A.‐L. (2016). Food in a row: Urban trees offer valuable floral resources to pollinating insects. Urban Ecosystem, 19(3), 1149–1161. 10.1007/s11252-016-0555-z [DOI] [Google Scholar]
- Sponsler, D. B. , & Johnson, R. M. (2015). Honey bee success predicted by landscape composition in Ohio, USA. PeerJ, 3, e838. 10.7717/peerj.838 [DOI] [PMC free article] [PubMed] [Google Scholar]
- Stace, C. (2010). New Flora of the British Isles (3rd ed.). Cambridge University Press. [Google Scholar]
- Statnikov, A. , Henaff, M. , Narendra, V. , Konganti, K. , Li, Z. , Yang, L. , Pei, Z. , Blaser, M. J. , Aliferis, C. F. , & Alekseyenko, A. V. (2013). A comprehensive evaluation of multicategory classification methods for microbiomic data. Microbiome, 1(1), 11. 10.1186/2049-2618-1-11 [DOI] [PMC free article] [PubMed] [Google Scholar]
- Steffan‐Dewenter, I. , & Kuhn, A. (2003). Honeybee foraging in differentially structured landscapes. Proceedings of the Biological Sciences, 270(1515), 569–575. 10.1098/rspb.2002.2292 [DOI] [PMC free article] [PubMed] [Google Scholar]
- Synge, A. D. (1947). Pollen collection by honeybees (Apis mellifera). Journal of Animal Ecology, 16(2), 122–138. 10.2307/1492 [DOI] [Google Scholar]
- Taberlet, P. , Bonin, A. , Zinger, L. , & Coissac, E. (2018). Environmental DNA: For biodiversity research and monitoring. Oxford University Press. [Google Scholar]
- Theodorou, P. , Radzevičiūtė, R. , Lentendu, G. , Kahnt, B. , Husemann, M. , Bleidorn, C. , Settele, J. , Schweiger, O. , Grosse, I. , Wubet, T. , Murray, T. E. , & Paxton, R. J. (2020). Urban areas as hotspots for bees and pollination but not a panacea for all insects. Nature Communications, 11(1), 576. 10.1038/s41467-020-14496-6 [DOI] [PMC free article] [PubMed] [Google Scholar]
- Topitzhofer, E. , Lucas, H. , Chakrabarti, P. , Breece, C. , Bryant, V. , & Sagili, R. R. (2019). Assessment of pollen diversity available to honey bees (Hymenoptera: Apidae) in major cropping systems during pollination in the western United States. Journal of Economic Entomology, 112(5), 2040–2048. 10.1093/jee/toz168 [DOI] [PMC free article] [PubMed] [Google Scholar]
- Turo, K. J. , & Gardiner, M. M. (2019). From potential to practical: Conserving bees in urban public green spaces. Frontiers in Ecology and the Environment, 17(3), 167–175. 10.1002/fee.2015 [DOI] [Google Scholar]
- Valentini, A. , Miquel, C. , & Taberlet, P. (2010). DNA Barcoding for honey biodiversity. Diversity, 2(4), 610–617. 10.3390/d2040610 [DOI] [Google Scholar]
- Vanbergen, A. J. , & The Insect Pollinators Initiative . (2013). Threats to an ecosystem service: Pressures on pollinators. Frontiers in Ecology and the Environment, 11(5), 251–259. 10.1890/120126 [DOI] [Google Scholar]
- Vaudo, A. D. , Tooker, J. F. , Grozinger, C. M. , & Patch, H. M. (2015). Bee nutrition and floral resource restoration. Current Opinion in Insect Science, 10, 133–141. 10.1016/j.cois.2015.05.008 [DOI] [PubMed] [Google Scholar]
- Wagner, D. L. (2020). Insect declines in the Anthropocene. Annual Review of Entomology, 65(1), 457–480. 10.1146/annurev-ento-011019-025151 [DOI] [PubMed] [Google Scholar]
- Weaver, N. (1965). Foraging behavior of honeybees on white clover. Insectes Sociaux, 12(3), 231–240. 10.1007/BF02223893 [DOI] [Google Scholar]
- Wenzel, A. , Grass, I. , Belavadi, V. V. , & Tscharntke, T. (2020). How urbanization is driving pollinator diversity and pollination – A systematic review. Biological Conservation, 241, 108321. 10.1016/j.biocon.2019.108321 [DOI] [Google Scholar]
- Wickham, H. (2016). ggplot2: Elegant graphics for data analysis. Springer‐Verlag. https://ggplot2.tidyverse.org [Google Scholar]
- Wood, T. J. , Holland, J. M. , Hughes, W. O. H. , & Goulson, D. (2015). Targeted agri‐environment schemes significantly improve the population size of common farmland bumblebee species. Molecular Ecology, 24(8), 1668–1680. 10.1111/mec.13144 [DOI] [PubMed] [Google Scholar]
- Zinger, L. , Bonin, A. , Alsos, I. G. , Bálint, M. , Bik, H. , Boyer, F. , Chariton, A. A. , Creer, S. , Coissac, E. , Deagle, B. E. , Barba, M. D. , Dickie, I. A. , Dumbrell, A. J. , Ficetola, G. F. , Fierer, N. , Fumagalli, L. , Gilbert, M. T. P. , Jarman, S. , Jumpponen, A. , … Taberlet, P. (2019). DNA metabarcoding—Need for robust experimental designs to draw sound ecological conclusions. Molecular Ecology, 28(8), 1857–1862. 10.1111/mec.15060 [DOI] [PubMed] [Google Scholar]
Associated Data
This section collects any data citations, data availability statements, or supplementary materials included in this article.
Data Availability Statement
Next‐generation sequencing data are available for public download from the N.C.B.I sequence read archive (SRA) database under identifiers SRR16143791 to SRR16143818. The associated R analysis script, intermediary data files, plant metadata, and QGIS land use data are all available to download from GitHub (https://github.com/graemefox/Mancester_honey) and from Dryad (DOI: https://doi.org/10.5061/dryad.5hqbzkh91).